Embed Size (px)
Citation preview
NOTICE OF DISCLOSURE
A recent Peer Review of the NAVAUDSVC determined that from 13 March 2013 through 4 December 2017, the NAVAUDSVC experienced a potential threat to audit independence due to the Department of Navy organizational structure in effect during this timeframe. Specifically, instead of reporting to the Secretary of the Navy or Under Secretary of the Navy, the Auditor General of the Navy reported to lower level officials who had not been charged with governance over the entire Department of the Navy to include certain non-delegable statutory functions. This alignment did not comply with generally accepted government auditing standards (GAGAS) and the Department of the Navy policy regarding independence. On 4 December 2017, the Auditor General of the Navy once again reported to the Under Secretary of the Navy in accordance with GAGAS. The Navy policy on independence was revised to clarify that the Auditor General of the Navy reports directly to the Under Secretary of the Navy (or to the Secretary of the Navy whenever the position of the Under Secretary of the Navy is vacant.)
With the exception of the potential structural threat outlined above, we believe that the projects performed from 13 March 2013 through 4 December 2017, complied with all other generally accepted government auditing standards.
FOR OFFICIAL USE ONLY
FOR OFFICIAL USE ONLY
Audit Report
Reliability of Internet Navy Facilities Assets Data Store Data Elements Related to the Navy’s Facility Sustainment Requirement
This report contains information exempt from release under the Freedom of Information Act. Exemption (b)(6) applies.
Do not release outside the Department of the Navy, post on non-NAVAUDSVC Web sites, or in Navy Taskers without prior approval of the Auditor General of the Navy.
N2015-0001
23 October 2014
Naval Audit Service
Obtaining
Additional Copies
Providing Suggestions
for Future Audits
To obtain additional copies of this report, please use the
following contact information:
To suggest ideas for or to request future audits,
please use the following contact information:
Phone:
Fax:
E-mail:
Mail:
(202) 433-5757
(202) 433-5921
Naval Audit Service
Attn: FOIA
1006 Beatty Place SE
Washington Navy Yard DC 20374-5005
Phone:
Fax:
E-mail:
Mail:
(202) 433-5840 (DSN 288)
(202) 433-5921
Naval Audit Service
Attn: Audit Requests
1006 Beatty Place SE
Washington Navy Yard DC 20374-5005
Naval Audit Service Web Site
To find out more about the Naval Audit Service, including general background, and guidance on what
clients can expect when they become involved in research or an audit, visit our Web site at:
http://www.secnav.navy.mil/navaudsvc
FOR OFFICIAL USE ONLY
FOR OFFICIAL USE ONLY
7510
2013-033
23 Oct 14
MEMORANDUM FOR COMMANDER, NAVY INSTALLATIONS COMMAND
Subj: RELIABILITY OF INTERNET NAVY FACILITIES ASSETS DATA
STORE DATA ELEMENTS RELATED TO THE NAVY’S FACILITY
SUSTAINMENT REQUIREMENT (AUDIT REPORT N2015-0001)
Ref: (a) NAVAUDSVC memo 2013-033, dated 9 Apr 13
(b) SECNAV Instruction 7510.7F, “Department of the Navy Internal Audit”
1. The report provides results of the subject audit announced in reference (a).
Section A of this report provides our audit results.
2. There are no recommendations in this report. Therefore, no action is required.
3. Any requests for this report under the Freedom of Information Act must be approved
by the Auditor General of the Navy as required by reference (b). This audit report is also
subject to followup in accordance with reference (b).
4. If you wish to share any correspondence with the agency or have any questions,
please contact the Assistant Auditor General for Energy, Installations and Environment
Audits, XXXXXXXX by e-mail at XXXXXXXXXXXXXXX with a copy to the
Director, Policy and Oversight, XXXXXXXXXXX by e-mail at XXXXXXXXXXXXX.
5. In order to protect privacy and other sensitive information included in this report, we
request that you not release this report outside the Department of the Navy, post on non-
Naval Audit Service Web sites, or in Navy Taskers without the prior approval of the
Auditor General of the Navy.
6. We appreciate the cooperation and courtesies extended to our auditors.
XXXXXXXXXXXXXXX
Assistant Auditor General
Energy, Installations and Environment
Audits
Copy to [next page]
DEPARTMENT OF THE NAVY NAVAL AUDIT SERVICE 1006 BEATTY PLACE SE
WASHINGTON NAVY YARD, DC 20374-5005
FOIA (b)(6)
FOIA (b)(6)
FOR OFFICIAL USE ONLY
FOR OFFICIAL USE ONLY
Copy to:
UNSECNAV
DCMO
OGC
ASSTSECNAV FMC
ASSTSECNAV FMC (FMO)
ASSTSECNAV EIE
ASSTSECNAV MRA
ASSTSECNAV RDA
CNO (VCNO, DNS-33, N40, N41)
CMC (DMCS, ACMC)
DON CIO
NAVINSGEN (NAVIG-14)
AFAA/DO
i
Table of Contents
SECTION A: AUDIT RESULTS ...................................................................................... 1
Accuracy of Data Elements Related to the Navy’s Sustainment Requirement ....................... 1 Synopsis ....................................................................................................................................... 1
Reason for Audit .......................................................................................................................... 2 Communication with Management ............................................................................................. 2 Federal Managers’ Financial Integrity Act .................................................................................. 2 Discussion of Details ................................................................................................................... 2
Facilities Sustainment Model ................................................................................................... 3 iNFADS Data Elements Related to the Sustainment Formula ................................................. 3
Overall Impact to the Sustainment Requirement ..................................................................... 9 Fund-Code Allocation ............................................................................................................ 10 Users Did Not Exist................................................................................................................ 11
EXHIBIT A: BACKGROUND ........................................................................................ 12
EXHIBIT B: SCOPE AND METHODOLOGY ................................................................ 14
EXHIBIT C: STATISTICAL SAMPLING METHODOLOGY .......................................... 18
EXHIBIT D: PERTINENT GUIDANCE .......................................................................... 24
EXHIBIT E: ACTIVITIES VISITED/CONTACTED ........................................................ 25
1
Section A:
Audit Results
Accuracy of Data Elements Related to the Navy’s Sustainment Requirement
Synopsis
According to Department of Defense Instruction 4165.14, military Services are to
maintain accurate and complete real property inventory (RPI) data. Based on the Naval
Audit Service review of 4471 property records during the Navy’s Class 2 RPI audits,
2 we
determined that some data for the internet Navy Facilities Assets Data Store (iNFADS)
data elements related to the Navy’s sustainment requirement3 were inaccurate.
Discrepancies existed within the database because:
a) Sufficient procedures and oversight were not in place to ensure pre-established
guidance was properly disseminated and adhered to in a timely manner;
b) Further clarification of reporting requirements and business processes for
recording data in iNFADS was needed; and
c) Sufficient communication did not exist between personnel who directly and/or
indirectly process real property data.
As a result of the discrepancies identified within the data elements, we statistically
project that over-statements of $143 million and under-statements of $70.8 million would
exist within the Navy’s sustainment requirement.4 A statistical projection could not be
derived to show the net overall impact to the sustainment requirement due to the
ambiguity within the data (the range of positive and negative deviations).5
1 The original statistical sample included 450 records; however, 3 records in the Atlantic region could not be reviewed
because the site was evacuated due to fire. Therefore, our results are based on a review of 447 total records. 2 N2014-0027, “Navy’s Real Property Inventory-Naval Facilities Engineering Command Atlantic,” dated 9 June 2014;
N2014-0019, “Navy’s Real Property Inventory-Naval Facilities Engineering Command Hawaii,” dated 22 April 2014; and N2014-0015, “Navy’s Real Property Inventory-Naval Facilities Engineering Command Marianas,” dated 2 April 2014. 3 The sustainment requirement is the theoretical annual funding required for the sustainment of Department of
Defense real property. 4 Projections are made to the restricted universe of Naval Facilities Engineering Command regions selected for audit
(Atlantic, Hawaii, and Marianas). 5 See statistical analysis in Exhibit C.
SECTION A: AUDIT RESULTS ACCURACY OF DATA ELEMENTS RELATED TO NAVY’S SUSTAINMENT REQUIREMENT
2
Reason for Audit
The objective was to verify the accuracy of the Internet Navy Facilities Assets Data Store
(iNFADS) data elements used to determine the Navy’s facility sustainment requirement.
We conducted this audit to identify the impact to the Navy’s facility sustainment
requirement based on the iNFADS data reliability results as described in the Naval Audit
Service audits of Navy Class 2 real property inventory.
Communication with Management
Throughout the audit, we kept management and stakeholders informed of the information
noted in this report. Specifically, we communicated our audit results to Commander,
Navy Installations Command on 15 November 2013 and 4 April 2014. We also provided
a briefing to Naval Facilities Engineering Command Headquarters on 21 May 2014.
Federal Managers’ Financial Integrity Act
The Federal Managers’ Financial Integrity Act (FMFIA) of 1982, as codified in Title 31,
United States Code, requires each Federal agency head to annually certify the
effectiveness of the agency’s internal and accounting system controls. The audit work
performed for the published real property inventory audits revealed issues related to
internal control over real property inventory reporting. In our opinion, the weaknesses
noted in those reports may warrant reporting in the Auditor General’s annual FMFIA
memorandum identifying management control weaknesses to the Secretary of the Navy.
Accordingly, information cited within this report may also be reported.
Discussion of Details
iNFADS is the official system used to store Navy’s RPI data. One of the primary uses of
this RPI information is to drive the Navy’s sustainment requirement. Based on the results
of audit work performed during the RPI audits, we determined that some of the iNFADS
data elements related to the sustainment requirement were inaccurate. As a result, we
performed additional analyses to determine the impact to the Navy’s sustainment
requirement based on the statistical samples of the individual RPI audits. This report
identifies the overall dollar impact to the sustainment requirement, as well as the degree
to which each data element contributes to the impact. The RPI audit reports included
recommendations to address the causes of the data element inaccuracies. Those
recommendations will indirectly address the impacts noted to the sustainment
requirement calculations. As a result, this report will not include additional
recommendations.
SECTION A: AUDIT RESULTS ACCURACY OF DATA ELEMENTS RELATED TO NAVY’S SUSTAINMENT REQUIREMENT
3
Facilities Sustainment Model
The Office of the Secretary of Defense (OSD) uses the Facilities Sustainment Model
(FSM) to determine the sustainment requirement for the military Services. OSD provides
a Business Rules Synchronization Matrix, which demonstrates how to process the RPI
data to ultimately calculate the sustainment requirement generated by an asset. The
matrix includes steps to remove facilities from the RPI data that are non-sustainable (and
thus, would not generate a sustainment requirement), as well as steps to reduce the
sustainment requirement for facilities with certain operational status codes.6 According
to the Facilities Sustainment Model User’s Manual, the basic sustainment requirement
formula that is applied to each facility is as follows:
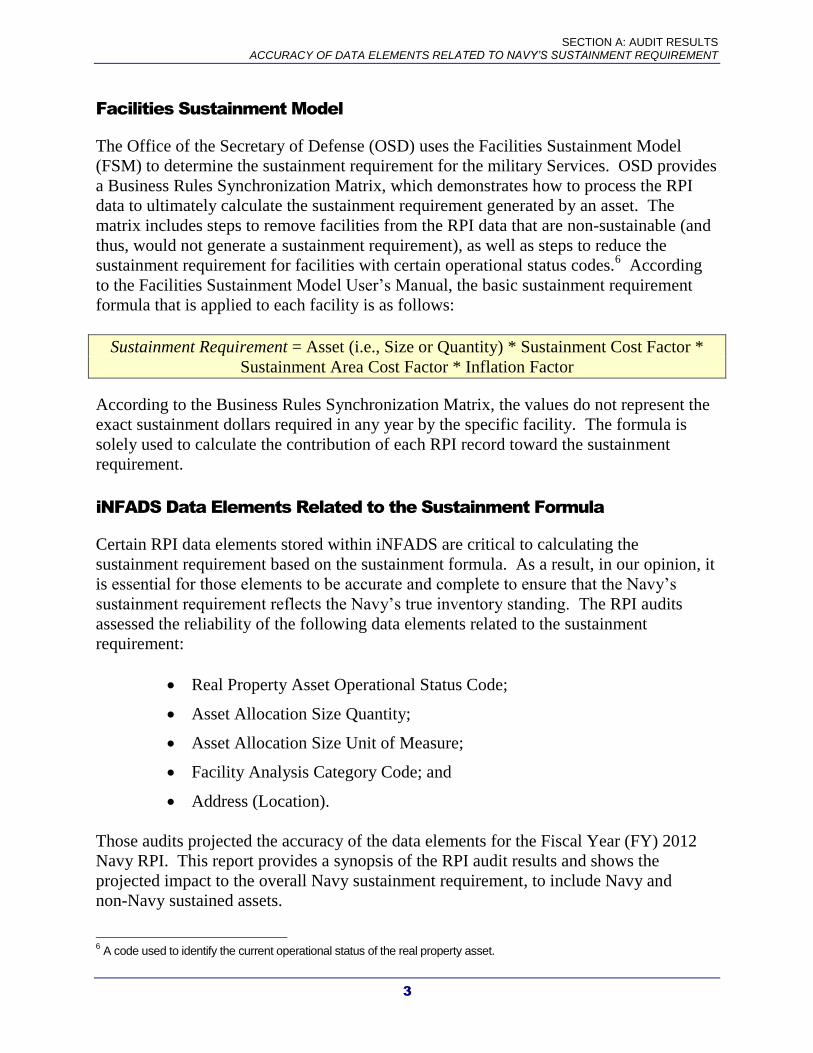
Sustainment Requirement = Asset (i.e., Size or Quantity) * Sustainment Cost Factor *
Sustainment Area Cost Factor * Inflation Factor
According to the Business Rules Synchronization Matrix, the values do not represent the
exact sustainment dollars required in any year by the specific facility. The formula is
solely used to calculate the contribution of each RPI record toward the sustainment
requirement.
iNFADS Data Elements Related to the Sustainment Formula
Certain RPI data elements stored within iNFADS are critical to calculating the
sustainment requirement based on the sustainment formula. As a result, in our opinion, it
is essential for those elements to be accurate and complete to ensure that the Navy’s
sustainment requirement reflects the Navy’s true inventory standing. The RPI audits
assessed the reliability of the following data elements related to the sustainment
requirement:
Real Property Asset Operational Status Code;
Asset Allocation Size Quantity;
Asset Allocation Size Unit of Measure;
Facility Analysis Category Code; and
Address (Location).
Those audits projected the accuracy of the data elements for the Fiscal Year (FY) 2012
Navy RPI. This report provides a synopsis of the RPI audit results and shows the
projected impact to the overall Navy sustainment requirement, to include Navy and
non-Navy sustained assets.
6 A code used to identify the current operational status of the real property asset.
SECTION A: AUDIT RESULTS ACCURACY OF DATA ELEMENTS RELATED TO NAVY’S SUSTAINMENT REQUIREMENT
4
The RPI audits reviewed a total of 447 property record cards. Based on those audits,
discrepancies were identified within data elements related to the sustainment
requirement. Using the results of the data reliability tests performed during the RPI
audits, we re-calculated the requirement for each asset utilization, within the 447 records.
To determine the overall impact to the sustainment requirement, we then compared the
final sustainment results from OSD’s Facilities Sustainment Model for FY 2015
(FSM-15) to our sustainment requirement calculations. Any discrepancy identified
between our calculations and the actual FSM-15 results was classified as an
over-statement or an under-statement to the sustainment requirement.
The RPI audits’ statistical samples included Navy assets that were not sustained by the
Navy. As a result, for statistical projection purposes, we separated those records to show
the impact to sustainment for facilities that are Navy-sustained and
“non-Navy”7-sustained.
All statistical projections presented in the report are based on the restricted universe and
represent the sustainment requirement generated by the facilities within the audited
NAVFAC regions (Atlantic, Marianas, and Hawaii) (see Exhibits B and C for details of
the audit scope and statistical methodology).
Real Property Asset Operational Status Code
The Real Property Asset Operational Status Code identifies the current operational status
of a real property asset. Table 1 provides a description of the most common codes.
7 The term “non-Navy” used throughout the report refers to the facilities within the samples that are not sustained by the
Navy.
SECTION A: AUDIT RESULTS ACCURACY OF DATA ELEMENTS RELATED TO NAVY’S SUSTAINMENT REQUIREMENT
5
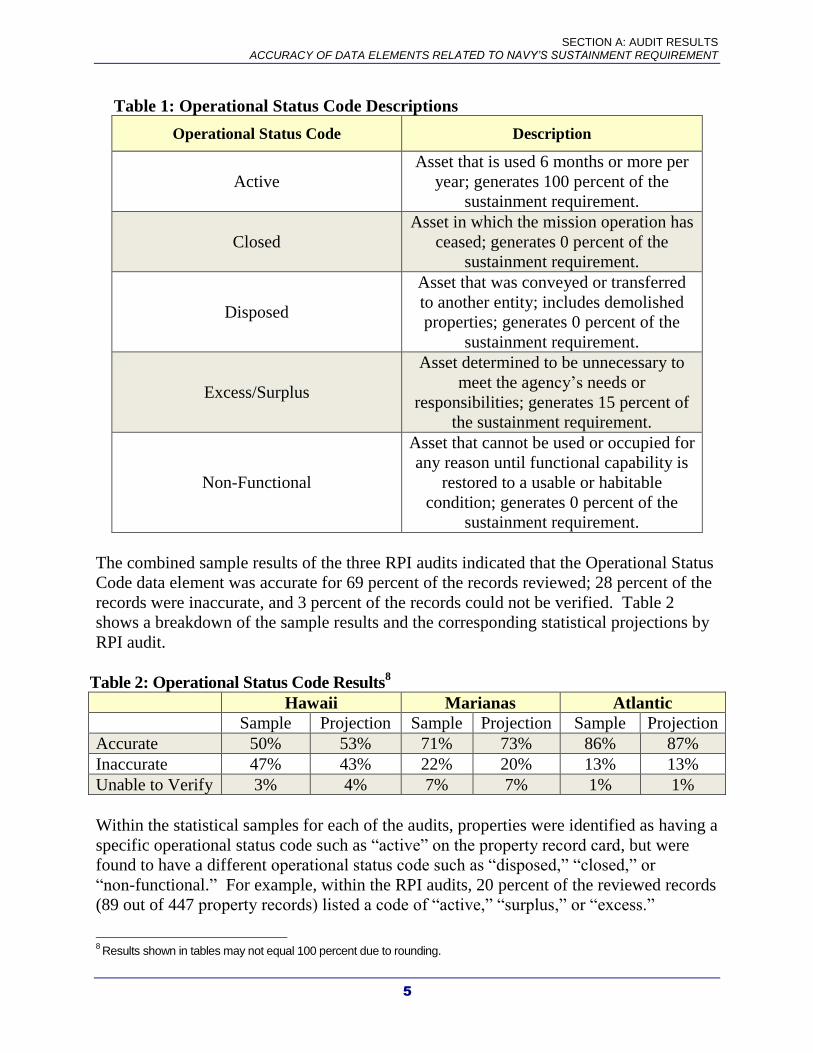
Table 1: Operational Status Code Descriptions
Operational Status Code Description
Active
Asset that is used 6 months or more per
year; generates 100 percent of the
sustainment requirement.
Closed
Asset in which the mission operation has
ceased; generates 0 percent of the
sustainment requirement.
Disposed
Asset that was conveyed or transferred
to another entity; includes demolished
properties; generates 0 percent of the
sustainment requirement.
Excess/Surplus
Asset determined to be unnecessary to
meet the agency’s needs or
responsibilities; generates 15 percent of
the sustainment requirement.
Non-Functional
Asset that cannot be used or occupied for
any reason until functional capability is
restored to a usable or habitable
condition; generates 0 percent of the
sustainment requirement.
The combined sample results of the three RPI audits indicated that the Operational Status
Code data element was accurate for 69 percent of the records reviewed; 28 percent of the
records were inaccurate, and 3 percent of the records could not be verified. Table 2
shows a breakdown of the sample results and the corresponding statistical projections by
RPI audit.
Table 2: Operational Status Code Results8
Hawaii Marianas Atlantic
Sample Projection Sample Projection Sample Projection
Accurate 50% 53% 71% 73% 86% 87%
Inaccurate 47% 43% 22% 20% 13% 13%
Unable to Verify 3% 4% 7% 7% 1% 1%
Within the statistical samples for each of the audits, properties were identified as having a
specific operational status code such as “active” on the property record card, but were
found to have a different operational status code such as “disposed,” “closed,” or
“non-functional.” For example, within the RPI audits, 20 percent of the reviewed records
(89 out of 447 property records) listed a code of “active,” “surplus,” or “excess.”
8 Results shown in tables may not equal 100 percent due to rounding.
SECTION A: AUDIT RESULTS ACCURACY OF DATA ELEMENTS RELATED TO NAVY’S SUSTAINMENT REQUIREMENT
6
However, during the site visits, the properties were determined to be disposed (e.g.,
demolished or sold).
Impact of the Operational Status Code to the Sustainment Requirement
When discrepancies exist within the operational status code, the sustainment requirement
may be impacted since the percent of the requirement an asset generates is based on its
operational status. For example, as described in guidance for the Facilities Sustainment
Model, “disposed” or “closed” facilities do not generate a sustainment requirement.
However, assets in an “excess” status generate a 15-percent requirement, and “active”
assets generate a 100-percent requirement.
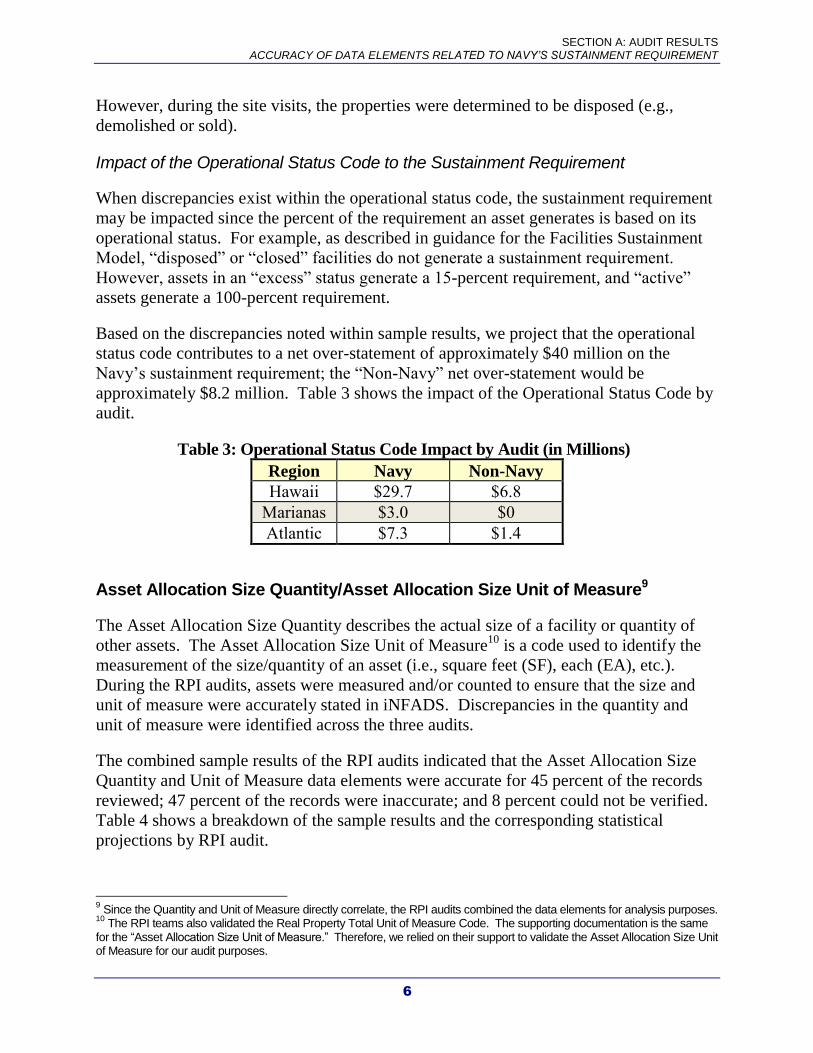
Based on the discrepancies noted within sample results, we project that the operational
status code contributes to a net over-statement of approximately $40 million on the
Navy’s sustainment requirement; the “Non-Navy” net over-statement would be
approximately $8.2 million. Table 3 shows the impact of the Operational Status Code by
audit.
Table 3: Operational Status Code Impact by Audit (in Millions)
Region Navy Non-Navy
Hawaii $29.7 $6.8
Marianas $3.0 $0
Atlantic $7.3 $1.4
Asset Allocation Size Quantity/Asset Allocation Size Unit of Measure9
The Asset Allocation Size Quantity describes the actual size of a facility or quantity of
other assets. The Asset Allocation Size Unit of Measure10
is a code used to identify the
measurement of the size/quantity of an asset (i.e., square feet (SF), each (EA), etc.).
During the RPI audits, assets were measured and/or counted to ensure that the size and
unit of measure were accurately stated in iNFADS. Discrepancies in the quantity and
unit of measure were identified across the three audits.
The combined sample results of the RPI audits indicated that the Asset Allocation Size
Quantity and Unit of Measure data elements were accurate for 45 percent of the records
reviewed; 47 percent of the records were inaccurate; and 8 percent could not be verified.
Table 4 shows a breakdown of the sample results and the corresponding statistical
projections by RPI audit.
9 Since the Quantity and Unit of Measure directly correlate, the RPI audits combined the data elements for analysis purposes.
10 The RPI teams also validated the Real Property Total Unit of Measure Code. The supporting documentation is the same
for the “Asset Allocation Size Unit of Measure.” Therefore, we relied on their support to validate the Asset Allocation Size Unit of Measure for our audit purposes.
SECTION A: AUDIT RESULTS ACCURACY OF DATA ELEMENTS RELATED TO NAVY’S SUSTAINMENT REQUIREMENT
7
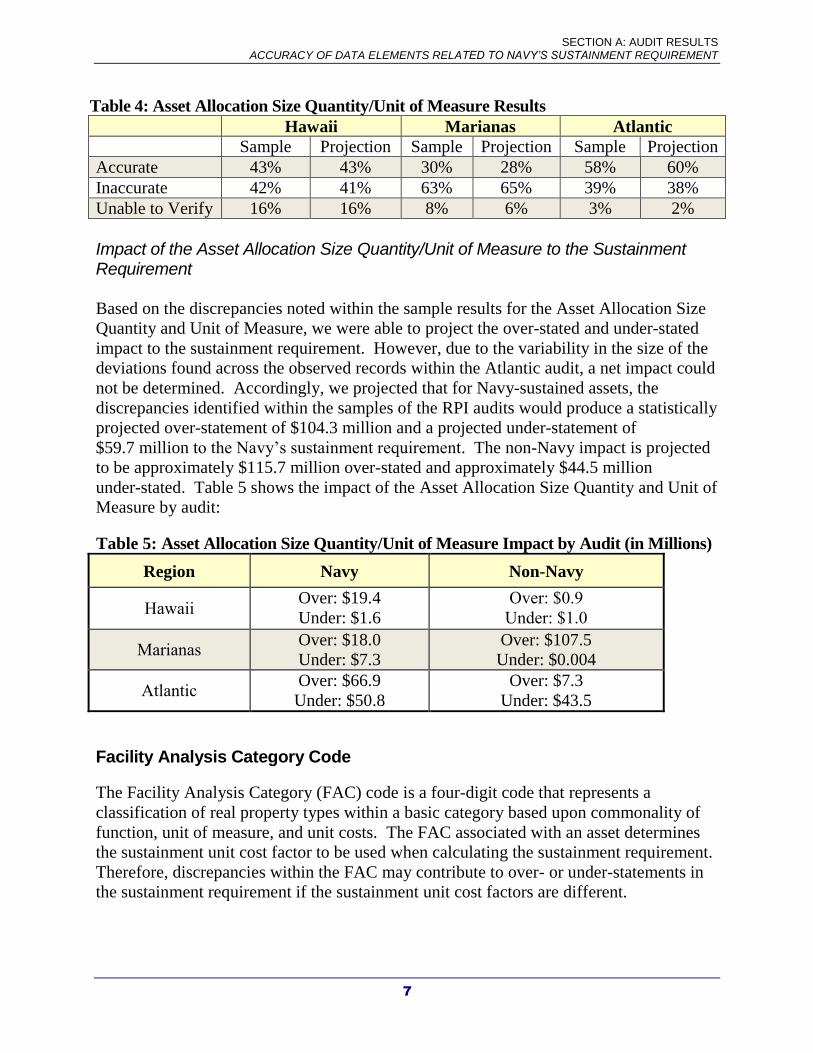
Table 4: Asset Allocation Size Quantity/Unit of Measure Results
Hawaii Marianas Atlantic
Sample Projection Sample Projection Sample Projection
Accurate 43% 43% 30% 28% 58% 60%
Inaccurate 42% 41% 63% 65% 39% 38%
Unable to Verify 16% 16% 8% 6% 3% 2%
Impact of the Asset Allocation Size Quantity/Unit of Measure to the Sustainment Requirement
Based on the discrepancies noted within the sample results for the Asset Allocation Size
Quantity and Unit of Measure, we were able to project the over-stated and under-stated
impact to the sustainment requirement. However, due to the variability in the size of the
deviations found across the observed records within the Atlantic audit, a net impact could
not be determined. Accordingly, we projected that for Navy-sustained assets, the
discrepancies identified within the samples of the RPI audits would produce a statistically
projected over-statement of $104.3 million and a projected under-statement of
$59.7 million to the Navy’s sustainment requirement. The non-Navy impact is projected
to be approximately $115.7 million over-stated and approximately $44.5 million
under-stated. Table 5 shows the impact of the Asset Allocation Size Quantity and Unit of
Measure by audit:
Table 5: Asset Allocation Size Quantity/Unit of Measure Impact by Audit (in Millions)
Region Navy Non-Navy
Hawaii Over: $19.4
Under: $1.6
Over: $0.9
Under: $1.0
Marianas Over: $18.0
Under: $7.3
Over: $107.5
Under: $0.004
Atlantic Over: $66.9
Under: $50.8
Over: $7.3
Under: $43.5
Facility Analysis Category Code
The Facility Analysis Category (FAC) code is a four-digit code that represents a
classification of real property types within a basic category based upon commonality of
function, unit of measure, and unit costs. The FAC associated with an asset determines
the sustainment unit cost factor to be used when calculating the sustainment requirement.
Therefore, discrepancies within the FAC may contribute to over- or under-statements in
the sustainment requirement if the sustainment unit cost factors are different.
SECTION A: AUDIT RESULTS ACCURACY OF DATA ELEMENTS RELATED TO NAVY’S SUSTAINMENT REQUIREMENT
8
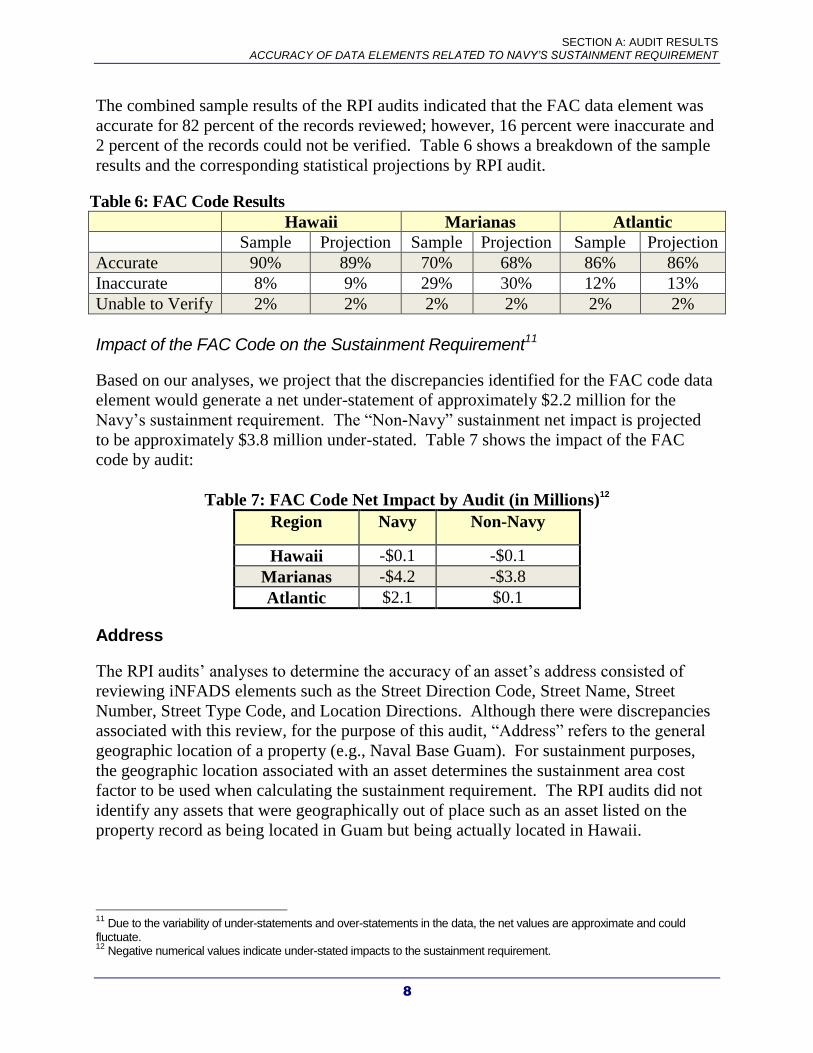
The combined sample results of the RPI audits indicated that the FAC data element was
accurate for 82 percent of the records reviewed; however, 16 percent were inaccurate and
2 percent of the records could not be verified. Table 6 shows a breakdown of the sample
results and the corresponding statistical projections by RPI audit.
Table 6: FAC Code Results
Hawaii Marianas Atlantic
Sample Projection Sample Projection Sample Projection
Accurate 90% 89% 70% 68% 86% 86%
Inaccurate 8% 9% 29% 30% 12% 13%
Unable to Verify 2% 2% 2% 2% 2% 2%
Impact of the FAC Code on the Sustainment Requirement11
Based on our analyses, we project that the discrepancies identified for the FAC code data
element would generate a net under-statement of approximately $2.2 million for the
Navy’s sustainment requirement. The “Non-Navy” sustainment net impact is projected
to be approximately $3.8 million under-stated. Table 7 shows the impact of the FAC
code by audit:
Table 7: FAC Code Net Impact by Audit (in Millions)12
Region Navy Non-Navy
Hawaii -$0.1 -$0.1
Marianas -$4.2 -$3.8
Atlantic $2.1 $0.1
Address
The RPI audits’ analyses to determine the accuracy of an asset’s address consisted of
reviewing iNFADS elements such as the Street Direction Code, Street Name, Street
Number, Street Type Code, and Location Directions. Although there were discrepancies
associated with this review, for the purpose of this audit, “Address” refers to the general
geographic location of a property (e.g., Naval Base Guam). For sustainment purposes,
the geographic location associated with an asset determines the sustainment area cost
factor to be used when calculating the sustainment requirement. The RPI audits did not
identify any assets that were geographically out of place such as an asset listed on the
property record as being located in Guam but being actually located in Hawaii.
11
Due to the variability of under-statements and over-statements in the data, the net values are approximate and could fluctuate. 12
Negative numerical values indicate under-stated impacts to the sustainment requirement.
SECTION A: AUDIT RESULTS ACCURACY OF DATA ELEMENTS RELATED TO NAVY’S SUSTAINMENT REQUIREMENT
9
Impact of the Address on the Sustainment Requirement
The address test for sustainment purposes was determined to be accurate for all records in
this audit. Since there were no discrepancies identified, the impact to the sustainment
requirement was zero.
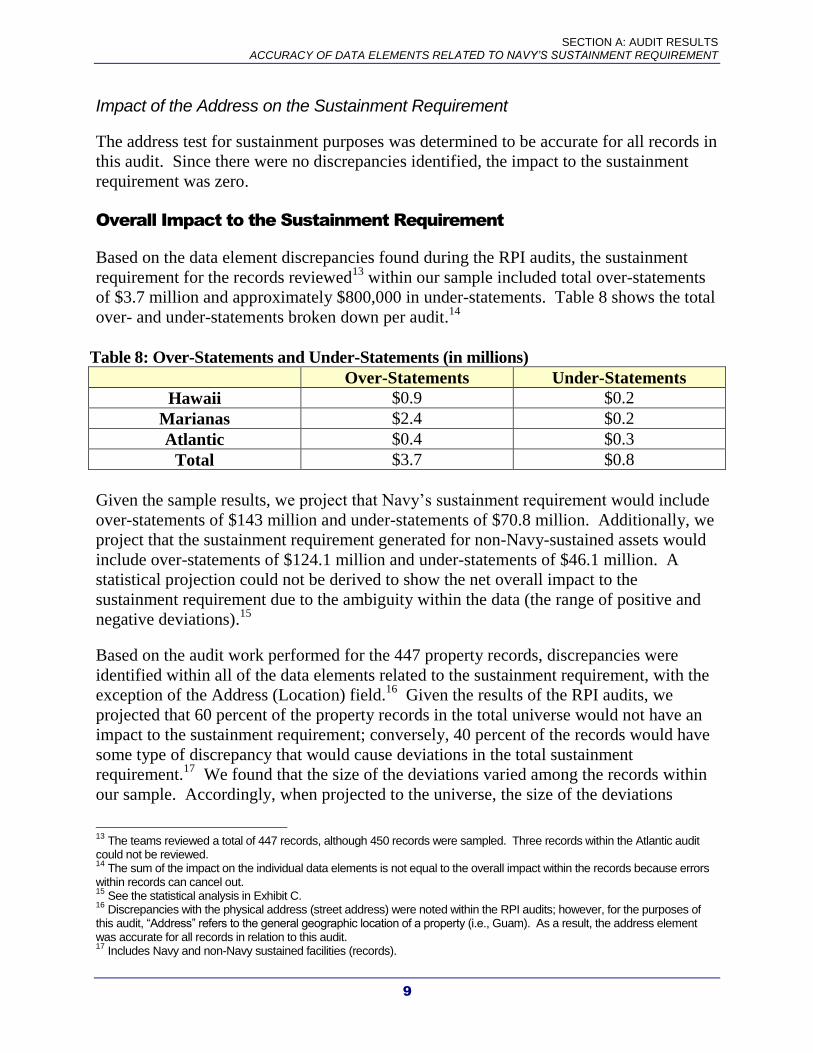
Overall Impact to the Sustainment Requirement
Based on the data element discrepancies found during the RPI audits, the sustainment
requirement for the records reviewed13
within our sample included total over-statements
of $3.7 million and approximately $800,000 in under-statements. Table 8 shows the total
over- and under-statements broken down per audit.14
Table 8: Over-Statements and Under-Statements (in millions)
Over-Statements Under-Statements
Hawaii $0.9 $0.2
Marianas $2.4 $0.2
Atlantic $0.4 $0.3
Total $3.7 $0.8
Given the sample results, we project that Navy’s sustainment requirement would include
over-statements of $143 million and under-statements of $70.8 million. Additionally, we
project that the sustainment requirement generated for non-Navy-sustained assets would
include over-statements of $124.1 million and under-statements of $46.1 million. A
statistical projection could not be derived to show the net overall impact to the
sustainment requirement due to the ambiguity within the data (the range of positive and
negative deviations).15
Based on the audit work performed for the 447 property records, discrepancies were
identified within all of the data elements related to the sustainment requirement, with the
exception of the Address (Location) field.16
Given the results of the RPI audits, we
projected that 60 percent of the property records in the total universe would not have an
impact to the sustainment requirement; conversely, 40 percent of the records would have
some type of discrepancy that would cause deviations in the total sustainment
requirement.17
We found that the size of the deviations varied among the records within
our sample. Accordingly, when projected to the universe, the size of the deviations
13
The teams reviewed a total of 447 records, although 450 records were sampled. Three records within the Atlantic audit could not be reviewed. 14
The sum of the impact on the individual data elements is not equal to the overall impact within the records because errors within records can cancel out. 15
See the statistical analysis in Exhibit C. 16
Discrepancies with the physical address (street address) were noted within the RPI audits; however, for the purposes of this audit, “Address” refers to the general geographic location of a property (i.e., Guam). As a result, the address element was accurate for all records in relation to this audit. 17
Includes Navy and non-Navy sustained facilities (records).
SECTION A: AUDIT RESULTS ACCURACY OF DATA ELEMENTS RELATED TO NAVY’S SUSTAINMENT REQUIREMENT
10
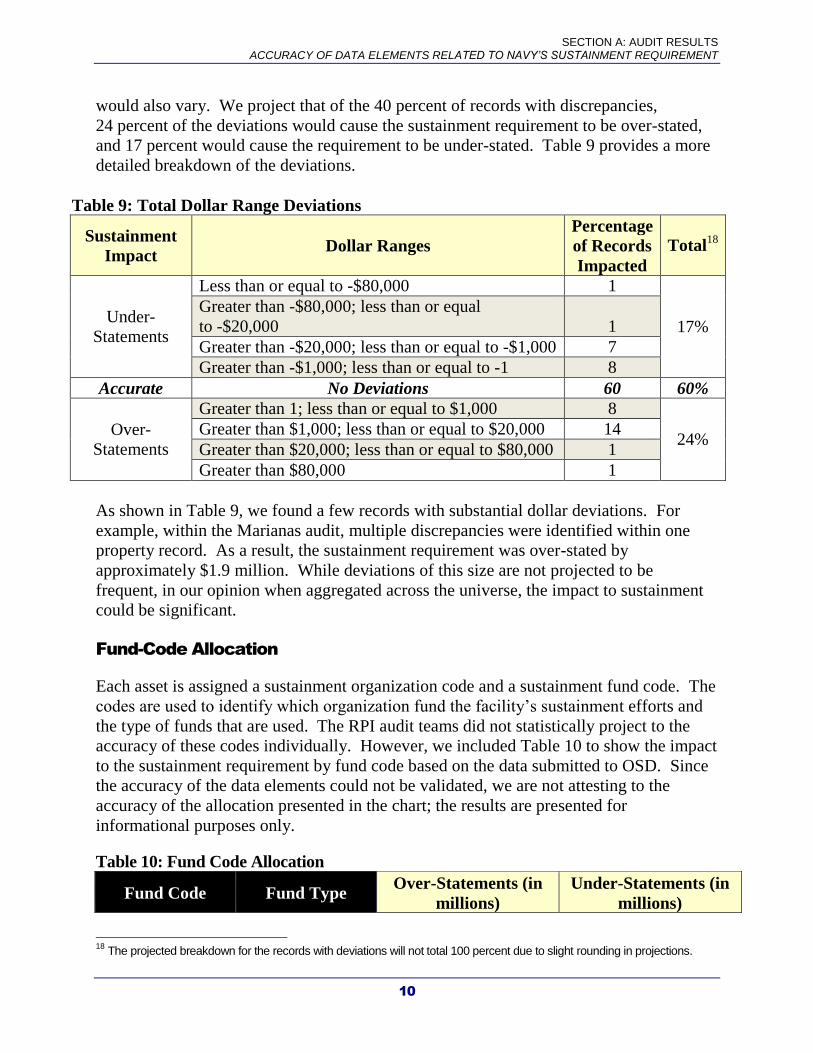
would also vary. We project that of the 40 percent of records with discrepancies,
24 percent of the deviations would cause the sustainment requirement to be over-stated,
and 17 percent would cause the requirement to be under-stated. Table 9 provides a more
detailed breakdown of the deviations.
Table 9: Total Dollar Range Deviations
Sustainment
Impact Dollar Ranges
Percentage
of Records
Impacted
Total18
Under-
Statements
Less than or equal to -$80,000 1
17%
Greater than -$80,000; less than or equal
to -$20,000 1
Greater than -$20,000; less than or equal to -$1,000 7
Greater than -$1,000; less than or equal to -1 8
Accurate No Deviations 60 60%
Over-
Statements
Greater than 1; less than or equal to $1,000 8
24% Greater than $1,000; less than or equal to $20,000 14
Greater than $20,000; less than or equal to $80,000 1
Greater than $80,000 1
As shown in Table 9, we found a few records with substantial dollar deviations. For
example, within the Marianas audit, multiple discrepancies were identified within one
property record. As a result, the sustainment requirement was over-stated by
approximately $1.9 million. While deviations of this size are not projected to be
frequent, in our opinion when aggregated across the universe, the impact to sustainment
could be significant.
Fund-Code Allocation
Each asset is assigned a sustainment organization code and a sustainment fund code. The
codes are used to identify which organization fund the facility’s sustainment efforts and
the type of funds that are used. The RPI audit teams did not statistically project to the
accuracy of these codes individually. However, we included Table 10 to show the impact
to the sustainment requirement by fund code based on the data submitted to OSD. Since
the accuracy of the data elements could not be validated, we are not attesting to the
accuracy of the allocation presented in the chart; the results are presented for
informational purposes only.
Table 10: Fund Code Allocation
Fund Code Fund Type Over-Statements (in
millions)
Under-Statements (in
millions)
18
The projected breakdown for the records with deviations will not total 100 percent due to slight rounding in projections.

SECTION A: AUDIT RESULTS ACCURACY OF DATA ELEMENTS RELATED TO NAVY’S SUSTAINMENT REQUIREMENT
11
0730 Family Housing $0.0 -$0.2
0735 Family Housing $17.0 -$6.8
1319
Research,
Development, Test
and Evaluation $0.8 -$0.0
1804
Operations and
Maintenance
(O&M), Navy $51.6 -$42.3
1806 O&M, Navy
Reserve $0.1 -$0.8
4930 Working Capital
Fund $73.6 -$20.7
Unfunded Other $0.0 -$0.1
Users Did Not Exist
During our review, we identified instances in which users were occupying a facility but
the data for some of the utilizations was not included in the annual RPI data submission
to OSD or in iNFADS at the time of the site visits. We also identified instances in which
the OSD submission data, as well as iNFADS, showed that multiple users were
occupying a facility; however, during site visits, some of the users were no longer
occupying the facility or were not using the facility as indicated in the OSD submission
data. These types of discrepancies (i.e., utilizations not included; users no longer using
the facility) resulted in an impact to the sustainment requirement because of incomplete
and inaccurate inventory data. Based on our review, the projected impact for these types
of errors is a net under-statement of $4.6 million to the Navy’s sustainment
requirement.19
Our projections indicate that there would not be an impact to the
non-Navy sustainment requirement.
19
Due to the variability of under-statements and over-statements in the data, the net values are approximate and could fluctuate.
12
Exhibit A:
Background
According to the Naval Facilities Engineering Command Real Property Inventory
Procedures Manual (P-78), the Internet Navy Facilities Assets Data Store (iNFADS) is an
automated file of data on each facility (building, structure, utility, and land) in which the
Navy has legal interest. The database is the official record of the Navy’s real property
and is the primary source of data used to drive the Navy’s sustainment requirement.
There are many other systems that rely on data maintained within the database, including
the Real Property Asset Database (RPAD). The RPAD is used by the Department of
Defense (DoD) to standardize facility information across the Services. According to
P-78, this is essential to the management of DoD inventories to meet facility sustainment
goals.
Facility sustainment efforts include activities such as maintenance and repair initiatives
necessary to keep facilities in good, working order. For example, real property
sustainment would include work such as: regularly scheduled adjustments and
inspections, preventive maintenance tasks, emergency response, and service calls for
minor repairs. The sustainment requirement, although driven by data within iNFADS, is
generated by the Office of the Secretary of Defense (OSD) using the Facilities
Sustainment Model (FSM). FSM relies on data submitted to OSD annually via RPAD.
FSM is a tool used by OSD and the Services to forecast the annual funding required for
the sustainment of DoD real property. FSM is also used to:
Develop strategies for the funding of sustainment;
Publish sustainment planning guidance to subordinate organizations;
Establish sustainment requirements for each budget cycle;
Conduct program reviews with regard to sustainment;
Justify budgets for real property sustainment; and
Allocate sustainment funds to subordinate organizations.
The model calculates the requirement for each facility in the inventory based on the:
Type of facility;
Physical size of the facility (i.e., quantity such as square feet);
Sustainment cost factor for that type of facility;
Sustainment area cost determined by the location of the facility; and
Inflation factor for the appropriate Future Years Defense Program year.
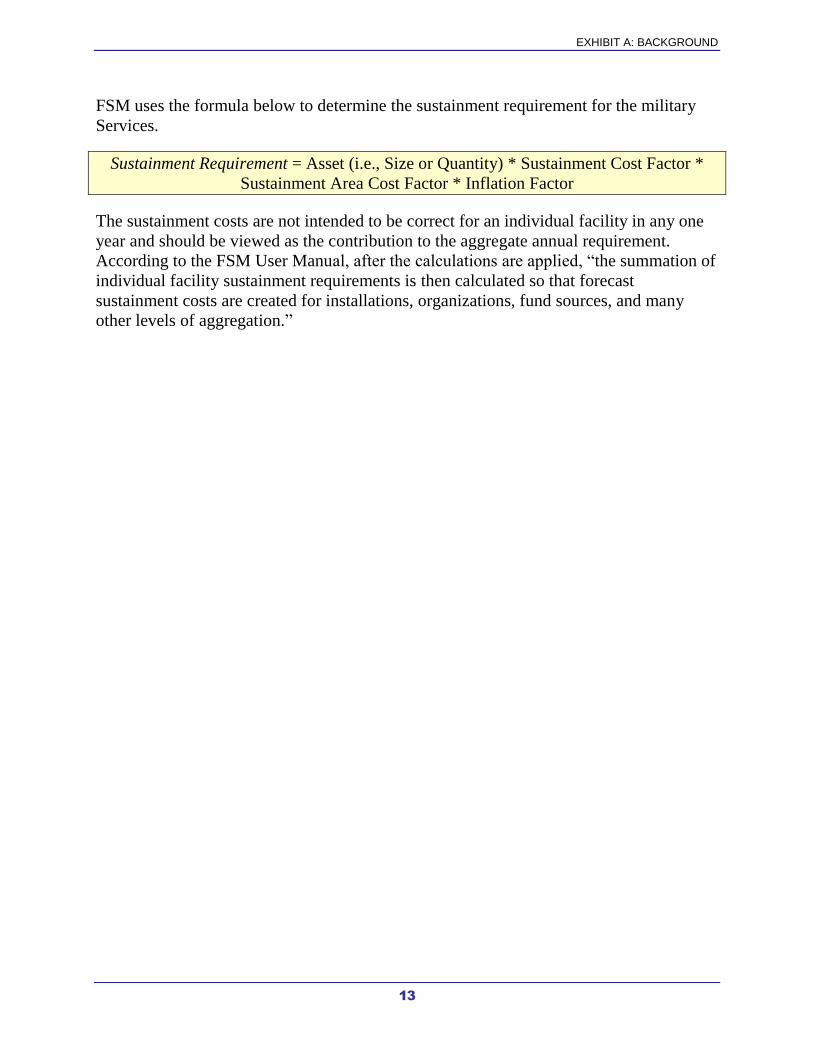
EXHIBIT A: BACKGROUND
13
FSM uses the formula below to determine the sustainment requirement for the military
Services.
Sustainment Requirement = Asset (i.e., Size or Quantity) * Sustainment Cost Factor *
Sustainment Area Cost Factor * Inflation Factor
The sustainment costs are not intended to be correct for an individual facility in any one
year and should be viewed as the contribution to the aggregate annual requirement.
According to the FSM User Manual, after the calculations are applied, “the summation of
individual facility sustainment requirements is then calculated so that forecast
sustainment costs are created for installations, organizations, fund sources, and many
other levels of aggregation.”

14
Exhibit B:
Scope and Methodology
Our analysis was based on the Fiscal Year (FY) 2012 Real Property Inventory (RPI) data
extracted from the Internet Navy Facility Assets Data Store (iNFADS). We relied on the
results of three other Naval Audit Service RPI audits to determine the impact to the
Navy’s sustainment requirement. The purposes of those audits were to verify the
accuracy and completeness of iNFADS in relation to the Navy’s Class 2 real property
inventory. The audit steps associated with the RPI audits were designed to test the
reliability of the iNFADS data elements, including those related to the sustainment
requirement.
We conducted our review between 9 April 2013 and 23 October 2014. The FY 2012 RPI
data used was provided by the Naval Facilities Engineering Command (NAVFAC)
Headquarters as a part of the RPI audits. The total Department of the Navy (DON) RPI
universe consisted of 171,085 records stored in iNFADS. The Naval Audit Service
narrowed down the scope to audit the NAVFAC regions of Hawaii, Marianas, and
several regions within Atlantic.20
The three RPI audits further restricted the universe to
exclude all Marine Corps property and Navy land, linear structures, “Disposed,” and “To
Be Acquired” properties. Additionally, the Atlantic RPI audit excluded “Caretaker,”
“Closed,” and “Excess” sites, as well as all property located in Key West, FL. As a
result, our restricted universe consisted of a total of 78,168 property records. The
three regional audits (Atlantic,21
Hawaii,22
and Marianas23
) focused on verifying the
accuracy and completeness of Navy records in the iNFADS database.
Across the RPI audits, a total of 450 property records were statistically selected. To
determine the impact to the sustainment requirement, each record selected was further
broken down to include the individual asset utilizations (or users) of a facility. The
450 records included 529 asset utilizations and represented a total sustainment
requirement of about $18.4 million based on the Facilities Sustainment Model-15
(FSM-15). Table 11 explains the universe and sample information for each RPI audit by
NAVFAC region.
20
Southwest, Northwest, Southeast, Mid-Atlantic, Midwest, and Naval District Washington. 21
Naval Audit Service Report N2014-0027, “Navy’s Real Property Inventory- Naval Facilities Engineering Command Atlantic,” dated 9 June 2014. 22
Naval Audit Service Report N2014-0019, “Navy’s Real Property Inventory- Naval Facilities Engineering Command Hawaii,” dated 22 April 2014. 23
Naval Audit Service Report N2014-0015, “Navy’s Real Property Inventory- Naval Facilities Engineering Command Marianas,” dated 2 April 2014.
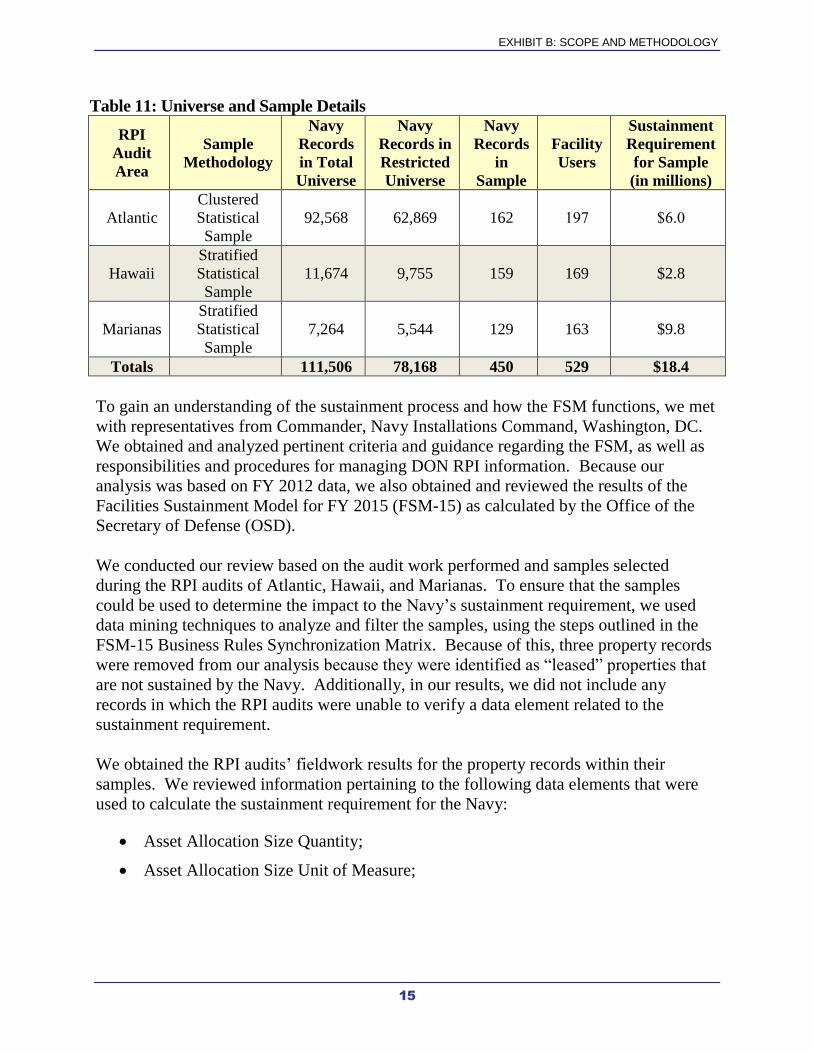
EXHIBIT B: SCOPE AND METHODOLOGY
15
Table 11: Universe and Sample Details
RPI
Audit
Area
Sample
Methodology
Navy
Records
in Total
Universe
Navy
Records in
Restricted
Universe
Navy
Records
in
Sample
Facility
Users
Sustainment
Requirement
for Sample
(in millions)
Atlantic
Clustered
Statistical
Sample
92,568 62,869 162 197 $6.0
Hawaii
Stratified
Statistical
Sample
11,674 9,755 159 169 $2.8
Marianas
Stratified
Statistical
Sample
7,264 5,544 129 163 $9.8
Totals 111,506 78,168 450 529 $18.4
To gain an understanding of the sustainment process and how the FSM functions, we met
with representatives from Commander, Navy Installations Command, Washington, DC.
We obtained and analyzed pertinent criteria and guidance regarding the FSM, as well as
responsibilities and procedures for managing DON RPI information. Because our
analysis was based on FY 2012 data, we also obtained and reviewed the results of the
Facilities Sustainment Model for FY 2015 (FSM-15) as calculated by the Office of the
Secretary of Defense (OSD).
We conducted our review based on the audit work performed and samples selected
during the RPI audits of Atlantic, Hawaii, and Marianas. To ensure that the samples
could be used to determine the impact to the Navy’s sustainment requirement, we used
data mining techniques to analyze and filter the samples, using the steps outlined in the
FSM-15 Business Rules Synchronization Matrix. Because of this, three property records
were removed from our analysis because they were identified as “leased” properties that
are not sustained by the Navy. Additionally, in our results, we did not include any
records in which the RPI audits were unable to verify a data element related to the
sustainment requirement.
We obtained the RPI audits’ fieldwork results for the property records within their
samples. We reviewed information pertaining to the following data elements that were
used to calculate the sustainment requirement for the Navy:
Asset Allocation Size Quantity;
Asset Allocation Size Unit of Measure;
EXHIBIT B: SCOPE AND METHODOLOGY
16
Address/Location (Site, City, etc.)24
;
Facility Analysis Category Code; and
Operational Status Code.
After obtaining the information from the RPI audits, we determined the actual
sustainment requirement generated for each asset utilization (or user) within a property
record based on the results of FSM-15. Using the sustainment requirement formula
described in criteria, we manually recalculated the sustainment requirement for each asset
utilization (or user) based on any discrepancies identified during the RPI audits that
impacted the sustainment data elements. We then compared the results of our
calculations to the actual sustainment requirement results generated by OSD in FSM-15
for Navy’s real property.
Due to the lag time between the date of the OSD submission and the dates of the RPI
audits’ site visits, we reviewed the iNFADS “audit trail” for each property record within
the samples to determine whether any changes occurred to data elements in that
timeframe that would impact the sustainment requirement. We determined that there
were changes made in the data elements for 13 of the records after the RPI data was
submitted to OSD, but before site visits commenced for the RPI audits. In these cases,
we calculated the sustainment requirement using data within the iNFADS database (at the
time of the audit site visits) instead of the data submitted to OSD in the FY 2012
submission. Since there were only 13 records within our total sample in which iNFADS
data was used, in our professional judgment, we believe that any impact identified is an
approximation of what the results of the FSM-15 would generate, given the stability of
RPI data (only 13 changes between the OSD submission and iNFADS at the time of site
visits). In our opinion, this methodology will not materially affect the overall results of
our review.
We relied on the data reliability tests performed in the three RPI audits. The information
used throughout those audits was gathered from the iNFADS database and tests
(statistical reviews, red flag reviews, and completeness reviews) were performed to verify
the reliability/accuracy of the information obtained from the database. For our analyses,
we relied on the results of the statistical reviews. We also relied on the internal control
reviews performed during the RPI audits. The RPI audits included procedures to
determine how inputted data was validated in iNFADS, how disposals were handled, and
how real property was classified if it did not clearly fall into one category. The audits
also included steps to review processes and internal controls over entering, updating,
removing and verifying data within iNFADS. Additionally, we reviewed criteria and met
with representatives from Commander, Navy Installations Command to determine how
the sustainment process is executed as well as oversight responsibilities for the RPI data.
24
For the purposes of this review, the “Address” data element in the RPI audits was used to determine the accuracy of the geographical location of an asset.
EXHIBIT B: SCOPE AND METHODOLOGY
17
We conducted a review of prior audits completed by the Government Accountability
Office, Department of Defense Inspector General, and Navy, Army and Air Force audit
agencies. Our review identified no prior audits related to the Navy’s sustainment
requirement; accordingly, no followup work was required. Additionally, we coordinated
efforts with the Government Accountability Office, Department of Defense Inspector
General, Naval Inspector General, and Naval Criminal Investigative Service to determine
if any current or planned projects would impact this review. At the start of our review,
there were no ongoing or planned projects that would impact our efforts.
We conducted this audit in accordance with Generally Accepted Government Auditing
Standards. Those standards require that we plan and perform the audit to obtain
sufficient, appropriate evidence to provide a reasonable basis for our findings and
conclusions based on our audit objectives. We believe that the evidence obtained
provides a reasonable basis for our results and conclusions based on our audit objectives.

18
Exhibit C:
Statistical Sampling Methodology
A series of statistical projections was calculated based on a multi-stage stratified sample
of 450 records. The final sample was selected using a combination of clustering and
stratification. The records for the Atlantic region were clustered by region in order to
reduce travel costs. The combined sample was stratified by region and dollar value.
When calculating the projections, the sample results were weighted based on the inverse
of the sampling probability. The confidence intervals associated with the accuracy
projections were calculated at the 95-percent confidence level.25
For the dollar value
projections we provide a 90-percent lower bound. The decreased confidence for these
projections is due to the higher variability in the dollar versus attribute sample results.
The projections described within the report are based on the restricted universe as
described in Table 11 of the Scope and Methodology section of this report.
Table 12 in this section contains the projected accuracy for several of the Internet Navy
Facility Assets Data Store (iNFADS) data elements associated with the sustainment
formula.26
For each projection, the table includes the point estimate along with the
associated 95-percent confidence interval. For example, based on the first row of the
table, we can conclude an estimated 43 percent of iNFADS records in Hawaii had
inaccuracies in the Operational Status Code data element. The 95-percent confidence
interval for this projection ranges from 36 percent to 51 percent. The remaining cells of
this table can be interpreted in a similar fashion.
25
A 95-percent confidence interval is expected to include the actual value for the population in 95 out of 100 samples drawn from the population. Because we followed a probability procedure based on random selection, our sample is only one of a large number of samples that we might have drawn. Since each sample could have provided different estimates, we express our confidence in the precision of our particular sample’s results as a 95-percent confidence interval. 26
The address data element was determined to be accurate for all sampled records within the audit. Since the address field had no impact on sustainment, it has not been included in the projection tables
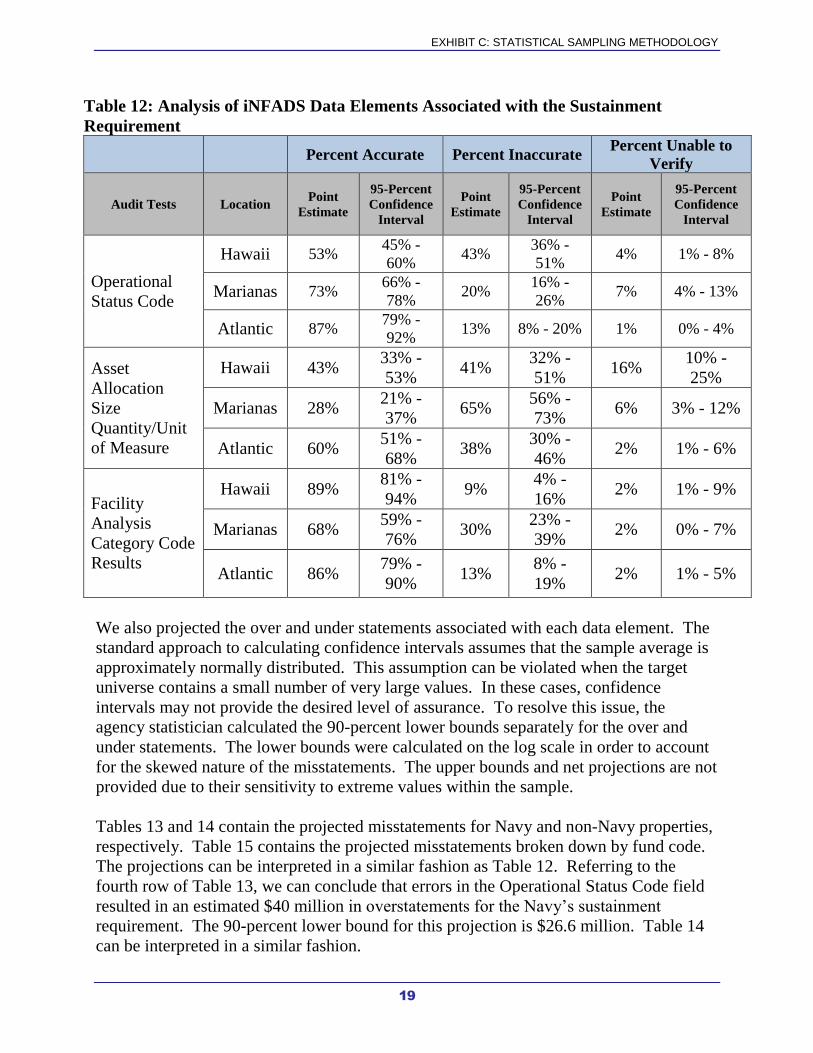
EXHIBIT C: STATISTICAL SAMPLING METHODOLOGY
19
Table 12: Analysis of iNFADS Data Elements Associated with the Sustainment
Requirement
Percent Accurate Percent Inaccurate
Percent Unable to
Verify
Audit Tests Location Point
Estimate
95-Percent
Confidence
Interval
Point
Estimate
95-Percent
Confidence
Interval
Point
Estimate
95-Percent
Confidence
Interval
Operational
Status Code
Hawaii 53% 45% -
60% 43%
36% -
51% 4% 1% - 8%
Marianas 73% 66% -
78% 20%
16% -
26% 7% 4% - 13%
Atlantic 87% 79% -
92% 13% 8% - 20% 1% 0% - 4%
Asset
Allocation
Size
Quantity/Unit
of Measure
Hawaii 43% 33% -
53% 41%
32% -
51% 16%
10% -
25%
Marianas 28% 21% -
37% 65%
56% -
73% 6% 3% - 12%
Atlantic 60% 51% -
68% 38%
30% -
46% 2% 1% - 6%
Facility
Analysis
Category Code
Results
Hawaii 89% 81% -
94% 9%
4% -
16% 2% 1% - 9%
Marianas 68% 59% -
76% 30%
23% -
39% 2% 0% - 7%
Atlantic 86% 79% -
90% 13%
8% -
19% 2% 1% - 5%
We also projected the over and under statements associated with each data element. The
standard approach to calculating confidence intervals assumes that the sample average is
approximately normally distributed. This assumption can be violated when the target
universe contains a small number of very large values. In these cases, confidence
intervals may not provide the desired level of assurance. To resolve this issue, the
agency statistician calculated the 90-percent lower bounds separately for the over and
under statements. The lower bounds were calculated on the log scale in order to account
for the skewed nature of the misstatements. The upper bounds and net projections are not
provided due to their sensitivity to extreme values within the sample.
Tables 13 and 14 contain the projected misstatements for Navy and non-Navy properties,
respectively. Table 15 contains the projected misstatements broken down by fund code.
The projections can be interpreted in a similar fashion as Table 12. Referring to the
fourth row of Table 13, we can conclude that errors in the Operational Status Code field
resulted in an estimated $40 million in overstatements for the Navy’s sustainment
requirement. The 90-percent lower bound for this projection is $26.6 million. Table 14
can be interpreted in a similar fashion.
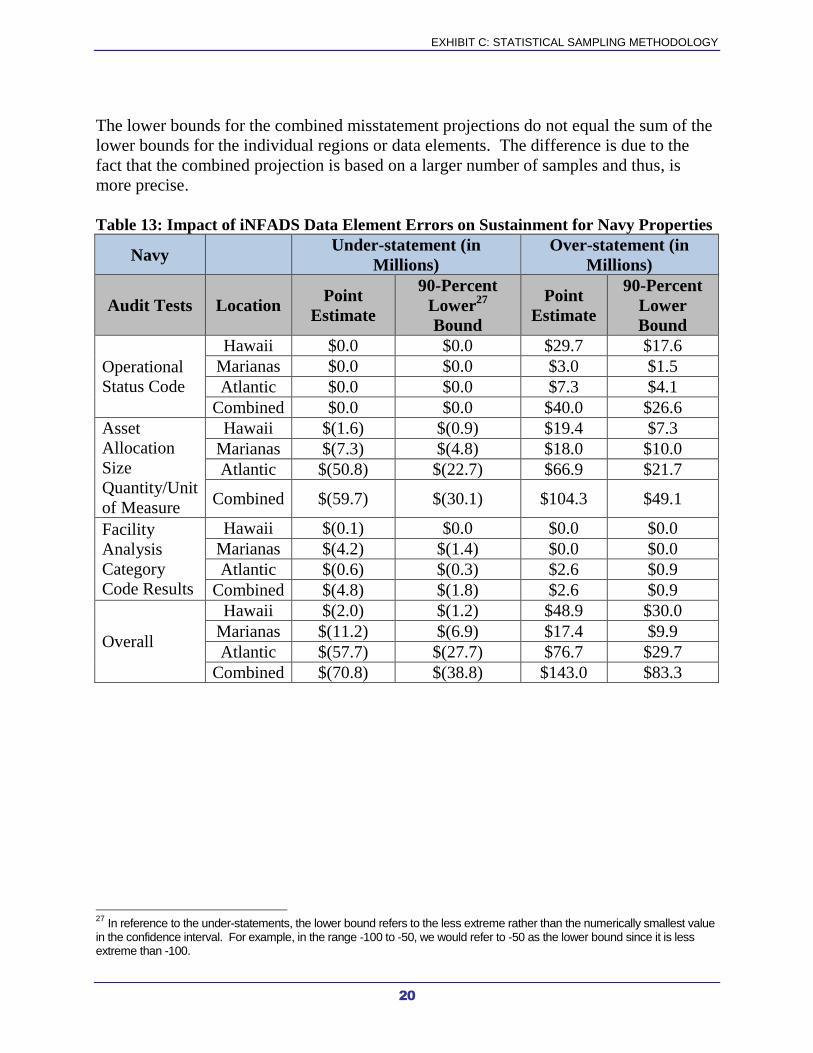
EXHIBIT C: STATISTICAL SAMPLING METHODOLOGY
20
The lower bounds for the combined misstatement projections do not equal the sum of the
lower bounds for the individual regions or data elements. The difference is due to the
fact that the combined projection is based on a larger number of samples and thus, is
more precise.
Table 13: Impact of iNFADS Data Element Errors on Sustainment for Navy Properties
Navy Under-statement (in
Millions)
Over-statement (in
Millions)
Audit Tests Location Point
Estimate
90-Percent
Lower27
Bound
Point
Estimate
90-Percent
Lower
Bound
Operational
Status Code
Hawaii $0.0 $0.0 $29.7 $17.6
Marianas $0.0 $0.0 $3.0 $1.5
Atlantic $0.0 $0.0 $7.3 $4.1
Combined $0.0 $0.0 $40.0 $26.6
Asset
Allocation
Size
Quantity/Unit
of Measure
Hawaii $(1.6) $(0.9) $19.4 $7.3
Marianas $(7.3) $(4.8) $18.0 $10.0
Atlantic $(50.8) $(22.7) $66.9 $21.7
Combined $(59.7) $(30.1) $104.3 $49.1
Facility
Analysis
Category
Code Results
Hawaii $(0.1) $0.0 $0.0 $0.0
Marianas $(4.2) $(1.4) $0.0 $0.0
Atlantic $(0.6) $(0.3) $2.6 $0.9
Combined $(4.8) $(1.8) $2.6 $0.9
Overall
Hawaii $(2.0) $(1.2) $48.9 $30.0
Marianas $(11.2) $(6.9) $17.4 $9.9
Atlantic $(57.7) $(27.7) $76.7 $29.7
Combined $(70.8) $(38.8) $143.0 $83.3
27
In reference to the under-statements, the lower bound refers to the less extreme rather than the numerically smallest value in the confidence interval. For example, in the range -100 to -50, we would refer to -50 as the lower bound since it is less extreme than -100.
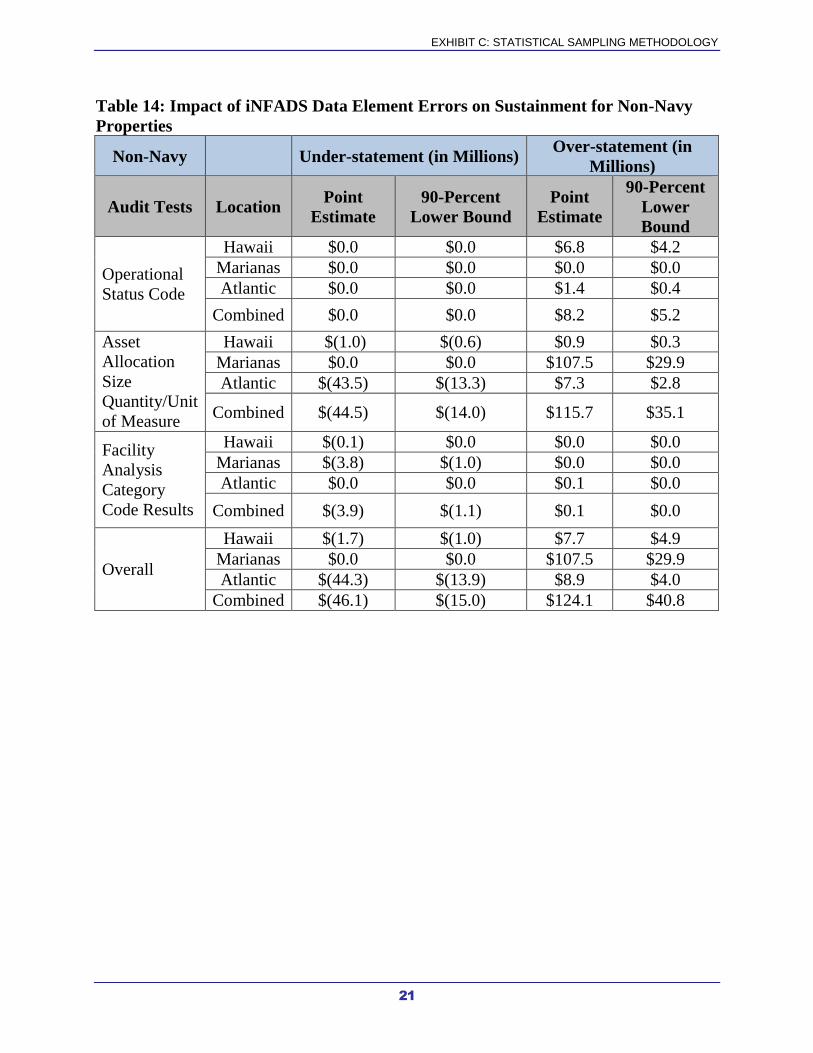
EXHIBIT C: STATISTICAL SAMPLING METHODOLOGY
21
Table 14: Impact of iNFADS Data Element Errors on Sustainment for Non-Navy
Properties
Non-Navy Under-statement (in Millions) Over-statement (in
Millions)
Audit Tests Location Point
Estimate
90-Percent
Lower Bound
Point
Estimate
90-Percent
Lower
Bound
Operational
Status Code
Hawaii $0.0 $0.0 $6.8 $4.2
Marianas $0.0 $0.0 $0.0 $0.0
Atlantic $0.0 $0.0 $1.4 $0.4
Combined $0.0 $0.0 $8.2 $5.2
Asset
Allocation
Size
Quantity/Unit
of Measure
Hawaii $(1.0) $(0.6) $0.9 $0.3
Marianas $0.0 $0.0 $107.5 $29.9
Atlantic $(43.5) $(13.3) $7.3 $2.8
Combined $(44.5) $(14.0) $115.7 $35.1
Facility
Analysis
Category
Code Results
Hawaii $(0.1) $0.0 $0.0 $0.0
Marianas $(3.8) $(1.0) $0.0 $0.0
Atlantic $0.0 $0.0 $0.1 $0.0
Combined $(3.9) $(1.1) $0.1 $0.0
Overall
Hawaii $(1.7) $(1.0) $7.7 $4.9
Marianas $0.0 $0.0 $107.5 $29.9
Atlantic $(44.3) $(13.9) $8.9 $4.0
Combined $(46.1) $(15.0) $124.1 $40.8
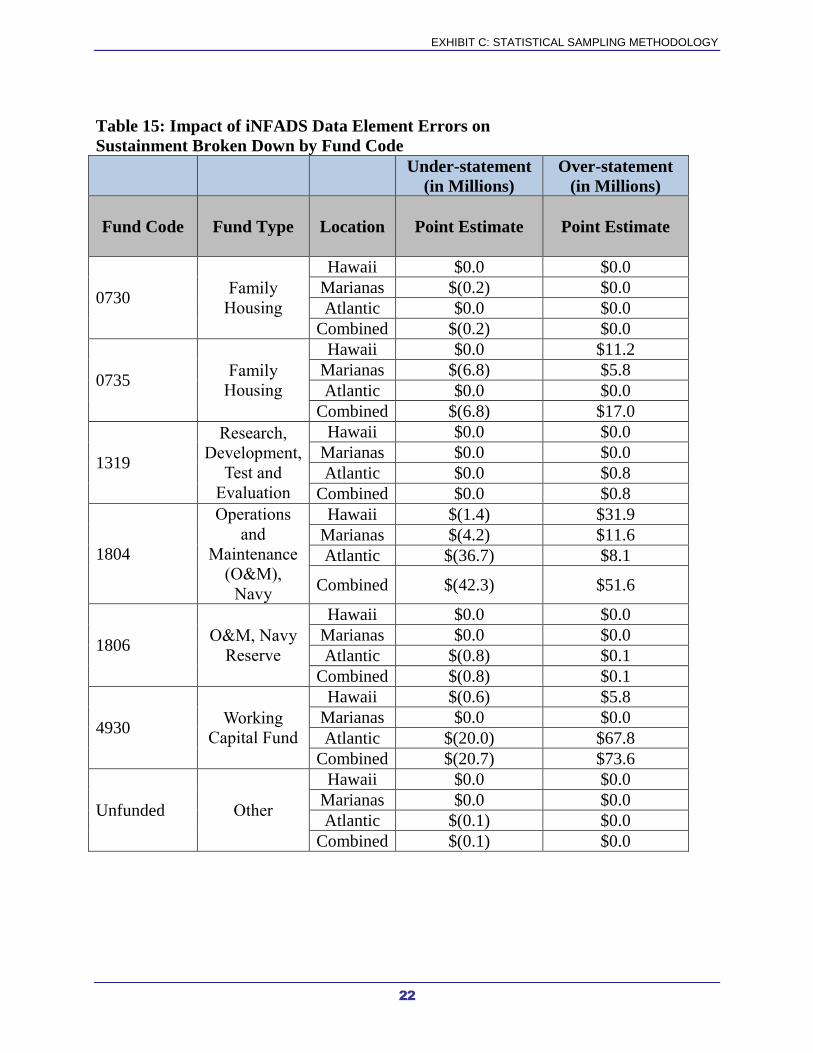
EXHIBIT C: STATISTICAL SAMPLING METHODOLOGY
22
Table 15: Impact of iNFADS Data Element Errors on
Sustainment Broken Down by Fund Code
Under-statement
(in Millions)
Over-statement
(in Millions)
Fund Code Fund Type Location Point Estimate Point Estimate
0730 Family
Housing
Hawaii $0.0 $0.0
Marianas $(0.2) $0.0
Atlantic $0.0 $0.0
Combined $(0.2) $0.0
0735 Family
Housing
Hawaii $0.0 $11.2
Marianas $(6.8) $5.8
Atlantic $0.0 $0.0
Combined $(6.8) $17.0
1319
Research,
Development,
Test and
Evaluation
Hawaii $0.0 $0.0
Marianas $0.0 $0.0
Atlantic $0.0 $0.8
Combined $0.0 $0.8
1804
Operations
and
Maintenance
(O&M),
Navy
Hawaii $(1.4) $31.9
Marianas $(4.2) $11.6
Atlantic $(36.7) $8.1
Combined $(42.3) $51.6
1806 O&M, Navy
Reserve
Hawaii $0.0 $0.0
Marianas $0.0 $0.0
Atlantic $(0.8) $0.1
Combined $(0.8) $0.1
4930 Working
Capital Fund
Hawaii $(0.6) $5.8
Marianas $0.0 $0.0
Atlantic $(20.0) $67.8
Combined $(20.7) $73.6
Unfunded Other
Hawaii $0.0 $0.0
Marianas $0.0 $0.0
Atlantic $(0.1) $0.0
Combined $(0.1) $0.0
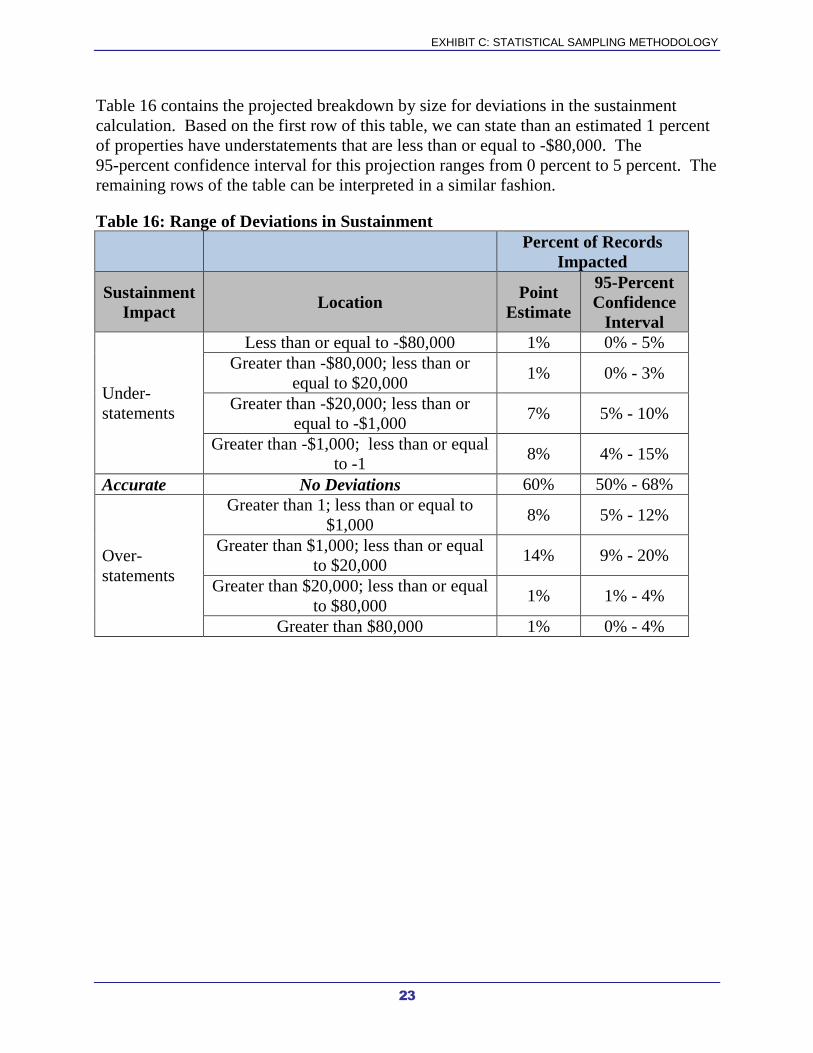
EXHIBIT C: STATISTICAL SAMPLING METHODOLOGY
23
Table 16 contains the projected breakdown by size for deviations in the sustainment
calculation. Based on the first row of this table, we can state than an estimated 1 percent
of properties have understatements that are less than or equal to -$80,000. The
95-percent confidence interval for this projection ranges from 0 percent to 5 percent. The
remaining rows of the table can be interpreted in a similar fashion.
Table 16: Range of Deviations in Sustainment
Percent of Records
Impacted
Sustainment
Impact Location
Point
Estimate
95-Percent
Confidence
Interval
Under-
statements
Less than or equal to -$80,000 1% 0% - 5%
Greater than -$80,000; less than or
equal to $20,000 1% 0% - 3%
Greater than -$20,000; less than or
equal to -$1,000 7% 5% - 10%
Greater than -$1,000; less than or equal
to -1 8% 4% - 15%
Accurate No Deviations 60% 50% - 68%
Over-
statements
Greater than 1; less than or equal to
$1,000 8% 5% - 12%
Greater than $1,000; less than or equal
to $20,000 14% 9% - 20%
Greater than $20,000; less than or equal
to $80,000 1% 1% - 4%
Greater than $80,000 1% 0% - 4%
24
Exhibit D:
Pertinent Guidance
Office of the Secretary of Defense (OSD), “Facilities Sustainment Model User’s
Manual,” (Version 12 Fiscal Years 2012-2017), dated February 2010. The purpose of
the manual is to provide information on the model used to calculate the sustainment
requirement, including the inputs, outputs and a description of the process. According to
the manual, the Facilities Sustainment Model calculates the theoretical annual
sustainment requirement for each facility in the official Department of Defense inventory
based on the type of facility, physical size of the facility, and the sustainment cost factor
for the type of facility.
OSD, “Facilities Sustainment Model-15, Business Rule Synchronization Matrix,”
Version 15.4. The purpose of this matrix is to identify all the steps needed to obtain the
sustainment requirement for the Navy. This document describes how the Facilities
Sustainment Model output (sustainment requirement) is generated from the Real Property
Assessment Database (RPAD) and the reference tables, which are embedded in the
document. It also highlights specific RPAD data elements that are used in the model,
which are fed from the Internet Navy Facility Assets Data Store.
Office of the Chief of Naval Operations Instruction 11010.20G, “Facilities Projects
Instructions,” dated 14 October 2005. This instruction provides policy and guidance
for the classification, preparation, submission, review, approval, and reporting of
facilities projects at Navy shore installations. According to the guidance, facilities
projects are prepared and executed in order to support the installation’s mission and to
meet the Navy’s goals. The instruction includes information on the four Classifications
of Work (repair, construction, maintenance, and equipment installation) and two Special
Interest Codes: Sustainment (ST), and Restoration and Modernization (RM).
Naval Facilities Engineering Command P-78, “Real Property Inventory Procedures
Manual,” dated July 2012. This publication outlines the responsibilities and procedures
for managing Department of the Navy Real Property Inventory (RPI) information.
According to the criteria, the validity of RPI is dependent on timely and accurate
reporting of real property information by Navy and Marine Corps installations. It also
states that a valid, authoritative RPI is critical to the development of: a clean financial
statement, military construction program, identification of resource requirements for
facilities management (Facilities Sustainment Model, Facilities Recapitalization Model,
etc.), interface with other Navy financial and management programs, and inventory of
real property under the control of the Department of the Navy.
25
Commander, Navy Installations Command, Washington, DC *
Naval Facilities Engineering Command, Headquarters, Washington, DC *
Note: For activities visited during the Real Property Inventory audits, please refer to Naval Audit Service
Reports N2014-0015, N2014-0019, and N2014-0027.
*Denotes Activity Visited
Exhibit E:
Activities Visited/Contacted

FOR OFFICIAL USE ONLY
FOR OFFICIAL USE ONLY
Use this page as
BACK COVER
for printed copies
of this document