Embed Size (px)
Citation preview
NAVAL MATERIALS
Strong stuff!

NAVAL MATERIALS
What: The stuff we build ships, subs and planes out of!
Why: 1) So we can determine the best material to build with.
2) So we can build an efficient (weight and $$) and strong structure.
NAVAL MATERIALS
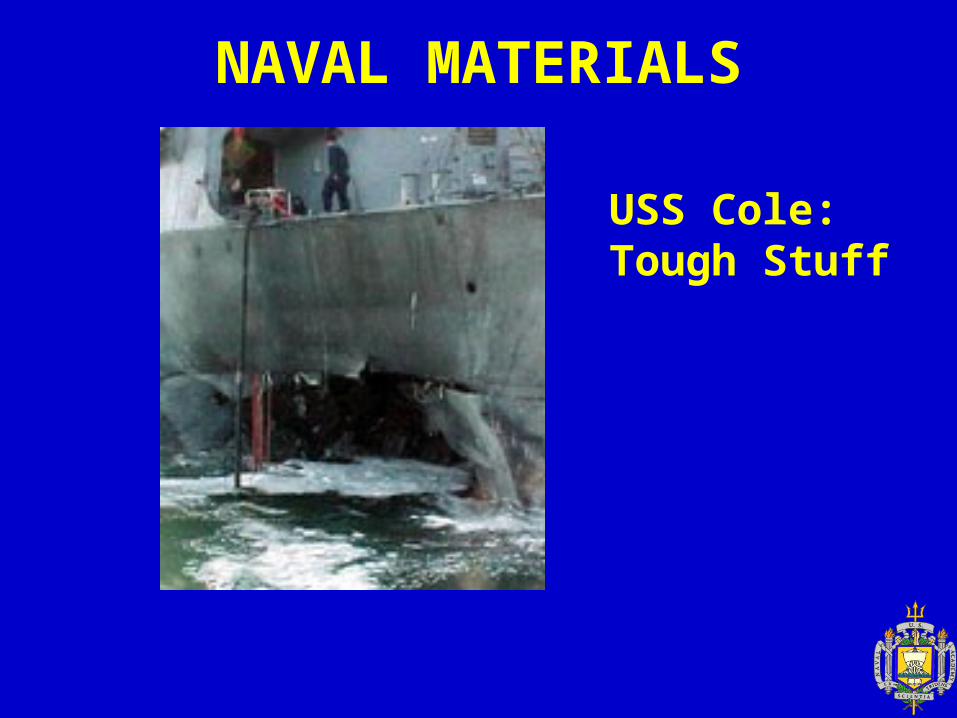
USS Cole:Tough Stuff
NAVAL MATERIALSClassifying Loads on Materials (5.1)
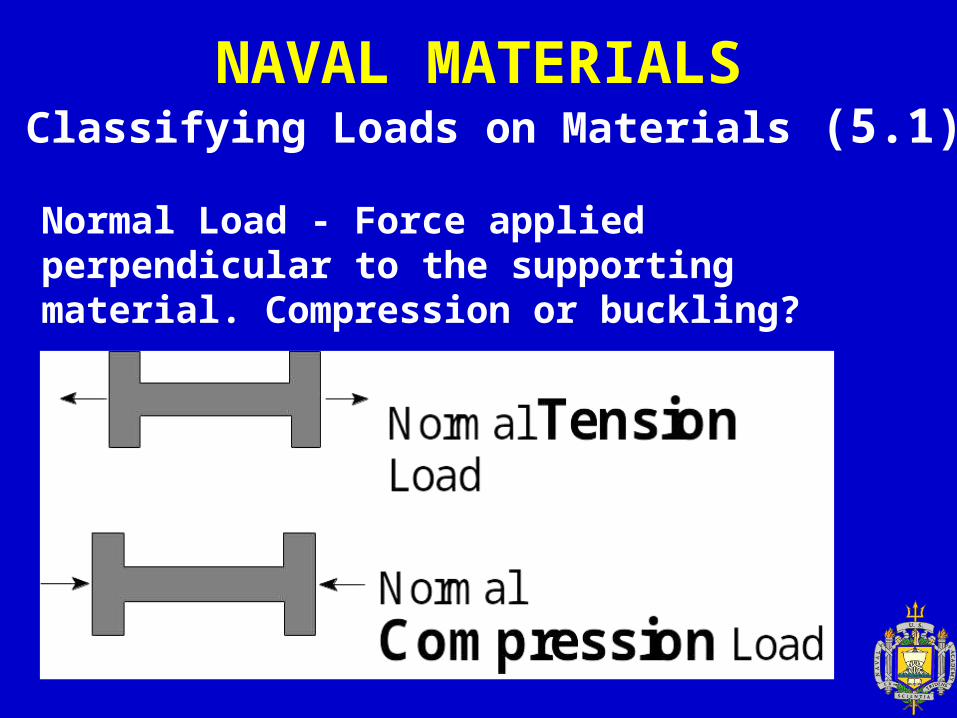
Normal Load - Force applied perpendicular to the supporting material. Compression or buckling?
NAVAL MATERIALSClassifying Loads on Materials (5.1)
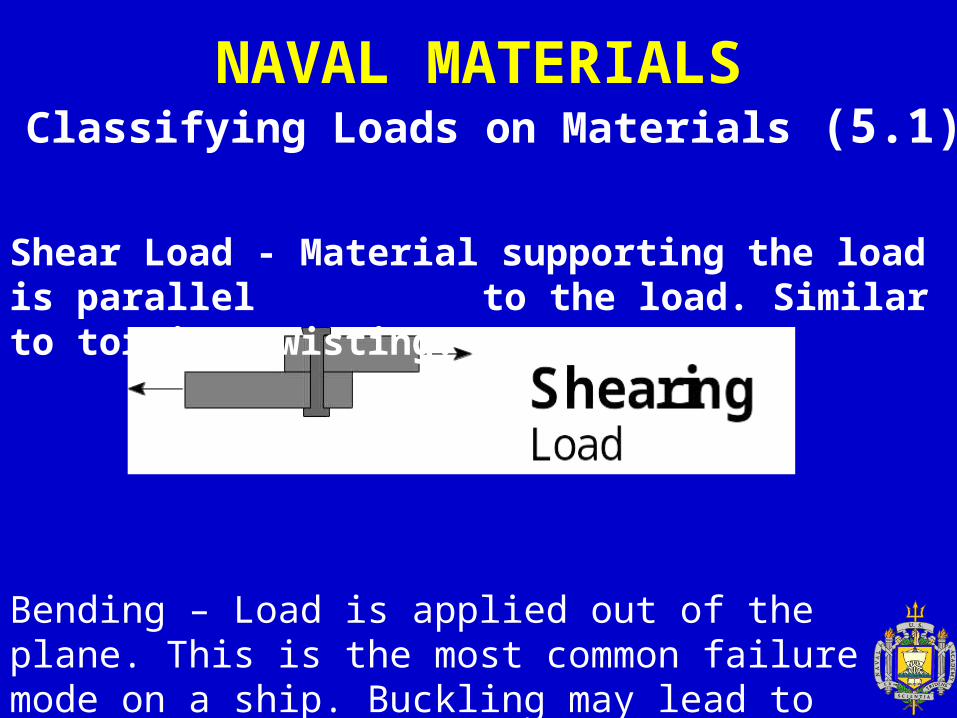
Shear Load - Material supporting the load is parallel to the load. Similar to torsion/twisting.
Bending – Load is applied out of the plane. This is the most common failure mode on a ship. Buckling may lead to bending.
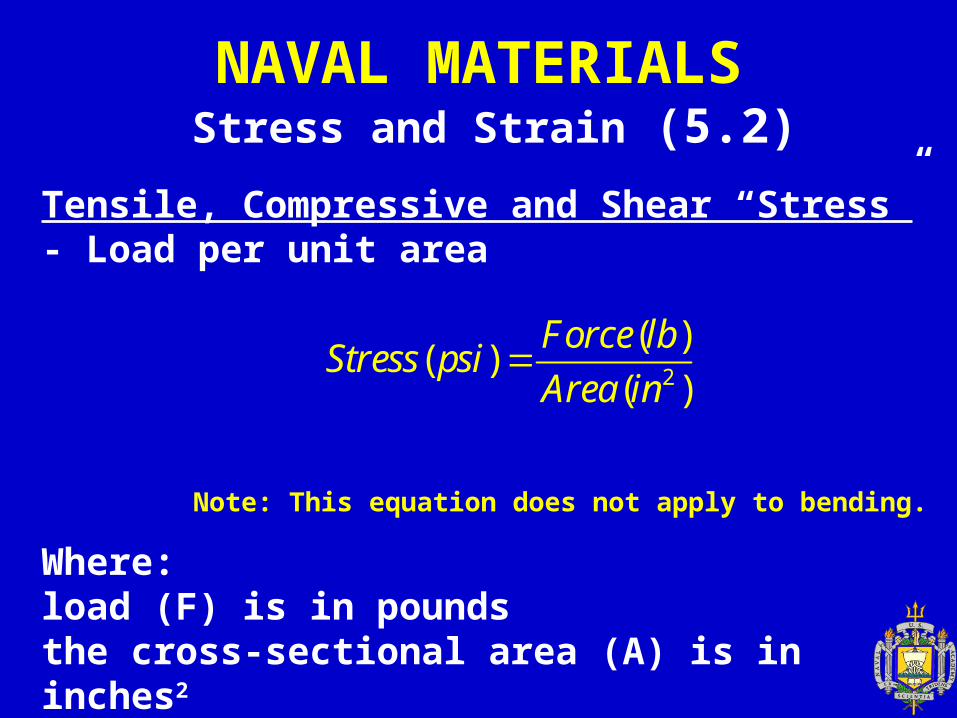
Tensile, Compressive and Shear “Stress” - Load per unit area
Where:load (F) is in poundsthe cross-sectional area (A) is in inches2 stress is in pounds per square inch (psi).
NAVAL MATERIALSStress and Strain (5.2)
Note: This equation does not apply to bending.
2
( )( )
( )
Force lbStress psi
Area in
NAVAL MATERIALS
Stress and Strain (5.2)
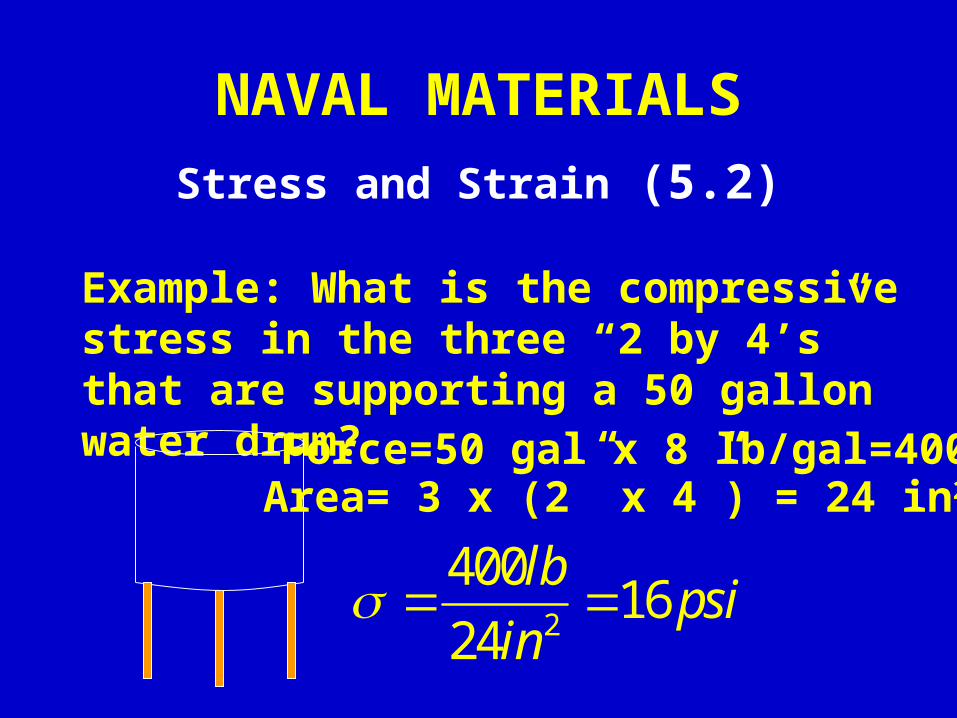
Example: What is the compressive stress in the three “2 by 4’s” that are supporting a 50 gallon water drum?
Force=50 gal x 8 lb/gal=400#Area= 3 x (2” x 4”) = 24 in2
2
40016
24
lbpsi
in

If a material is loaded, some elongation occurs.This is found by:
Where: L is the loaded length in feetL0 is the original length in feet.
Strain compares the elongation of a material to its original length (it is often measured in %):
NAVAL MATERIALSStress and Strain (5.2)
0e L L
0
e
L Ex: The strain for a 10 foot piece of
steel compressing 2.4” is 2.4/120=2%
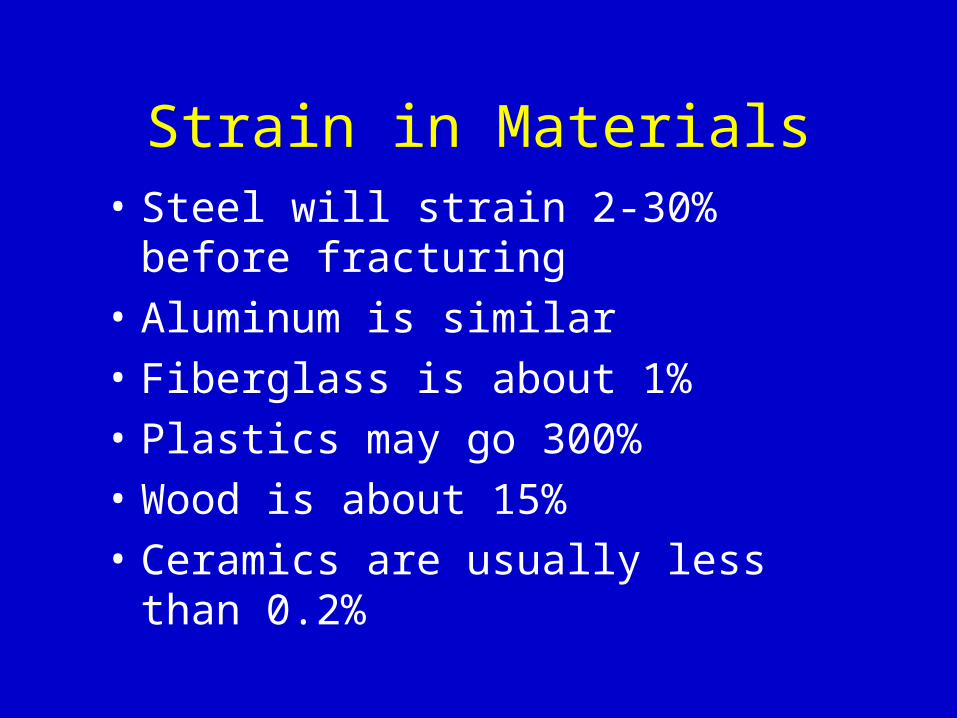
Strain in Materials• Steel will strain 2-30% before
fracturing
• Aluminum is similar
• Fiberglass is about 1%
• Plastics may go 300%
• Wood is about 15%
• Ceramics are usually less than 0.2%
NAVAL MATERIALSStress-Strain Diagram (5.3)
• The values of stress versus strain for a given material can be easily plotted. Relate the
stress/strain curve to the load/elongation curve.
• Evaluation of the diagram allows us to study the behavior of the material and assess its properties.
• Each material has a different stress-strain diagram.

NAVAL MATERIALS
Stress-Strain Diagram (5.3)
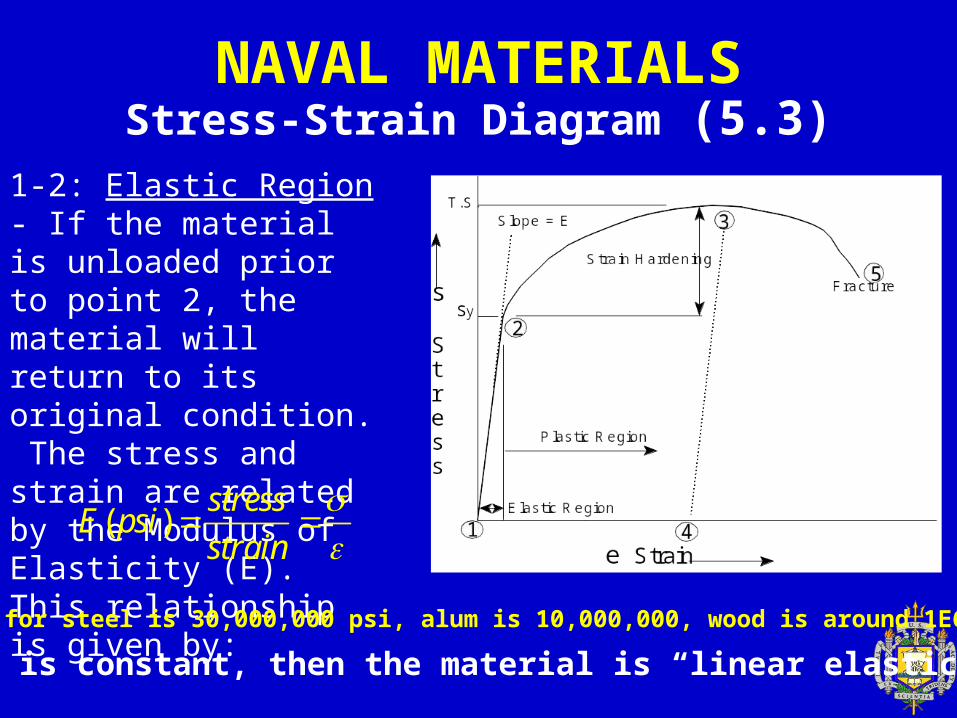
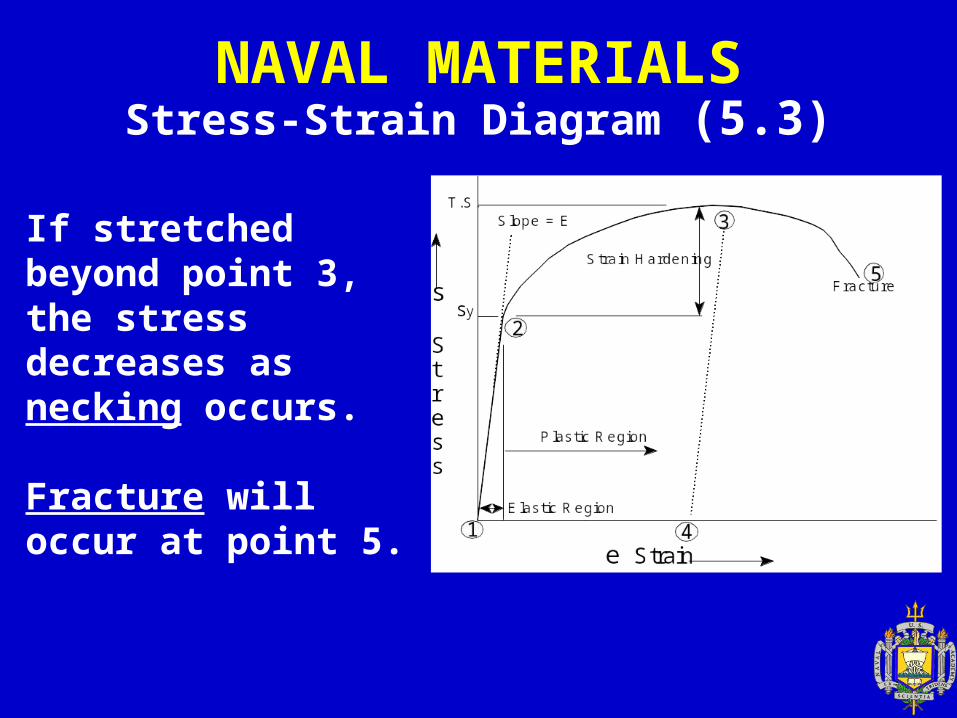
Note:1. Original unstressed condition.2. Yield Strength3. Tensile Strength5. Fracture Strength
NAVAL MATERIALSStress-Strain Diagram (5.3)
1-2: Elastic Region - If the material is unloaded prior to point 2, the material will return to its original condition. The stress and strain are related by the Modulus of Elasticity (E). This relationship is given by:
If E is constant, then the material is “linear elastic”
( )stress
E psistrain
E for steel is 30,000,000 psi, alum is 10,000,000, wood is around 1E6
NAVAL MATERIALSStress-Strain Diagram (5.3)
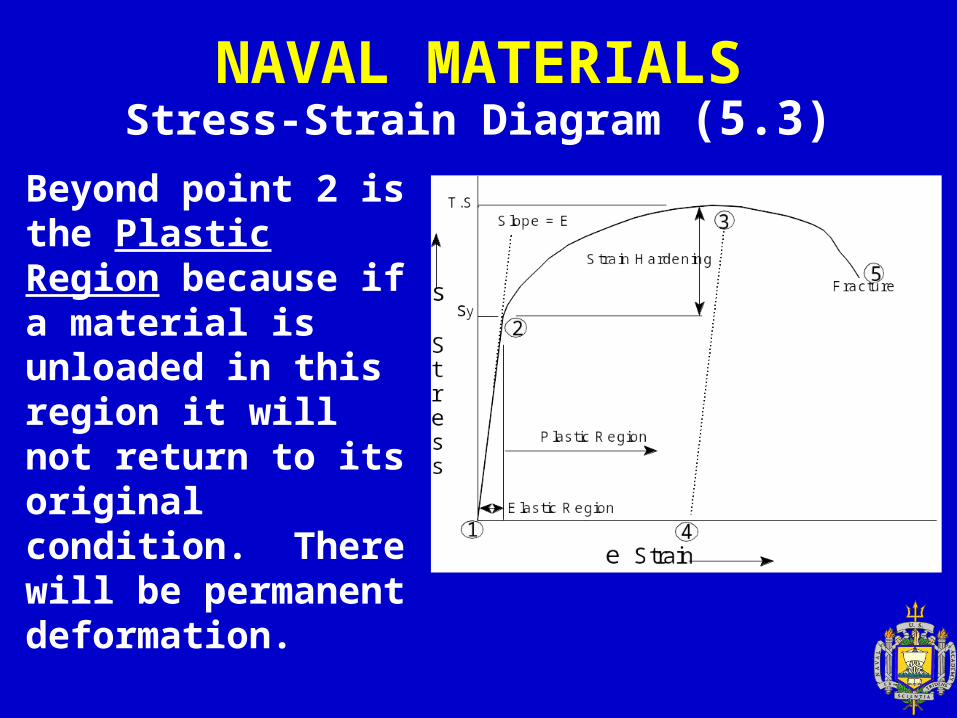
Beyond point 2 is the Plastic Region because if a material is unloaded in this region it will not return to its original condition. There will be permanent deformation.

NAVAL MATERIALSStress-Strain Diagram (5.3)
If the material was unloaded at point 3, its final condition would be at point 4. We know this because the behavior of the material would be in accordance to the Modulus of Elasiticity. The distance between points 1 and 4 indicate the amount of permanent deformation. On a ship this is called the hungry horse look.
NAVAL MATERIALSStress-Strain Diagram (5.3)
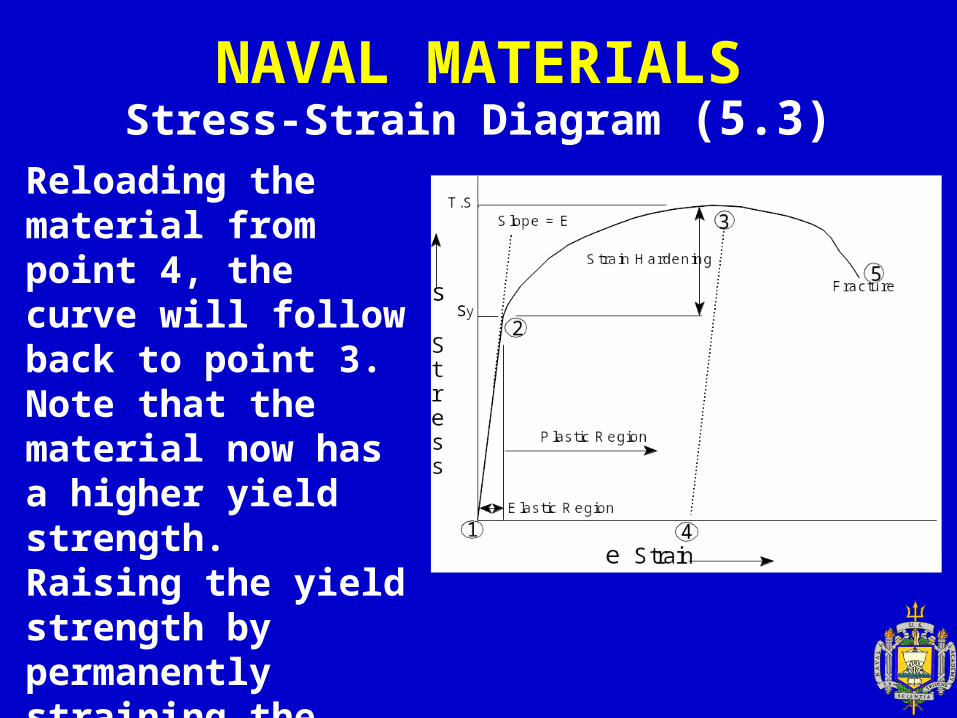
Reloading the material from point 4, the curve will follow back to point 3. Note that the material now has a higher yield strength. Raising the yield strength by permanently straining the material is called Strain Hardening.
NAVAL MATERIALSStress-Strain Diagram (5.3)
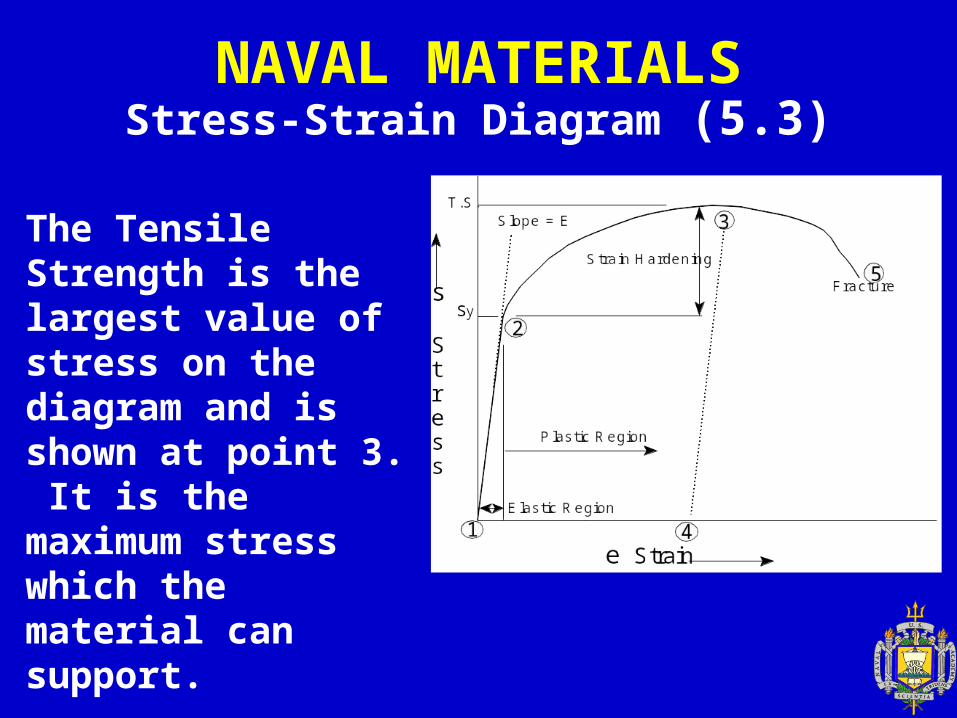
The Tensile Strength is the largest value of stress on the diagram and is shown at point 3. It is the maximum stress which the material can support.
NAVAL MATERIALSStress-Strain Diagram (5.3)
If stretched beyond point 3, the stress decreases as necking occurs.
Fracture will occur at point 5.
NAVAL MATERIALSMaterial Properties (5.4)
• “Material properties” describe the characteristics and performance of a material.
• For example, these are what we compare when approving a material for repairs.
NAVAL MATERIALSMaterial Properties (5.4)
• Strength (=the maximum allowable Stress) - is the ability to resist failure. Strength is quantified from points on the stress-strain curve:
• yield stress (y)(=max point of elastic range)
• ultimate tensile strength (UTS)(=max point on curve) – Carbon steels and metal alloys have higher strength
than pure metals. – Ceramics: high strength (but brittle).
• y ranges from 500 - 300,000 psi
• UTS ranges from 700 - 450,000 psi
NAVAL MATERIALSMaterial Properties (5.4)
• Hardness - A measure of the materials ability to resist plastic deformation (i.e. indentation, abrasion, and wear).
• Hardness is quantified by Rockwell, Brinnell, or other hardness tests.
– Indenter pressed into specimen and depth of penetration is measured and compared.
• Hardness and tensile strength are closely
related in metals.
NAVAL MATERIALSMaterial Properties (5.4)
• Ductility - Ability to plastically deform before failure.
• Measure by percent elongation (i.e. “Stretch”) of tensile test specimens.
• Examples include: some aluminum, low carbon steel.
• “Ductile” is the opposite of “brittle”.
NAVAL MATERIALSMaterial Properties (5.4)
• Brittleness - A measure of a material’s inability to deform before failure.
• Examples include glass, most composites, high carbon steels, and many ceramic materials.

NAVAL MATERIALSMaterial Properties (5.4)
Comparison of Brittle versus Ductile Material on a Stress-Strain Diagram
NAVAL MATERIALSMaterial Properties (5.4)
• Toughness - A measure of a material’s ability to absorb energy.
• Toughness is the area under the stress-strain curve. Units of toughness are in-lb/in3 (i.e. energy per unit volume). • Can also be relatively measured by a “Charpy
V-notch test”.
• What needs to be tough, versus strong?
NAVAL MATERIALSMaterial Properties (5.4)
• Charpy V-Notch Test:
– Single material: different specimens at different temperatures.
– Charpy tests evaluate the impact toughness of a material as a function of temperature.
– See Figure 5.6 for a picture of the test
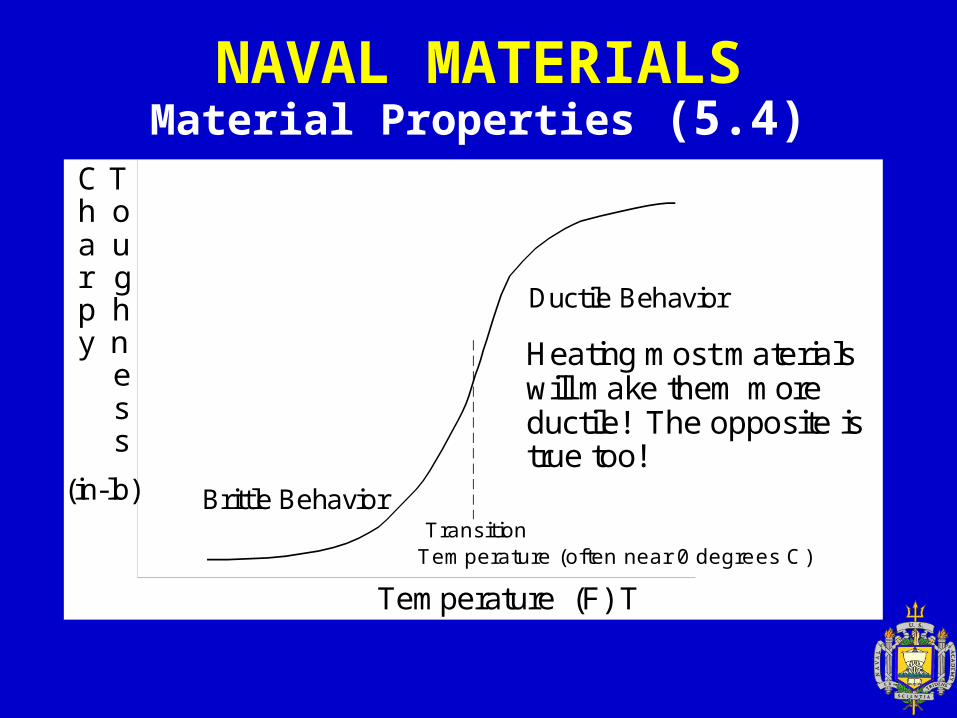
NAVAL MATERIALSMaterial Properties (5.4)
C Th oa ur gp hy n e s s
Temperature (F) T
Brittle Behavior
Ductile Behavior
(in-lb) Transition Temperature (often near 0 degrees C)
Heating most materialswill make them moreductile! The opposite istrue too!
NAVAL MATERIALSMaterial Properties (5.4)
• Low temps; material is brittle so little energy needed to fracture.
• At high temperatures, more ductile so greater energy to fracture.
• The Transition Temperature is the boundary between brittle and ductile behavior. Important parameter in metal selection!
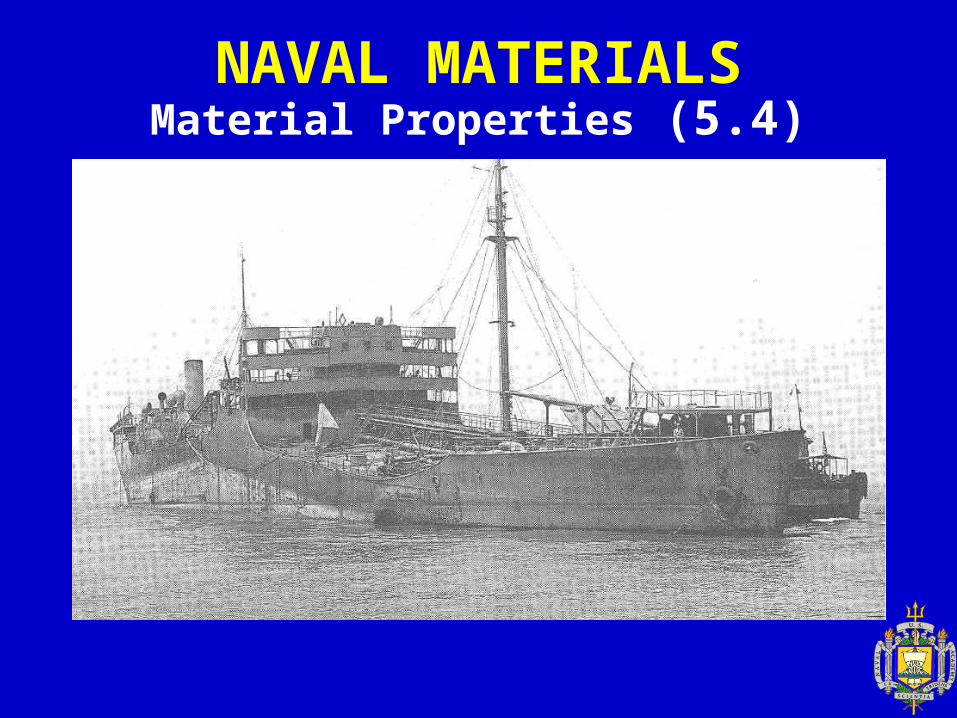
– Use alloys only in temps well above transition range or catastrophies like Liberty Ships in WWII
may happen again!
NAVAL MATERIALSMaterial Properties (5.4)
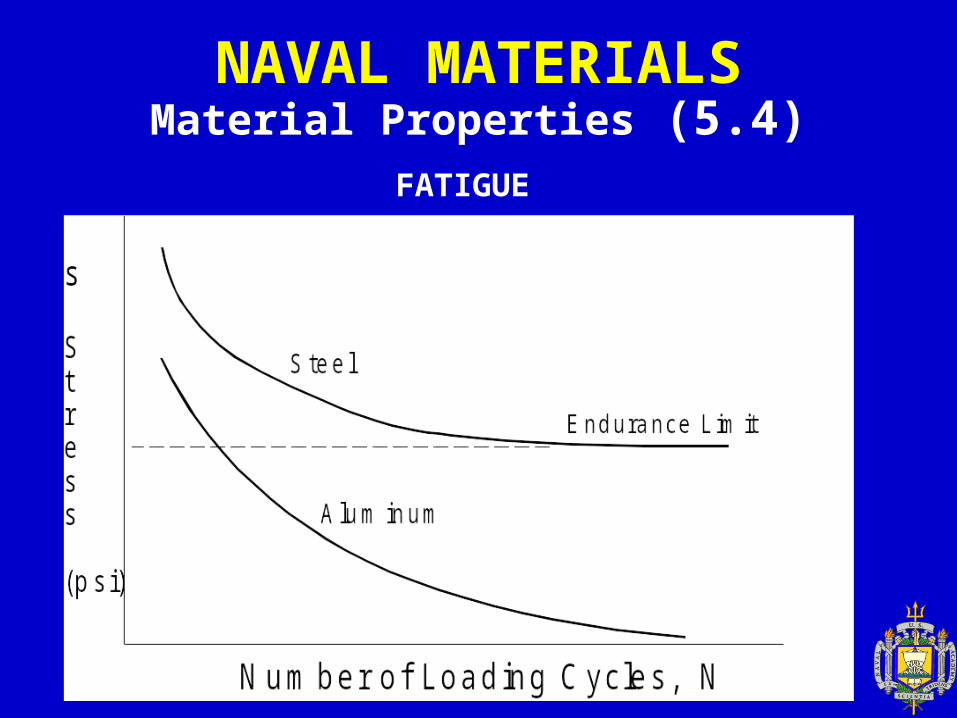
NAVAL MATERIALSMaterial Properties (5.4)
FATIGUE
NAVAL MATERIALSNon-Destructive Testing (5.5)
• Inspections for material defects to ensure quality control in acquisition and after installation.
• Three Most Common Tests for External (Surface) Defects are:
– Visual– Dye Penetrant– Magnetic Particle
NAVAL MATERIALSNon-Destructive Testing (5.5)
• Visual Testing (VT)
– Done during routine maintenance. “First line of defense.”
– Quick, easy, and cheap.
– Examines surface of a material only.

NAVAL MATERIALSNon-Destructive Testing (5.5)
Dye Penetrant Testing (PT)
NAVAL MATERIALSNon-Destructive Testing (5.5)
• Magnetic Particle Testing (MT)
– Ferromagnetic materials only.
– Align the filings with defects.
– Detects surface and shallow subsurface flaws and weld defects.
– Power source is required.
NAVAL MATERIALSNon-Destructive Testing (5.5)
• Three Most Common Test for Internal (Subsurface) Defects are:
– Radiographic (RT)
– Ultrasonic (UT)
– Eddy Current Tests
NAVAL MATERIALSNon-Destructive Testing (5.5)
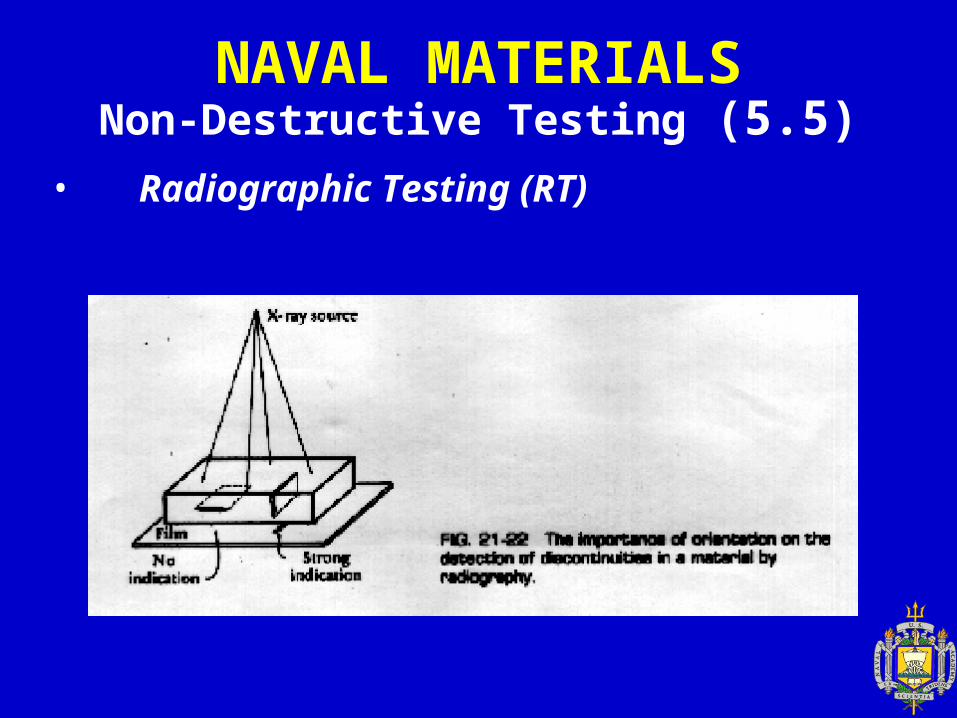
• Radiographic Testing (RT)
– Expose photographic film to x-ray sources.
– Detects internal flaws of thin or thick sections and provides a permanent
record.
– Requires trained technicians and presents radiation hazards during testing.
NAVAL MATERIALSNon-Destructive Testing (5.5)
• Radiographic Testing (RT)

NAVAL MATERIALSNon-Destructive Testing (5.5)
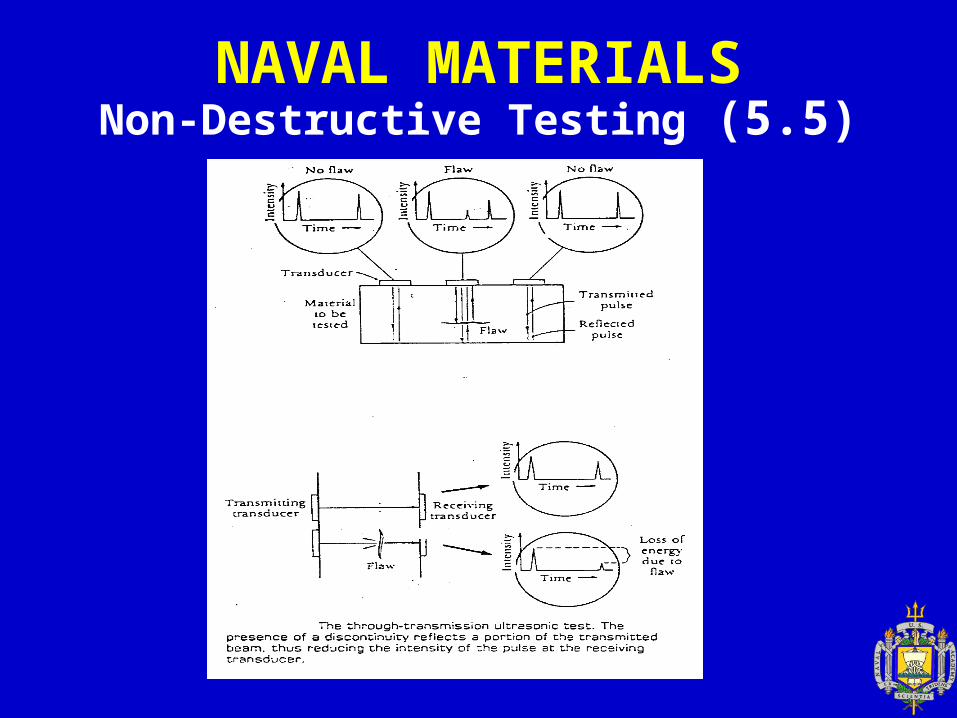
• Ultrasonic Testing (UT)
– Sends sound waves through a material.
– Good for all metals and nonmetallic items.
– Detects deep flaws in tubing, rods, and joints.
– Equipment is portable but requires a trained technician.
NAVAL MATERIALSNon-Destructive Testing (5.5)
NAVAL MATERIALSNon-Destructive Testing (5.5)
• Eddy Current Testing
– Involves magnetic field variations.
– Detects seams and cracks in tubing.
– Good only for limited penetration depth on very conductive materials.
– Being replaced by ultrasonic testing.
NAVAL MATERIALSNon-Destructive Testing (5.5)
• Additional Non Destructive Test which you are likely to encounter:
Hydrostatic Test.
– A system is isolated and pressurized.
– Inspected for leaks or the ability to hold pressure.