Embed Size (px)
Citation preview
■pp^"
Aü
NAVAL PERSONNEL AND TRAINING RESEARCH LABORATORY
' , SAN DIEGÖ. CALIFORNIA 92152
TECHNICAL BULLETIN STB 72-2 SEPTEMBER 1971
A MONTE CARLO STUDY OF THL= SAMPLING DISTRIBUTION OF THE LIKELEHOOD RATIO FOR MIXTURES OF MULTINORMAL DISTRIBUTIONS
John H. Wolff«
APPROVED FOR PUBLIC RELEASE; DISTRIBUTION UNLIMITED.
D'DICO.
s^r. ■
Reproduc«! by NATIONAL TECHNICAL INFORMATION SERVICE
Spnnflfi.W, V.. M151
_______
'" -M«.«»» I II „.J
UNCLASSIFIED S»^it^^l»»»ific»Uoi^
DOCUMENT CONTROL DATA R&D lS*curity ctmiaitication ol till; body of mb»lrmci mnd ind^ning miwtmUm ti>u*i br tnfrpd when r/ia ovvrmll report la clmflUid)
t ORIGINATING AC Ti vi TV fCorpor«r« «urftor;
Naval Personnel & Training Research Laboratory San Diego, California 92152
2«. «EPOR T SECURi TV CLASSIFICATION
UNCLASSIFIED 2b. GROUP
3. fICPORT TITLE
A MONTE CARLO STUDY OF THE SAMPLING DISTRIBUTION OF THE LIKELIHOOD RATIO FOR FOR MIXTURES OF MULTINORMAL DISTRIBUTIONS
4 DESCRiP T i VE NOTES (Typ* o/ tepoti and in
B AU THOR(SI (Flrat nmmm, middle Inlllml, l*»l nsmw)
John H. Wolfe
6. REPORT DATE
September 1971 •«. CONTRACT OR CHANT NO
b. PROJEC T NO
7m. TOTAL NO OF PAGES
14 7ft NO or REFS
7 t«. ORIGINATOR"» REPORT NUMSERfSl
STB 72-2
•b. OTHER REPORT NOISt (Any other number» thml mmy b« matttned thta report)
10. OI1TRIOUTION STATEMENT
This docutaent h^s been approved for public release and sale; Its distribution Is unlimited.
II. SUPPLEMENTARY NOTES 12. SPONSORING MILI TARV ACTIVITY
Chief of Naval Personnel (Pers-AS) Navy Department Washington, D. C. 20370
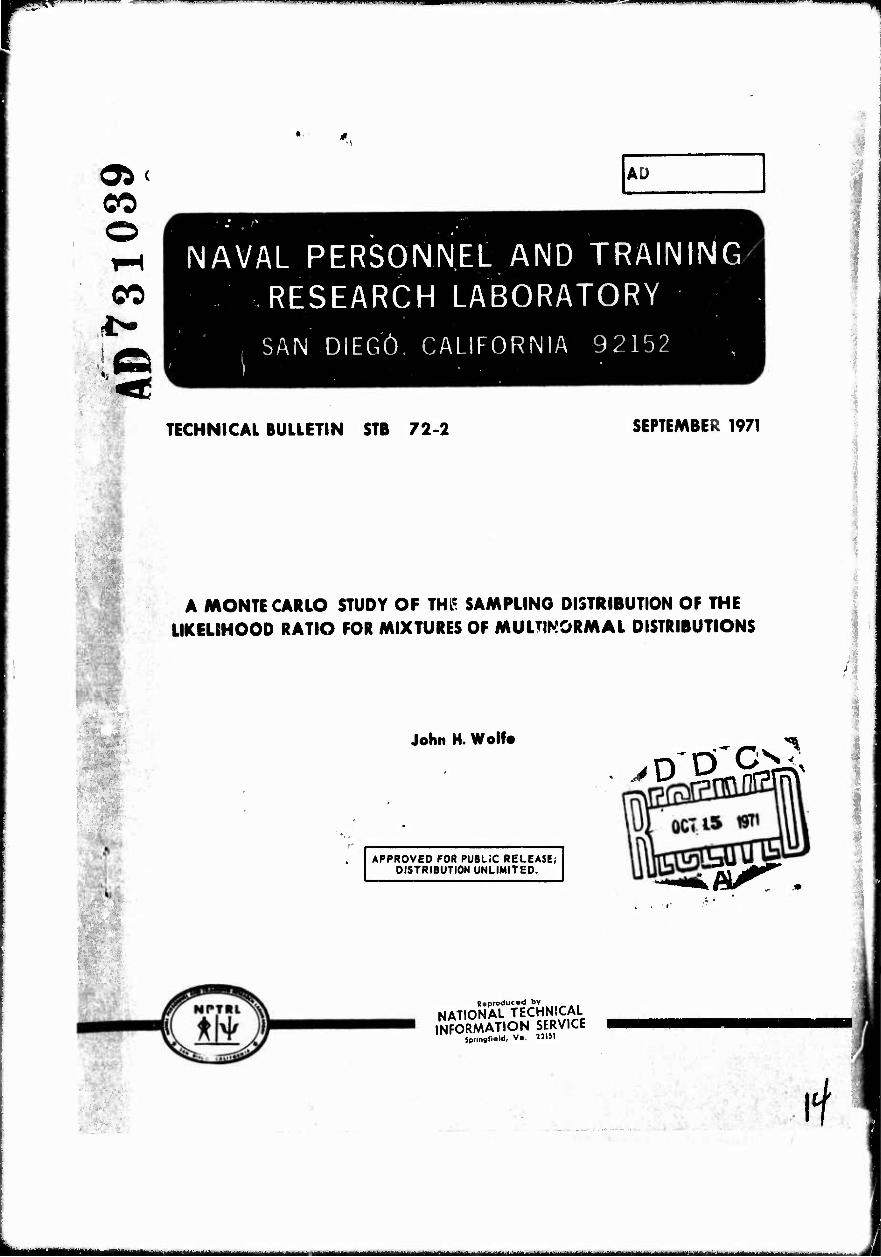
Samples from spherical normal distributions were generated and fitted to hypothesized mixtures of normal distributions using the 360 NORMIX computer program for maximum likelihood estimation of the parameters of a mixture of multinomial distributions with a common covarlance matrix. The results suggest that the logarithm of the likelihood ratio, when multiplied by the coefficient / 2 r ' - —(N-l-nt- Y ) is distributed approximately as chl-square with degrees of freedom
twice the number of variables times the difference In the numbers of hypothesized clusters. ,
- h /.. )
DD ,'.r..1473 S/N 0101-807.680 1
(PAGE 1 ) UNCLASSIFIED ' Securilv Classification
KJIllilliliiliHllMMWIfir-m &0MM* «tOlUlril^aeWf^-J- Ü* .«** - -
L
HI . i iv^^H^
UNCLASSIFIED »«curlly CI««itfic»tton
KCV WORD«
Cluster Analysis NORMIX Mixtures of Distributions Hypothesis Testing Multivarlate Statistics Likelihood Ratio
DD .^..1473 B*«» (PAGE 2)
OL« 1 WT •lOLI | WT ■OLt I WT
UNCLASSIFIED CU»lflcatlon
, ■' • ~**i*AUJi
lUilMril 1 in ■..! I ii <■ -l»ii. ■i.M^iin
' " ' ' '■ l"1 ' ■■■■"■■ ■'
mmmmmmmm
AD
A MONTE CARLO STUDY OF THE SAMPLING DISTRIBUTION OF THE LIKELIHOOD RATIO FOR MIXTURES OF MULTINORMAL DISTRIBUTIONS
by
John H. Wolfe
September 1971
Technical Bulletin STB 72-2
Submitted by
m • Richard C. Sorenson, Ph.D., Director Statistical Analysis and Computer Applications Department
Approved by
Earl I. Jones, Ph.D., Technical Director Karl E. Kuehner, Commander, USN
Commanding Officer
This document has been approved for public release and sale; its distribution is unlimited
Naval Personnel and Training Research Laboratory San Diego, California 92152
A LABORATORY OF THE BUREAU OF NAVAL PERSONNEL
■ ■--*-• ■ —
— ■ - - ■ -
:
■
SUMMARY
A. Problem
To estimate the numbers of clusters of individuals necessary to account for their distribution of test profiles.
.
B. Background and Requirements
Classification and predictions of performance of enlisted men in A-School training requires appropriate statistical description of the joint distribu- tion of their test scores and performance criteria. The usual assumptions of multivariate normality may not be appropriate. In such cases prediction may be improved by clustering the men into several groups, each of which has a normal distribution of scores. The problem solved by this research is how many such clusters to use.
C. Approach
Several hundred random samples from spherical normal distributions were generated by a computer pseudo-random number generator. The samples were fitted to one, two, or three clusters by the NORMIX procedure, and the likelihood ratios computed for alternative hypotheses concerning the numbers of clusters.
D. Findings
The results suggest that the logarithm of the likelihood ratio, when 2 r' multiplied by the coefficient - n<N-l-m- ■*•) is distributed approximately
as chi-square with degrees of freedom twice the number of variables times the difference in the numbers of hypothesized clusters. This formula has been incorporated in the significance estimates of the NORMIX 360 computer program.
E. Conclusion
Likelihood ratios for mixture problems are not distributed as chi-square with degrees of freedom equal to the number of variables; instead doubling the degrees of freedom seems to give a better fit to the sampling distri- bution.
F. Recomnendations
The formula given in this paper should be used with caution as a guide- line in estimating the number of clusters in a sample, (p. 4)
REVERSE SIDE BLANK
• ■
«M^MMM.

11 I.I II I . I.,.. _
■"»''I
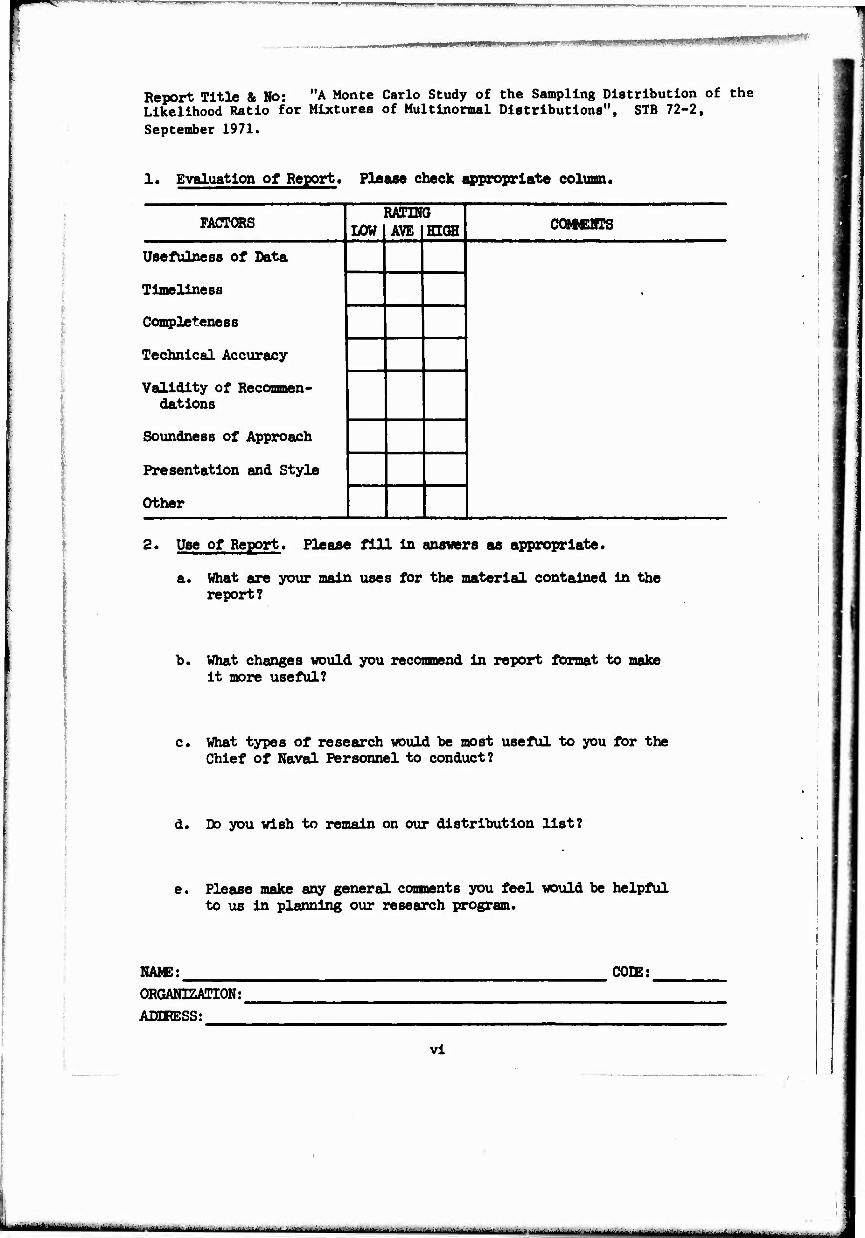
REPORT USE AMD EVALUAUON
Feedback from consumers Is a vital element In improving products so that they tetter respond to specific needs. To assist the Chief of Naval Personnel in future planning, it is requested that the use and evaluation form on the reverse of this page be completed and returned. The page is preaddressed and franked; fold in thirds, seal with tape, and mall.
Department of the Navy Postage and Fees Paid Navy Department
Official Business
Commanding Officer Naval Personnel and Training Research Laboratory San Diego, California 92152
- —L.
^^ "■ ".""»■'i i ^IIIII mwwti J ■!»■ " " »..iiW^tf l'i" m „„mmm ■ i n—i ■- 1 1
Report Title & Mb: "A Monte Carlo Study of the Sampling Distribution of the Likelihood Ratio for Mixtures of Multinomial Distributions", STB 72-2,
September 1971.
1. Evaluation of Report. Please check appropriate column.
FACTORS i TOWI RAUN
AVE 1 8 HIGH COMCRCS
Usefulness of Data
Timeliness •
Completeness
Technical Accuracy
Validity of Reconnnen- datlons
Soundness of Approach
Presentation and Style
Other
2. Use of Report. Please fill in answers as appropriate.
a. What are your main uses for the material contained in the report?
h. What changes would you recommend in report format to make it more useful?
c. What types of research would be most useful to you for the Chief of Naval Personnel to conduct?
d. Do you wish to remain on our distribution list?
e. Please make any general comments you feel would be helpful to us in planning our research program.
NAMS:
ORGANIZATION:
ADDRESS:
vi
CODE:
■MMMM^^M^MM - -
wwmvimmw •* w'.wiy^^r-t
TABLE OF CONTENTS
Page
Sununary iii Report Use and Evaluation (Authorized Tear-Out Form) v
I. INTRODUCTION 1
II. METHOD 2
III. RESULTS 3
IV. CONCLUSION 3
References 6
Distribution 7
LIST OF TABLES
1. Adjusted Likelihood Ratios for Random Normal Data 4
2. Percentage Frequencies of Chi-Square Probabilities for Random Normal Ratio 5
vii REVERSE SIDE BLANK
— ,..,.., —... .... , . . i

mm .MWIWH HIWII*
A MONTE CARLO STUDY OF THE SAMPLING DISTRIBUTION OF THE LIKELIHOOD RATIO FOR MIXTURES OF MULTINORMAL DISTRIBUTIONS
I. INTRODUCTION
A previous paper (Wolfe, 1970) presented a maximum-likelihood estimation
procedure for mixtures of distributions. The method tries to fit the data
to a distribution which is composed of a mixture of a hypothesized number
of component distributions. The obtained likelihood is a measure of the
degree of fit. The (null) hypothesis of r clusters can be compared with
the hypothesis of r' > r clusters by computing the likelihood ratio
X = L /L ,. This ratio should provide all the information necessary to
test the hypothesis of r clusters against the alternative r' clusters,
provided we know the sampling distribution of the likelihood ratio under
the null hypothesis.
Wilks (1938) showed under certain regularity conditions that -2 log X
is asymptotically distributed as chi-square with degrees of freedom equal
to the difference in the number of parameters between the restricted and
unrestricted hypotheses. Hogg (1956) proved under certain conditions
where the range of the parent distribution is a function of the parameters
that -2 log X is distributed exactly as chi-square with degrees of freedom
equal to twice the difference in the number of parameters. Bartlett (1947)
investigated the problem of testing for equality of r means in multivariate
analysis of variance. He improved Wilks* result for small samples by using
where
(2 = -2 C log X,
C = 1 (N.L üill)
degrees of freedom ■ m(r'-l),
m ■ number of variables, and N = sample size.
In a previous paper (Wolfe, 1970) Wilks' formula performed poorly in
testing the number of components in the Fisher-Iris problem and in the
"Artificial Clusters" problem. In each case the Wilks" test rejected the
null hypothesis when it was true.

■— '—-I~— ■ ■'" —* ii mmm m, .,
A little reflection indicates several points where the conditions are
not satisfied for Wilks' theorem to hold. Wilks assumes that the null
hypothesis defines a parameter subspace u CQ , consisting of points of
the form (6,,..., 9,, 8.. Äf...e«^) where 0^ Ä,..., 6.^ have fixed x r T*ito r »o r*i»o rto
values and lie in the interior of some open set where the liKelihood
function has a unique maximum. In the mixture problem, however, the null
hypothesis is that the mixing proportions '«^.i» 1Kr+2*"'' %" are e(lual
to zero, which is at the boundary of a closed set [0,1]. When the mixing
proportions are zero the corresponding means cannot be estimated since the
likelihood function is completely flat, i.e. unchanged for different values
of those means. The probability density function of r' types involves
r'(m+l) parameters. For each of the r" types there is one parameter for
the mixing proportion and m parameters for the means of that type. Never-
theless the comparison of r' against r'-l types can be accomplished by
imposing only one restriction that f *• 0. Alternatively, m constraints
can be inposed on the means so that two types have the same means. In
this case, it is impossible to estimate the relative proportions of the
two types since the likelihood function will be flat for * »+ •.- i "
constant.
II. METHOD
The present paper is concerned with a Monte-Carlo investigation of the
sample distribution of -2C log X for mixtures of normal distributions when
the null hypothesis is true that the "mixture" contains only one component.
The pseudo-random normal deviate generator used in this study con-
sisted of the Lewis, Goodman, and Miller (1969) subroutine for uniform
random variables followed by the IBM (1968°) subroutine NDTRI for producing
the inverse of the normal distribution function.
Using this normal deviate generator, samples from spherical normal
univariate, bivariate, and 22-variate distributions were produced. The
sample sizes were 100, 100, and 113, respectively. One hundred univariate,
one hundred bivariate, and one hundred 22-variate samples were generated.
These samples were run through the 360 N0RMIX computer program (Wolfe,1971)
to obtain likelihoods for hypotheses of one type, two types, and three
types, assuming the types share a common covariance matrix.
■
"■HI" ' '■■■■■■■■'- .-.. --^ .;. ■■-„, . , ,_
;
.
.
—- ' '"" lu"' ■ ■■'"'
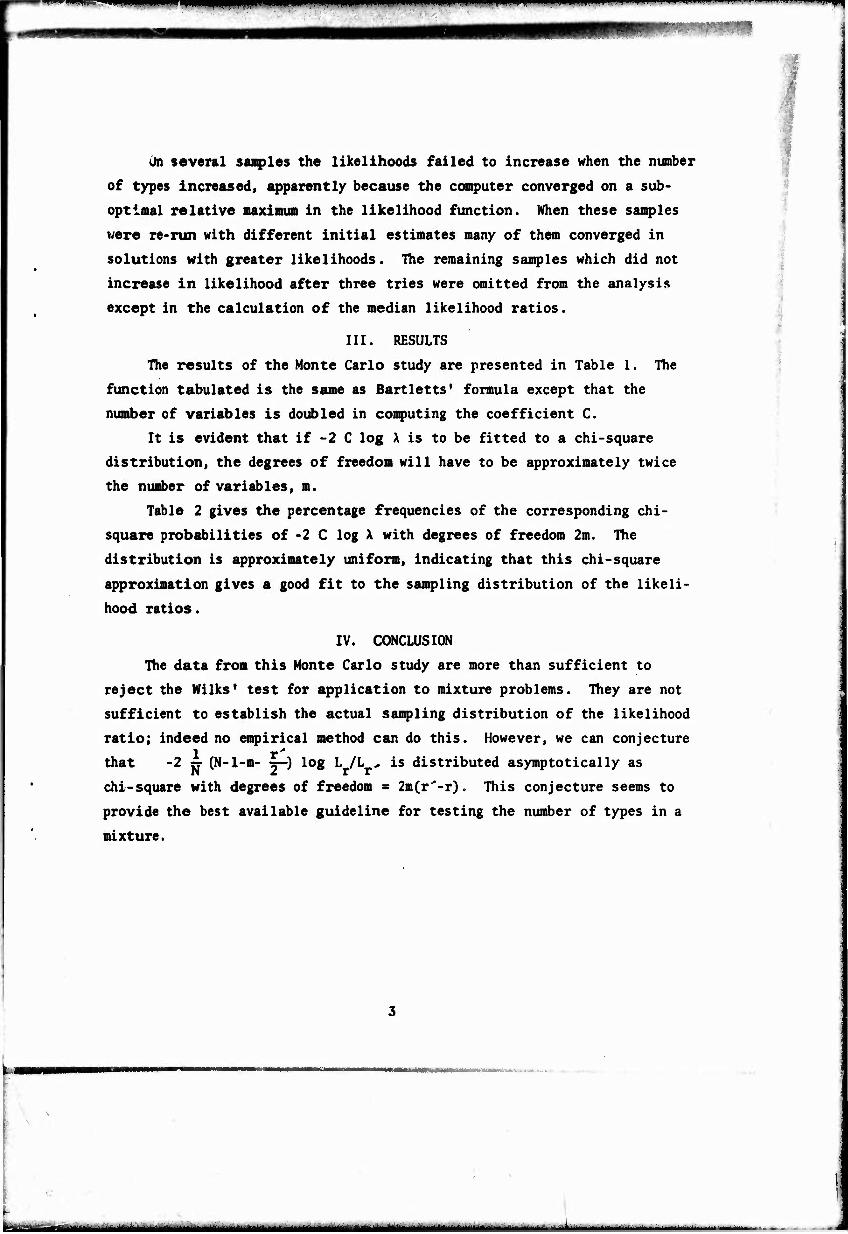
On several saaples the likelihoods failed to increase when the number
of types increased, apparently because the computer converged on a sub-
optimal relative maximum in the likelihood function. When these samples
were re-run with different initial estimates many of them converged in
solutions with greater likelihoods. The remaining samples which did not
increase in likelihood after three tries were omitted from the analysis
except in the calculation of the median likelihood ratios.
III. RESULTS
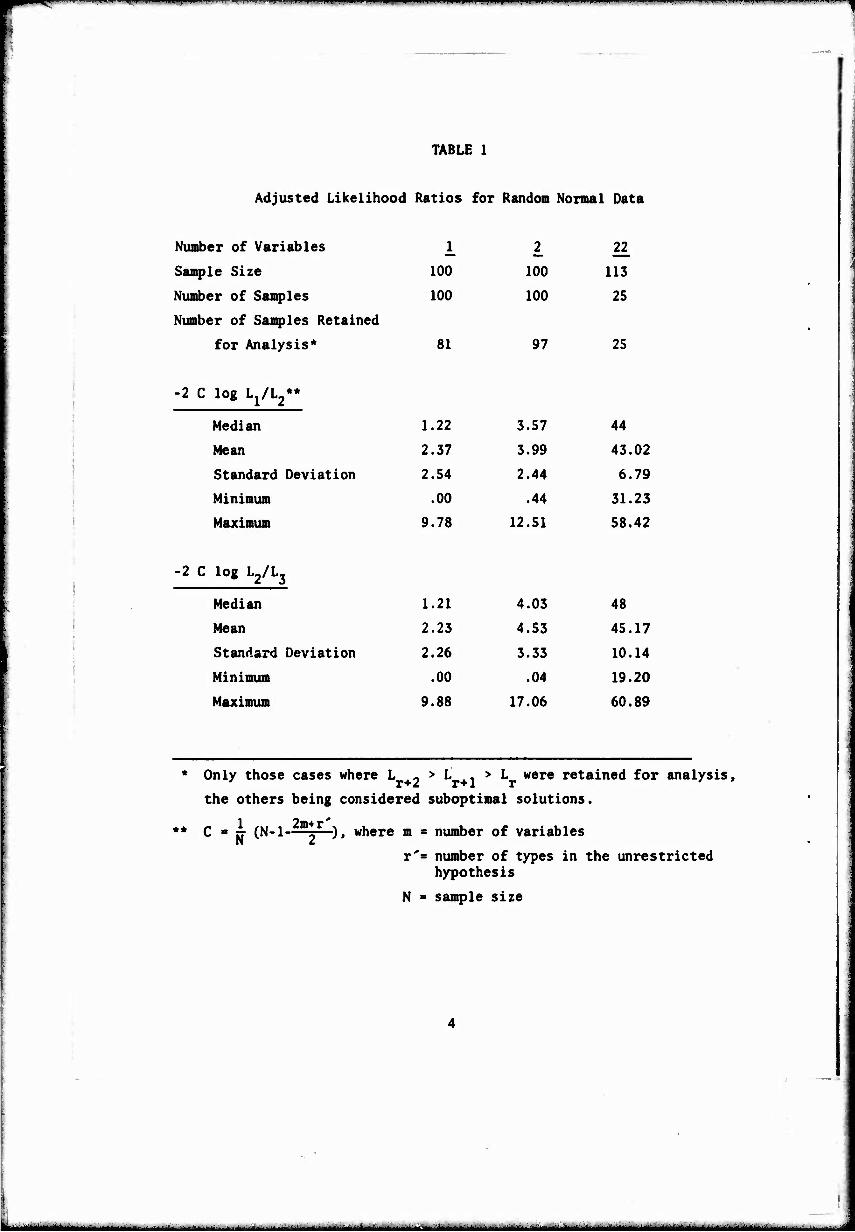
The results of the Monte Carlo study are presented in Table 1. The
function tabulated is the same as Bartletts' formula except that the
number of variables is doubled in computing the coefficient C.
It is evident that if -2 C log A is to be fitted to a chi-square
distribution, the degrees of freedom will have to be approximately twice
the number of variables, m.
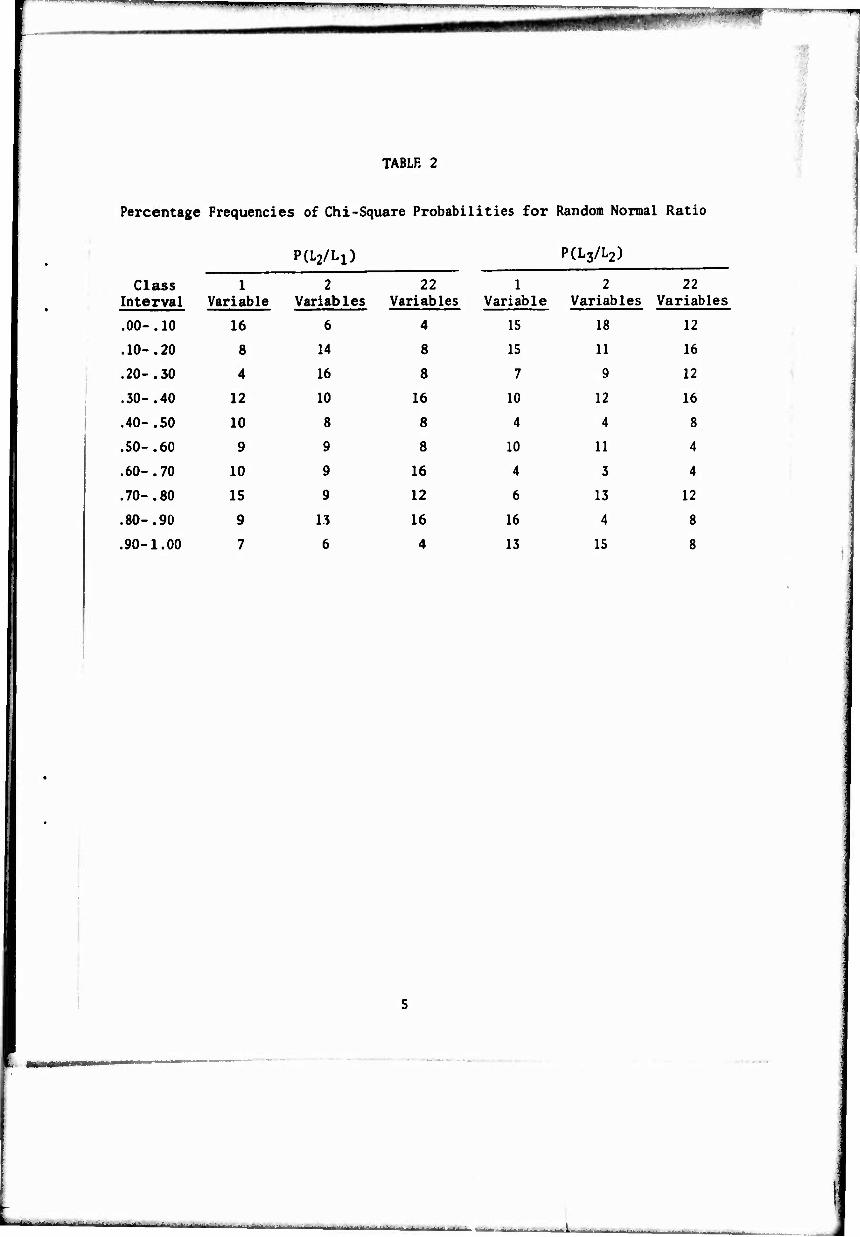
Table 2 gives the percentage frequencies of the corresponding chi-
square probabilities of -2 C log A with degrees of freedom 2m. The
distribution is approximately uniform, indicating that this chi-square
approximation gives a good fit to the sampling distribution of the likeli-
hood ratios.
IV. CONCLUSION
The data from this Monte Carlo study are more than sufficient to
reject the Wilks* test for application to mixture problems. They are not
sufficient to establish the actual sampling distribution of the likelihood
ratio; indeed no empirical method can do this. However, we can conjecture 1 r' that -2 sr (N-l-m- •=—) log L /L , is distributed asymptotically as
chi-square with degrees of freedom = 2m(r'-r). This conjecture seems to
provide the best available guideline for testing the number of types in a
mixture.
- --
—' wmmmmmmm 1 ■■■'■■ * 1 ■- ■■"
TABLE 1
Adjusted Likelihood Ratios for Random Normal Data
Number of Variables 1_ 2 22
Sample Size 100 100 113
Number of Samples 100 100 25
Number of Samples Retained
for Analysis* 81 97 25
•2 C log Lj/L^*
> Median 1.22 3.57 44
Mean 2.37 3.99 43.02
Standard Deviation 2.54 2.44 6.79
Minimum .00 .44 31.23
Maximum 9.78 12.51 58.42
-2 C log L2/L3
Median 1.21 4.03 48
Mean 2.23 4.53 45.17
Standard Deviation 2.26 3.33 10.14
Minimum .00 .04 19.20
Maximum 9.88 17.06 60.89
♦ *
Only those cases where LA->L', >L were retained for analysis, T*£ r+i r
the others being considered suboptimal solutions.
C » rr (N-l—m*r-), where m • number of variables N Z
T'- number of types in the unrestricted hypothesis
N ■ sample size
■■ ■ ■ .. - .
—™,—,—~—■ I -.l.-
—-^
TABLE 2
Percentage Frequencies of Chi-Square Probabilities for Random Normal Ratio
P(L2/L1) PCLj/Lz)
Class Interval
1 Variable
2 Variables
22 Variables
1 Variable
2 Variables
22 Variables
.00-. 10 16 6 4 15 18 12
.10-. 20 8 14 8 15 11 16
.20-. 30 4 16 8 7 9 12
.30-. 40 12 10 16 10 12 16
.40-. 50 10 8 8 4 4 8
.50-. 60 9 9 8 10 11 4
.60-. 70 10 9 16 4 3 4
.70-. 80 15 9 12 6 13 12
.80-. 90 9 13 16 16 4 8
.90-1.00 7 6 4 13 15 8
^— ^ ■" • ' I ■
REFERENCES
Bartlett, M. S., "Multivariate Analysis" J. Royal Statistical Society Supplement. 1947, 9(B), 176-197.
Hogg, R. V., On the distribution of the likelihood ratio. Annals of Mathematical Statistics, 1956, 27, 529-532.
IBM (1968) System/360 Scientific Subroutine Package (360A-CM-03X) Version III Programmer's Manual H-20-0205, IBM Technical Publications Depart- ment, White Plains, N. Y.
Lewis, P. A. W., Goodman, A. S., and Miller, J. M. "A pseudo-randan number generator for the System/360." IBM Systems Journal, 1969, 8^, 136-146.
Wilks, S. S. The large-sample distribution of the likelihood ratio for testing composite hypotheses. Annals of Mathematical Statistics, 1938, 9, 60-62.
Wolfe, John H. "Pattern clustering by multivariate mixture analysis." Multivariate Behavioral Research, 1970, 5^, 329-350.
Wolfe, John H. NORMIX 360 Computer Program. (Research Memorandum 72-4), September 197TT Naval Personnel and Training Research Laboratory^ San Diego, California 92152. (Available by sending a blank magnetic tape to author, specifying 9 or 7 track, EBCDIC or BCD).
-■"■- —- • —-—-' -------
****■ ^^^m
DISTRIBUTION
Chief of Naval Personnel (Pers-llb) (Pers-A3) (Pers-A32) (Pers-N23)
Chief of Naval Research (Code 432), Arlington, Virginia Director, Personnel Research § Development Laboratory Chief, Research Division, Office of Research § Development Smithsonian Institution Commanding Officer § Director, Naval Ship Research § Development Center Personnel Management Development Office, 0P0, Department of the Army U. S. Civil Service Commission Library U. S. Employment Service, U. S. Department of Labor Human Factors Operations Research Laboratory, Air Force Systems Command Center for Naval Analyses, Arlington, Virginia Chief of Naval Operations (OP-01)(2)
(OP-98TL) Commander Naval Air Test Center, Service Test Division (Code 35A) Commanding Officer, Naval Examining Center, Great Lakes Naval Research Laboratory, Operations Research Branch Superintendent, Naval Postgraduate School, Monterey Office of the Assistant Secretary of Defense (Manpower) Commander, Personnel Research Laboratory, Aerospace Medical Division,
Air Force Systems Command, Lackland Director of Research, United States Military Academy, West Point, New York Director, Human Resources Research Office, Alexandria, Virginia Library of Congress, Science § Technical Division Office of the Assistant Chief of Staff (G-l) Headquarters, U.S. Marine Corps Commander, Naval Electronics Laboratory Center Chief of Naval Research (Code 458) (2) U.S. Army Behavior § Systems Research Laboratory, Arlington, Virginia Director, Defense Documentation Center, Alexandria, Virginia (12) Chief of Naval Air Training (Code 017), Naval Air Station, Pensacola,
Florida
REVERSE SIDE BLANK
* . „ mMmmt^^mm^mmtm ■ - -- ■ ,-...-■... ^^•«■■MBtefek^ut^Muatek i