Embed Size (px)
Citation preview

Naval Training Systems Center
NAVTRASYSCEN 85-C-0044-2
SIMULATOR DESIGN AND INSTRUCTIONALFEATURES FOR CARRIER LANDING:A FIELD TRANSFER STUDY
D. P. Westra. G. Lintern,D. 3. Sheppard. K. E. Thomley,R. Mauk. D. C. Wightman,and W. S. Chambers
I.J
I
NAVTRASYSCEN 85-C-0044-2
SIMULATOR DESIGN AND INSTRUCTIONALFEATURES FOR CARRIER LANDING:A FIELD TRANSFER STUDY
D. P. Westra, G. Lintern,D. J. Sheppard, K. E. Thomley°R. Mauk, D. C. Wightman,and W. S. Chambers
Submitted by:Essex Corporation1040 Woodcock Road 7e-•-i,.', •,POrlando, Florida 32803 H-
1FAPrepared for: INaval Training Systems CenterOrlando. Florida 32813
contract N6i339-05-C-0044 ¶i ''e
Interim Final Report for the Period26 April 1985 - 25 April 1988
K
DOD DISTRIBUTION STATEMENT
Approved for public release;distribution unlimited.
-- __ ___ ____ ___ ____ ___ ____ ___ ____ ___ ____ I'

NAVTRASYSCEN 85-C-0044-2
GOVERNMENT RIGHTS IN DATA STATEMENTReproduction of this publication inwhole or in part is permitted forany purpose of the United States
Goenet

UNCLASSIFIlED
SECURITY CLASSIFICATION OF THIS PAGE
REPORT DOCUMENTATION PAGEI. L~¶CgLyf 6 CLASSIFICATION 1b. RESTRICTIVE MARKINGS
2*- SECURAITY CLASSIFICATION AUTHORITY 3. DISTRIOUTION/AVAILAOILITY OF REPORT
___________________________________ Approved for public release;2b, CECLASSIFICATION/UOWNGRADING SCHEDULE distribution unlimited
*4. PF RFORMING ORGANIZATION REPORT NUMBER(S) S. MONITORING ORGANIZATION REPORT NULMBER(S)
NAVIRASYSCEN 85-C-0044-2IAk
6&. NAME OF PERFORMING ORGANIZATION 6b. OFF ICE SYMBOL 7a. NAME OF MONITORING ORGANIZATION
Essex Corporation (I ptc l)Naval Training Systems Center
6c. ADDRESS (City. State and ZIP Code) 7b. ADDRESS (City, State and 7IP Code)
1040 Woodcock Road, Suite 227Orlando, FL 32803 Orlando, FL 32813
So. NAME OF FUINDING/SPONSORING jOb. OFFICE SYM130L 9, PROCUREMENT INSTRUMENT IDENTIFICATION NUMBERORGANIZATION I (11 applicable)
Naval Air Systems Command J________ N61339-85-C--0044
ac. ADDRESS (City. State and ZIP Code) 10. SOURCE OF FUNDING NOS.
Washington, DC 2036"1 PROG RAM PflOjI!CT TAK WORK UNITELEMENT NO0. No. No. NO.
___________________________________ N637-33N SP-01 0785-2P3 47801 1. TI TLE ftn.2'Ide Secwtfy Classificationl
(See Continuation Page) I12. PERSONAL AUTHOR(S) D. P. Westra, G. Lintern, D. J. Sheppard, K. E. Thomley, R. Mauk,
D. C. Wightmian, and W. S. ChambersAGCON13&- TY~PE "NF (IrtaQAT 13b. TIME COVERED 14. DATE OF REPORT (Yr.. %to.. Day) 1.PG ON
Fia FROM4/_ TOIL4/88- 18 June 1986 86 -16. SUPPLEMENTARY NOTATION
17. COSATI COOES i. SUBECT TERMS (Continue on reverse if nccestary and Identify by block number)
05 08 Sc____ ene detail, Incremental transfer, Backward chaining,14 02 Vsual Technologyv Research Simulator MVRS)
19. ABSTRACT (Contlinue on reverse ifneceshary und identity by block number)
.A transfer-of -training experiment was conducted as/\the--culminatiol of thle carrierUlanding behavioral research program at the Visual Technology Research Simulator CVTRS).:.,at the Naval Training Systems Center-(-NAV-T-RASYSCEN) in Orlando>-Florida. 'fhe -resul ts"
-of this experiment, provide information on the design and use of simu-lators. for trainingthe aircraft carrier landing task' 'The results')also provide input on design issuesfor the Navy's new T-45 training ýystem(-ýT-45TS)>- Two visual display variables andtwo simulator training variables were selected for inclusion in this experiment: scenedetail (day contrasted with night); field of view (wide versus narrow); approach type(circling, modified straight-in or segmented); and number of simulator trials (20, 40,or 60). A total of"'72 student pilots were trained on the VTRS prior to going throughthe Field Carrier Landing Practice (FCLP) phase of their pilot training program. TheA).Crformance of these students at FCLP was contrasted with that of a group of 54 students'who did not receive simulator training. Results show that sýtudents trained in the
20. OISTRI BUTION/AVAILABILITY OF A6STHACT 21. ABSTRACT SeURITY CLASSIFICATION
UNCLASSIFIED/UNLIMITE D tSAME AS nPT: OTIC uscns 0 UNCLASSIF IED
22&. NAME OF RESPONSIBLE INDIVIDUAL 22b, TELEPHOINE NUMBER 22c. OFFICE SYMBOL
DennisC. Wigtman 0dta Area Code)DensC Wgtin(30(I5_c646-5130 N732
DD FORM 1473, 83 APR EDITION OF I JAN 73 IS OBSOLETE. UNCLASSIFILEDSURITY CASSIFICATION OF THIS PAGE

UNCLASSIFIEDSECURITY CLASSIFICATION OF THIS PAGE
11. (Title): Simulator Design and Instructional Features for Carrier Landing:
A Field Transfer Study (UNCL.ASSIFIED)
19. Abstract (Continued)-~-'simulator performed better at FCLP thanstudents.•tn-the control group.>There was no
transfer advantage for those trained with a daytime high-detail scene compared tothose trained with a lower cost nighttime low-detail scene. Tnere was-at notransfer advantage for those trained with a wideifield of viewicompared to thosetrained with the lower cost narrow field-of-view scene. Transfer performance wasbetter for thestudents who had 40/or 60 simulator trials than for-t-he-,students whohad 20 simulator trials. The pilots who trained with a segmented approach scheduledid as well or better on transfer to FCLP than those training with the modifiedstraight-in approach schedule or all circling approaches. The segmented approachschedule is recommended as it involves the least time in the simulator.
Ii
I.
UNCLASSIFIEDSECURITY CLASSIFICAYION OF THIS PAGE

Ti
NAVTRASYSCEN 85-C-0044-2
TABLE OF CONTENTS
Section Page
I IINTRODUCTION ..................................... I
Research Plan .................................... 1
II METHOD ............................................ 9
Apparatus ........................................ 9Procedure ........................................ 12Simulator Flight Tasks ........................... 13Simulator Factors and Levels ..................... 13Simulator Performance Measurement ................... 17Field Performance Measurement ....................... 18Experimental Design .............................. 19
III SIMULATOR TRAINING DATA .......................... 21
Analysis of Simulator Training Data ................ 21Training Performance Results ..................... 21
IV ANALYSIS PROCEDURES' FOR TRANSFER DATA .............. 27
Measurement Error .................................. 2Missing Data ..................................... 28Data Editing ..................................... 29Flight Means ..................................... 29Late Transfers................................... 29Analysis of Transfer Data ........................ 30
V TRANSFER RESULTS ................................. 33
Glideslope Performance ........................... 34Lineup Performancee ............................... 37LSO Grades ....................................... 41Carrier Qualification Scores ..................... 44Other Results .................................... 44
VI DISCUSSION/VECOMMENDATIONS ....................... 49
Judging the Size of Effects ...................... 49The VTRS Experimental Factors ....................... 52Recommendations for T-45 Training System ......... 56
V I i SUMMARY .......................................... 59
REFERENCES ....................................... 61
APPENDIX A - FRESNEL LENS OPTICAL LANDINGSYSTEM ........................................... 65
APPENDIX B - INSTRUCTOR AIDS ....................... 67
APPENDIX C - FIELD PERFORMANCE MEASUREMENT ....... 75

NAVTRASYSCEN 05-C-0044-2
LIST OF ILLUSTRATIONS
1igure e_
I Simulated Day Carrier Scene ...................... 10
2 Simulated Night Carrier Scene .................... 10
3 Overhead View of Typical Daytime CirclingCarrier Landing Pattern and ModifiedStraight-in Approaches ............................ 14
4 Alternative Field-of-View Display Plots
for Carrier Landing ............................... 16
A-I Carrier Approach Geometry Depicting FLOLSProjection of Glideslope DeviationInformation ......................................... 66
B-1 Instructor/Operator Station ...................... 69
B-2 Layout of Format C ............................... 70
B-3 Layout of LSO Display .............................. 72
C-i A T-2C About to Track Down During FCLP ........... 76
C-2 HYTAL Tracking Head as Mounted in the VanReady for Glideslope Tracking .................... 77
C-3 Two Views of the Retroreflector Mounted ina T-2C Landing Light Housing ..................... 78
C-4 Measurement of Relative Ground Height atTest Reflector and HYTAL Head by theWater Level Method ................................ 80
C-5 FLOLS Calibration Procedure Used by LandingSignal Officers to Set the FLOLS Glideslope ...... 81
C-6 Moving Average Filter Mechanization .............. 85
C-7 Calculation of Height of Main WheelsAbove Touchdown .................................... 86
C-8 Top View of Range of Retroreflector fromthe HYTAL Head ..................................... 86
NAVTRASYSCEN 85-C-0044-2
LIST OF TABLES
S:~TablIe
I. Experimental Factors for a VTRS CarrierLanding Non-Transfer Experiment .................. 3
2 Experimental Factors for a VTRS Within-Simulator Carrier Landing TransferExperiment ......................................... 5
3 Simulator Factors and Constants .................. 17
4 Statistical Significance of the LearningEffect in Training Trials for SelectedPerformance Measures .............................. 22
5 Summary of Main Effects and Significant inter-actions of Scene Detail, Field of View, andNumber of Training Trials: Training De ta ......... 23
6 Analysis of Variance Summary and Mear.s forSegmented and Modified Straight-in Groups onthe Third Ouartile of Training Trials:Glideslope Tracking .............................. 24
7 Analysis of Variance Summary and Means forApproach Type Groups on the Fourth Quartileof Training Trials: Lineup Tracking .............. 25
8 Summary of Time Between VTRS Training andStart of FCLP ...................................... 30
9 Flight Means at FCLP for Glideslope Variabilityfrom 3100 to 100 Feet from Ideal Touchdown ....... 35
10 Analyses of Variance for FCLP GlideslopeVariability from 3100 Feet to 100 Feet fromIdeal Touchdown ................................... 36
11 Flight Means at FCLP for Percent TimeWithin +75 Degrees of Center Line from 3100to 100 Feet from Ideal Touchdown ................. 39
12 Analyses of Variance for FCLP Lineup TOTScores from 3100 to 100 Feet from IdealTouchdown .......................................... 40
13 Flight Means for Lineup TOT Scores for theApproach SegIleits 3100 tO ii00 Feet and 1100to 100 Feet from Touchdown ........................ 41

NAVTRASYSCEN 85-C-0044-2
LIST OF TABLES (continued)
Table Page
14 Flight Means at FCLP for LSO Grades .............. 42
15 Analyses of Variance for FCLP LSO Grades .. . . . . . . . 4 3
16 Carrier Qualification Grade Means forthe Experimental Groups ........................... 45
17 Analysis of Variance for CarrierQualification Grades ............................. 46
10 Group Membership of Recycled Pilots.............. 48
19 Recommendations for Other SimulatorDesign Options ................................... 57
B-i Instruments Displayed in Format C ................ 71
B-2 Performance Measures Plotted in therLSO Dispi,, 7.......................................I
NAVTRASYSCEN 05-C-0044-2
SECTION I
1 NTRODUCT I ON
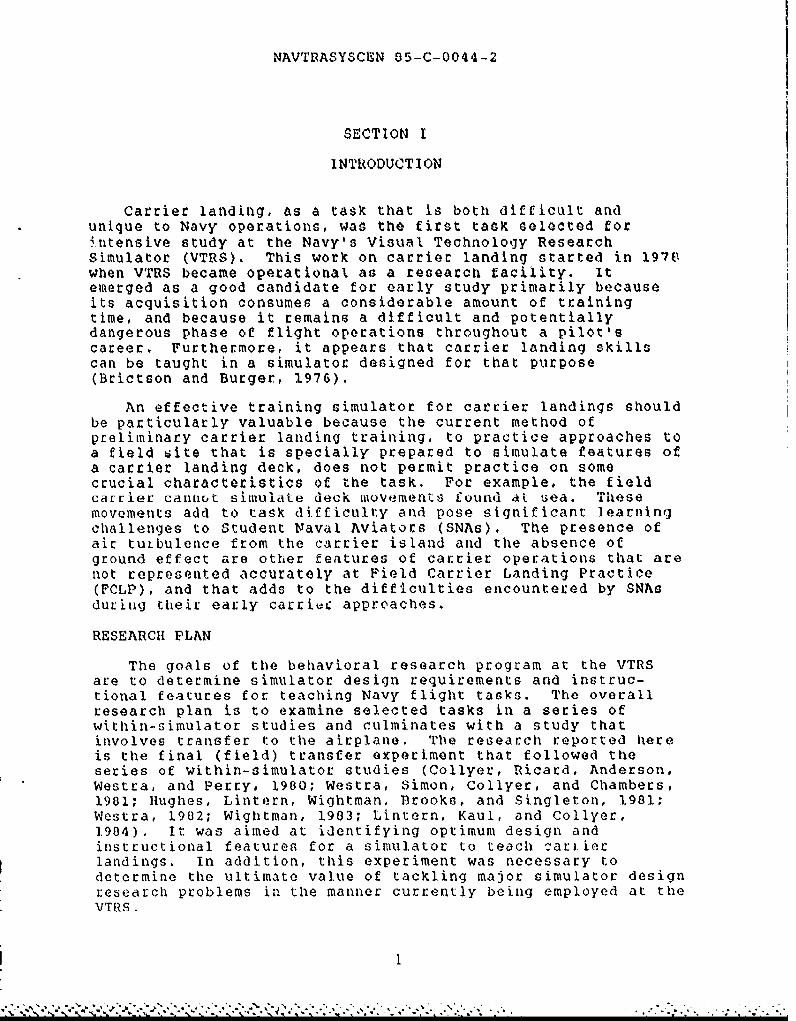
Carrier landing, as a task that is both difficult andunique to Navy operations, was the first task selected forintensive study at the Navy's Visual Technology ResearchSimulator (VTRS). This work on carrier landing started in 197Vwhen VTRS became operational as a research facility. Itemerged as a good candidate for early study primarily becauseits acquisition consumes a considerable amount of trainingtime, and because it remains a difficult and potentiallydangerous phase of flight operations throughout a pilot'scareer. Furthermore, it appears that carrier landing skillscan be taught in a simulator designed for that purpose(Brictson and Burger, 1976).
An effective training simulator for carrier landings shouldbe particularly valuable because the current method ofpreliminary carrier landing training, to practice approaches toa field site that is specially prepared to simulate features ofa carrier landing deck, does not permit practice on somecrucial characteristics of the task. For example, the fieldcarrier cannot simulate deck movemenits found at uea. Thesemovements add to task difficulty and pose significant learningchallenges to Student Naval Aviators (SNAs). The presence ofair tuLbulence from the carrier island and the absence ofground effect are other features of carrier operations that arenot represented accurately at Field Carrier LAnding Practice(FCLP), and that adds to the difficulties encountered by SNAsduring their early carrivc approaches.
RESEARCH PLAN
The goals of the behavioral research program at the VTRSare to determine simulator design requirements and instruc-tional features for teaching Navy flight tasks. The overallresearch plan is to examine selected tasks in a series ofwithin-simulator studies and culminates with a study thatinvolves transfer to the airplane. The research reported hereis the final (field) transfer experiment that followed theseries of within-simulator studies (Collyer, Ricard, Anderson,Westra, and Perry, 1900; Westra, Simon, Collyer, and Chambers,1981; Hughes, Lintern, Wightman, Brooks, and Singleton, 1981;Westra, 1902; Wightman, 1903; Lintern, Kaul, and Collyer,].984). It was aimed at identifying optimum design andinstructional features for a simulator to teach zari.ierlandings. In addition, this experiment was necessary todetermine the ultimate value of tackling major simulator designresearch problems in the manner currently being employed at thev'rs -s

NAV'TRASYSCEN 85-C-0041- Z
A sequential research plan, progressing from within-simulatol: to field studies, was developed because a simulator-to-airplane transfer study is both expensive and difficult toconduct properly. The first major step in the sequentialresearch plan was a nontraining or performance study (Westra,1902). Although this effort provided limited information abouttraining effectivenecis for Student Naval Aviators, it did serveto validate experimental manipulations and parformancemeasures, in addition, these data were used as a basis forexcluding some experimental manipulations from later trainingstudies. Th'at procedure was founded on the assumption that avariAble that dues not directly affect performance is unlikelyto produce any worthwhile differential effect in subsequenttransfer to a standard condition.
Skilled pilots were used as subjects in our performancestudy so that the results do have some implications forsimulators that are used for skill maintenance and transitiontraining. Conditions shown to help pilot performance in thesimulator may be considered desirable for skill maintenancesimulators, although data from this type of study do notindicate whether there will be any subsequent enhancement offlight performance.
The bulk of within-simulator research at the VTRS has beenin th'e form of quasi-transftr studies. In these studies, avariety of simulator conditions were used to train independentgroups of subjects. After predetermined periods of training,subjects were transferred to another simulator condition (thecriterion condition) that was as similar to the aircraft aspossible. A control group trained and tested on the criterionsimulator configuration was also included. This procedure canbe contrasted to a true transfer study in which subjectstransfer from the training to the operational device.Quasi-transfer refers to a situation in which subjects aretested in the training device, but on a criterion configuration.
Quasi-transfer studies were used to examine variables thatmay affect training. T'hose that survived the performance* studies, and others that pre-experimental work or otlher
*research had suggested would have a worthwhile effect, weretested in this phat;e. Quasi-transfer studies were firstproposed as a mearis of screening variables for subsequenttransfer studies. They provided an economical method ofscreening the variables of interest In transfer and therebyenabled more effective use of resources available for thetransfer studies.
PERFORMANCE EXPERIMENTS. In one of the first experiments atthe VTRS, Westra, Simon, Collyer, and Chambers (1982)investigated the effects of Ii simulator-design factors on theperformanco of experienced pilots. The factors and levels are
2

NAV'TRASYSCEN 85-C-0044-2
shown in 'r'able i. This experiment represented our firstattempt to apply the economical multifactor methodologypropoied by Simon (1973, 197'7).
TABLE I. EXPERIMENTAL FACTORS FOR A VTRS CARRIER LANDINGNON-T|'ANSFER EXPERIMENT (WESTRA ET AL. (1982)
LEVELS
FACTOR "low" " high"
FLOLS Projected CIG Projected light model
Field of viewVertical -27 to +9 deg -30 to +50 degHorizontal +1-- 24 deg +/- 00 deg
TV line rate 525 2.025
Engine lags 7.5 Hz update 30 Hz update
Ship detail Night point light Day solid surface
Visual-system lag 217 mGcC 117 msoc
Seascape Homogeneous gray Wave pattern
BrightnessShip 0.40 fL 2.90 fLSea 0.04 fL 0.50 fLSky 0.02 fL 0.16 CL
Platform motion Fixed base Six degrees offreedom
Ship type CIG Camera/Model board
G-seat Off 30 pneumatic bellows
Turbulence None Close to maximumflyable
Pilots: Eight fleet pilots, experienced in carrier landing.
3

NAVTRASYSCEN 85-C-0044-2
The only substantial effect on critical measures of taskoutcome quality came from a comparison of two methods ofmodelling the Fresnel Lens Optical Landing System (FLOLS).Glideslope tracking performance with a computer-generated FLOLSwas better than with a projection from an incandescent light-,source model. This effect was thought to result from the sizedifference of the two FLOLS simulations. The computer-generated FLOLS had been modeled at larger than scale toovercome limitations in the resolution of the line-scanprojector system.
Two other factors had effects which, although smaller inoverall impact, were considered potentially important.Approach lineup was better with the day scene than with thenight scene, and the shorter visual system lags resulted inless roll variability during the approach. The other factorshad negligible effeits. The display and simulator factors hadbeen varied over a wide range of interest that representedexpensive versus inexpensive simulator options. Thus, thesmall to null effects resulting from variation of equipmentfactors in this experiment suggest that the simulatorperformance of experienced pilots on the carrier landing taskis not enhanced substantially by high levels of fidelity.
QUASI-TRANSFER %,APERIMENTS. The information obtained from theperformance study aided the design of a subsequentquasi-transfer experiment with pilots who had no previouscarrier landi.., xperience (Westra, 1982). In general, if afactor effect was considered practically negligible, the factorwas either not studied further or it was combined with others.Thus, the model-board image-generation system was not usedagain, and the g-seat, TV-line rate, and engine lag factorswere not tested further. Elements of scene brightness andseascape detail were incorporated with ship detail into a newscene detail factor. The optical FLOLS was also dropped fromfurther study since it had resulted in poorer performance, eventhough it was the more expensive of the FLOLS display methods.However, FLOLS size, whica was believed to be primarilyresponsible for the effect, was studied in a laterquasi-transfer experiment (Sheppard, 1985).
The factors tested in Westra's (1982) quasi-transferexperiment are summarized in Table 2. Field of view, which hadbeen investigated only for straight-in approaches, was testedin combination with approach type (straight-in or circling).Platform motion was retained for the quasi-transfer experimentprimarily because of its high cost implications. Visual systemlag was not included because of a concern that it wouldinterfere with the effects of other variables. FLOLS ratecuing (the addition of descent rate information to theglideslope displacement information normally provided by. the..FLOLS), which had been tested in a performance study (Lintern,Kaul, and Collyer, 1984), was also included as a factor in thequasi-transfer experiment.
4
% k. . . . . . . . . ..

NAVTRASYSCEN 85-C-0044-2
TABLE 2. EXPERIMENTAL FACTORS FOR A VTRS WITHIN-SIMULqATOR ... '.CARRIER LANDING TRANSFER EXPERIMENT (WESTRA, 1982)
LEVELS
FACTORS "low" "high"
Field of viewVertical -27 to + 9 degrees -30 to +50 degrees*Horizontal +1-24 degrees +/-80 degrees*
Ship detail Night point light Day solid surface*
Platform motion Fixed base Six degrees*
Approach type Modified Circling*straight-in
FLOLS rate cuing Command None*
Turbulence None Close to maximumflyable
Pilot type Air Force T-38 Navy P-3C
Indicates setting for the transfer test configuration.Turbulence was set at an intermediate level setting for thetransfer test.
Although small and transient, there were glideslopetracking and lineup advantages in transfer from training withthe wide field of view and high scene detail conditions.However, platform motion and FLOLS rate cuing had nodifferential transfer effects. Approach type did have asubstantial effect on lineup, with better transfer performanceresulting from training with the straight-in approach. Thesefindings indicated that only field of view. scene detail, andapproach type should be tested in a subsequent simulator-to-airplane transfer study.
S~5
•.~

NAVTRASYSCEN 85-C-0044-2
Data from other laboratories on FOV and scene detaileffects have been mixed. A wide FOV appeared to help simulatorperformances during turns to final and during glideslopetracking (Kraft, Anderson, and Elworth, 1980). However, runwayscene detail can modify these effects in that, with somemeasures at least, performance with a narrow FOV was betterthan with a wide FOV for low scene detail on the runway. Aquasi-transfer study by Collyer, Ricard, Anderson, Westra, andPerry (1980) showed strong FOV performance effects duringcarrier landing training, but no effect of these trainingdifferences on transfer to a criterion simulator condition.
In the Kraft et al. (1980) study, and another by Buckland,Monroe, and Mehrer (1980), scene detail affected landingperformances in the simulator. In contrast, Martin and Cataneo(1980) found no effects of simulator training with differentlevels of scene detail on conventional landing performance inan airplane. The scene detail issue is thrown into furtherconfusion by the work of Brictson and Burger (1976). Theyshowed that prior training with a night carrier display helpednight landings but not day landings. This result is puzzlingin that the crucial sources of information from outside thecockpit, those being Fresnel Lens Optical Landing System anddeck lineup indications, are similarly represented for both dayand night landings. Of course, much environmental informationis lacking in night landings, but the use that carrier pilotsmake of that information is not obvious. Taken as a whole,these data indicate that further research on the transfereffects of variations in FOV and scene detail is warranted.
Other quasi-transfer experiments were undertaken at the* VTRS to examine instructional features. The most promising
result was obtained by Wightman (1983) in a test of abackward-chaining procedure for teaching simulated carrierlandings. His experimental subjects were taught carrierapproaches in a series in which early trials were started at2000 feet behind the carrier, and later trials at 4000 feet,and then 6000 feet behind the *carrier. This procedure was moreeffective than whole-task training in which subjects flew alltheir trials from the 6000-foot mark. The result was perceivedas consistent with the advantage shown for straight-inapproaches in the Westra (1982) quasi-transfer study. Thus, anapproach-type factor combining features of the manipulationstested in both of these studies was developed for the transferstudy.
One further important result from the quasi-transferresearch was that FLOLS size did not affect acquisition of thecarrier landing task (Sheppard, 1985). This had become animportant issue because the FLOLS in the VTRS is represented ona larger scale than it is at the carrier. Limitations in theresolution of the out-of-cockpit visual display had forced thelarger representation. A true-scale representation, although
6

NAVTRASYSCEN 85-C-0044-2
tested, was impractical because small but critical elements ofthe display flickered excessively as they crossed rasterlines. Engineering redesign would have corrected the problem,but the oversize representation was a more convenient and lessexpensive solution. The Sheppard study indicated thatsimulator training with an oversize FLOLS would have no adverseeffect on transfer to a normal-size FLOLS in the field.
Several other training manipulations were also examined.Hughes, Lintern, Wightman, Brooks..and Singleton (1981) testeda procedure in which the simulated aircraft approach was frozenon the approach to the carrier whenever a student made aserious error. After the instructor discussed the errors withthem, students were either released from freeze to continuetheir approach or were reset to an optimum position on theglideslope and then released. Wightman (1983) reduced the lagsbetween throttle movement and simulator response duringtcaining. Sheppard (1985) fixed his students at a constant(1500 feet) distance from the carrier to allow intensivepractice with control responses required for glideslopetracking and also examined the use of descent rate cuing intraining. All of these training manipulations were reasonablyeffective, but were not generally better than the conventionalprocedures and, therefore, were not included in the transferexperiment.
In summary, two equipment factors, those being field ofview and ship detail, were included in the transfer experimenton the basis of the results from the within-simulator researchat the VTRS. That research also supported the inclusion of abackward-chaining type of instructional factor, referred tohere as approach type. In addition, training time was includedas an expekimental factor so that incremental transfereffectiveness (Bickley, 1980; Orlansky, 1982; Povenmire andRoscoe, 1971, 1973) could be estimated.
PERFORMANCE MEASUREMENT. Our considerable research experiencewith the carrier landing task has helped us establish a viableperformance measurement approach for the simulator and thatsame approach seemed preferable in the field. Nevertheless, itproved impractical to gather all measures in the field that hadbeen possible in the simulator. A substantial independenteffort to prepare for the transfer experiment identified LSOratings of approaches as a measure that could be obtained withrelative ease and that had strong face validity (Isley andSpears, 1982). However, it also became apparent that LSOsoften used their ratings for motivational rather than forassessment purposes; an observation that had been madepreviously by Brictson and Burger (1976). In some cases theratings appeared to be more heavily influenced by individualLSO criteria than by student ability.
7r

NAVTRASYSCEN 85-C-0044-2
Further developmental work for performance measurement wasundertaken by McCauley and Cotton (1982). A laser system,designated HYTAL for Hybrid Terminal Assist Landing, wasidentified as being available for the experiment and able tomeasure altitude and lineup errors in the final approach totouchdown. As measures of altitude and lineup error haddominated the analyses of simulator data, the HYTAL system wasconsidered suitable for the experiment. The loss of Angle-of-Attack (AOA) error data was regrettable, particularly in viewof the emphasis that LSOs place on AOA control, but McCauleyand Cotton (1982) could not identify a system to measure AOAthat could be acquired with the resources available for thisexperiment.
Statistical power was considered as an important issue.Waag (1980) has noted that many transfer investigations ofsimulator design issues have not had sufficient power todemonstrate real effects. The use of statistical power toestimate the number of subjects needed in a transfer-of-training experiment has been discussed by Lintern, Thomley,Nelson, and Roscoe (1984). Our requirement in this carrierlanding transfer study, to test for differential advantage fromvarious simulator conditions in contrast to merely comparingsimulator to no-simulator training, was judged to stress powerrequirements. Preliminary analyses, using VTRS quasi-transferdata as a guide, together with considerations of achieving abalanced factorial design for the four factors of interest,indicated that 72 experimental (simulator) subjects and asmaller number of control (no-simulator) subjects would besatisfactory.

NAVTRASYSCEN 85-C-0044-2
SECTION I,
METHOD
A transfer-of-training design was used to study the effectsof two simulator design factors (field of view and ship detail)and two instructional factors (approach type and simulatortraining time) on carrier landing training. Navy undergraduatepilots visited the VTRS for simulator training immediatelyprior to their normally scheduled field carrier landingpractice which is used as a workup for initial carrier landingqualification. Seventy-two experimental and eight control(no-simulator training) subjects visited the VTRS facility.Field and carrier data were collected on an additional 46control subjects who did not visit the VTRS.
APPARATUS
SIMULATOR. The Visual Technology Research Simulator (VTRS),described elsewhere by Collyer and Chambers (1978). has a fullyinstrumented T-2C Navy jet trainer cockpit, T-2C flightdynamics, a six degree-of-freedom synergistic motion platform,a 32-element g-seat, a wide-angle visual system that canproject computer-generated color images, and an instructor/operator control station. The motion system and g-seat werenot used in this experiment.
VISUAL SYSTEM. The background scene is displayed by a1025-line raster system, subtending 50 degrees above to 30degrees below the pilots' eye level, and 80 degrees to the leftand right sides of the cockpit's longitudinal axis. Thecarrier image, which was a representation of the USS Forrestal,is overlaid on the background with a 1025-line targetprojector. A carrier wake and FLJLS are also displayed withthe target projector. Both daytime and nighttime carrierimages are available (Figures 1 and 2).
Average delay between control inputs and generation of thecorresponding visual scene is approximately 117 msec.Calculation of new aircraft coordinates requires So msec, whilecalculation of the coordinates for the visual scene corres-ponding to the viewpoint for the new aircraft coordinatesrequires approximately 50 msec. Generation of the new scenerequires 17 msec. An updated visual scene can be displayedevery 33 msec.
The sky brightness for the day scene was 0.85 fL (foot-Lambert) and the seascape brightness was 0.6 fL. The brightestarea of the day carrier was 4.0 fL. Except for the horizon,there were no background features represented in either the skyor sea. The night background luminance was 0.04 fL. The
9

NAV'PRASYSCEN, 8 5-C-0044-2
Pi~jur-" 1. Sirnul i -ed Day Carrier Scene
F~igure 2. SinlUlated Nigjht Carrier Scone

NAVTRASYSCEN 85-C-0044-2
horizon was visible but the seascape was not. The nightcarrier appeared as lights of 0.8 fL brightness outlining thelanding deck and other features.
FRESNEL LENS OPTICAL LANDING SYSTEM. The FLOLS and its use'-are..described in Appendix A. The simulated FLOLS is shown with thesimulated carrier in Figures I and 2. To prevent some of itssmaller elements from shimmeriing and disappearing temporarilyas they crossed raster linesi the simulated FLOLS was enlargedby a factor of 4.5 when the distance. behind the ramp wasgreater than 2250 feet. From 2250 feet its size was linearlyreduced until it attained 1.5 times its normal size at 750feet. It remained that size throughout the remainder of theapproach. The FLOLS was set for 3.25 degree glideslope.
INSTRUCTOR/OPERATOR STATION. An experimenter and a LandingSignal Officer (LSO) sat at the instructor/Operator Station(10S) and were able to communicate with the student pilot fromthat position. Two color monitors, one displaying thebackground ime•j and the other displaying the target image,provided a general perspective of what the pilot viewed in thesimulator.
Two graphics monitors provided the LSO with feedback onstudent pilots' performance. One display was a real-time viewof major cockpit instruments and the other display presented atime history of control and performance measures plotted from adistance of 6000 feet from the carrier to touchdown. Furtherdescription of the IOS and graphic displays are included inAppendix B.
FIELD APPARATUS. Flight trials with the T-2C jet trainer wereundertaken first at Goliad Field, Texas, and then on thecarrier USS Lexington during operations in the Gulf of Mexico.These flights were a normal component of the Navy basic jettraining program which culminates with Carrier Qualification(CQ) aboard the USS Lexington. Four FCLP sites in the vicinityof Goliad Field were used at one time or another during theperiod of data collection for the experiment. Different siteswere used depending on weather conditions and convenience. AFLOLS of the type simulated in the VTRS is available both atFCLP and at the USS Lexington.
A laser tracking system (HYTAL) was placed near the activerunway during FCLP. This system recorded altitude and lateraldeviations from glideslope in the final approach to touchdown(McCauley and Cotton, 1982). An optical glass retroflector wasmounted in the landing light housing of each experimental air-craft to return the laser signal. A detailed description ofthe HYTAL system is given in Lintern, Mauk, and Cotton (inpress), and a less detailed description is provided in AppendixC.
11
S.. . . .. . .. . . .. .. . . . . . . . . . . . . . . . . . - _ -

!A
NAVTRASYSCEN 85.-C-0044-2
PROCEDURE
Approximately 60% of the students from each intermediate
class of training squadron VT-26 at NAS Chase Field,iTexas, were selected to visit Orlando. Although this selection.was intended to be random, it was made by Navy personnel at thetraining squadron. Nonrandom factors, such as delayed progressof individual students in the course due to poor weather oraircraft mechanical problems,. may have influenced the selectionto some extent. Experimenters monitored the selection ofavailable students throughout the experiment, and as far ascould be determined, no critical biases were introduced. TheOrlando visit was made generally on the weekend before thecommencement of FCLP. Eight to 12 SNAs, and two to threeLanding Signal Officers (LSOs), visited VTRS every six weeks.Data collection extended from October 1983 to August 1984.
The students who did not visit the VTRS were classified asTexas-control subjects. Originally, it was planned that 16member.s of each class to visit Orlando would be randomlyselected as additional control subjects and would not fly thesimulator. However, due to lack of availability, only eightpilots were assigned to this category. This number wasconsidered too small for comparison purposes and these VTRScontrols were combined with the other controls who did notvisit VTRS.
The students who were to be trained with one of theexperimental simulator conditions were briefed on the simulatorby VTRS experimenters. They were then briefed on the taskrequirements and on their simulator training condition by VT-26
Landing Signal Officers who had accompanied them to Orlando.Each pilot had two minutes of preliminary flight time in thesimulator prior to experimental trials.. Simulator training wasconducted in 10-trial sessions with a minimum of one-half hourrest between sessions. The number of sessions for each pilotwas dependent on the number of training trials in theirexperimental condition. Pilots who had 20 or 40 trialscompleted their training in one day. Pilots who had 60 trialswere trained over a two-day period. Each pilot was assigned aVT--26 LSO who monitored their simulator trials throughouttraining from the instructor/ operator station. LSOs gaveinstructional advice during and after a trial, much as is doneat FCLP and at CQ.
'The VT-26 squadron is located at NAS Chase Field, but FCLPis normally conducted at nearby Goliad Field. Several LSOsand students fly the T-2C aircraft from Chase to Goliaddaily. The remaining students travel to Goliad each morningby bus. A new group of students take over the aircraft duringrefueling between "events" or "flights."
12

NAVTRASYSCEN 85-C-0044-2
Following their simulator training, the experimentalsubjects and the VTRS control subjects rejoined theirclassmates at NAS Chase Field to continue their undergraduateflight training. The FCLP portion of the course was generallyscheduled over 10 consecutive weekdays at Goliad Field.Students generally flew one "flight" each day, consisting ofeight FLOLS approaches, to a runway that was marked near theapproach end to represent a carrier landing deck. Instructorsflew with the students on the first. two flights and typicallycontrolled the aircraft for the first flight and half of thesecond flight. Students flew solo on their remaining eightFCLP flights. Inclement weather, delays for individualstudents earlier in the course, and aircraft problems coulddisrupt this schedule so that students occasionally missedflights, or started their FCLP late, and made up that time byflying two events on one or more of the succeeding days.
A major influence on FCLP schedules was the availability ofthe USS LexinQton. FCLP was scheduled to start approximately12 days before the Lexington was available, and LSOs went tosome trouble to ensure that their students had completed therequired number of flights (10) in time to meet that schedule.The students flew to the Lexington soon after completing theirFCLP and made several approaches and landings at the ship overa two-day period.
SIMULATOR FLIGHT TASKS
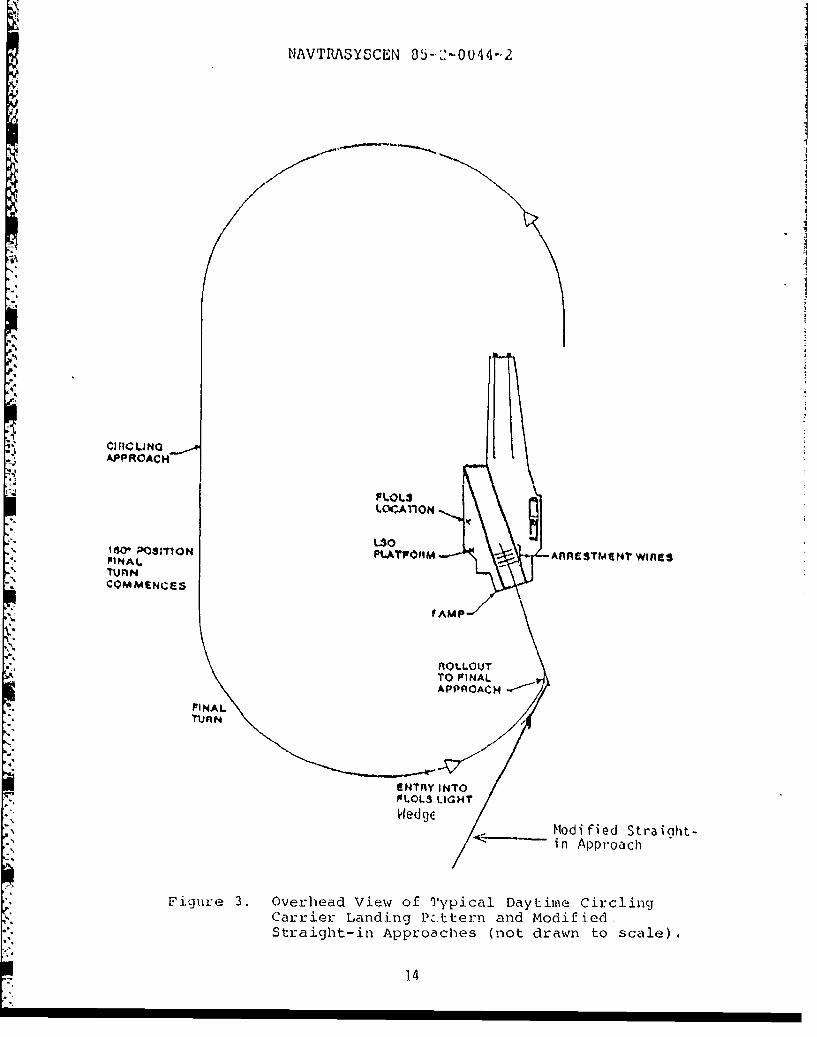
All approaches were initialized with the simulator in itslanding configuration. Those from 3000 and 6000 feet wereinitialized with -he simulated aircraft on glideslope andlineup: 349.5 degrees heading, 103 knots airspeed, 83% power,and a 500 fpm descent rate. The modified straight-inapproaches were initialized with the simulated aircraft instraight-and-level flight, 15 degrees to the port (left) ofcenterline (see Figure 3), heading 18.5 degrees, 400 feetaltitude, 104 knots airspeed, and 86% power. In starting fromthis position, students were required to fly forward at thisaltitude and heading to intercept the centerline andglideslope, and then to commence their landing approach. Thecircling approaches were initialized with the simulatedaircraft in straight-and-level flight and 4421 feet off theport beam of the simulated ship, heading 170 degrees, 606 feetaltitude, 96 knots airspeed, and 86% power. From this positionstudents were to undertake a descending left turn to interceptthe centerline and glideslope for their landing approach.
SIMULATOR FACTORS AND LEVELS
FIELD OF VIEW. The high level field of view was a 160-degreehorizontal by 80-degree vertical display (Singer-Link, 1977)whiich is costly and is representative of that currently
13
NAVTRASYSCEN 85-,'-0U44-02
APPROACH
-UriN
COMPAIENCF- S F
FA P-
AO.L, OUT
APPROACHC
FINAL
TTifnN
NTRYCINTOFI.OLS LIGHT
WedgEModified Straiaht-iin Approach
Figure 3. Overhead View of Typical Daytime CirclingCarrier Landing Pý.ttern and Modified.Straight-in Approaches (not drawn to scale).
14

NAVTRASYSCEN 05-C-0044-2
available for carrier landing training only on multitasktrainers such as the 2B35 and the F-14 Wide Angle Visual System(WAVS). The low level field of view was plus or minus 24degrees horizontally by -27 degrees to +9 degrees vertically,which is representative of the lower cost Night Carrier Landing-..Trainers (NCLTs) used for F-4, F-14, A-6, A-7, and S-3transition training. Figure 4 gives a graphical depiction ofthe alternative fields of view.
SCENE DETAIL. The high level of scene detail was representedby a daytime solid model CIG (General Electric, 1979) carrierwhose surfaces were defined by 985 edges. The daytime sconeincluded wake, light blue sky, and a uniform dark blue seascapebelow a well defined horizon. This level of detail wasapproximetely representative of that available from daytime CIGsystems costing several million dollars, such as the 2B35trainer, although displayed at higher resolution than availablein the 2B35.
The low level of scene detail was represented by an imageof a night point-light CIG carrier consisting of 137 lights.It contained all deck oitline, runway, centerline, and droplights. The background was dark with a visible horizon. Thisdisplay is representative of a night CIG system costing lessthan a million dollars and used on several Navy NCLTs.
NUMBER OF TRAINING TRIALS. '.iree levels of VTRS training timewere included so that incremental transfer effectiveness couldbe estimated. Pilots were trained at VTRS tor a period of 20,40, or 60 training trials. However, the amount of simulatortime within each session was dependent on the approach-typecondition (described below) that was assigned. In addition,the control group who flew no VTRS trials technically provideda fourth level of this factor.
APPROACH TYPE. Three levels of approach type were varied inthe experiment. One group of pilots flew all circlingapproaches while the other two groups performed a backward-chaining sequence of approaches. The modified straight-ingroup flew the first 75% of their approaches from the modifiedstraight-in start position, and the last 25% of theirapproaches from the circling start position. The group flyingthe segmented approach schedule flew the first 25% of theirapproaches straight-in from 3000 ft, the next 25% straight-inf.'om 6000 ft., the next 25% as modified straight-in approaches,and the last 25% as circling approaches. The initialconditions for each approach were described earlier under theheading "Simulator Flight Tasks." The circling approach tookapproximately 90 seconds to complete, while the modifiedstraight-in approach took approximately 60 seconds, the 6000ft. approach 40 seconds, and the 3000 ft. approach 20 seconds.For an equal number of trials, the modified straight-in grouphad 25% less actual simulator time than the circling group,while the segmented.group had 42% less time than the circling
15

NAVTIPASYSCEN 85!-C-004f4-2)
.4.
0
r-4
44)
r.4 T5.
ý4J.
161

NAVTRASYSCEN 85-C-0044-2
group. .able 3 gives a summtary of the simulator conditionsused in the experiment.
TABLE 3. SIMULATOR FAOCtOIRS AND CONSTANTS
__/ACTORS LEVELS
Field of ViewVertical -27 to +90 - -30 to 50o11orizontal + 240 + 00o
Ship Detail Night point light Day solid suvEace
No. oE Trials 20 40 60
Approach Type segmented: Modified straight-in: All circling25% of trials each 75% of trials with approacheswith straight-tn with 150 offsetfrom 3000 ft, left from $000 ft,straight-in from 25% circling6000 ft,150 offset left fro8000 ft,circling
CONSTANTS
Wind speed 5 knotsWind direction 169.5o (directly down the landing deck)
Ship speed stationaryShip heading 3600Glideslope 3.250
SIMULATOR PERFORMANCE MEASUREMENT
Parameters of aircraft position and attiLude were sampledwithin the simulator at 30 Htz and were used to derive altitudeand lineup error scores from the desired approach path anddeviations from desired AOA (15 units). Root Mean Square (tIMS)error, mean algebraic error, and variability around those mcans"were calculated for 'he three performanco dim.ensions over four
1-7
... .

NAVTRASYSCEN 85-C-0044-2
segments of the final 6000 feet of the approach. These foursegments were 6000 ft. to 500 ft. down the ramp, 4500 ft. to2000 ft., 2000 ft. to 500 ft., and [000 ft. to the ramp.Time-on-target (TOT) scores were also computed for thesesegment, for time within desired limits in the lineup and-,vertical dimensions during the approach. Tolerance limits wereset at +0.3 degrees for the glideslope (roughly plus or minusone "ball") and +0.75 degrees for lineup. Pilots flying withinthese limits will generally be flying safe, high qualityapproaches without LSO intervention. Distance down the deck,distance from the centerline, and descent rate were measured attouchdown, and the Landing Performance Score (LPS) (Brictson,Burger, and Wulfeck, 1973) was calculated. The LPS is a scoreassigned to each pass, ranging from 1.0 (technique wave-off) to6.0 (#3 wire trap).
FIELD PERFORMANCE MEASUREMENT
Glidepath tracking scores for FCLP were measured by theHYTAL system at Goliad Field (see Appendix C). Loss of HYTALdata was occasioned by equipment breakdowns, runway changes dueto wind shifts that often found the experimenters stillrelocating the equipment as the first trials were flown to thenew runway, and public holidays or poor weather that forcedevents to be flown at Chase Field rather than Goliad Field.LSO ratings were, however, available for all FCLP and CQ events.
The HYTAL system sampled aircraft range, azimuth, andelevation positions at 20 Hz at the field. This raw data waslater reduced to a 5 Hz sample rate on permanent storage tapeand then used to derive summary scores for the approaches.Root Mean Square (RMS) error scores and time-on-target (TOT)scores over the segments 3100 ft to 1100 ft. from touchdown,1100 ft. to 100 ft., and 3100 ft. to. 100 ft. were used as theprimary indicators of approach performance. The independentRMS error components of mean algebraic error and variabilityabout these means were also computed over the segmentsindicated. Relative position at touchdown was also extractedfrom this data, but apparent errors in calibration causedinconsistencies in touchdown score transformations.
Within flight trial-to-trial variability scores were alsocomputed as part of the effort to obtain glideslope performanceindices that were unaffected by biased glideslope deviationmeasures.. The trial-to-trial variability score was constructedby computing the standard deviation of the mean glideslopedeviation values for the approaches within each flight for eachpilot. The score was declared "missing" if at least three meanvalues were not available within a flight. This score isunaffected by glideslope position measurement bias only underthe assumption that the bias is constant over a flight. Thisassumption appeared generally true, although there was alsosome small bias drift within flights. It is felt that this
18

NAVTRASYSCEN 85-C-0044-2
drift did not pose serious validity threats to the scores. Theproblem of biased glideslope deviation measures is discussed atlength in this report.
LSO GRADE. The LSO in charge assigns a grade to each-approach.----..flown during FCLP. This grade is ostensibly a summaryindicator of approach and landing quality using the followingvalue designations:
4.0 - reasonable deviations with good corrections3.0 - reasonable deviations with average corrections"2.5 - bolter2.0 - below average but safe pass1.0 - technique wave-off
In practice, a rating of 4.0 is not often given duringearly FCLP trials and technique wave-offs are fairly rare.
CARRIER QUALIFICATION DATA. Although CQ data are presented inthis report, there were reasons to suspect that they would notbe sensitive to group differences. Objective performancemeasures were not available at the ship, and the installationof a glideslope tracking system proved to be impractical.Thus, the only data available from CQ are the LSO grades. Inaddition, students flew only a small number of approaches atthe Lexington (generally less than eight) so that the stabilityof the data was in doubt. CQ data were further compromised bycarrier availability. While students flew to a Naval AirStation (NAS) close to the Lexington within two days offinishing their FCLP, the time between their arrival at thatstation and their flight3 to the Lexington varied by severaldays. During their wa;** students practiced FLOLS approaches atthe field. Thus, the CQ data were judged to provide aninsensitive indicaticn of simulator effectiveness because ofthe subjective natura-of the available measures, because of thesmall number of observations made on each student, and becauseof the variable amount of practice between FCLP and CQ.Further, the VTRS training was intended to impact FCLP and itwas considered very doubtful that transfer would carry over toCQ. This point is discussed in more detail later.
COVARIATE TASK. Ten trials of a psychomotor video game calledAir Combat Maneuvering (ACM) were administered to obtain scoresthat might be used as a covariate in the analysis. ACM is anAtari (TM) video game that has previously shown an associationwith simulated carrier landing performance (Lintern andKennedy, 1984). These scores were collected at the VTRSfacility for those students who visited Orlando and at NASChase Field for those who did not.
EXPERIMENTAL DESIGN
Table 3 Aists the four experimental factors manipulated insimulator training, those being field of view (two levels,
1
=? 19

NAVTRASYSCEN 85-C-0044-2
scene detail (two levels), approach type (three levels), andlength of simulator training (three levels). Each of the 72experimental subjects who visited the VTRS was randomlyassigned to one of the experimental conditions. This gave afully crossed 2X2X3X3 factorial design with two subjects- in-each cell for the VTRS-trained pilots. In addition, there were54 control subjects whf. received no VTRS training. Thus, theexperimental design wa, a factorial experiment with a singlecontrol group.
20

NAVTRASYSCEN 85-C-0044-2
SECTION III
SIMULATOR TRAINING DATA
ANALYSIS OF SIMULATOR TRAINING DATA
The training data represent, an-unusual situation in whichthe student aviators flew varying numbers of total trainingtrials. Three levels of training trials were maipulated inthe experiment. To equate the number of trials for therepeated-measures ANOVAS and to accurately reflect differencesin the amount of training, the data files were constructed asfollows:
I) For 20-trial subjects, All trials2) For 40-trial subjects, Trials 2, 4, 6,...403) For 60-trial subjects, Trials 3, 6, 9,...60
Three levels of approach type were also manipulated in theexperiment. One group of subjects flew all circling approacheswhile the other two groups performed a segmented or modifiedstraight-in sequence of trials. Within-simulator assessment ofpart-task training was possible from comparisons on the fourthquartile of their training trials when all groups wereperforming the circling task.
The considerable number of performance measures availablefor analysis of the training data forced selection of thosemeasures that have been validated from previous carrier landingresearch at VTRS. In addition, log transition was applied toall RMS scores to correct for violations of normality andhomogeneity of variance prior to statistical analysis (Levineand Dunlap, 1982). Time in tolerance (TOT), average error, andvariability scores were not transformed.
TRAINING PERFORMANCE RESULTS
As argued by Salmoni, Schmidt, and Walter (1984), onlytransfer data provide an appropriate test of stable differencesin learning effects resulting from different trainingconditions. Nevertheless, several features of the trainingdata were examined briefly for insights they might offer.
Learning effects- for performance measures selected foranalysis are shown in Table 4. All were significant andsubstantial. The improvement in performance throughout thetraining phase was considerable. This evidence was consideredas a validation of the performance measures. Lack of alearning effect would have cast doubt on their validity asmeasures of differential quality of performance. The effectsof training time were also significant for all measures with
21

NAVTRASYSCEN 85-C-0044-2
the longer training times being associated with betterperformance. This result indicated that the selected trainingtimes were appropriate for the experiment.
TABLE 4. STATISTICAL SIGNIFICANCE OF THE LEARNING EFFECTIN TRAINING TRIALS FOR SELECTED PERFORMANCE MEASURES
Measure p
Vertical glideslope, 2000 to 500 ftRMS error 0.001Time in tolerance 0.001Variable error 0.001Average error 0.001
Lateral glideslope, 2000 to 500 ftRMS error 0.001Time in tolerance 0.001Average error 0.001
Angle of attack, 2000 to 500 ftRMS error 0.001Time in tolerance 0.001
Main effects and significant interactions involving FOV,scene detail, and training time are summarized in Table 5. Theeffects of training time were significant for all measures.with the longer training times being associated with betterperformanze. FOV also had significant training effects butthese effects were restricted to the approach lineupperformance dimension. Performance across the training trialswere better fcr both lineup TOT and RMS error scores with thewide FOV. These results are shown in Table 5. The scenedetail factor did not appear to affect any measures of trainingperformance.
Because of the experimental design, it is possible to viewcertain contrasts within the training phase for the approachtype factor as quasi-transfer (within-simulator) experiments.Performance during the third quartile of trials can be comparedfor the segmented group and the modified straight-in group totest the effect of the different approach schedules on modifiedstraight-in performance. In the third quartile, both groupswere performing modified straight-in approaches, but thesegmented group flew 3000 ft. approaches in quartile onetrials, and 6000 ft. approaches in quartile two trials, whilethe modified straight-in group flew modified straight-inapproaches during the first two quartiles. The modified
22

NAVTRASYSCEN 85-C-0044-2
TABLE 5. SUMMARY OF MAIN EFFECTS AND SIGNIFICANTINTERACTIONS OF SCENE DETAIL, FIELD OF VIEW, AND
NUMBER OF TRAINING TRIALS: TRAINING DATA
RMS Glideslope Error Time on Tolerance Glideslope
Factor df F Factor df F
Scene Detail 1 .00 Scene Detail 1 .14Field of View 1 .40 Field of View 1 .01No. Trials 2 7.35** No. Trials 2 6.28**
Variability Glideslope Error Average Glideslope Error
Factor df F Factor df F
Scene Detail (SD) 1 .69 Scene Detail 1 3.03Field of View (FV) 1 .00 Field of View 1 1.07No. Trials (NT) 2 5.26** No. Trials 2 1.07FV X NT 2 4.66*
RMS Lateral Error Time on Tolerance Lateral
Factor df F Factor df F
Scene Detail 1 .82 Scene Detail 1 1.01Field of View 1 7.81"* Field of View 1 7.03**No. Trials 2 9.81** No. Trials 2 6.45**
Average Lateral Error RMS Angle of Attack Error
Factor df F Factor df F
Scene Detail 1 .04 Scene Detail 1 .00Field of View 1 .21 Field of View 1 3.08No. Trials 2 3.60* No. Trials 2 1.60
Sp< .05** p < .01
23

NAVTRASYSCEN 85-C-0044--2
straight-in group did perform better in the third quartile onglideslope tracking than the segmented group. This differenceis shown in Table 6 which indicates that the modifiedstraight-in group was within tolerance 58% of the time,compared to 39% for the segmented group. Obviously, the.change-.-to modified straight.-in approaches was difficult initially forthe segmented group. There were no significant differencesbetween these groups on other. measures of performance in thethird quartile.
TABLE 6. ANALYSIS OF VARIANCE SUMMARY AND MEANSFOR SEGMENTED AND MODIFIED STRAIGHT-IN GROUPS ON THE
THIRD QUARTILE OF TRAINING TRIALS: GLIDESLOPE TRACKING(Percent time within +0.3 degrees of center)
FACTOR df F
Scene Type 1 0.63Field of View 1 2.25Number of Trials 2 7.19**Approach Type 2 18.10**
GROUP Means
Segmented 39.4%Modified Straight-in 57.9%
** p < .01
In the fourth quartile of training trials, all groups wereperforming circling approaches. This afforded a quasi-transfertype comparison of all three approach type groups on a (within-simulator) circling task criterion condition. There were nodifferences on the glideslope tracking scores which impliesthat the disadvantage for the segmented group in the thirdquartile was transient. Indeed, examination of lineup trackingscores in the fourth quartile indicates that the segmentedgroup performed best. This result is shown in Table 7 andindicates a substantial advantage for the segmented group. Thesegmented group was within the lineup tolerance limits 64% ofthe time compared to 44% for the modified straight-in group,and 46% for the circling group. This result is particularlystriking when it is noted that the segmented group had notflown any circling approaches until the fourth quartile, whilethe circling group flew all circling approaches.
24
? - P . . .... ..... .; , - - .7-

NAVTRASYSCEN 85-C-0044-•2
TABLE 7. ANALYSIS OF VARIANCE SUMMARY AND MEANSFOR APPROACH TYPE GROUPS ON THE FOURTH QUARTILE OF
TRAINING TRIALS: LINEUP TRACKING(Percent time within ± 0.75 degrees of center)
FACTOR d_ F
Scene Type 1 2.36Field of View 1 1.39Number of Trials 2 0.86Approach Type 2 8.64**.
GROUP Means
Segmented 64.4%Modified Straight-in 44.0%Circling 45.5%
** p < .01
25/26
I.-- i

NAVTRASYSCEN 85-C-0044-2
SECTION IV
ANALYSIS PROCEDURES FOR TRANSFER DATA
Analyzing the flight data proved to be a formidable task inwhich difficult problems were encountered. Data analysisinvolved considerable time and effort and yet, despiteexploring virtually every possibility, it was eventuallydetermined that no completely justifiable solutions to certainproblems were possible. In the interest of timeliness andparsimony only those analyses and results considered to beessentially free of controversy will be presented. It is feltthat despite the difficulties, the results presented hereaccurately and more or less completely describe the outcome ofthe experiment.
MEASUREMENT ERROR
The most serious problem encountered with the data involvedthe measurement of vertical glideslope position during theapproach. There appeared to be a bias in the measurement ofthis variable which approached 0.5 degrees in some cases, anamount which far exceeded the 0.1 degree of measurementresolution which was originally specified as allowable for thesystem. It was concluded that an error in calibration orsetting was at fault, but to this date the exact source of theerror has not been pinpointed. An attempt was made to pinpointthe problem, but this proved impossible as the HYTAL equipmentwas packed and returned to China Lake immediately after theexperiment and thus was not accessible. The most likelysources of error are in the reference measurement used tocalibrate the HYTAL system, calibration error in setting in theFLOLS itself (which was done by the LSO's), electronic drift inthe HYTAL system (only a small bias appears possible from thissource), drift in the FLOLS setting, or a combination of these.
The bias in measurement could have been statisticallyadjusted quite simply during data analysis had this bias beenconstant and of a known value over an identifiable period oftime. But the bias eventually was identified as variable on aday-to-day basis within the runway in use for FCLP. Evenwithin this wide range of variability in the bias, a post-hocadjustment was possible in principle as long as the bias wasconstant within a known period. However, there was someevidence of measurement drift within a one day period inaddition to the bias for that period, and although this driftwas not large (not more than 0.1 degree), various attempts atadjusting the data did not appear satisfactory. It was finallyconcluded that data dependent on the unbiased measure ofglideslope vertical position was unrecoverable. Although a
27I. - . . .

NAVTRASYSCEN 85-C--0044-2
great deal of time and effort was expended on these data, to noavail in the case of specific measures, it would seem that theeffort was justified when considering the overall cost andimportance of the experiment.
Not all vertical glideslope information was lost. Sincebias could be considered constant within a trial, the summarymeasure of variability about the pilot's own mean glideslopewas not affected. This measure is considered a usefulindicator of pilot control ability and has been used previouslyto report results from VTRS experiments (Westra and Lintern,1985). Of course, glideslope measures which summarizeperformance in terms of overall deviation from the optimalglideslope (including RMS and forms of time-on-target (TOT)scores) were not available as a result of the measurementproblems. There was no evidence of a bias or error in themeasure of lateral glidepath position. Thus, all summaryindicators of lineup performance were not affected bymeasurement error and were considered "clean." Furthermore,the LSO grades given for the FCLP approaches were available.
MISSING DATA
Despite the fact that over 10,000 approaches were madeduring FCLP as part of this experiment, there was sufficientmissing data to cause serious problems for certain analysisprocedures. Data came up missing altogether for a number ofreasons. The primary reasons were: 1) Bad weather caused arunway change and the HYTAL technicians were not able to switchthe equipment in time to get the data, 2) equipment breakdown,3) errors in transmitting the data from the video tapes takenat the field to computer tape. The latter was responsible formuch of the missing data and apparently was due to recordingerror, although the exact cause is not known. In addition,there were a significant number of wave-offs given by theLSOs. Most of these were test wave-offs given as a matter ofcourse for training purposes. Usually one test wave-off wasgiven per flight (which consisted of eight approaches) for eachpilot. Wave-offs were also given for safety reasons (techniquewave-offs) approximately 3% of the time. Whenever a wave-offwas given for any reason the objective measures of performanceclose in to landing were, of course, affected and so this datawas not used. Due to all sources more than half of theapproaches flown at the field were "missing" in the datasummary files for certain measures, even before data editingwas undertaken. Although there was nominally still more thansufficient data available for analysis, the real problem wasthat entire flight means (which were used as the basic datapoints for analysis procedures) often had to be declaredmissing.
28

NAVTRASYSCEN 85-C-0044-2
DATA EDITING
After eliminating all unusable data, the remaining datawere plotted and the distributions were examined. Means andstandard deviations were taken and this information was. used.-..together with the distribution plots to establish cut-offlimits for deviant data points. Limits were established on acase by case basis since for some measures there were a fewobviously deviant values which could simply be eliminated. Inthese cases there was most likely a recording error notdetected during video tape playback and transmission or awave-off which had not been recorded properly. In other casesit was not as simple to establish cut-off limits based onexamination of the distribution plots without being arbitrary.For these cases a cut-off of six standard deviation units fromthe mean for the measure was used. These data were probablyfrom more or less complete approaches, but involved performancethat went partially "out of control."
FLIGHT MEANS
Flight means for each pilot were computed after dataediting was complete and these means were then used as thebasic measures of pilot performance for subsequent dataanal Isis and results presentation. Pilots typically flew eightapproaches during a flight so that ideally the flight meanswould represent the average of these eight approaches.However, due to missing data, most pilots had only 3 to S validscores available from a flight. Thus, flight means typicallyrepresent the average of 3 to 5 approaches within a flight, butin some cases not enough good data was available to compute amean. An entire flight mean was considered missing if at leasttwo valid approach scores did not exist witnin that flight.
LATE TRANSFERS
Unfortunately, not all pilots trained at VTRS went directlyto FCLP as planned. This was due to an unforeseen repair delayfor the aircraft carrier Lexington which was used for carrierqualifications. FCLP schedules for student pilots aredependent on the availability of an aircraft carrier forcarrier qualification which must immediately follow FCLP (i.e.,students are not assigned to FCLP unless it is known that acarrier will be available for qualification testing after thecompletion of FCLP). As a result of this, a number of pilotsd~d not start FCLP for as long as 01 days after completing VTRStraining. The actual time delays between VTRS trainingand commencement of FCLP are summarized in Table 0.
29

NAVTRASYSCEN 05-C-0044-2
TABLE 8. SUMMARY OF TIME BETWEEN VTRS TRAININGAND THE START OF FCLP
Days Between Number ofVTRS and FCLP Pilots
1 - 8 379 -18 7
34 -39 040 -47 1079 - 81 10
Because it can generally be expected that a trainingbenefit will decay with time, the pilots in the experiment weredivided into two groups. One group consisted of pilots whotransferred to FCLP within eight days of completing VTRStraining. The other group consisted of pilots who transferredto FCLP more than eight days atter completing FCLP training.In data analysis then, the first significant test performed wasa comparison of these two groups. If these groups did notdiffer, the two groups were combined and compared to thecontrol pilots (not trained at VTRS). If these groups diddiffer significantly, they were treated separately for purposesof analysis.
ANALYSIS OF TRANSFER DATA
Transfer data were grouped into three major sets prior toperforming analysis-of-variance procedures. In the first setdata for each performance measure from flights 3 and 4 werecombined into a single mean for each pilot. This category (the.combination of flights 3 and 4) was labelled "Block 1" and isreferred to as such hereafter. These data were considered tobe the most sensitive available for detecting the presence oftransfer effects and should accordingly be given high priorityin terms of judging the size and nature of transfer effects.These data were considered the most likely to show transfereffects because they were the most proximate valid data to thetraining phase of the experiment. Flights 1 and 2 are, ofcourse, more proximate to the training phase of the experiment,but these passes were flown by instructor pilots in the case offlight 1 and the first half of the passes in flight 2. Thesecond half of the passes in tlight 2 were flown by the studentpilots, but with an instructor pilot in the plane and typicallyproviding a great deal of verbal assistance. The data fromthose passes in flight 2 flown by student pilots were in factanalyzed, but results clearly indicated a large instructoreffect and so these data were not used to judge transferresults.
30
NAVTRASYSCEN 85-C-0044-2
Data for the second set, which was analy2ed and presentedin the Results section, included Block 1 described above and"Block 2" which combined data from flights 5 and 6 into asingle mean for each pilot. Data for the third set includedBlocks I and 2 and "Block 3" which combined data from- flights--7"and 8 into a single mean for each pilot. Analyses for datasets 2 and 3 were performed to track the transfer effect (ifany) over time. Thus, the analyses of the three major setsprovides for an assessment of initial transfer effects and thestability of those effects over time.
PRIMARY CONTRASTS. Tests of significance were made viaanalysis-of-variance procedures in the following sequence.First, a comparison was made between early and late VTRStransfers as described earlier. If there was no differencebetween these groups, they were combined into a single VTRSexperimental group and compared to the control pilots who didnot train at VTRS. Last, differential transfer within the VTRSpilots as a result of the experimental conditions wasexamined. Within the VTRS trained group, the main effects forthe four factors (field of view, scene detail, number oftrials, and approach type) were tested along with thetwo-factor interactions. Of course, if overall transfer forthe VTRS group is not present, the interpretation of anywithin-VTRS group differential transfer effects will be altered.
TEST RESULTS. Analysis-of-variance procedures were used toconduct test of significance. In the case of set 1 (norepeated measures), analysis consisted of standard pr:oceduresfor a factorial experiment with a single control group (Winer,1971, p. 468-473). In this procedure the within-group errorterms for both the control group and the VTRS group were pooledinto a "between subjects" error term and it was this term whichthe factorial effects were tested against. (Note that thethree-way and four way within-VTRS group terms were also pooledinto the error term).
Procedures were similar for the analysis of sets 2 and 3(two blocks and three blocks of transfer data) except that ablock (or trials) repeated factor was included in theanalyses. In these analyses the block by within-VTRS groupfactors (main effect and two way interactions) were examined totest for the stability of effects (if any) over time. Thisprocedure made it possible to determine the approximate pointat which a transfer differential diminished or decayed. Inaddition to the within-VTRS group factors, the block by theControl group vs. VTrRS group interaction, as well as theinteraction involving the block by Early vs. Late VTRStransfers (if a difference existed), was tested.
31/32

NAVTRASYSCEN 05-C-0044-2
SECTION V
TRANSFER RESULTS
The transfer results for this experiment are presentedseparately for the FCLP performance dimensions of glideslopecontrol, lineup control, overall performance (LSO grade), andthe carrier qualification scores at the ship following FCLP.Results are presented in the form of flight means for thevarious experimental groups along with the analysis-of-varianceresults for the means across the combined f]ights (blocks)described earlier. The analysis of variance (ANOVA) tablesshow the sums-of-squares accounted-for by the various terms aswell as the percent-variance-accounted-for in the data (etasquared) for the between subject terms. Note that only etasquared values for the between-subject terms are shown for therepeated-measures analyses. These terms sum up to 100% onlyfor the between-subject part of the analyses and are thus nottrue eta squared values. Eta squared values were reported thisway to provide more equitable comparison of results betweenrepeated and non-repeated measure ANOVAs. The tables of meansshow means for flights 3 through 9, but it should be kept inmind that analyses were performed only on f lights 3 through 8.Means shown for flight 9 were often based on considerably lessdata than the other flights and should be viewed accordingly.A tenth flight was also flown at F'CIP, but thoer. was so muchmissing data from the flight that it was not reported.
The results in general, and for the analysis-of-variancetables in particular, have been condensed in the interest ofkeeping a reasonable bound on the amount of informationpresented, particularly in terms of data that might beredundant or overlapping. Thus, each table presenting analysesof variance shows the results for two of the three basicanalyses conducted for each FCLP measure. The analysis-of-variance summaries for flights 3 and 4 (combined into a singlemeasure for each pilot as described earlier) gives the bestavailable tests for initial transfer. The results for flights3 through u (combined into 3 blocks for each pilot) thenprovides tests for effects over the FCLP time period.Analysis-of-variance summaries for data from flights 3 through6 are not presented but will be discussed where necessary tofully describe the time history of the effect. Additionalcondensation was done by combining the within-subject block bytwo-way interactions into a single omnibus term. Theseinteractions were tested individually prior to combiningthem. However, for the measures presented, there were nosignificant interactions and so no discussion of the individualterms is necessary.
33

NAVTRASYSCEN 85-C-0044-2
There were several summary measures available for theperformance dimensions of glideslope and lineup control.Within the dimensions, summary measures were available in feetand degrees, over the three approach segments, and in severaldifferent transformations (e.g., RMS error and time-on-target-,transformation for lineup). Much of this information is, ofcourse, redundant and overlapping. In the interests ofparsimony, the approach taken was to present complete resultsfor the summary measure which best describes results, and todiscuss the other measures as necessary either to more fullydescribe the result or to provide supporting evidence for aresult.
GLIDESLOPE PERFORMANCE
Table 9 gives means for the summary measure of glideslopevariability during the approach from 3100 to 100 feet fromtouchdown. The means show little differences between the earlyand late VTRS transfer groups and the analysis of variancesummaries shown in Table 10 confirm that these groups do notdiffer significantly, either initially or across flights 3through 8. Accordingly, the two groups were combined andcompared to the control group. Table 10 indicates there was asignificant difference between the VTRS-trained pilots and thecontrol pilots. The difference in means can be seen in Table9. These values indicate that the VTRS trained pilots averaged0.7 feet less glideslope variability during approaches acrossflights 3 and 4. This difference appeared to hold up duringflight 5 (mean difference of 0.5 ft.), but the analysis ofvariance for flights 3 through 6 indicated the overalldifference across these four flights was not significant.Table 10 shows that there was no overall effect across flights3 through 8. Thus the initial transfer advantage for the VTRSpilots decayed by about the sixth flight.
None of the VTRS experimental factors appeared to make asignificant effect on transfer at FCLP. The closest factor tohaving an effect was number of training trials. For thisfactor, the means given in Table 9 suggest that those trainingwith 40 and 60 trials did better at FCLP than those trainingwith 20 trials across flights 3 and 4. Those training with 20trials differed little from the control group. However, itmust be kept in mind that these results were not significant.
The blocks effect is significant across flig .ts 3 through 8as would be expected. However, the effact does not reflect anexpected learning trend very well, although most of the blockeffect does appear to come from improved performance in flights7 and 8. The lack of a clear-cut learning trend is somewhatpuzzling, but it should be kept in mind that this measure isonly one aspect of overall performance which the student istrying to improve. There is some evidence to indicate that astudent will typically concentrate on one aspect of performance
34

NAVTRASYSCEN 85-C-0044-2
TABLE 9. FLIGHT MEANS AT FCLP FOR GLIDESLOPE VARIABILITYFROM 3100 to 100 FEET FROM IDEAL TOUCHDOWN
Experimental FlightGrouPs 3 4 5 6 7 8 9
VTRS (early) 7.2 6.6 7.1 7.3 7.2 6.5 5.8
VTRS (late) 7.0 6.6 7.8 7.5 6.7 7.5 7.6
All VTRS Pilots 7.1 6.6 7.4 7.4 7.0 7.0 6.7
Control Pilots 7.7 7.3 7.9 7.5 6.5 6.3 5.7
Within VTRS Pilots
Day scene 7.3 6.6 7.2 7.4 6.7 6.6 6.6
Night Scene 7.0 6.6 7.6 7.3 7.2 7.3 6.1
Wide FOV 7.0 6.6 7.9 6.9 6.7 6.5 6.2
Narrow FOV 7.3 6.6 7.0 7.9 7.2 7.4 6.5
20 Trials 7.7 7.3 7.5 7.7 6.8 6.9 6.5
40 Trials 7.0 6.2 7.6 7.5 7.1 7.2 6.3
60 Trials 6.8 6.3 7.2 6.9 6.9 6.7 6.3
Segmented Approach 6.8 6.7 7.2 6.9 6.8 7.0 5.6
Modified SI Approach 8.2 6.6 7.6 8.2 7.1 6.9 7.3
Circling Approach 6.6 6.4 7.5 7.1 6.9 7.1 6.4
35

NAVTRASYSCEN 85-C-0044--2
TABLE 10. ANALYSES OF VARIANCE FOR FCLP GLIDESLOPE VARIABILITYFROM 3100 TO 100 FEET FROM IDEAL TOUCHDOWN
Flights 3 through 8 Flights 3 and 4
Source df Sums of sq.(%) F if Sigs Of Sq.(%) F
VTRS (early vs late) 2 1 7.25 1.3 1 0.14 0.0VTRS vs Control 1 5.57 (0.9) 1.0 1 17.67 (4.0) 4.4*Scene Detail (SD) 1 5.20 (0.8) 0.9 1 0.11 (0.0) 0.0Field of View (FV) 1 5.03 (0.8) 0.9 1 0.34 (0.1) 0.1No. Trials (NT) 2 14.35 (2.3) 1.2 2 17.35 (3.9) 2.2Approach Type (AT) 2 14.80 (2.4) 1.3 2 9.44 (2.1) 1.2SD X FOV 1. 0.78 (0.1) 0.1 1 0.77 (0.2) 0.2SD X NT 2 5.53 (0.9) 0.5 2 5.33 (1.2) 0.7
•V X NT 2 24.62 (4.0) 2.1 2 9.66 (2.2) 1.2SD X AT 2 5.90 (1.0) 0.5 2 4.98 (1.1) 0.6FV X AT 2 10.38 (1.8) 0.9 2 1.85 (0.4) 0.2NY X AT 4 18.46 (3.0) 0.8 4 10.03 (2.3) 0.6Between Subjects 87 500.75 (81.1) 91 365.97 (82.5)
Blocks (BL) 2 41.50 4.9**BL X (VTRS vs cont) 2 25.57 3.0BL X SD 2 6.61 0.8BL X FV 2 8.68 1.0BL X NT 4 12.34 0.7BL X AT 4 7.27 0.4BL X 2-way Int. 26Within Subjects 174 732.18
I Percent-variance-accounted-for between subjects only.
2 Percent-variance-accounted-for not included in totals.* p< - 0 5
** p < .01
36
L

NAVTRASYSCEN 85-C-0044-2
until there is some degree of mastery, then concentrate onanother dimension at the temporary expense of the firstdimension (Spears, 1985).
OTHER GLIDESLOPE MEASURES. As described earlier, there wereserious bias problems with glideslope error data from the lasertracking system. These problems precluded the use of overallerror scores such as RMS and.time.on target (TOT). Under thesecircumstances, the measure of glideslope variability (in feet)discussed above is considered the best indicator available ofglideslope performance. However, other measures which weredetermined not to be affected by the measurement problem werealso examined. Measures of trial-to-trial variability(described earlier under Performance Measurement) were alsoexamined for two approach segments (3100 to 1100 feet and 1100to 100 feet from touchdown). Results for the trial-to-trialvariability measures were generally supportive of the findingspresented above although the differences between VTRS andcontrol pilots were not as strong. VTRS pilots performedslightly better than the control pilots in both segmentsindicating the effect described above was general throughoutthe approach. It should be noted that the methods used tocreate the individual pilot trial-to-trial variability measurescreated additional "missing" flight means which makes theseresults less powerful than for the measure of within approachglideslope variability.
Glideslope variability in degrees was also analyzed, butinconsistencies due to outliers from the in-close data resultedin a non-conclusive outcome. Within-trial glideslopevariability for the approach segments 3100 to 1100 feet and1100 to 100 feet were also examined, but for this measure itwas determined that segmented length was insufficient. Basedon examinations of approach flight paths, it appeared that theaverage period of an average actual flight path was too long,particularly for the 1100 to 100 foot segment. A full periodof corrective tracking activity within a defined segment mustexist in order to obtain a sensible variability value.
LINEUP PERFORMANCE
The data from the HYTAL tracking system in the lateraldimension appeared to be correct and without measurement bias(other than within the resolution of the system). Therefore,the summary scores of overall error were available andconsidered the most appropriate indicators of lineupperformance. For these data, it was felt that the time-on-target (TOT) summary scores were the best indicators ofperformance in the lineup dimension. Use of these scoresreduced the amount of missing data and alleviated the sometimessubjective task of editing for outliers. Further, the scoreitself is immediately interpretable in terms of "operationallymeaningful" effect magnitude. Tolerance limits were set at
37

NAVTRASYSCEN 85-C-0044--2
+0.75 and so the TOT measure simply gives the percentage oftime within this envelope. Anytime the pilot is within thisenvelope (and does not have an excessive error rate or change)he is in an "OK" status as far as lineup is concerned.
Table 11 presents the FCLP flight means for the TOT measureover the approach from 3100 to 100 feet from touchdown. Thesemeans suggest that the VTRS trained pilots did better at FCLPthan the control pilots and the analysis-of-variance summariespresented in Table 12 confirm this. In fact, the test ofsignificance for this comparison was significant across flights3 through 8 as well as across flights 3 and 4. However, anexamination of the means given in Table 9 suggests that thetransfer differential has dissipated by the sixth flight. Noother effects were significant although there was a suggestionthat the groups defined as early and late transfers differedacross flights 3 and 4. In this case the early transfer groupappeared to be better than the late transfer group as one mightexpect. Accordingly, the results for the early group alonewere examined. However, the results for the four within-VTRSexperimental factors showed no significant effects and meandifferences did not differ markedly from those shown for thecombined early and late transfer groups.
The overall transfer effect for the approach from 3100 to100 feet from touchdown was further investigated to determineif the transfer advantage for the VTRS pilots occurred inclose, at the start and middle, or was relatively constantalong the entire approach. To examine this, the lineup TOTscore was analyzed for the 3100 to 1100 ft. and the 1100 to 100ft. segments separately. The means for these segments are r
presented in Table 13 for the VTRS and control pilots. Table13 suggests that there was a difference in the 3100 to 1100 ft.segment with VTRS-trained pilots performing better. Analysisof varianace summaries for these data show that the differencesin the 3100 to 1100 ft. segment were significant across flights3 and 4 and across flights 3 through 8. On the other hand, thedifferences in the 1100 to 100 ft. segment were not signifi-cant. Therefore, the transfer effect was restricted to theearly part of the approach and not in close. Apparently, theVTRS training improved the ability of pilots to set up andstart the approach on the lineup dimension. Although anin-close benefit was not indicated, the improved ability to geta good start and perform better in the middle is obviouslybeneficial.
OTHER LINEUP MEASURES. RMS error scores for lineup performancewere also analyzed and results essentially paralleled thosegiven above. Because the RMS error data involved considerableoutlier editing, it is felt the TOT scores most accurately andcompletely show the outcome of the experiment. Therefore, the---RMS error data will not be presented here. The lineupvariability and bias components of RMS error were also examined
38

NAVTRASYSCEN 85-C-0044-2
TABLE 11. FLIGHT MEANS AT FCLP FOR PERCENT TIMEWITHIN +0.75o OF CENTER LINE FROM 3100
TO 100 FEET FROM IDEAL TOUCHDOWN
Experimental Flight2ruas 3 4 5 6 7 8 9
VTRS (early) 80 86 83 75 75 79 80
VTRS (late) 78 76 75 81 76 83 84
All VTRS Pilots 79 81 79 78 76 81 82
Control Pilots 76 75 72 76 77 82 73
Within VTRS Pilots
Day Scene 77 79 78 77 75 82 81
Night Scene 82 93 80 80 76 81 86
Wide FOV 77 83 78 77 74 84 85
Narrow FOV 82 79 80 80 77 79 79
20 Trials 76 79 79 80 77 81 83
40 Trials 84 82 77 79 77 83 75
60 Trials 78 84 80 75 73 79 84
Segmented Approach 77 81 79 80 70 72 81
Modified SI Approach 82 79 78 77 79 78 74
Circling Approach 79 83 79 77 80 85 85
39

NAVTRASYSCEN 85-C-0044-2
TABLE 12. ANALYSES OF VARIANCE FOT, FCLP LINEUP TOT SCORESFROM 3100 TO 100 FEET FROM IDEAL TOUCHDOWN
Flights 3 through 8 Flights 3 and 4
Source df Sums of sq.(%)' I df Sums of sq.(%)l F
VTRS (early vs late) 2 1 0.017 0.4 1 0.061 2.7VTRS vs Control 1 0.168 (4.5) 4.5* 1. 0.097 (3.8) 4.2*Scene Detail (SD) 1 0.053 (1.4) 1.4 1 0.053 (2.0) 2.3Field of View (FV) 1 0.009 (0.2) 0.2 1 0.000 (0.0) 0.0No. Trials (NT) 2 0.042 (1.1) 0.6 2 0.049 (1.9) 1.1Approach Type (AT) 2 0.013 (0.3) 0.2 2 0.000 (0.0) 0.0SD X FOV 1 0.007 (0.2) 0.2 1 0.000 (0.0) 0.0SD X NT 2 0.002 (0.1) 0.0 2 0.002 (0.1) 0.0FV X NT 2 0.057 (1.5) 0.8 2 0.032 (1.3) 0.7SD X AT 2 0.037 (1.0) 0.5 2 0.032 (1.3) 0.7FV X AT 2 0.012 (0.3) 0.2 2 0.010 (0.4) 0.2NY X AT 4 0.067 (1.8) 0.4 4 0.112 (4.4) 1.2Between Subjects 87 3.271 (87.5) 91 2.136 (84.7)
Blocks (BL) 2 .020 0.7BL X (VTRS vs Cont) 2 .010 0.3BL X SD 2 .030 1.0BL X FV 2 .010 0.3BL X NT 4 .053 0.9BL X AT 4 .039 0.6BL X 2-way Int. 26Within Subjects 175 2.670
1 Percent-variance-accounted-for between subjects only.2 Percent-variance-accounted-for not included in totals.
* p < .05
40

NAVTRASYSCEN 85-C-0044-2
TABLE 13. FLIGHT MEANS FOR LINEUP TOT SCORES FOR THEAPPROACH SEGMENTS 3100 to 1100 FEET AND 1100 TO 100
FEET FROM TOUCHDOWN
Flight
3100 to 1100 ft 3 4 5 6 7 8 9
VTRS Pilots 82. 89 82 83 81 88 86
Control Pilots 77 79 77 82 83 77 77
1100 to 100 ft
VTRS Pilots 76 68 73 69 65 68 75
Control Pilots 74 68 65 64 68 64 66
and indicate that the transfer effect was mostly composed ofthe variability component. This means that the control pilotswere more variable (erratic) in their lineup performancethrough the 3100 to 1100 ft. segment, not simply biased in onedirection or the other compared to the VTRS pilots.
LSO GRADES
Each pilot received a grade from an LSO for each pass atFCLP. This grade is supposed to be an indicator of overallperformance during the approach. Previous research (Collyer,Ricard, Anderson, Westra, and Perry,.1980) suggests that theprimary components of the grade in order of importance are: 1)touchdown accuracy, 2) approach glideslope control, 3) approachlineup control, and 4) approach angle-of-attack control. TheLSO grades represent the most complete data available for FCLPperformance and thus represent the most powerful analysis ofresults (at least in terms of number of data points). However,since the score itself is a composite, it does not necessarilyrepresent the most powerful analysis of components that make upthe score. Further, these grades contain error components dueto less than perfect within and between rater reliability. Thegrades are also used for motivational purposes at variouspoints in training and this further decreases objectivity andvalidity. Nevertheless, they are important scores and shouldbe viewed as such.
Table 14 gives the FCLP flight means for LSO grades for thevarious experimental groups. Inspect'ion of this table suggests-..that there are virtually no differences between groups on thismeasure. The means are very similar, differing by no more than0.1 unit in most cases.. Table 15 gives the analysis-of
41

NAVTRASYSCEN 85-C-0044-2
TABLE 14. FLIGHT MEANS AT FCLP FOR LSO GRADES
Experimental Flight
Groups 3 4 5 6 7 8 9
VTRS (early) 2.36 2.48 2.58 2.66 2.73 2.85 2.83
VTRS (late) 2.34 2.48 2.59 2.59 2.74 2.70 2.85
All VTRS Pilots 2.35 2.48 2.59 2.63 2.74 2.80 2.84
Control Pilots 2.33 2.49 2.59 2.67 2.73 2.74 2.83
Within VTRS Pilots
Day Scene 2.36 2.49 2.60 2.63 2.67 2.75 2.84
Night Scene 2.35 2.48 2.57 2.63 2.81 2.85 2.85
Wide FOV 2.34 2.42 2.54 2.60 2.72 2.79 2.81
Narrow FOV 2.38 2.55 2.62 2.65 2.75 2.81 2.87
20 Trials 2.36 2.45 2.53 2.61 2.66 2.76 2.86
40 Trials 2.40 2.47 2.60 2.68 2.83 2.82 2.71
60 Trials 2.32 2.54 2.62 2.60 2.75 2.80 2.96
Segmented Approach 2.42 2.54 2.61 2.64 2.76 2.79 2.85
Modified SI Approach 2.32 2.41 2.58 2.54 2..69 2.77 2.80
Circling Approach 2.30 2.51 2.58 2.67 2.78 2.85 2.79
42

NAVI''RASYSCEN 85-C-0044-2
TABLE 15. ANALYSES OF VARIANCE FOR FCLP LSO GRADES
Elights 3 through 8 Flights 3 and 4
source df sums of sq.(%) df sums of sq. (%) -. F
VTRS (early vs late)2 1 0.040 0.4 1 (.000] 0.0VTRS vs Control 1 0.001 (0.0) 0.0 1 .007 (0.1) 0.1Scene Detail (SD) 1 0.000 (0.0) 0.0 1 .013 (0.2) 0.2Field of View (FV) 1 0.129 (1.1) 1.3 1 .018 (1.3) 1.5No. Trials (NT) 2 0.052 (0.5) 0.3 2 .038 (0.6) 0.3Approach Type (AT) 2 0.088 (0.8) 0.5 2 .116 (1.7) 1.0SD X FOV 1 0.044 (0.4) 0.5 1 .012 (0.9) 0.2SD X NT 2 0.050 (0.4) 0.3 2 .192 (2.9) 1.6FV X NT 2 0.097 (0.9) 0.5 2 .123 (1.9) 1.0SD X AT 2 0.178 (1.6) 0.9 2 .079 (1.2) 0.7FV X AT 2 0.055 (0.5) 0.3 2 .074 (1.1) 0.6NY X AT 4 0.414 (3.6) 1.1 4 .190 (2.9) 0.8Between Subjects 103 10.280 (90.2) 103 5.72 (85.9)
Blocks (BL) 2 1.860 24.7**BL X (VTRS vs Cont) 2 0.082 1.1BL X SD 2 0.132 1.8L X FV 2 0.096 1.3BL X NT 4 0.096 0.6BL X AT 4 0.111 0.7BL X 2-way Int. 26Within Subjects 205 7.730
Percent-variance-accounted-for between subjects only.2 Percent-variance-accounted-for not included in totals.• p < .01
43

NAVTUASYSCEN 05-C-0044-.2
variance summaries for these scores and confirms that none ofthe groups differ significantly. There is a strong learningcomponent across groups suggested by the highly significantblocks effect, but the groups themselves do not diff-sr eitherinitially or across flights 3 through 8.
CARRIER QUALIFICATION SCORES
The VTRS training was not designed to impact carrierqualification (CQ) scores but it is still interesting toexamine these data. As described earlier, the VTRS trainingwas done with a fixed (non-moving) ship to approximate FCLPconditions rather than the boat for carrier qualification.Further, after approximately 80 FCLP approaches it would bedoubtful that any VTRS transfer effect would carry over to CQ.Nevertheless, the means for CQ LSO grades are given in Table 16.
As Table 16 suggests, there appears to be only trivialdifferences between the groups. Table 17, which gives theanalysis of variance summary for these data, confirms thatthere were no significant differences between any of thegroups. Thus, it is concluded that there was no carryover ofany transfer effect through FCLP to the boat, at least nonethat was reflected in the LSO score.
OTHER RESULTS
As described earlier, a great amount of time and effort wasexpended trying to adjust the bias of glideslope (vertical)position information that was acquired from the HYTAL lasertracking system. Part of that effort involved the conwtructionof a touchdown accuracy score based on glideslope position attouchdown. In fact, the results for this constructed vcozewere presented at at least one briefing (Wightman, Westra, andLintern, 1985). Although it is felt that the methods used toadjust the raw data were justifiable, it was decided not topresent those results here. First, there was still someuncertainty about the accuracy of the constructed score.Second, later more detailed examination of those data revealedsome inconsistencies which were difficult to explain. Finally,the results, which showed a large transfer advantage for theVTRS-trained pilots, were inconsistent with other findings. Itis believed that the results presented in this report, whichshow a more modest transfeL advantage for the VTRS pilots inboth the vertical and lateral dimensions of control during theapproach only, accurately and properly (without anycontroversy) portray the true results of the experiment.
COVARIATES. Several variables were examined as potentialcovariates for the field carrier landing task. A variablecapable of accounting for some significant portion of variance--at FCrP could increase the power to detect experimentaleffects. It could be also useful for predictive purposes as
44
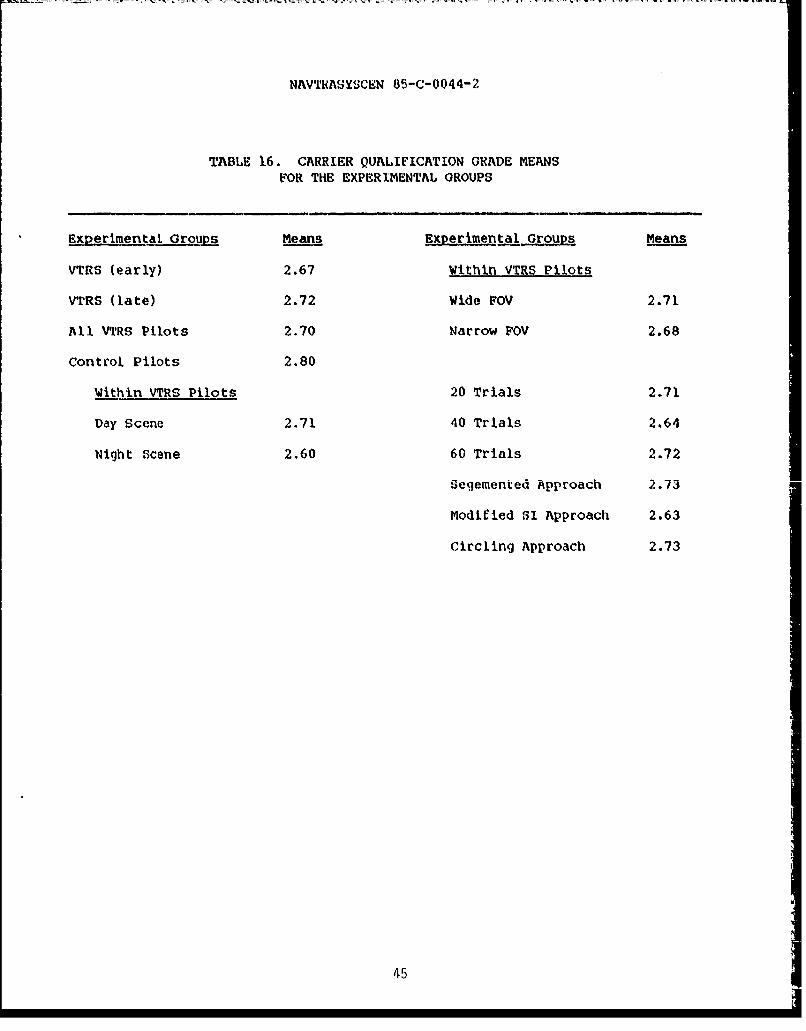
NAVTRASYSCEN 85-C-0044-2
TABLE 16. CARRIER QUALIFICATION GRADE MEANSFOR THE EXPERIMENTAL GROUPS
Experimental Groups Means Experimental roups Means
VTRS (early) 2.67 Within VTRS Pilots
V'rRS (late) 2.72 Wide FOV 2.71
All VTRS Pilots 2.70 Narrow FOV 2.68
Control Pilots 2.80
Within VTRS Pilots 20 Trials 2.71
Day Scene 2.71 40 Trials 2.64
Night Scene 2.60 60 Trials 2.72
Segemented Approach 2.73
Modified SI Approach 2.63
Circling Approach 2.73
45

NWIMTRFSYSCUN 85-C--0044-2
TABLE 17. ANALYSIS OF VARIANCE FORCARRIER QUALIFICATION GRADES
So u LrOSms
VTRS (early vs. late) 1 C.049] 0.3
VTRS VS. Control 1 .372 (2.02) 2.2
Scene Detail (SD) 1 .006 (.03) 0.0
Field of View (FV) 1 .020 (.11) 0,1
No. Trials (NT) 2 .123 (.67) 0.4
Approach Type (AT) 2 .123 (.67) 0.4
SD X FOV 1 .135 (.73) 0.8
SD X NT 2 .350 (1.90) 1.0
FV X NT 2 .035 (.19) .2
SD X AT 2 .098 (.53) .3
FD X AT 2 .034 (.18) .1
NT X AT 4 1.08 (5.85) 1.6
Between Subjects 104 16.09 (87.16) -
46

NAVTRASYSCEN 05-C-0044-2
well as to provide insight into basic attributes necessary forgood carrier landing performance. Previous work had indicatedthat an air combat manuvering (ACM) video game might bepredictive of FCLP performance (Lintern and Xennedy, 1984). Inaddition to ACM, a crosswind variable (vector component"celative to runway multiplied times windspeed), and runway(with code values assigned to the various runways used at FCLP)were examined. The crosswind and runway variables did notprove useful as covariates. They generally did not correlatesignificantly with the FCLP performance measures which werereported here. During the approach crosswind did show arelationship with the lineup bias scores. However, thesemeasures were not given much weight in assessing the outcome ofthe experiment.
The 10 ACM trials were categorized into means for the firstfive and last five trials. These means were significantlycorrelated (r=0.07) which agrees with previous results showinga high degree of internal reliability and differentialstability. However, there were no worthwhile correlations(none greater than r=0.20) between these ACM scores and FCLPLSO grades, approach glideslope scores, or approach lineupscores. One possible reason for these low correlation's mayhave been the poor reliability of the FCLP b.-,res. Flight-to-flight reliability for LSO grades ranged from r=0.15 to r=0.44and differential stability (at approximately r=.40) did notappear to be reached until flight 8. Results were similar forthe approach summary measures with flight-to-flightreliabilities ranging from r=0.O0 to r=0.46. These lowreliabilities could be due to several sources, but most likelyare due to task difficulty resulting in low within-subjectreliability, particularly in the earlier flights. Whatever thereason, the low FCLP flight to flight reliabilities virtuallyprecludes the use of covariates to increase power.
RECYCLED PILOTS. Although no meaningful formal analysis ortest of significance is possible, (because of the low numbersinvolved) it is useful to consider the number of recycles inthe experimental groips. A total of seven pilots out of the126 VTRS and control pilots were recycled through FCLP becauseof LSO decisions that they were not ready to attempt carrierqualification. Four of these pilots were from the controlgroup and three were from the VTRS group defined as "late"transfers. Table 18 gives a summary of this and indicates thatthere were no recycles within the VTRS group that transferredto FCLP within eight days of VTRS training. A further look atthe pilots who were recycled that were in the VTRS "late"transfer group indicates that these three pilots had delays of39, 44, and 47 days (6-7 weeks) between VTMS training andFCLP. In other words, there were no recycles among the pilotswho trained at VTRS and transferred to FCLP within a reasonableperiod of time.
47
--'

NAVTRASYSCEN 85-C-0044-2
TABLE 18. GROUP MEMBERSHIP OF RECYCLED PILOTS
Experimental Group No. of Recycles
VTRS (early) 0 (0.0%)VTRS (late) 3 (8.6%)Control Pilots 4 (7.4%)
48

NAVTRASYSCEN 85-C-0044-2
SECTION VI
DISCUSS ION/RECOMMENDATIONS
This experiment was a major undertaking in terms of time,expense, and logistics. It is remarkable that the effort wascarried out and brought to completion with as few problems asthere were. It was disappointing to be unable to recoververtical glideslope displacement measures, but enough soliddata were obtained to provide an accurate, realistic, andrelatively complete summarization of results.
JUDGING THE SIZE OF EFFECTS
In any complex experiment of this kind, with multipleperformance dimensions, it is sometimes difficult to judge theoperational or "real world" significance of results. In thecase of this experiment several statements can be made withcertainty, and interpretation of overall effect size must bemade based on these and all the other available information.The statements that can be made with certainty regardingtransfer effects are: 1) There was a significant advantage forVTRS-trained pilots at FCLP on the measure of approachglideslope vertical variability through flights 3 and 4, afterwhich there was no advantage. 2) There was a significantadvantage for VTRS-trained pilots at FCLP on approach lineupcontrol through flights 5 and 6. 3) There were no differencesbetween the VTRS and control groups at FCLP (or subsequentcarrier qualification) on LSO grade. 4) There were nosignificant differences at FCLP for any of the fourexperimental factors varied at VTRS. With these facts in hand,the discussion that follows will bring to bear other relevantinformation in an attempt to-fully consider and interpret theresults.
GLIDESLOPE AND LINEUP APPROACH PERFORMANCE. The size of thetransfer effect should be judged from several viewpoints.First, consider the percent-variance-account-for (eta squared)values. In the case of both lineup and glideslope variability,the overall transfer effect (VTRS vs. Control, see Tables 10and 12) accounted for just over 4% of the variance in thesemeasures across flights 3 and 4. Although it is arbitrary toassociate specific eta squared values with "small", "moderate"and "large" effect sizes, one guideline is given by Cohen(1977). He associates eta squared values of 1%, 6% and 11%with small, medium, and large respectively. Based on theauthors' own experiences with data of these type, they concurthat these values are appropriate. Based on this, then, theeffects for the two approach measures can be said to besomewhere between "small" and "moderate"; tending towardmoderate.
49

NAVTRASYSCEN 85-C-0044-2
The duration of the transfer eftect should also be takeninto account when judging overall size. As previously stated,the effect for one measure lasted approximately through the
*. fourth flight, and through the sixth flight for the other.Including flights 1 and 2 (flown largely by instructors);- these'durations represent 40% and 60% of the FCLP training period.Again, it seems that the judgment would be for effect sizessomewhere between "small" and "moderate."
LSO GR•ADES. The transfer effects for glideslope and lineupperformance must be balanced agai.nst the fact that no transferdifferences were found fo': the LSO grade. From oneperspective, this suggests that the overall transfer effectcannot be considered large, which was also suggested in thepreceding discussion considering only the glideslope and lineupscores. From another perspective, there is a question as towhy at least a trend for a real transfer effect did not show upin the LSO grade. Although it is superficially disturbing thatno such trend occurred, an examination of the score elementsreveals that the score is inherently insensitive to groupdifferences. Despite the fact that data for this FCLP measurewere relatively complete, and thus more powerful from a"numbers" viewpoint than some of the objective measures, thereare several other sources of measurement error which tend toweaken the sensitivity of the LSO grade.
As discussed previously, there are sources of measurement"* error for the LSO grade due to less than perfect between and
within scorer reliability. Furthermore, the grade tends to beused at FCLP for motivational purposes which causes validityproblems (the score is measuring something besides purelyobjective approach and landing performance). Also, asdiscussed previously, the score is a composite of severaldimensions of performance. This would tend to weaken itssensitivity if the effect were concentrated in just one'or twoof the dimensions. In fact, the effect does seem concentratedin the middle of the approach and not touchdown. Yet thetouchdown is given the most weight in the LSO grade. But evenmore importantly, sensitivity of the score is poor because ofits structure. In most cases pilots receive either a value of2 (below average but safe pass) or 3 (reasonable deviations)for their approaches. Values of 4 (reasonable deviations withgood corrections) and 1 (wave-off other than practice wave-off)do not occur very often and the value 2.5 (bolter) reflectsonly touchdown performance when it is given. In one sample of1198 aproaches, a value of 4 was given 8.3% of the time; 3,41.7%; 2, 27.5%; and 1, 2.8%. Thus, little discriminationother than in a crude sense is available from the score. Thenotes in the score sheets describing pilot deviations are ofmuch more value for training purposes than the score itself.
50

NAVTRASYSCEN 85-.C-0044-2
POWER REDUCTION DUE TO PROCEDURE. The reduction in sensitivityto detect effects caused by certain procedural (notmeasurement) problems must also be considered when judging thetransfer effect sizes. These were not problems withexperimental design or concept, but rather were inherent'-to'the."real world" field data collection at FCLP. The first probleminvolved the procedure at FCLP of instructors in the aircraftwith the student pilots during thkL first two flights. Theinstructor actually flies about. three-fourths of the passesduring these first two flights and gives intense, one-on-oneinstruction throughout. Thus, not only is there the time delayuntil valid measurement can begin in the third flight, butintense additional instruction and practice has been insertedduring the interim. This can't help but weaken the ability tomeasure effects; for example, if a one-flight transfer effectwere present there would be no way to measure it. This will beconsidered further in the discussion of the within-VTRS factors.
The other major problem that weakened the ability to detecttransfer effects was the delay in time between VTRS trainingand the start of FCLP caused by the breakdown of the aircraftcarrier used for training. Only a little over half of theVTRS-trained pilots started FCLP within one week of their VTRStraining while the others experienced delays of up to 2-1/2months. An effort was made to separate pilots based on delaytime and there was some suggestion that those who transferredearly did better at FCLP on lineup performance than those whotransferred late. However, the power to examine the within-VTRS factors for this group was weakened both by lower numbersand imbalance in the groupings (there was no control overcondition assignments based on early vs. late transfer sincethis was not anticipated when the experiment began). Thuslittle additional information was obtained by separating thegroups based on early vs. late transfer other than to note thatthe early transfers did better for some measures.
Taking all this into account, it is not surprising thatmore or larger effects were not detected. In fact, whenconsidering these issues, more credence is lent to the transfereffects that were detected. It is the authors' opinion thenthat a transfer advantage of reasonable and moderate size didoccur as a result of VTRS training. It is difficult to state aspecific value for the transfer effectiveness ratio, but itseems reasonable to state that one or two FCLP flights could besaved by simulator training. But rather than talk about"saving" flight time, the authors would prefer to point outthat there were no recycles among the VTRS-trained pilots whotransferred to FCLP within a reasonable period of time. Itwould appear to us that the real value of simulator trainingfor the carrier landing task lies in improved readiness and thereduction of recycles.
51

NAVTRASYSCEN 85-C-0044-2
In terms of an overall transfer effect, a final point toconsider is that VTRS training involved a fixed carrier formaximum transfer to FCLP conditions. However, the ultimategoal of all training is readiness for carrier qualification atsea under operational (moving ship) conditions. Since FCLPcannot provide the moving ship experience, it would seemappropriate to provide additional simulator training with amoving ship near or at the end of FCLP prior to carrierqualification. It would appear to us that such additionaltraining would further improve overall readiness and improveperformance at the boat. The issue is an important one, and anexperiment designed to test this hypothesis along with thetiming of the additional training in the FCLP schedule isrecommended.
THE VTRS EXPERIMENTAL FACTORS
The primary purpose of this experiment was to determinewhether high cost simulator display options for field of viewand scene detail would result in a transfer advantage comparedto much lower cost (but operationally reasonable) options.Further, we wished to determine the best way to use thesimulator for training in terms of number of trials andschedules of approach. An a priori assumption for meaningfultests of these factors was that overall transfer as a result ofVTRS training would occur. As discussed above, this transferhas been documented for certain FCLP measures but not forothers. Therefore, it only makes sense to discuss the transferdifferences due to VTRS conditions for those measures in whichoverall transfer was demonstrated.
FIELD OF VIEW. There were no transfer differences at FCLPnoted that were due to the field-of-view (FOV) conditions.Based on this information, the recommendation for. simulatordisplay design for this task is quite straightforward; thenarrow angle display iG recommended for the carrier landingtask. However, given the problems with FCLP data discussedabove, it will also be useful to consider other results. Fieldof view has been studied previously at VTRS in a performanceexperiment (Westra, Simon, Collyer, and Chambers, 1981), aquasi-transfer experiment (Westra, 1982), and elsewhere in aquasi-transfer experiment (Collyer, Ricard, Anderson, Westra,and Perry, 1980).
In the Westra et al. (1981) performance study the FOV wastested at roughly the same levels as in this experiment and nodifferences were found for task outcome scores. There was adifference found for a measure of roll variability with pilotsflying under the narrow FOV condition having greater rollvariability during approaches. Presumably, this result wassimply a function of not having as much horizon with which tojudge roll attitude. Overall, the FOV effect was judged assmall to marginal. There were also differences in approach
52

NAVTRASYSCEN 85-C-0044-2
performance due to the field-of-view factor during the trainingphase of the present experiment. Pilots training at VTRS withthe wide FOV had less lateral (lineup) error during trainingthan those training with the narrow field of view (see Table5). In the Collyer et al. (1980) quasi-transfer experiment.;-pilots were tested under an in-simulator wide FOV criterioncondition after training under either a wide or narrow FOV. Nodifferences on the criterion condition were detected fors-everal measures of approach. performance, landing performancescores, and the LSO grade. There were substantial differencesduring training with those training under. a wide FOV andcircling approaches performing better than those training witha narrow FOV and circling approaches.
Westra (1982) also tested field of view in a quasi-transferexperiment. The FOV levels. for training were similar to thosetested in the present experiment, and the criterion task had awide FOV display with full circling approaches. The wide FOVtraining condition did result in some advantage on the transfertask for final approach quality but not landing accuracy.There was essentially no advantage after eight transfer trials(equivalent to one flight at FCLP). This experiment had both ahigh degree of control and a good deal of power, and probablyrepresents the best that could be expected from a wide FOVdisplay. This being the case, it is not surprising that nodifferences were detected in the present experiment where thefirst valid transfer data started with the third flight. Insummary, it would seem that some benefit from a wide FOV couldbe expected. However, all evidence indicates that this benefitwould be fairly small and transient. Therefore, it is ourfinding that a wide FOV display is not justified for thecarrier landing task.
SCENE DETAIL. The scene detail levels which were compared inthis experiment did not result in any observable transferdifferences at FCLP. Based on these results, it would appearthat the higher cost associated wit. high scene detail asrepresented in this experiment is not justified for simulatingthe carrier landing task. Again though, all the informationgathered on this variable should be considered. Originally,this somewhat global factor was studied by Westra et al. (1981)as three separate dimensions in a performance experiment.These dimensions were ship detail (day vs. night), seascape andbrightness. Lineup performance was affected by ship detail(better performance with the daytime ship) but the seascape andbrightness factcrs had no meaningful effects. In thesubsequent quasi-transfer experiment (Westra, 1982), thesethree dimensions were combined into a scene detail factor withlevels defined as in the present experiment. The criterion ortransfer task in the quasi-transfer experiment had the highlevel daytime scene display.
53

NAVTRASYSCEN 85-C-0044-2
Several transfer effects were noted in the quasi-transferexperiment. First, there was a temporary (one flight)advantage on transfer for the high scene detail for glideslopeperformance and probably for angle-of-attack performance duringthe approach. There was also a transfer advantage for-the- highscene detail on lineup performance but only when straight-inapproaches were used during training. There were no transferbenefits noted for touchdown performance. Given the wellcontrolled nature of this quasi-transfer experiment, it wouldappear then that the maximum benefit that could be expectedfrom a high scene detail display would last about one flight atFCLP. As with field of view, there was little possibility ofdetecting an effect of this size in the present experiment withno valid transfer data available until the third flight. ILlsummary then, it appears that although some benefits for thehigh detail scene could be expected, the cost is simply notjustified in an operational trainer for the carrier landingtask. Simulators with visual displays similar to the displaysin the Night Carrier Landing Trainers (NCLTS) currently in usein the fleet would appear to be most cost-effective fortraining student Naval aviators.
APPROACH TYPE. FCLP data analyses did not reveal anysignificant differences due to approach type training condi-tions. Based on this finding there can be no doubt aboutrecommending the segmented approach type schedule for use underoperational training conditions. With this schedule the first25% of the training approaches are flown straight-in from 3000ft. aft (behind) the carrier. The next 25% of the trainingtrials are flown straight-in from 6000 ft. Then 25% more ofthe approaches are flown from 8000 ft. behind the carrier andoffset 1800 ft. port (left) of the ship's runway centerline.The final 25% of the approaches are flown as circlingapproaches starting from the abeam position. Thus, if 40training trials were specified, for example, a student pilotwould execute 10 approaches from each of the four startingpositions. This schedule saves approximately 42% of thesimulator time it takes to run an equal number of all circlingapproaches and offers (at least) equal training benefit.
Other research has indicated that backward chaining thetask actually provides better training in certain performancedimensions than full task (circling) approaches, despite thefact that less time in the simulator is involved. Wightman(1983) compared performance for subjects who trained for a 6000ft. straight-in whole (simulated) task under back%%rd chaining(approaches starting at 2000 ft., then 4000 ft., then 6000 ft.)and whole task (6000 ft.) conditions. The backward-chainingprocedure was more effective in training the whole task,although it must be kept in mind here that the criterioncondition was not the full circling task. In anotherquasi-transfer experiment, Westra (1982) trained pilots for thewhole circlinq task under either all circling approaches or all
54

NAVTRA3YSCEN 85-C-0044-2
modified straight-in approaches. The modified straight-inapproach group started approximately 12,000 ft. behind the shipin this case (to equate for time with circling approaches),4150 left of centerline, and heading 18 degreeis Lo the right ofthe ship's heading. The group training under this cond-ition:-,did better on line-up performance on the circling transfer taskthan the group training with circling approaches, despite neverflying the full circling task until the transfer test.Although in this case time in the simulator was equated, theresults indicated a significant benefit as a result ofpracticing the part task, with no negative benefits.
Originally, the modified straight-in approach was set up toprovide training on certain elements of final turn procedureswith the ship in view at all times during the narrow field-of-view display. It now appears that backward chaining providessignificant advantages as a training procedure. Therefore, abackward-chaining procedure similar to the one used in thepresent experiment is recommended for operational use.regard-less of the display specifications.
NUMBER OF TRIALS. VTRS pilots trained for 20, 40, or 60 trials(approaches) in this experiment. The intent with this factorwas to obtain incremental transfer information that could beused to define optimum use of an (operational) trainer in termsof training time. Although there were no significantdifferences in the FCLP data reported here, there were definitetrends established. In fact, in one analysis for flights 3 and4 for the FCLP glideslope variability score for the VTRS earlytransfer group only (not presented here), there was asignificant (p < .05) differential transfer due to number oftraining trials which supports this trend. This trend can beseen for flights 3 and 4 for the glideslope variaDility andlineup TOT scores which are presented in Tables 9 and 11.These data suggest that 20 training trials results in transferno different from the control group, while the groups trainingat VTRS with 40 and 60 trials did better than the controlgroup. But the 60-trial group generally did no better than the40-trial group. Clearly then, the recommendation is for 40training trials in an operational simulator, spaced in sessionsof 10 trials each as was the case during VTRS training.
However, in keeping with the notion of using a simulator toreduce recycles and for remedial training, it would be betterto think of 40 simulator trials as a base, with more trialsgiven to those who appear to have not mastered essentialskills. Further, as discussed previously, it may be desirableto add more simulator trials later or at the end of FCLP with amoving carrier to aid in preparation for carrier qualification.
55

NAVTRASYSCEN 85-C-0044-2
RECOMMENDATIONS FOR OTHER DESIGN O'TIONS. Before makingrecommendations for simulator design based on results fromprevious research, it seems worthwhile to comment on ourphilosophy regarding cost-effectiveness and fidelity. First ofall, fidelity itself should not |e a goal for simulator.. design;j.but rather training effectiveness. Each design option shouldthen be considered in terms of its cost and its trainingeffectiveness. There are several combinations of cost andtraining effectiveness which may occur. In one case the costmay be high and the training benefit low (e.g., motionplatform). In this case the recommendation is simple; theoption obviously is not cost-effective. Other cases mayinvolve options with relatively low cost and low trainingeffectiveness. In these cases, we would recommend the optionif it clearly improved fidelity and thus face validity andpilot acceptance. Factors which directly affect thepilot/aircraft response relationship (e.g., lag) bear specialcoqsideration since pilots will "learn" to fly whatever thesimulation is. We feel that a close proximation of thesimulated aircraft response system is important for a validsimulation. Table 19 gives our recommendations for simulatordesign for the carrier landing task for all design optionsexamined experimentally at VTRS, not including the presentexperiment. These recommendations are based on the findingstogether with considerations discussed above.
RECOMMENDATIONS FOR T-45 TRAINING SYSTEM
During the evolution of the VTRS carrier landing researchprogram, a specific need for the results of research becameapparent. This need involved design guidance for the T-45training system (T-45TS). The T-45TS will ultimately replacethe T-2C and TA4J aircraft currently used in the Jet Under-graduate Training Program (JUPT). The plan for T-45TS includesextensive use of simulators for training several flight.tasks,including carrier landing. The fact that these simulators willbe used to teach a number of tasks limits the application ofthe results somewhat, although the results clearly lead tospecifications for the optimum (cost-effective) configurationfor training the carrier landing task. Further, cost-effectiveuse of simulators for teaching the carrier landing task hasbeen defined in terms of approach type and number of trials.
The recommendations resulting from the carrier landingresearch program should be thought of as minimums for theT-45TS simulator designs. The other tasks which are to betaught in the simulators must be studied individually todetermine if more costly design options are necessary. In somecases, it may be possible to study certain task dimensions fromdifferent tasks which represent common elements, but ingeneral, performance is task specific and thus the individual(distinct) tasks must be considered separately. Given analready defined minimum simulator configuration for one task,
56

NAVTRASYSCEN 65-C-0044-2
TABLE 19. RECOMMENDATIONS FOR OTHERSIMULATOR DESIGN OPTIONS
Factor Recommendation Comments
Platform motion No motion No differences found
G-seat No g-seat No differances foand
FLOLS CIG Needs to be greaterthan actual size
TV Line rate 525 For AO display with4:1 zoom
Engine update 30 hz Although no markeddifferences werefound, the rela-tively small cost isjustified
Visual lag < 133 msec Longer lag causesattitude controlproblems
Ship Type CIG The flexibilityafforded by CIGdisplays vastly out-weighs any modelboard advantage
Seascape Homogeneous Wave pattern is notbackground necessary but well
defined horizen is
FLOLS rate cuing Rate cuing Does not appear tofor fleet enhance training for
student pilots. Con-siderably improvedperformance ofexperienced pilots
Simulator freeze "Freezing" Freeze mayduring approach contribute tonot recommended as simulator sicknessa training tool
57

NAVTRASYSCEN 85-C-0044-2
future research on other tasks should focus vn whetheradditional design features are needed, and other researchalready conducted should be evaluated from this viewpoint. Forexample, the VTRS research does suggest that a wider field ofview and higher level of scene detail are necessary fortraining the air-to-ground bombing task than are necessary forthe carrier landing task (Lintern, Sheppard, McKenna, Thomley,Wightman, and Chambers, 1985).
I.._
58

NAVTRASYSCEN 05-C-0044-2
SECTION VII
SUMMARY
A field transfer-of-training experimeiLt was conducted todefine simulator design requirements and araining proceduresfor the carrier landing task. Two. visual display factors andtwo simulator training factors were incl-ded in theexperiment. The factors were scene deteil (day vs. night),field of view (wide vs. narrow), approa~h type (segmented,modified straight-in, circling), and number of simulator trials(20, 40, 60). Student Naval Aviators were trained in theVisual Technology Research Simulator in the carrier landingtask under the experimental conditions pr.'or to going throughthe Field Carrier Landing Practice (FCLP) phase of their pilottraining program. Performance was then assessed at FCLP whichserved as the transfer condition. Other student aviators, notpretrained in the VT1S, were used for conr;.ol comparison.
Pilots who received additional carrier landing training atthe VTRS did significantly better at FCLP on measures of glide-slope and lineup control than control pilots not receivingsupplemental training. There were also no recycles among theVTRS-trained pilots who transferred to FCLP within two weeks,compared to seven (7.9%) recycles in the control and latetransfer groups. There was no transfer advantage for thosetrained with a daytime high-detail scene. Similarly, there wasno transfer advantage for those trained with a wide field ofview compared to those trained with a lower cost narrow field-of-view scene. Those pilots who had 40 or 60 simulator trialsdid considerably better on transfer than the control group,while those who had 20 simulator trials did not. The 60-trialgroup was not significantly better than the 40-trial group,which suggests a point of diminishing returns after 40simulator trials. The pilots who trained with a segmentedapproach schedule did as well or better than those trainingwith either the modified straight-in approach schedule orall-circling approaches. Since the segmented approach scheduleinvolved the least time in the simulator, this method has theadvantage and is the recommended method.
59/60

NAVT[RASYSC1.N 05-C-0044-2
REFERENCES
Dickley, W. R. Optimizing simulator-aircraft training mixes.Army Research Institute, Fort Rucker, AL: Proceedings of2nd Interservice/Industry Training Equipment _Conference andExhibition, National Security Industrial Association,November 1980.
Brictson, C. A. and Burger, W. J. Transfer of training effec-tiveness: A7E night carrier landing trainer (NCLT), device2FI03. Orlando, FL: Naval Training Equipment CenterTechnical Report NAVTRAEQUIPCEN 74-C-0079-1, 1976.
Brictson, C. A., Burger, W. J., and Wulfeck, J. W. Validationand application of a carrier landing performance score:The LPS. Santa Monica, CA: Dunlap and Associates, Inc.,March 1973.
Buckland, G. H., Monroe, E. G., and Mehrer, K. L. Flight sim-ulator runway visual textural cues for landing. WilliamsAFB, AZ: Operation Screening Division AFHRL-TR-79-81,August 1980.
Cohen, J. Statistical power analysis for the behavioralsciences. New York, NY: Academic Press, 1977.
Collyer, S. C. and Chambers, W. S. AWAVS. a research facilityfor defining flight trainer visual requirements. Proceed-inis of the Human FactoL• Society 22nd Annual Meeting,Santa Monica, CA: Human Factors Society, 1978.
Collyer, S. C., Ricard, G. L., Anderson, M., Westra, D. P.,, andPerry, R. A. Field of view requirements for carrier land-ing training. Brooks AFB, TX; Air Force Human ResourcesLaboratory Report IH-31.9 AFHRL-TR.-80-10, June 1900.
General Electric Co. Systems description--Aviation wide-anglevisual system (AWAVS) computer image generator (CIG) visualsystem. Space Division, Daytona Beach, FL: TR NAVTRA-EQUIPCEN 76-C-0048-1, February 1979.
Golovcsenko, 1. V. Computer simulation of fresnel lens opticallanding system. Orlando, FL: Naval Training EquipmentCenter Technical R•eport NAVTRAEQUIPCEN IH-265, September1976.
Hughes, R. G., Linter.n, G., Wightma.., D. C., Brooks, R. B., andSiagleton, J. Applications of simulator freeze to carrierolideglope tracking instruction. Orlando, FL: NavalTraining Equipment Center Technical Report NAVTRAEQUIPCEN78-C-0060-9/ AFIURL-TR-82--3, 1981.
61

NAVTRASYSCEN 05-C-0044-2
Isley, R. N. and Spears, W. D. Prhase I pilot study: VTRSRtransfer of training experiment. Orlando, L: NavalTraining Equipment Center Technical R.port NAVTRAEQUIPCENN61.339-00-D- 0009-17-2, 1902.
Kraft, C. L., Anderson, C. D., and Elworth, C. L. Peripheralcues and color in visual simulation. Seattle, WA: DataProcessing Technology, Boeing Aerospace Company, FinalTechnical Report, March 1900.
Levine, D. W., and Dunlap, W. P. Power of the F test withskewed data: Should one transform or not? PsycholoqicalBulletin, 1992, 92, 272-280.
Lintern, G. Kaul, C. E., and Collyer, S. C. Glideslopedescent-rate cuing to aid carrier landings. Human Factors,1.904, 26, 667-676.
Lintern, G. and Kennedy, R. S. Video game as a covariate forcarrier landing research. Perceptual and Motor Skills,1984, 58, 167-172.
Lintern, G., Mauk, R., and Cotton, J. C. Final approach track-ing error measurement for field carrier landing practice.Orlando, FL: Naval Training Systems Center TechnicalReport NAVTRASYSCEN 85-C-0044-3, in pross.
lintern, G., Sheppard, D. J., McKenna, D., Thomley, K. E.,Nolan, M., Wightman, D. C., and Chambers, W. S. Simulatordesign and instructional features for air-to-ground attack:Transfer study. Orlando, FL: Naval Training systemsCenter, NAVTRASYSCEN 85-C-0044-1, 1965.
Lintern, G., Thomley, K., Nelson, B., and Roscoe, S. N.Content, variety, and augmentation of simulated visualscenes for teaching air-to-ground attark. Orlando, FL:Naval Training Equipment Center Technical ReportNAVTRAEQUIPCEN 01-C- 0105-3, 1984.
McCauley, M. E. and Cotton, J. C. VTRS carrier landing,trans•fer of training, and performance measurement develop-ment. Westlake Village, CA: Canyon Research Group, Inc.,March 1902.
Martin, E. L. and Cataneo, D. F. Computer generated image:Relative training effectiveness of day versus night visualscenes. Williams AFB, AZ: Air Force Human ResourcesLaboratory, AFHRL-TR-79-56, 1980.
Orlansky, J.. Current: knowledge and pirojcction for assessinqthe effectiveness of trainlinq. Warrenton, VA: Society forApplied Learning Technology. Technology of TrainingEffectiveness and Evaluation for Productivity Assessment,July 1902.
6
62

NAVTRASYSCEN 85-C-0044-2
Povenmire, H. K. and Roscoe, S. N. An evaluation of ground-based flight trainers in routine primary flight training.Human Factors, 19'71, 13, 109-116.
Povenmire, H. K. and Roscoe, S. N. Incremental transfers effec-tiveness of a ground-based general aviation trainer. HumanFactors, 1973, 15, 534-542.
Salmoni, A. W., Schmidt, R. A., and Walter, C. B. Knowleuge ofresults and motor learning: A review and criticalappraisal. Psychological Bulletin, 1984, 95. 355-386.
Sheppard, D. J. Visual and part-task manipulations for teach-ing simulated carrier landings. Orlando, FL: Naval Train-ing Equipment Center Technical Report NAVTRAEQUIPCEN81-C-0105-9, 1985.
Simon, C. W. Economical multifactor designs for human factorsengineering experiment. Los Angeles, CA: Hughes AircraftCompany Technical Report No. P73-326-A, 1973.
Simon, C. W. New research paradigm for applied experimentalpsychology: A systerm approach. Westlake Village, CA:Canyon Research Group, Inc. T hnical Report CWS-03-77,1977.
Singer-Link Division. Aviation wide-angle visual trainer sub-system design report. Binghampton, NY: TR NAVTRAEQUIP-CEN 75-C-0009-13, May 1977.
Spears, W. D. Measurement'of learninq and transfer throughcurve fitting. Human Factors, 1985, 27, 251-266.
Waag, W. Training effectiveness of visual and motion simula-tion. Williams AFB, AZ: USAF Human Resources Laboratory,Operations Training Division, AFHRL, USAF, HRL TR-79-72,1980.
Westra, D. P. Investigation of simulator design features forcarrier landing: II. In-simulator transfer of training.Orlando, FL: Naval Training Equipment Center TechnicalReport NAVTRAEQUIPCEN 81-C-0105-1, 1982.
Westra, D. P., and Lintern, G. Simulator design features forhelicopter landing on small ships. I. A performancestudy. Orlando, FL: Naval Training Equipment Center,NAVTRAEQUIPCEN 81-C-0105-13, 1985.
Westra, D. P., Simon, C. W., Collyer, S. C., and Chambers, W.S. Simulator design features for carrier landing: 1.Performance experiment. Orlando, FL: Naval TrainingEquipment Center Technical Report NAVTRAEQUIPCEN 78-C-0060-7, 19801.
63

NAVTRASYSCEN 85-C-0044-2
Wightman, D. C. Part-task training strategies in simulatedcarrier landing final approach training. Orlando, FL:Naval Training Equipment Center, Human Factors LaboratoryTechnical Report NAVTRAEQUIPCEN 111-347, 1983.
Wightman, D. C., Westra, D. P., and Lintern, G. Transfer oftraining of simulator visual and training features for thecarrier landing task with undergraduate pilots.Proceedincs of the 7th Interservice/Industry TraininEquipment Conference, Orlando, FL: 1985.
6I
644

NAVTRASYSCEN 85-C-0044-2
APPENDIX A
FRESNEL LENS OPTICAL LANDING SYSTEM
The Fresnel Lens Optical Landing System (FLOLS) providesprimary glideslope displacement information for a carrierapproach to landing. It consists of light sources behind fivevertically-stacked Fresnel lenses that are situated between twohorizontal light arrays known as the datum bars. The array oflenses and lamps provides a virtual image which appears to thepilot as a single light located 150 feet behind the datumbars. This light is known as the meatball. It is visible tothe pilot through the center lens and is seen as level with thedatum bars when the aircraft is within 9.5 minutes of arc ofthe glideslope. As the aircraft moves more than 9.5 minutesof arc above or below the glideslope, the meatball is seenthrough higher or lower Fresnel lenses to give the appearanceof moving vertically above or below the line of the datum barsFigure A-i depicts the FLOLS and its projection aft of thecarrier.
For a carrier approach the pilot attempts to follow adesignated glideslope (usually 3.5 degrees) by keeping themeatball level with the datum bars, so that a hook attached tothe ý:ail of the aircraft will contact the landing deck midwaybetween the second and third of four arrestment cables. Thesecables (more frequently referred to as wires) are stretchedacross the landing deck at different distances from the ramp.Under. the aircraft's momentum the hook travels forward to snagthe third wire for a trap (arrested landing). The first orsecond wire may be caught on a low approach and the fourth on ahigh approach. Very low approaches can result in a ramp strikewhile high approaches can result in a bolter (a missed approachbecause of touchdown beyond the wire arrestment area).
65

NAVTRASYSCEN 85-C-0044-2
MEAT BALL
2 MEATBALL HEIGHTS ABOVE CENTER
= 3/4° ABOVE CORRECT GLIDE SLOPE
S'-MEATBALL CENTERED, CORRECT GLIDE SLOPE
2 MEATBALL HEIGHTS BELOW CENTER- 3/4" BELOW CORRECT GLIDE SLOPE DESIGNATEb GLIDE PATH
D THIGH BALL
DATUM BARIS
FLOLSLOCATION
0.75° , TAIL HOOK
RAMP LOW BALL
FLOLS \-ARRESTMENTVIRTUAL WIRESIMAGE
INTENDED HOOKTOUCHDOWN
Figure A-1. Carrier Approach Geometry Depicting FLOLSProjection of Glideslope Deviation Information.Adapted from Golovcsenko (1976).
elm
66

NAVTRASYSCEN 85-C-0044-2
APPENDIX B
INSTRUCTOR AIDS
The Instructor/Operator (10) station provides thecapability of interacting with the computer and flight simu-lator and monitoring pilot performance. Among the principalfeatures of the 10 station are six monitors. Two alphanumericmonitors are used by the operator to interact with the computerand flight simulator to develop, control, arid record theexperiment. Two color video monitors display the images fromthe two channels of the computer image generator (CIG) and twographic monitors present graphic displays of the operator orinstructor's choice (Figure B-i).
The video and graphic monitors were used by the instructorsto monitor pilot's performance during the experiment. Thevideo monitors gave a general perspective of what the pilot wasseeing in the simulator. One monitor displayed the backgroundscene (seascape and sky) and the other monitor displayed thehigh resolution target image (carrier). The two graphicmonitors provided the LSO with feedback on the student pilot'sperformance. One display was a real-time view of major cockpitinstruments (Format C display) and the other display presenteda time history and performance measure plotted from a distanceof 6000 feet from the carrier to touchdown (LSO display).
The layout of Format C is shown in Figure B-2. Most of theinstruments displayed in Format C were replications of the T2-Ccockpit instruments. Thus, the instructor could monitor thepilot's control inputs and the aircraft's flight character-istics and position for each pass. A list of the instrumentsdisplayed in Format C are shown in Table B-I.
The layout of the LSO display is shown in Figure B-3. Thedisplay provided the LSO with a time history of each carrierapproach for six performance and control measures. Theparameters were plotted along the horizontal axis of the LSOdisplay with the solid lines indicating optimum performance orcontrol settings, and the dotted lines representing actualperformance. These measures are described in Table B-2.
TECHNICAL INFORMATION
The computer system consists of multiple SEL 32/77 centralprocessing units. The graphic monitors were manufactured byVector General. The software to generate the Format C displaywas written and cataloged under the SEL assembler. Two modulescomprised the Format C software program. The Vector General,assembly display l.st software (30 pages) generated theskeleton (nondynamic) display of the main instrumentation of
67

NAVTRASYSCEN 85-C-0044-2
Format C. The Vector General Buffer generated the staticdisplay from this program.
The dynamic changes of Format C were driven by the SELassembly drive module (25 pages). This program was the° driver ....routine for the Format C display. On the first pass-throughthis routine the graphics status word is reset and the VectorGeneral code is read from the disc into the Vector GeneralBuffer. This routine then updates the values used to draw thecurrent position and values of the instruments. The LSOdisplay was generated in a similar manner as the Format Cdisplay. A copy of the software to generate these displays isavailable upon request by ,!ontacting the Visual TechnologyResearch Simulator.
68
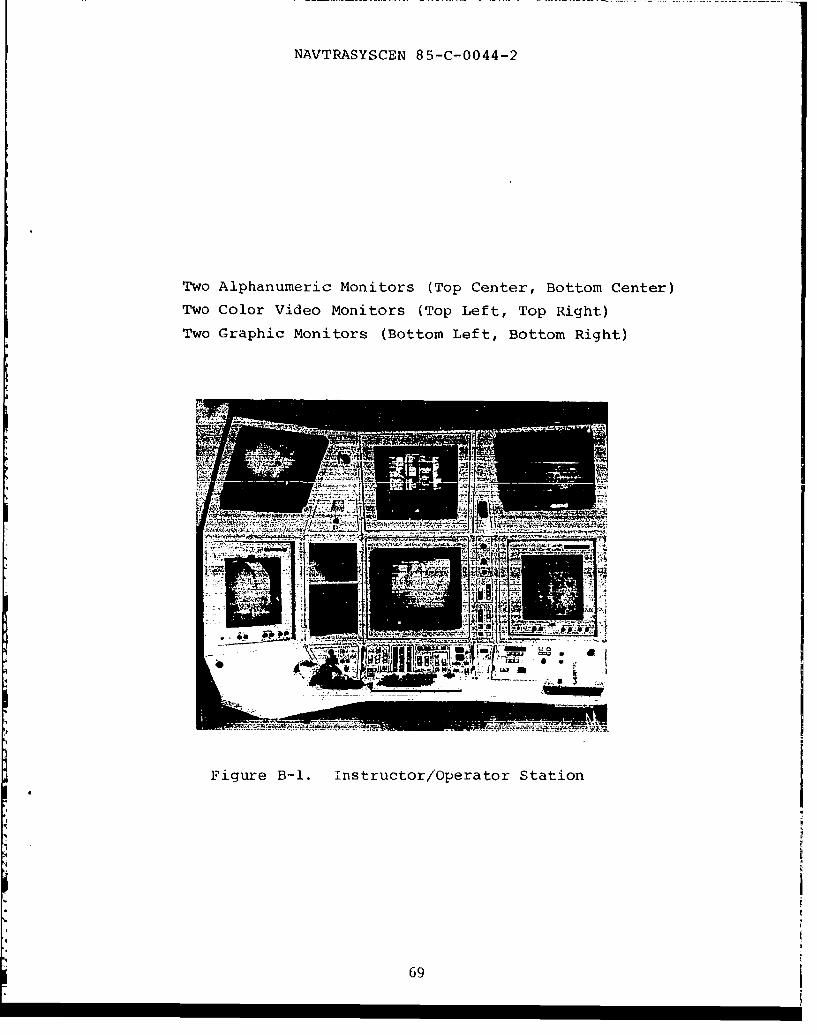
NAVTRASYSCEN 85-C-0044-2
Two Alphanumeric Monitors (Top Center, Bottom Center)
Two Color ViLdeo Monitors (Top Left, Top Right)
Two Graphic Monitors (Bottom Left, Bottom Right)
AA, I!a I i --.141
Figure B-1. instructor/Operator Station
69

NAVTRASYSCEN 85-C-0044-2
ANA
0 20 HII0i,0IK101
1-8
6
96
U SII
__0 __ ___O0__ __ _ 3 0O10
RPM19
U
AL\ AL
FiueB-.Lyuti of SLrPatEC. InstrumentsShow
700
.N
"oý \1
Tr ER/ C
700
2NU
\CE =. 56 n',
.*.

NAVTRASYSCEN 05-C-0044-2
Table BI-1. INSTRUMENTS DISPLAYED IN FORMAT C
Angle of Attack Indicator (AOA)
Airspeed Indicator (ASI)
Altitude Indicator (ALT)
Attitude Indicator
Power Gauge (RPM)
Elevator Trim Indicator (Elev Trim)
Vertical Speed Indicator (Vert Vel)
Turn and Slip Indicator
Flaps Indicator
Speed Break Indicator (Spd Urk)
Hook Indicator
71

NAVTRASYSCEN 85-C-0044-2
-00
kill)-750
_-- 1000
20
..........................................
I -_ _ _ _ _ _ _ _ _ _ _ _ _ ! . 5
:10
07
12
c -- 26
,--. . .... . 0 2 "
,,,J _ -10 0
a: - _ _ _ _[lo
U.. • . . . .... •. .
• .9q
2030
0 1000 2000 3000 4000 5000 6000
Figure B-3. Layout of LSO Display. PerformanceIndices are Sumarized in Table B-"2.
72
D-- • . .... .

It ~ 'N' Wk~~~ "-" V~r' W 'm V V'W V -, 4J IVNVlw, W 1
NAVTRASYSCEN 85-C-0044-2
TABLE B-2. PERFORMANCE MEASURES PLOTTEDIN THE LSO DISPLAY
Performance Range ofMeasures Optimum Deviation
Glideslope On glideslope Between two balls aboveDeviation (Center Ball) and below glideslope
Lateral On centerline Between 200 ft left andDeviation right of centerline
Angle of Attack 15 Units AOA Between 10 and 20 units(AOA) AOA
Vertical 500 RPM rate of Between 0 and 1000 FPM
Velocity descent rate of descent
Power 82% Between 70% and 94%
Pitch Eight degrees Between 4 and 12pitch up degrees pitch up
73/74

NAVTRASYSCEN 05-C-0044-2
APPENDIX C
FIELD PERFORMANCE MEASUREMENT
A laser tracking system, known as HYTAL for Hybrid TerminalAssist Landing, was selected for field data acquisition. It isa brass-board, laboratory demonstration system that wasdeveloped at Naval Weapons Center, China Lake, as a backup forthe microwave automatic carrier landing system. Many factors,including cost, availability, and potential accuracy enteredinto the selection of this device for our study (McCauley andCotton, 1902).
The HYTAL system was placed near the active runway (FigureC-i) and used to measure vertical and lateral deviations fromthe approach glidepath during field carrier landing practice.This was accomplished with a laser transmitter/receivertracking head (Figure C-2) that rotated in azimuth andelevation. A low-power laser signal (eye-safe at 4 feet) wastransmitted towards the approaching aircraft as it turned ontothe final approach after the tracking head was manually alignedin its ga•nral direction. Each of th^ test aircraft was fitt-ewith a glass retroretlector to return the laser signal (FigureC-3). The tracking head searched in the vicinity of theaircraft until it found and locked onto the return signal. Thetracking head remained locked onto the direction of maximumsignal return until the aircraft touched down on the runway andpassed the tracking station.
Aircraft position was sampled at 20 Hz. Range wasdetermined by the time required for a laser pulse to travel tothe aircraft and back to the laser receiver. Azimuth andelevation angles of the HYTAL tracking head were transformedinto electrical digitized signals which were used to determineazimuth and elevation angles of the approaching aircraft. Thenecessary transformations of the electronic signals to readoutsof range, azimuth, and elevation were accomplished withintegrated circuits. The final readings were stored on audiotrack number I of a video tape. The video channel was used tostore a visual record of the aircraft approach, and audio tracknumber 2 for a record of LSO comments and wave-off instruc.-tions. Wind speed and direction were also recorded for eachapproach.
75
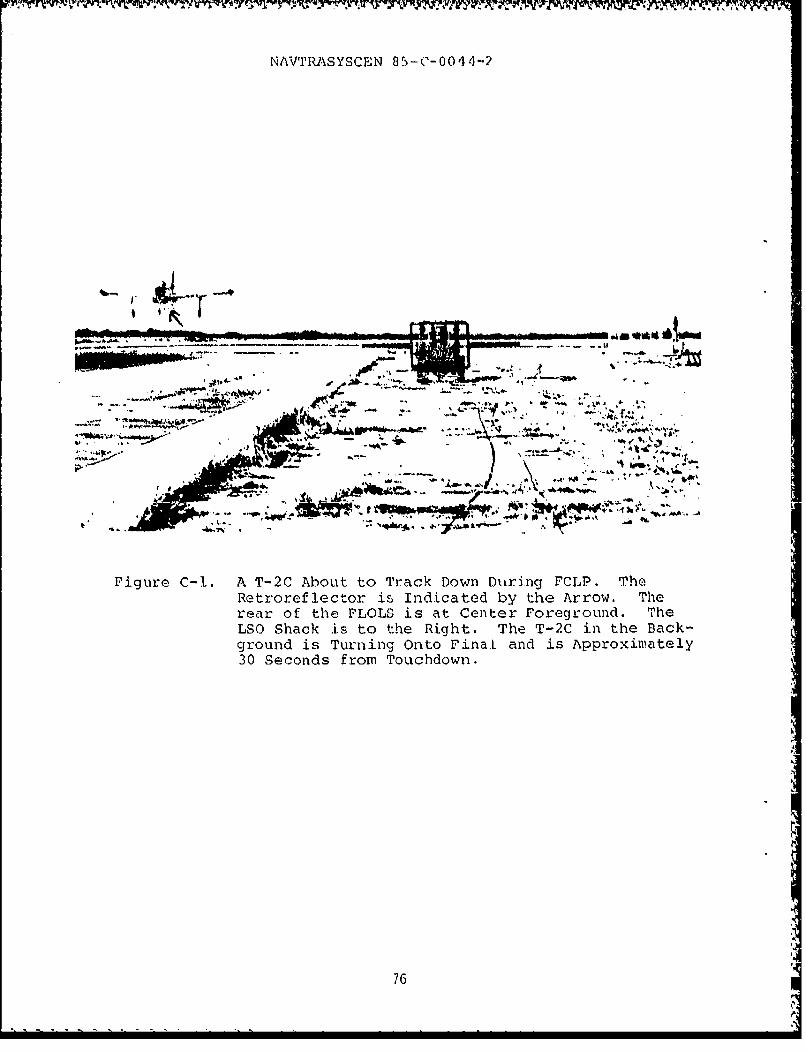
NAVTRASYSCEN 85-C-0044-2
'Ac
Pigure C-1. A T-2C About to Track Down Dutring FCLP, Th
Retr-oref lect-or is Indicated by the Arrow. Therear of the FLOLS is at Center -oreground. TheLS Shack is to the Right. The T-2C in the Back-
ground is Turning Onto Final and is Approximately30 Seconds from Touchdown.
76

NAVTRASYSCEN 85-C-0044-2
Figure C-2. HYTIAL Tracking Head as Mounted in the Van
Ready for Gl ideslope Tracking
-77

~A. NAVTRASYSCEN 85-C--0044--2
R.ALanding L~ight
-- Assembly
-F.__ -U _
P.2-7
ZSIý R- :.' x
N5i
Figure c2-3. Two Views of the 1Retrorefl.ectcrMounted in a T-2C Landing Lignt Housing
U 78

NAVTRASYSCEN 85-C-0044-2
HYTAL azimuth and elevation accuracy is rated at +/- 0.1degrees (+/- 6 arc minutes). Range accuracy is rated at +/- 2feet at one mile. Small errors in some of the constants usedto calculate aircraft elevation and azimuth were presumablyintroduced by the need to move the HYTAL system occasionally.The equipment was calibrated before the commencement of trialseach morning. Wind shifts occasionally forced a change in theactive runway and it was necessary to move the HYTAL trackingsystem at these times. Calibrations were checked each eveningafter the completion of the day's flight trials. Range andelevation were calibrated with a retroreflector mounted on a5-foot pole which was placed vertically on a concrete pad 230feet from the HYTAL tracking head. For the elevationcalibration, information about relative ground height at theconcrete pad and HYTAL head was essential. This was measuredby a water-level method as illustrated in Figure C-4. Azimuth
was calibrated with the calibration pole placed vertically atthe nominal touchdown point on the runway. Discrepanciesbetween actual and measured range, elevation, and. azimuth atcalibration were used to adjust the data prior to statisticalanalysis.
Proper calibration of the FLOLS was .. o consideredessential. The nominal glideslope war 3..5 degrees. Anyinadvertent error in the glideslope angle indicated by theFLOLS would induce pilots to fly below or above the HYTAL"zero-error" glideslope. LSOs calibrated the FLOLS with anangled mirror placed on a pole approximately 18 feet inlength. The calibration spot was a surveyed, concrete pad, 150feet in front of the FLOLS (Figure C-5). The length of thepole can be adjusted for various FLOLS settings. Under normalcalibration procedures, the LSO adjusts the pole to the correctsetting and then stands it on the concrete calibration point.The mirror is then at the height that a pilot's eye would be ifflying down the glideslope and at that distance from theFLOLS. The LSO should see a center ball in the FLOLS bylooking into the angled .ror. Experimenters noted that LSOswould accept slight but noticeable deviations from centerball. I.' , the -xperimenters checked the FLOLS calibrationeach d-,, Žfore the LSO, arrived at the site and advised themif they 1.1Lought adjustments were desirable. Experimentersjudged that accuracy of the FLOLS setting was maintained within+1- 0.08 degrees by this procedure.
System calibration was further checked with one series oftest flights. An LSO flew approaches in a test aircraft withintentional deviations to the left or the right, and above orbelow the glideslope. Inspection of data from these trialsshowed deviations similar to those intended by the LSO. Inparticular, directions of errors were carefully checked.
Digital data were lifted from the video tape and convertedby '-:dware to VAX compatible format. fluring this process,
79

NAVTRASYSCEN 85--C-00O44--2
a:)0 1-4 4_
I'_____4_
ll f-
-i >-i 0 r4H
w l0
4J Q) 0~
0). fu )
(n P- >i, 4-)
41
0-4-s *E- ro 4
a~) -U-I
CA r.J' 0 0H_____0 t t fX
*~0UNU
4JQ
'4d

NAVTRASYSCEN 85-C-0044-2
61t
Figure C-5. FLOLS Calibration Procedure Used by LandingSignal Officers to Set the FLOLS Glideslope
81

NAVTRASYSCEN 05--C-0044-2
subjects, trials, and conditions were identified from VTRS datalistings, from LSO field records, and from information on audiotracks I and 2. Care was taken by integrating information fromvarious sources to ensure that trials had been identifiedcorrectly. This care was essential because aircraft oftenturned to final at 30-second intervals and would be tracked forapproximately 20 to 30 seconds. Occasionally, some of theaircraft in the patterns were not involved in the experiment.Trial identification information was included in the computerI records as header information.
The "bang-bang" operation of the laser tracking headproduced some instability in the last bit of the digital recordof stored values. This caused the azimuth and elevation datato dither by approximately 0.5 degrees. A moving filter was
. applied to the raw data to smooth this instability. Figure C-6is a representation of the filter mechanization used for thispurpose. At the start of the data stream, outputting of thefirst average was suppressed until the seventh value wasreceived. Subsequently, the averaging "gate" moved along onevalue at a time to provide the average for the last sevenvalues of the raw data. Accordingly, the filter had a timeconstant of approximately one-third of a second which isconsidered inconsequential for practical measurement purposes.At the same time, the data storage rate was reduced from 20 Hzto 5 Hz, that being considered adequate for any conceivableanalyses.
Trigonometric transformations programmed in software wereused to convert the HYTAL-referenced values to angles anddistances that were referenced to the ncminal glideslope andnominal point of touchdown.
The horizontal and vertical geometry is shown in FiguresC-7 and C-8. The following constants are used in thecalculations,
VRR = Vertical distance between the retroreflector andthe bottom of the main wheels with the oleo strutextended.
LRR = Lateral distance between the retroreflector andthe vertical axis of the main wheels.
VHD = Vertical distance between the HYTAL sensing headhorizontal reference line and the center of theFCLP deck.
HSC = Lateral distance between the HYTAL sensing headlateral reference line and the center line of theFCLJP deck.
82

NAVTRASYSCEN 85-C-0044-2
LTD = Lateral distance between the HYTAL sensing headand the nominal touchdown point.
The following output variables were provided by the HYTALsensing device.
SRR = Slant range from the HYTAL sensing head to the
retroreflector on the nose of the aircraft.
OHS = Azimuth angle to the aircraft retroreflectorrelative to the HYTAL sensing head verticalreference line.
4PHS = Elevation angle to the aircraft retroreflectorrelative to the HYTAL sensing head lateral:eference line.
The instantaneous laterally corrected range was calculated from:
SCR = SRR, cos(0HS) cos(OHS),
and the instantaneous corrected range from the aircraft wheelsto the touchtown point from:
RTD SCR + LRR - LTD
and the instantaneous lateral displacement from the HYTALlateral reference line from:
HLD = SRR sin(0HS) cos(OHS)
Therefore, the aircraft's displacement from the FCLP deckcenterline at any instant was:
HAP = HLD - HSC (for given left/right convention).
The instantaneous altitude of the aircraft altitude above theHYTAL horizontal reference line was:
VHA = SRR sin (OHS)
and the instantaneous corrected altitude above HYTAL horizontalreference line was:
VHC VHA - VRR
Therefore, the instantaneous corrected altitude above the FCLPdeck center was:
VAC VHC + VHD
Test wave-offs (one was generally given for each studentpilot in each event) were eliminated from consideration.
83

NAVTRASYSCEN 85-C-0044-2
Performance wave-offs were retained in the data set, buttracking scores were not considered beyond the point at whichthe LSO gave the wave-off instruction.
The only modification of LSO or student pilot duties in thefield trials related to the use of the retroreflectors. Thesewere mounted in the landing light housing of the T-2C aircraft(Figure C-3) so that students were required to lower thelanding light assembly before they turned to final for theirfirst approach. As the landing lights are not normally loweredfor day FCLP, LSOs reminded their students of this requirementwhen they were flying their first landing pattern. Anexperimenter checked that the retroreflectors were lowered onfirst approaches, and requested LSOs to remind student pilotson those occasions they were not.
84

NAVTRASYSCEN 85-C-0044-2
(N
C,4cq
(N 0
co
0N 4J
CN.
00
Co -.
W 0 0'> 'a L
0 ~ Ic') U))
cci
U) -
85

NAVTRAOSYSCEN 85-C-00O44-2
V14Ai V14
Y~ T At.AD~ tiYAL
io I TOUC14DOWN VOLN
LTD -nfTa
Figure C-7. Calculation of Height of MainWheels Above Touchdown
HYTAL
ACTUAL NOMINAL SLANTAPPROACII TOUCDO WN RANGE
rATH VOINT
HA P
"TTAII E CLO ~ c
SENSOR __________ LN
Figure C-8. Top View of Range of Retroreflectorfrom the HYTAL H-ead
86