Embed Size (px)
Citation preview
NavalI Research LaboratoryWashington, DC 20375-5320
NRL/MR/6176-92-7135
Ion-Beam-Assisted Deposition ofMoS 2 and Other Low-Friction Films
ROBERT N. BOLSTER
Surface Chemistry BranchCiemistry Division
September 11, 1992
PLEASE RETURN TO:19980309 110 BMD TECHNICAL INFORMATION CENTER•BALLISTIC MISSILE DEFENSEORA ZTiNPENTAGONWASH!NGTON D.C. 2 03 01-7100
DT'C QUALIT InSPEC D 4
Approved for public release; distribution is uniuutema.
Accession Number: 5689
Publication Date: Sep 11, 1992
Title: Ion-Beam-Assisted Deposition of MoS2and Other Low-Friction Films
Personal Author: Bolster, Robert N.
Corporate Author or Publisher: Naval Research Laboratory, Surface Chemistry Branch, Washington, DC20375-5320
Report Number: NRL MR 6176-92-7135
Report Prepared For: Air Force Wright Aeronautical Lab(WRDC/MLBT), Wright-Patterson AFB,OH 45433
Descriptors, Keywords: ion beam film deposition MoS2 solid lubricant sputter friction
Pages: 0034
Cataloged Date: May 25, 1995
Document Type: HC
Number of Copies in Library: 000001
Record ID: 46340

REPORT DOCUMENTATION PAGE Form ,ApprovedI OMB No. 0704-0188
Ptblic reporting burden for this collection of information is estimated to average 1 hour per reaponse, including the time for reviewing instructions, sarching existing data sources,gathering and maintaining the dats needed, and completing and reviewing the collection of information. Send comments regarding this burden estimate or any other aspect of thiecollection of information, including suggestions for reducing this burden, to Washington Hesdquarters Services, Directorate for information Operations and Reports, 1216 JeffersonDavis Highway, Suite 1204, Arlington, VA 22202-4302, and to the Office of Management and Budget. Paperwork Reduction Project 10704-0188), Washington, DC 20603.
1. AGENCY USE ONLY (Leave Blank) 2. REPORT DATE 3. REPORT TYPE AND DATES COVERED
September 11, 1992 Interim 6/88 to 6/92
4. TITLE AND SUBTITLE 5. FUNDING NUMBERS
Ion-Beam-Assisted Deposition of MoS2 and Other Low-Friction Films PE - 63224C, 61153NWU -2855, 3409
6. AUTHOR(S)
Robert N. Bolster
7. PERFORMING ORGANIZATION NAME(S) AND ADDRESSES) 8. PERFORMING ORGANIZATIONREPORT NUMBER
Naval Research LaboratoryWashington, DC 20375-5320 NRL/MR-6176-92-7135
9. SPONSORING/MONITORING AGENCY NAME(S) AND ADDRESS(ES) 10. SPONSORING/MONITORING
AGENCY REPORT NUMBERDepartment of the Air ForceAir Force Wright Aeronautical Lab. (WRDC/MLBT)Wright-Patterson Air Force Base, OH 45433
11. SUPPLEMENTARY NOTES
12a. DISTRIBUTION/AVAILABILITY STATEMENT 12b. DISTRIBUTION CODE
Approved for public release; distribution is unlimited.
13. ABSTRACT (Maximum 200 words)
Vacuum-deposited films of molybdenum disulfide (MoS2) are effective as solid lubricants. Ion-beam-assisted deposition, which
employs ion beam sputtering with an assist beam impinging on the growing film, has been investigated as a means of preparing low-friction high endurance coatings. The apparatus used and some of the techniques involved are described. Ion source operatingparameters were optimized and the assist beam ion flux was quantified and found to follow a power-law relationship with beampower. The best way to produce MoS2 films was found to be cosputtering from separate Mo and S targets with deposition ratesadjusted to obtain the desired stoichiometry. Deposition rates were found to also follow a power-law relationship with beam power,and formulae are given for predicting them, the ratio of assist ions to film atoms, and the effect of assist beam sputtering on filmthickness. Inverse formulae are given for determing process parameters needed to achieve a selected film thickness and composition.A composite target for simultaneous Mo and S sputtering was developed. Deposition rates were determined for other metals: W, Ni,Co, Cu, and Pb. Formulae relating target-to-substrate distance to deposition rate are given.
14. SUBJECT TERMS 15. NUMBER OF PAGES
Ion beam MoS 2 Sputter 34
Film deposition Solid lubricant Friction 16. PRICE CODE
17. SECURITY CLASSIFICATION 18. SECURITY CLASSIFICATION 19. SECURITY CLASSIFICATION 20. LIMITATION OF ABSTRACT
OF REPORT OF THIS PAGE OF ABSTRACT
UNCLASSIFIED UNCLASSIFIED UNCLASSIFIED UL
NSN 7540-01-280-5500 Standard Form 298 IRev. 2-89)
Prescribed by ANSI Std 239-13298-102
CONTENTS
BACKGROUND .. ................................. 1
APPARATUS o ......................... ..... .. . ... 1
Vacuum Chamber ..... . ... o ..... 2Target Holders ......... .............. . ....... 2Targets .............. . . . ........... 3Ion Sources ......................................... 4Stage ....... ...... ............ ... 5Quartz Monitor ....... ............. .. ..... ..... 6Residual Gas Analyzer .......................... 6Gas Supply o.......................-... ........ 7
PROCEDURES ................................................. 8
Deposition ............................................ 8Thickness Measurement ............................... 9Ion Sources ...................... ............ 10
ASSIST BEAM FLUX MEASUREMENT ............................. 13
DEPOSITION RATE CONTROL .................................... 15
MoS 2 and Sulfur ............... ....... 15Molybdenum and Sulfur ............................... 15Improved Mo and S Data ......................... 19Assist Beam Effects .................................. 20Film and Process Parameter Calculation Summary 23Composite Mo-S Target ... .................. . 25Deposition of Various Metals ........................ 26Effect of Target Distance .......................... 27Uniformity of Deposition ........................... 27Intentional Composition Gradients ................... 28
SUMM4ARY ................................................. 28
ACKNOWLEDGMENTS ............................... ........... 29
REFERENCES .... ........................................... 29
iiiPreceding Page Blank
ION-BEAM-ASSISTED DEPOSITION OFMoS, AND OTHER LOW-FRICTION FILMS
BACKGROUND
Films of the solid lubricant molybdenum disulfide (MoS 2 )
deposited by vacuum processes such as rf or dc sputtering have been
found effective for the lubrication of bearings in vacuumenvironments. The Naval Research Laboratory has established a
facility for the laboratory scale preparation of such films by ion
beam sputtering. In this process beams of ions, usually of the
inert gas argon (Ar), bombard targets imparting sufficient energy
that atoms are emitted from the target and deposited as a film on
nearby substrates. In addition to controlled deposition of one or
more materials, this process allows ion-beam-assisted deposition
(IBAD), where an ion beam directed at the substrate modifies the
composition and structure of the film as it forms.
Over several years numerous MoSs films have been prepared and
some of their properties have been reported (1,2,3). These include
low friction coefficients, typically 0.01 to 0.02, and remarkableendurance under highly-loaded sliding contact (less than an atomic
layer per cycle). In this report more of the experimental details
and practical procedures than could be included in other
publications are collected for use by other researchers or for
transition to industry.
APPARATUS
The apparatus consists of a vacuum chamber mounted atop a
cabinet containing the high-vacuum pump and various utilities; a
console containing the ion source power supplies, controls, and
instrumentation; and various accessories such as the mechanical
Manuscript approved July 30, 1992.
1
vacuum pump and a gas supply system. The basic apparatus was built
to our specifications by Commonwealth Scientific Corporation of
Alexandria, Virginia. A number of accessories have been added and
modifications made to the system to increase its capabilities.
Vacuum Chamber
The vacuum chamber is cylindrical, 51 cm (20 inches) in
diameter and 46 cm (18 inches) deep, with its axis horizontal. One
end opens to provide access to the interior. The walls are
stainless steel, with numerous welded ports for the ion sources,
pressure gauges, and other accessories. There are removable liners
to facilitate cleaning, and a bake-out jacket. The chamber is
rough-pumped by a 760 L/min mechanical pump and automatically
crosses over to a cryogenic high-vacuum pump with a pumping speed
of 4000 L/s for water and 1200 L/s for argon. The normal base
pressure is about 10- 7 Torr (10-5 Pa). When the ion sources are
operating the pressure is in the range of 2 to 6 x 10⁻⁴ Torr. A
high-vacuum manipulator has been installed so that substrates can
be moved, covered or uncovered while under vacuum. This permits
making several types or thicknesses of films in one run. A diagram
of the chamber and its contents is shown if Fig. 1.
Target Holders
Two water-cooled holders for four sputtering targets are
provided. The targets are selected remotely from the operating
console. Early films showed considerable nickel contamination,
apparently the result of sputtering from the nickel-plated holder
block and shields by the outer portion of the ion beam. The left
target holder has been fitted with a graphite foil shield to
prevent the beam from striking any metallic surfaces.
2
VACUUM
ION EA CHAMBNEEA
\ /ARGON -7 ~RGO IONKES EMRASITUR•...
R MONRO SECONDARY
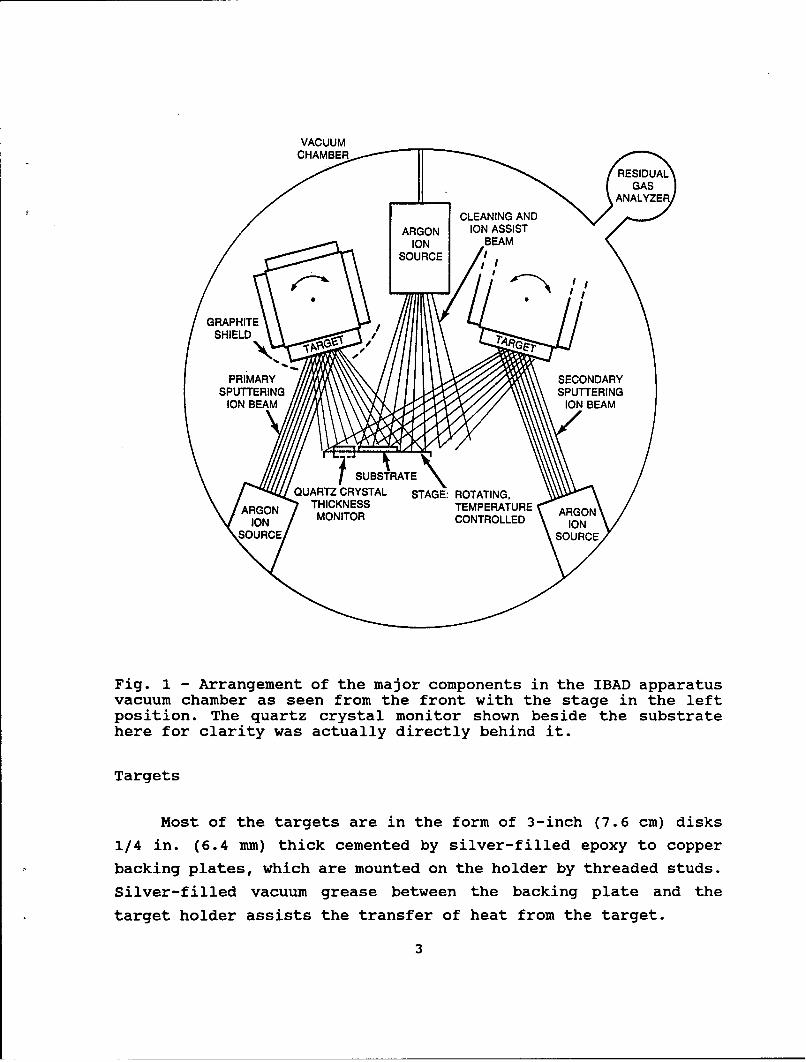
Fig. 1 - Arrangement of the major components in the IBAD apparatusvacuum chamber as seen from the front with the stage in the leftposition. The quartz crystal monitor shown beside the substratehere for clarity was actually directly behind it.
Targets
Most of the targets are in the form of 3-inch (7.6 cm) disks
1/4 in. (6.4 mm) thick cemented by silver-filled epoxy to copper
backing plates, which are mounted on the holder by threaded studs.
Silver-filled vacuum grease between the backing plate and the
target holder assists the transfer of heat from the target.
3
A sulfur (S) target has been prepared by allowing a pool of
molten sulfur to solidify on a recessed copper disk to which a
copper screen had been soldered. The screen provides improved
adhesion and thermal conductance. The target is replenished by
heating it until the sulfur melts (119 0 C) and adding additional
sulfur. Shrinkage or porosity which occurs during crystallization
is patched by local melting with a soldering gun.
Ion Sources
The three ion sources are of the Kaufman type (4,5). Gas,
normally Ar, is supplied to a discharge chamber at the rate of a
few standard cubic centimeters per minute (SCCM). Electrons from
a hot filament cathode are accelerated toward the cylindrical anode
which forms the walls of the chamber, ionizing the gas atoms or
molecules by impact. The efficiency of this ionization is increased
by a magnetic field provided by permanent magnets outside the
chamber. The positively charged ions are accelerated away from the
anode by the high voltage provided by the beam power supply.
Passing through aligned holes in the screen grid and accelerator
grid, the ions form beamlets which merge to form the ion beam.
Immersed in the beam is a heated tungsten filament which emits
electrons to neutralize the positive charge of the beam.
The sources produce beams of 3 cm diameter, with beam energies
(voltages) of 50 to 1500 V and maximum currents of 100 mA. The two
sources used for sputtering are equipped with graphite grids to
produce high-intensity beams, the left source usually with focussed
grids and the right with collimated grids giving a slightly larger
beam. The assist source has convex molybdenum grids to produce a
broader low intensity beam. Operating in manual mode with maximum
accelerator (grid) voltage of 500 V also helps to broaden the
assist beam.
4
Stage
The substrate stage consists of a circular platen 11.5 cm in
diameter supported by the stage assembly. Threaded holes around theperiphery facilitate the use of plates or wire loops to hold
substrates in place. The platen is motor driven in rotation toimprove the uniformity of deposition, and can be heated to 620 K(350 0 C). The original temperature sensor was inadequate, indicating
a temperature far below actual, and was replaced by a fine-gaugethermocouple inserted into a bronze shoe riding in contact with the
edge of the platen.
The stage assembly is mounted to the front plate of thechamber on an eccentric rotating platform with a radius of motion
of 3.4 cm which permits limited horizontal and vertical positioningand tilting of the platen. The eccentric platform was normally set
300 to the left of the highest position with the platen horizontal.The stage support also swings in a plane parallel to the platensurface 2.6 cm to either side. Normally swung to the left, thecenter of the platen was then 4.3 cm left of the chamber centerplane, 11.9 cm from the center of the left target and 17.5 cm fromthe right target. This position minimized the distance to the left
target, which normally was the substance with the lower sputter
yield.
The chamber was designed with the stage platen facing upwardto make possible the coating of loose objects such as bearingballs. This also reduces the fixturing needed for holding flatsubstrates. A disadvantage of this position is that particles canfall onto the substrates during the process creating defects inthe coating.
The platen can be shuttered by a sliding cover operated by afeed-through rod. Three Faraday cups built into the cover serve to
check the aim and flux of the assist beam. A larger cup with a
5

suppressor electrode has been added to provide more accurate beam
flux data.
Quartz Monitor
A quartz crystal deposition rate monitor indicates the rate
during the process and the total thickness deposited. Mounted on
a cylindrical feed-through from the top of the chamber, the crystal
can be placed anywhere by raising, lowering and rotating the feed-
through or bending the support tubing. For normal operation,
repositioning the crystal by manually bending the support is
undesirable, so it is placed where different stage positions can
be accomodated by rotation of the feed-through alone. With the
stage at the left the crystal is located at the same height as the
platen and directly behind it (at the same distance from the
chamber center plane). The mean "tooling factor" for this position
was found to be 160 ±20%, that is, the film thickness on a
substrate at the center of the platen was 1.6 x that on the
crystal. With the stage at the center or right positions the
crystal is moved as close as possible: near the end of the stage
frame but 2 or 3 cm to the left of center, or near the corner of
the frame and 5 or 6 cm left of the platen center. Approximate
tooling factors for these positions were: center, left target -
120%; center, right target = 180%; right, right target = 260%.
Residual Gas Analyzer
A quadrupole mass spectrometer residual gas analyzer (RGA)
with a differential pumping system has been added to the chamber
to monitor the composition of the gases present during deposition
and to check the purity of the sputtering gas. For qualitative
monitoring analog mode (graphic mass spectrum display) was used
with subtraction to eliminate the detector background. With the
chamber under vacuum and the high-conductance valve open the RGA
sampled the residual gases in the chamber at base pressure. During
6
deposition only a 6-mm bypass valve was open to restrict the flow
of gas into the detector. With a three-decade logarithmic analog
display showing the major Ar peak at full scale, any gases above1/1000 the partial pressure of the Ar would be detected. Gasanalysis was done in tabular mode, which includes correctionfactors for ionization efficiency. A computer spreadsheet was usedto subtract the background and calculate the composition.
At base pressure the spectrum showed, in addition to the usualatmospheric gases, SO2 and H2 S dispersed in the chamber as a result
of sputtering sulfur and outgassing of the S target. These gasesare corrosive and attacked some components of the apparatus,especially copper wires, gaskets, and valve seats. When the chamberwas not in use, sheets of clean copper foil were placed in it to
take up these gases. During depositions when S was being sputtereda peak about 1/100 the height of the Ar and believed to be due to
CS 2 was usually seen. The height of this peak was useful as a rough
indicator of the amount of S being produced by sputtering.
Gas Supply
The Ar gas was purified by passing it through powdered copperat 670 K to remove oxygen and through silica gel to remove water.A manifold supplied the gas through flow meters to the ion sourceswhere manual needle valves controlled the flow rates, which were
typically 8-10 SCCM for the sputter sources, around 10 SCCM for the
assist source when being used for cleaning, and around 3 when itwas used to assist during deposition. A connection to the
mechanical vacuum pump permitted evacuation of the manifold andsupply lines. The manifold also supplied pure nitrogen (N2 ) from
liquid N2 boil-off for backfilling the chamber before opening. A
reservoir allowed mixtures of Ar and N2 , or pure N2 , to be supplied
to the assist source to change the composition of the assist ion
beam.
7
Even though the lines from the manifold to the source valves
were kept under Ar pressure, when the source gas was first turned
on the RGA would show substantial amounts of nitrogen and oxygen
f or many minutes until the lines were purged. Some of the lines
were of polymeric tubing which apparently allows oxygen and
nitrogen to diffuse in and contaminate the Ar. Therefore, the lines
were evacuated and refilled before each deposition.
PROCEDURES
Deposition
Substrates were placed on the platen, sometimes clamped but
more often just restrained by wires to keep them in place. For film
thickness measurement a piece of glass microscope slide masked with
a piece of razor blade was placed near the substrates. Nickel foil
substrates were often used for analysis of the film by Rutherford
backscattering spectrometry (RBS). To deposit films of MoS 2 on a
base layer (6,2) of titanium nitride (TiN), TiN and Mo targets were
mounted in the left target holder and S in the right. The stage was
positioned to the left. Before the chamber was closed, pure N2 gas
from a hand-held nozzle was used to blow loose particulates from
chamber, ion sources, and substrate surfaces. Three to four hours
were allowed for the chamber to pump down to base pressure,
typically 3 x 10⁻⁷ Torr.
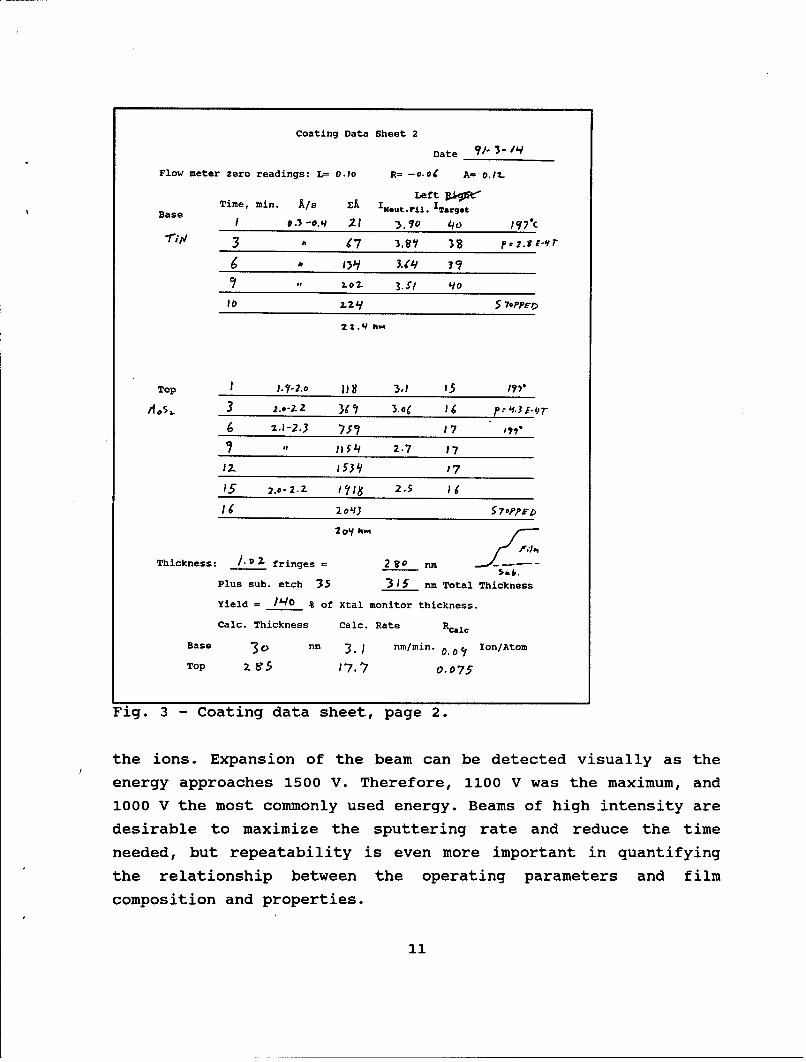
During the coating process the procedure and the operating
parameters were recorded on data sheets which are shown in Figs.
2 and 3, filled out with data from a typical run. The processing
steps are listed at the bottom of Fig. 2: The substrates were
sputter cleaned using the assist beam at 40 mA for 3 minutes with
the platen rotating, and in this case heated to 200 0 C. The TiN
target was then selected, and the base layer deposited using the
left sputter source at 1100 V and 70 mA, with an assist beam of
3.5 mA. An Ar flow of only 3 to 4 SCCM was needed to operate the
8
assist source at these low powers. Sputtering was done for one ortwo minutes to clean the target, then platen rotation was started,
the stage cover was withdrawn, and the crystal monitor and timerwere started. The ion source operating parameters were recorded inthe body of the data sheet. At the top of Fig. 3 periodic rate andthickness data from the crystal monitor were recorded along with
the more variable source parameters and other comments or
observations.
For the top layer the Ho and S targets were selected and asimilar procedure followed. The Mo was usually sputtered at 1000
V and 50 mA, S at 1000 V and about 19 to 20 mA. Assist beam currentwas set to produce the desired ion/atom ratio, usually 0.03, whichrequired 4 to 5 mA. The quantitative factors involved will bediscussed later. In the case shown, an 8.2-mA beam was used,
resulting in an ion/atom ratio of 0.075.
Thickness Measurement
The thickness of each film was determined from measurement ofthe step height at the edge of the masked area on glass with
Tolansky interferometry. To make the step uniformly reflective itwas coated with sputtered aluminum applied in a separate process
with the same apparatus (4 minutes at a beam power of 45 W). Thisallowed step heights to be measured to an accuracy of 5-10 nm. Acorrection for the depth of the sputter cleaning etch was added tothe step height, and data from the crystal monitor were used toapportion the thickness between the layers. As an example, the data
of Fig. 3 show the step height was 280 nm. The correction of 35 nm
for the 3-minute cleaning etch was added to give 315 nm, which was
140% of the sum of the crystal monitor thicknesses, acceptably
close to the nominal tooling factor of 160 ±20%. The separate
monitor thicknesses were multiplied by 1.4 to give the calculated
values.
9

Coating Data SheetNaval Research Lab., Code 6176
Substrate A,4S-.7h??"H qYqoC. )' Date C//- 3 -/•
Stage: Mounting Inclin. 0 Ecc. Angle 3o L Swing. 2-Ft,
Temp.: Cool._ Heat, set 2.00C% Max. 2-oi Min. 1177
Rotation: Y V_ N_
Ion Source: Left Left Right Assist Assist
Pressure: 1.1 E-V 1.1 C-1 1.1 E-- . tE. Base(Each source) _,o r-7_ _
Gas: Flow, SCCM 1.v4 9.9 ? ..3 3. Alterationsor repairs
Mode: (Auto., Man.) A h 1 P1 p since lastrun:
Beam I, mA 70 5o I 11.2. jV V.Z
E, V 1i90 1Mo ioVo IV'" I "D
Accelerator I, mA 2.7 Z-C 0.? 1.7 o.5
E, V IoD" Is5 17-. 5'D Cob
Discharge I, A 1.77 l.-i 0.417 1. ý*Y - o.IS
E, V 1o.I i/.0- qVo.q I/. I Y1. 0
Cathode I, A q. I q 3.qc C.OZ 1.10 S.53
Neutralizer I, A 3.7Z 3.0o ;. 'I 5.1o .)
Neut. Emission, mA 70.1 5o 19.3 37.7 V.2-
Beam not neut., mA -- 0 O O Z O O SubstrateCovers:
Target I, mA 37 6 - Close Open
Process Target: • , Is, mA
1. . • . A.. ., . ., . . . . • . ,
2. T-MA 3. 5 4S. . .. . .. . . . . . . . . . . . . .. . ,. . . .,. ... .. .
3. 7-o P SM 0 Y.Z 1'4 "• . . . . . . .,. . . ., . . . . . . . . . . . .,. . .,. .o
4.
Fig. 2 - Coating data sheet, page 1.
Ion Sources
Measurements have shown that sputter deposition rates
increased with beam current and energy until, as shown in Fig. 4,
a maximum and a sharp drop were found as voltages were increased
above 1150 V. It is thought that the beams expand and lose
intensity at higher voltages, perhaps due to mutual repulsion of
10
Coating Data Sheet 2
Date ___ ___ ___
Flow meter zero readings: L= 0.1o R= -o. 0 A= 0.12
Left
Base Time, min. A/s EA IsNut.ril. ITarget
I . 21 3, 117r"N 3 t.'7. 7 IE"
6 13A/ 3 4
S..2- 3.S I . IO
Tikes .0io frines 57OP0 n
Top u 1.-2.o e)9 3d1 15 ne
ie 3 z.0-2. 3f l 2onito3.6c thickne
6 .1-2.3 75 7 17 71
To1 ; n5' 2.7 17
Fi.12.Catn dtshe,5 pae 2
15 2.0-2.2. Z 5 iY8 2.5
theion. Epanion of 3 th amcaPbPetetdvsalya h
11 2o43 7 W'.i
Thickness: to-0 fringes 2t0 s e rat 2T nm
Plus sub, etch '35 '315 nm Total Thickness
Yield = pi40 % of Xtal monitor thickness.
Calc. Thickness Caic. Rate al
Base 3 c nm '3., nm/min. .0 Ion/Atom
Top 2 517.7 0.075
Fig. 3 - Coating data sheet, page 2.
the ions. Expansion of the beam can be detected visually as the
energy approaches 1500 V. Therefore, 1100 V was the maximum, and
1000 V the most commonly used energy. Beams of high intensity are
desirable to maximize the sputtering rate and reduce the time
needed, but repeatability is even more important in quantifying
the relationship between the operating parameters and film
composition and properties.
11

One problem encountered with 1670 mA
the sputtering ion sources was 14
that the beams were not always E 12
coaxial with the source housings, E
even though the grids were kept V 10 60mA
accurately aligned. This caused C 80
the beam axes to be off of the C0 6
target centers, threatening to
alter the geometry and sputtering 4
rate or sputter contaminants from 2
the target holders or shields. 6W0 800 1000 1200 1400 1600
Beam alignment was difficult to BEAM ENERGY,V
check visually through the Fig. 4 - Deposition rate for
viewports, even when operating in molybdenum sputtered at twobeam currents and several beam
manual mode with the neutralizer energies. Bars show the range
filaments off. Aluminum foil of the data.
placed over the targets was useful
in determining the aiming, as the beams would melt a hole in it in
a few seconds, marking the position of maximum intensity.
Adjustments were made by placing Teflon spacers between the source
bodies and their sockets to tilt the axes in the proper directions.
Some care was needed to keep the ion sources operating
properly. Neutralizer filaments lasted only about an hour when the
source was operated at high power due to erosion of the tungsten
wire. New filaments draw about 6 A at high beam currents. The
filament current declines steadily as the wire erodes, and failure
is imminent when it reaches 3 A. The data in Figs. 2 and 3, for
example, show that the left source neutralizer was in need of
replacement before the next use.
Cathode filaments last much longer, but replacement may
temporarily reduce the maximum attainable beam current to around
25 to 40 mA when the filament power supply reaches its limit. This
problem can sometimes be circumvented by placing the new filament
12
and anode subassembly in the right source and moving the right
subassembly with the "broken-in" filament to the left source.
Increasing the gas flow rate may also help to increase the beam
current. It has been found that a cathode filament can be "broken
in" by the following procedure: Turn on the source gas flow. Set
power supply to Manual mode, turn on Source power, but leave Beam
off. Set Discharge and Cathode at maximum. The cathode current,
typically about 8.2 A, will slowly decrease. When it reaches 8.0 A
the source should be able to produce a 50 mA beam. Test it and
continue the "break-in" process if necessary.
ASSIST BEAM FLUX MEASUREMENT
For many materials, ion beam sputtering deposits more dense
films than rf or dc plasma sputtering because it is a higher-energy process. Not only do the sputtered atoms arrive with more
energy, but the growing film is also bombarded by energetic
reflected ions and atoms. The ion assist beam provides an
additional controlled source of energetic ions (7,8). In the
deposition of MoS2 the assist beam flux affects the orientation
and crystallinity and thus the tribological behavior of the film
(6,3).
Measurements of the assist ion flux (current density) at
various beam currents at 1000 V were made with an electro-
statically suppressed Faraday cup having an aperture of 0.25 cm2 .
Placed at the usual substrate-to-source distance of 16 cm, the cup
could be traversed across the beam to determine the flux decrease
with off-axis distance. A potential of -50 to -140 V, depending
upon the ion flux, was applied to the suppressor electrode. The
necessary potential was determined by starting with a low value and
increasing it until a constant cup current was reached. The chamber
pressure was either at a low level, about 1 x 10- 4 Torr, or at
typical operating level of 4 x 10⁻⁴ Torr (0.05 Pa).
13
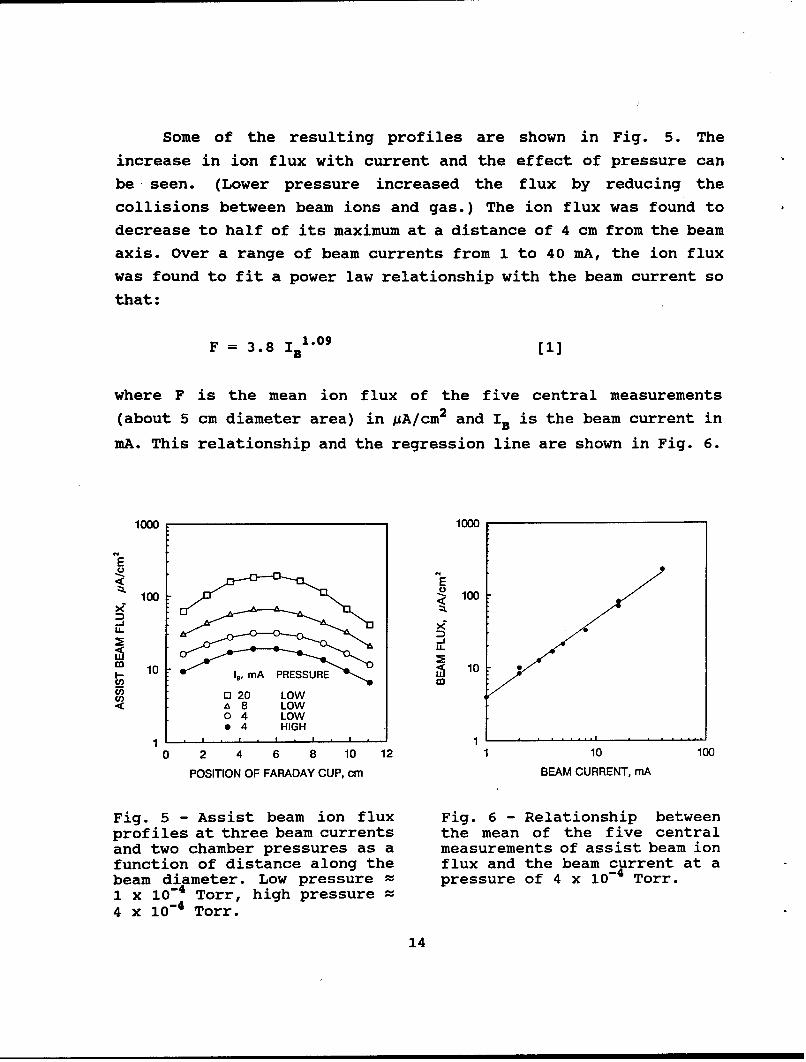
Some of the resulting profiles are shown in Fig. 5. The
increase in ion flux with current and the effect of pressure can
be, seen. (Lower pressure increased the flux by reducing the
collisions between beam ions and gas.) The ion flux was found to
decrease to half of its maximum at a distance of 4 cm from the beam
axis. Over a range of beam currents from 1 to 40 mA, the ion flux
was found to fit a power law relationship with the beam current so
that:
F = 3. 8 IB109
where F is the mean ion flux of the five central measurements
(about 5 cm diameter area) in gA/cm2 and IB is the beam current in
mA. This relationship and the regression line are shown in Fig. 6.
1000 1000
E
E100 ~100
M
1 1010I 19 mA PRESSURE 1
, 020 LOWSA 8 LOW
0 4 LOWo 4 HIGH
1 I • i , i i 1, , ., , ,i. . .
0 2 4 6 8 10 12 1 10 100
POSITION OF FARADAY CUP, cm BEAM CURRENT, mA
Fig. 5 - Assist beam ion flux Fig. 6 - Relationship betweenprofiles at three beam currents the mean of the five centraland two chamber pressures as a measurements of assist beam ionfunction of distance along the flux and the beam current at abeam diameter. Low pressure = pressure of 4 x 10⁻⁴ Torr.1 x 10-4 Torr, high pressure =4 x 10⁻⁴ Torr.
14
The flux of Eq. [1) does not include bombardment by Ar
neutralized by charge exchange collisions in the path between the
assist source and the substrate, as they would not be detected by
the Faraday cup. The total flux of all energetic particles was
probably about 1.5 x larger (9).
DEPOSITION RATE CONTROL
Ordinarily, the highest possible sputter deposition rate is
desired in order to expedite the coating process. However, when
two different targets are cosputtered to produce a film of mixed
composition, the two deposition rates must be known and controlled
to give the desired composition.
MoS 2 and Sulfur
Films made by sputtering an MoS 2 target were very depleted of
sulfur (S/Mo = 1.1-1.3). To achieve stoichiometry by sputteringMoS 2 with a small amount of sulfur added from a S target, it was
sufficient to sputter the MoS 2 at the maximum rate and try several
S beam powers. The resulting films were analyzed by RBS and the
beam power corresponding to a S/Mo ratio of 2 was determined.
Stoichiometric films were deposited at rates of 7 to 11 nm/min by
this process, using an MoS 2 sputter power of 77 W and a S sputter
power around 4 W.
Molybdenum and Sulfur
Cosputtering Mo metal and S to form MoS 2 was found to give
higher deposition rates, 15 to 35 nm/min, but with quite varied
S/Mo ratios. To achieve the desired stoichiometric ratio more
knowledge of the effects of the ion beam parameters on the sputter
deposition rates of Mo and S separately was needed.
15
In order to make immediate deposition rate measurements, the
quartz crystal monitor was placed at the usual substrate position,
11.9 cm from the Mo target and 17.5 cm from the S. Deposition rates
for Mo were measured at beam energies from 700 to 1500 V and beam
currents from 10 to 70 mA. Rates increased with increasing current
and energy up to 1150 V. At 1200 V and above the rates declined
sharply as noted above in the discussion of Fig. 4. Over the range
of 700 to 1100 V, the deposition rate and the beam power closely
fit a power law relationship with the log of the deposition rate
proportional to the log of the product of beam current and energy,
as shown by the rectangular markers in Fig. 7. The equation of the
regression line (parallel to but above the line shown) is
D.. = 0.035 PMo1- 3 8 [2]
where D is the rate in nm/min and P is the sputter beam power in
watts.
Similar experiments were then done with the sulfur target
yielding much higher rates, shown by the "X" markers in Fig. 7,
and a line with a steeper slope (not shown). Subsequent
codepositions gave still higher rates. Either the monitor was not
accurate in measuring the deposition of pure S, or the sticking
coefficient of S is higher when codeposited with Mo than when it
is deposited alone.
At this point it was realized that the crystal monitor could
not be relied upon to give accurate calibration data for the S
deposition rates. A number of films were prepared using a constant
(50 W) beam to sputter Mo and varied S sputter powers, and analyzed
by RBS to determine their S/Mo ratios. The S deposition rates were
then calculated using the equation
Ds = 1.647 D1o (S/Mo) [3]
16

0 Moon C x S Con C. 0 Moat 5W 1 SCodepos.x
S+ x4•
i X
z x
C
00W yx
2x
0 E00
x
1 10 100SPUTTER ION BEAM POWER, Watts
Fig. 7 - Deposition rates vs sputter powers f or Mo and S on thecrystal monitor, 19 points for Mo sputtered at 50 W, 18 points forS codeposited with Mo, and the regression lines of Eqs. [9] and[10].
based on the fact that the atomic density of Mo is 1.647 times that
of S. The value of DMo was that from the Eq. [2] using 50 W as the
power. From 13 data points a regression line having the equation
Ds = 0.00039 Ps3 [4]
17

was found. The relatively high sputter rate for S is not
unexpected, as sputter rates for various materials have been shown
to increase rapidly when their temperatures were brought up to
within about 2000 of their melting points (10). Not only does S
have a low melting point, but its relatively low thermal
conductivity allows the target surface to be heated more by the
ion beam. This causes accelerated sputtering and loss of control
at higher beam powers.
Film deposition rates (DF) can be calculated from the
molecular weight and density of MoS 2 and the atomic weights and
densities of Mo or S, as experiments have shown that IBAD MoS 2 is
normally deposited with nearly bulk density (1). The film
deposition rate is that of the MoS 2 , either
160.07 x 10.2 x Duo
= 3.545 DMo
4.8 x 95.94
or
160.1 x 2.07 x Ds
= 1.077 Ds
4.8 x 32.06 x 2
plus that of the excess element from Eq. [3],
Ds -DMo x 2 x 1.647 = Ds - 3.294 DKo
orDs
DMo- = DMO - 0.304 Ds
3.294
18

which can be simplified to give:
For S/Mo Ž 2: DF = 0.251 Duo + Ds, [5]
For S/Mo < 2: DF 0.773 Ds + D . [6]
Improved Mo and S Data
After accumulating data for 27 films analyzed by RBS, more
accurate constants for Eqs. [2) and [4) were obtained. For 19 filmsdeposited using PMo of 50 W, the Mo deposition rates were
determined from measured film deposition rates and the RBS S/Mo
ratios (diamond markers in Fig. 7). The equations used were derived
by combining Eq. [3] with Eq. [5] or [6):
For S/Mo Ž 2: DMo = DF / (0.251 + 1.647 (S/Mo)) [7)
For S/Mo < 2: Dso = DF / (1.273 (S/Mo) + 1) [8]
The geometric mean of these rates was used to correct thecoefficient of Eq. [2] to give
D.= 0.030 P 1 3o [9].
Corrected S rates were then determined from 18 of the 27
films, excluding those with ion/atom (R) ratios > 0.08 and S/Mo > 3or < 1.5. The films with higher R's were excluded because theassist beam sputters the film, especially the S, reducing the
growth rate. Eq. [3) was used again to find Ds, using the RBS S/Mo
ratios and D.o's calculated using Eq. [9]. The resulting
replacement for Eq. [4] was
19
Ds = 0.0031 PS3 . 0 [10].
Although Eqs. [4] and [10] appear to have quite different slopes
and intercepts, the lines intersect at 17 W and are quite close in
the region where most of the films were made. For these 18 films,
the mean of the measured DF divided by that from Eq. [5] or [6] was
0.99 ±0.19 and the mean of the RBS S/Mo divided by that from Eq.
[3] solved for S/Mo was 1.02 ±0.15.
Shown in Fig. 7 are the adjusted regression line of Eq. [9]
for Mo, the 18 points for S codeposited with Mo (+ markers), and
the line for Eq. [10].
When the measured and calculated deposition rates for 122
films were compared, it was noted that a group of films having
measured rates > 27 nm/min straggled away from the rest. These
appeared to have high S/Mo ratios and low densities, and may have
resulted from abnormally high S sputter rates.
Assist Beam Effects
When the ratio of measured / calculated rates were plotted as
a function of R (assist beam ions / film atoms deposited), loss due
to sputtering by the assist beam was readily apparent. This plot
is shown in Fig. 8 with the high-rate data (DF > 27 nm/min) shown
but separated from the normal rate data (DF < 27 nm/min). A
suitable corrected calculated rate derived from the slope of the
solid line was
DF' = DF(1 - 2.5R) [11].
(R S 0.4)
The assist beam R was calculated from the molecular weight
and density of MoS 2 , number of atoms per molecule, elementary
20

0
a
w
-&-D <27 XD > 270 2
X
a
1.5.Dx
6 15
I- × - -
S0
z
0 0 .2 .04 .00 .080R, l0nlAtom
<
.5
Fig. 8 - Ratio of measured to calculated film deposition rates vsassist beam ion per atom ratios for IBAD MoS films deposited at
normal (D < 27 nm/min.) and high (D > 27 nm/mm.) rates.
charge, Avogadro constant, measured deposition rate, and beam flux.
The latter -was the experimentally determined Eq. [(1 times a
correction factor for decreasing beam flux with off-axis distance.
For pure MoS 2 and a beam flux correction of 0.5 this calculation
is:
21
(160 g.Mole-1 x 6.25 x 1012 Ion.gA-1's- 1 x 3.8
x IS'B09 LAMcm -2 x 0.5 x 60 s'min -1 x 10⁷ nm-cm"1
(4.8 g-cm"3 x 3 Atom.Molec. 1 x 6.02 x 1023 Molec..Mole-
x DF nm'min-1)
which reduces to
R = 0.13 I 1.09 / DF [12]
in ions/atom where DF was determined from the measured film
thickness in nm and the duration of the deposition in minutes.I
In order to have a means of calculating R from the sputter
and assist ion source parameters and independent of the assumed
stoichiometry and density of MoS 2, the equation
R = 0.012 IB1.09 / (0.106 Dxo + 0.0646 Ds) [13]
was derived in the same manner as Eqs. [5] and [6] and again
includes the 0.5 correction factor. For all films the R's
determined by both methods agreed within a factor of 2, and the
agreement was much better when the high-rate films were excluded.
The R's from Eq. [12] were about 1.25 x higher than those from Eq.
[13] because the former were based on the final film thickness
while the latter were based on the arrival of Mo and S at the
substrate and did not allow for sputtering loss. Although the R
from Eq. [12] has been used as a film parameter in our previous
studies, that from Eq. [13] may be more fundamentally important,
as it shows what mix of atoms and ions arrived at the substrate to
interact and form the film. An iterative correction using Eq. [11]
can be applied to Eq. [12] to give R as a ratio to the arriving
atoms:
22
R= R (1 - 2.5 R) (14)
(R : 0.15).
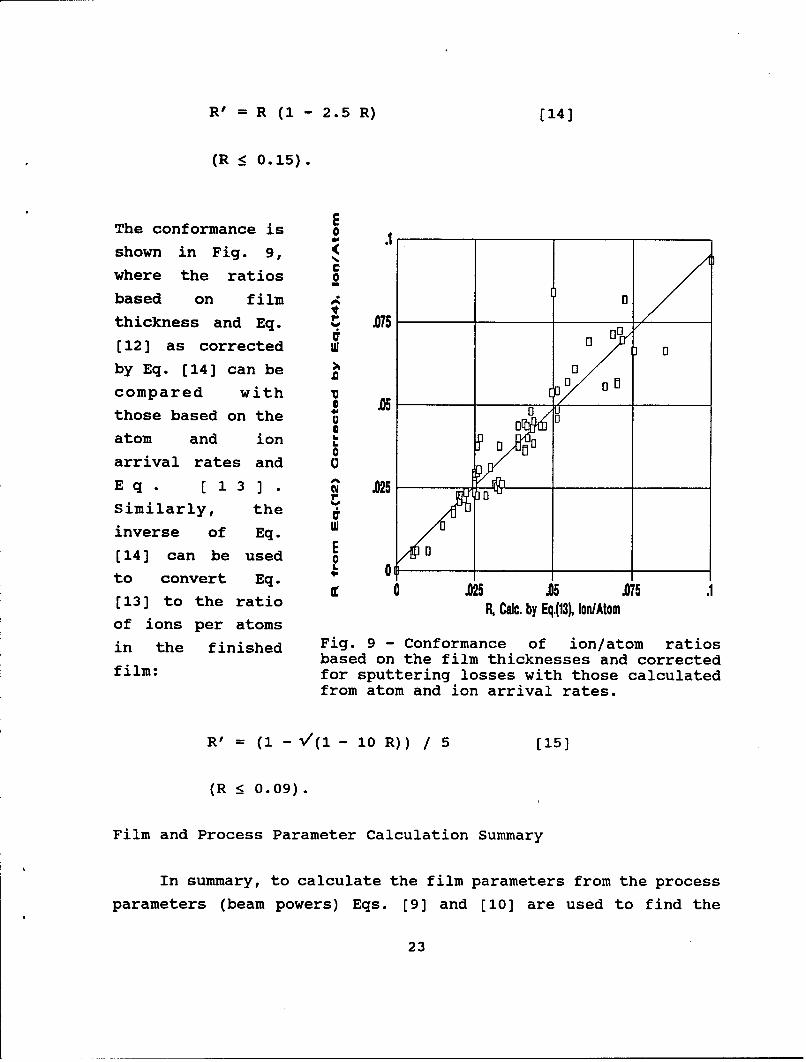
EThe conformance is _
shown in Fig. 9, .where the ratiosbased on film a 0thickness and Eq. 2 075 0[12) as corrected 0
by Eq. [14] can be 0 0
compared with V 0 a
those based on the a oatom and ion 6
arrival rates and 0
E q. 13 .025 0-Similarly, the
inverse of Eq. W
E 0[14) can be used E 1to convert Eq. 0
[13) to the ratio 0 025 .0 .075RL Cale. by Eq.(%3 Ion/Atom
of ions per atomsin the finished Fig. 9 - Conformance of ion/atom ratios
based on the film thicknesses and correctedfilm: for sputtering losses with those calculated
from atom and ion arrival rates.
R' = (1 - V(1 - 10 R)) / 5 [15)
(R S 0.09).
Film and Process Parameter Calculation Summary
In summary, to calculate the film parameters from the processparameters (beam powers) Eqs. [9] and [10) are used to find the
23
elemental deposition rates. Eq. [3] is rearranged and solved for
the S/Mo ratio, and the appropriate Eq. [5] or [6] is used to find
the film deposition rate. The arrival-based R is found from Eq.
[13], and then the sputter loss correction of Eq. [11] can be
applied to the rate. If R based on the finished film thickness is
preferred, the correction of Eq. [15] can be applied.
To find the process parameters needed to produce a desired
film, Eq. [9) is combined with Eq. [10] solved for Ps and Eq. [3]
to give
PS = 3.23 Po[16]
when S/Mo is taken as 2.1 to provide a slight excess of S. A Mo
sputter power is then chosen in the range of 50 to 65 W. Lower
powers allow better control, as the S deposition increases rapidly
at higher powers. To set the assist beam current, an expected DF is
calculated from Eq. [9), [10], and [5]. Then from the same
considerations as for Eq. [12),
IB = (3.77 R DF / 0.5)0.91 [17]
where 0.5 is the off-axis beam flux correction and DF is in nm/min
In practice, the constant was multiplied by 6 so that the rate was
in Al/s (the units displayed by the crystal monitor) and multiplied
by 1.6 to compensate for the "tooling factor" to give
1B = (72 R DF) 0 91 [18]
and a table for the desired R and a range of rates was prepared.
During deposition the current was adjusted in accordance with the
table for the rate measured by the crystal monitor.
24
Composite Mo-S Target
For coating non-planar substrates and forming films of MoS 2
alloyed with other metals a means of sputtering a controlled ratioof Mo and S from a single target was desired. Kuwano and Nagai (11)used a composite target to vary the stoichiometry in theirdeposition of MoS 2 and WS2 films. A sulfur target was overlaid by
overlapping fan-shaped segments of metal foil. The stoichiometry
was changed by altering the angle of overlap. In their system,using a large target and relatively low beam intensity, areas of68% S and 32% Mo were found to give films with S/Mo = 2. This
arrangement provides little cooling for the Mo foil, which couldget quite hot in our smaller but more intense beam. Aiming andstability of the beam would also be more critical, because movementof the beam of f of the center of the sectors would change thesputtering ratio. With our apparatus, the high sputter yield of Srelative to that of Mo and their different responses to beam poweras shown by Fig. 7 and Eqs. [9] and [10] indicated that a compositetarget with a relatively low S area would be needed to give filmswith a S/Mo ratio of 2, and that the ratio could be adjusted bychanging the sputter beam power.
An experimental composite target was prepared by drillingshallow holes in a Mo target as shown in Fig. 10. Twelve holes of0.20 inch (5.1 mm) diameter were made in a square grid pattern witha 5/8 inch (1.6 cm) spacing, and then filled with molten sulfur by
placing powdered S in them and heating the target. After the targetcooled and the S solidified, the surface was scraped and abradedto remove any excess S. The resulting S and Mo areas in the centralportion of the target were 8% S and 92% Mo. Gradual cooling of themolten S was found to be important to prevent cracking. Cracksinterfere with heat transfer through the S to the Mo, causing
melting and rapid loss of the S.
25

This target performed reasonably well for
thin films, though the deposition rate had3 in.D. to be held down to avoid high S/Mo ratios
(12). The target required replenishment
000 - after each use to maintain the S yield,
0000 - i.and also tended to produce excessiveamounts of S at the start of a deposition,
then decreasing amounts as the reservoirsS• Sulfur
Molybdenum were depleted. Figure 11, for example,shows the composition with depth from RBS
data of an MoS. + Pb film prepared by
Fig. 10 - Composite sputtering at constant powers from a Pbmolybdenum and sulfur target and the composite Mo + S target.sputtering target.
The initial deposit was too rich in S,with S/Mo > 8, while the final deposit at
the surface was about that desired, S/Mo = 2. The best endurance
was obtained with minimal excess S.
Deposition of Various Metals
In order to make metal- 80
alloyed MoS 2 films and mixed metal
films, several metals have been- 60
deposited at different beam powers 0
to determine their rates for 11.9 Z0
cm target to substrate distances. '40
All of these yielded rate vs beam z Pb
power plots with slopes similar to Z 200
that of Mo data shown in Fig. 7. Mo
There was no systematic variation 0 i I , I
in these slopes, and their 0 200 400 600
differences were not great DEPTHnm
compared with their statistical Fig. 11 - Composition vs depth
uncertainties. It was therefore profile of a film deposited by
considered likely that a formula sputtering from Pb andcomposite Mo + S targets.
26
with a fixed exponent and different coefficients would adequately
fit the data. A weighted mean of the exponents gave 1.45, so the
data for each metal were fitted to:
Da = C P 1 .4 5 (19].
The coefficients, C, for the metals were: W: 0.011, Mo: 0.0236,
Ni: 0.031, Co: 0.034, Cu: 0.045, and Pb: 0.11. Between 25 and 50
watts, the rates calculated with this equation and those using
individual exponents did not differ by more than 10%. The Mo rate
did not vary more than 3% from that calculated with Eq. [9]. Most
discrepant were the results for Pb.
Effect of Target Distance
Although the sputtered areas on the targets are not point
sources, it was found in this work that the difference in
deposition rate at a given power could be adequately estimated from
the inverse of the squares of the radii:
D, / D2 = r 22 / r1 2 (20]
where r is the radius (distance from the target to the substrate).
This makes possible the modelling of dual target deposition from
geometric considerations and individual deposition rates, and was
used to correct some of the data for metals which were sputtered
from radii other than 11.9 cm.
Uniformity of Deposition
Since the distances from the targets to various points on the
platen differ substantially, the instantaneous deposition rates
across it are not uniform. Rotation of the platen reduces this
problem but cannot eliminate it since the gradient is not linear.
Experiments have shown that substrates at the platen edge receive
27
about 80% as much thickness as at the center.
Intentional Composition Gradients
Films with compositions varying across the surface can be made
by cosputtering from two different targets onto a non-rotating
substrate. Mixed metal films on glass for a study of double-oxide
friction were prepared in this manner. A metal plate long enough
to support two microscope slides end-to-end was fastened to the
platen, and the stage was moved to its lowest position and
centered. The plane of the substrates was 16 cm below the target
centers, which were 9.5 cm from the chamber center plane. The
slides were positioned with their lengths perpendicular to the
center plane and extending 7.6 cm from it. For any position P along
the substrate a distance LP from the left end, the radii from the
left (L) and right (R) targets were
rL2 = 260 + 3.8 LP + LP 2 [21]
rR2 = 549 - 34 LP + LP 2 [22].
Expected deposition rates at points along the substrates could be
predicted from Eq. [19] corrected by Eq. (20] for the radii found
from Eq. [21] and [22]. The expected totals could be compared with
rates from measured thicknesses, and the theoretical rate and
composition profiles adjusted to fit. With the beam powers set to
give equal rates from both targets, the composition was predicted
to be 67% of metal from the closer target at each end with a
reasonably linear gradient to equality in the center.
SUMMARY
The apparatus and techniques used for ion-beam-assisted
deposition of films, principally of MoS 2 on top of a base layer of
TiN, are described. The most efficient technique for depositing the
28

MoS 2 was found to be by codeposition of Mo and S from separatetargets. The Mo and S deposition rates and assist ion flux havebeen measured and simple formulae have been found to relate themto the operating parameters. This allows films of the desired MoS 2
composition and optimum assist ratio to be prepared usingparameters calculated by Eqs. [16) and 18). Alloyed and graded-composition metal films can likewise be prepared using the guidance
of Eqs. [19] through [22].
ACKNOWLEDGMENTS
We would like to thank the S.D.I. Organization for equipmentfunding, SDIO and NRL/ONR for program funding, Graham Hubler of NRLfor advice on Faraday cup design and the effect of ion sourceoperating parameters on the beam properties, and C.R. Gossett, SFA,Inc., for Rutherford backscattering analyses.
REFERENCES
1. Bolster, R.N., Singer, I.L., Wegand, J.C., Fayeulle, S., andGossett, C.R., "Preparation by Ion-Beam-Assisted Deposition,Analysis, and Tribological Behavior of MoS 2 Films," Surf. Coat.Technol., 46, pp. 207-216 (1991).
2. Seitzman, L.E., Singer, I.L., Bolster, R.N., and Gossett, C.R.,"Effect of a Titanium Nitride Interlayer on the Endurance andComposition of a Molybdenum Disulfide Coating Prepared by Ion-Beam-Assisted Deposition," Surf. Coat. Technol. 51, pp. 232-236(1992).
3. Seitzman, L.E., Bolster, R.N., and Singer, I.L., "X-RayDiffraction of MoS 2 Coatings Prepared by Ion-Beam-AssistedDeposition," Surf. Coat. Technol. 52, pp. 93-98 (1992).
29
4. Kaufman, H.R., "Technology and Applications of Broad-Beam Ion
Sources Used in Sputtering. Part I. Ion Source Technology," J. Vac.Sci. Technol., 21, pp.725-736 (1982).
5. Harper, J.M.E., Cuomo, J.J., and Kaufman, H.R., "Technology andApplications of Broad-Beam Ion Sources Used in Sputtering. Part II.Applications," J. Vac. Sci. Technol., 21, pp.737-756 (1982).
6. Kuwano, H., and Nagai, K., "Friction-Reducing Coatings by DualFast Atom Beam Technique," J. Vac. Sci. Technol., A 4, pp. 2993-2996 (1986).
7. Harper, J.M.E., Cuomo, J.J., and Hentzell, H.T.G., "QuantitativeIon Beam Process for the Deposition of Compound Thin Films," Appl.
Phys. Lett., 43, pp. 547-549 (1983).
8. Rossnagel, S.M., and Cuomo, J.J., "Film Modification by LowEnergy Ion Bombardment During Deposition," Thin Solid Films, 171,pp. 143-156 (1989).
9. Hubler, G.K., "Fundamentals of Ion-Beam Assisted Deposition:Technique and Film Properties," Mater. Sci. Eng. A, Struct. Mater.,Prop. Microstruct. Process. (Switzerland), Al15, pp. 181-192(1989).
10. Kelly, R., "Thermal Effects in Sputtering," Surface Sci., 90,p. 280 (1979).
11. Kuwano, H., and Nagai, K., "Thin Solid Lubricant Film Formationby Fast Atom Bombardment Sputter Deposition," J. Vac. Sci.
Technol., A 3, pp. 1809-1812 (1985).
12. Bolster, R.N., and Singer, I.L., "IBAD MoS 2 Film Deposition
From a Composite Target," NRL Letter Report 6170-431A of 17 October
1990
30