Embed Size (px)
Citation preview

7/29/2019 Navan Ee Than
http://slidepdf.com/reader/full/navan-ee-than 1/73
“A STUDY ON JOB SATISFACTION OF WORKERS AT RHYTHM FASHION
IN TIRUPUR”
Submitted by
S.NAVANEETHAKRISHNAN
Reg No: 088 001614 049
In partial fulfillment of the requirements of
ANNA UNIVERSITY
Coimbatore
For the award of the degree of
MASTER OF BUSINESS ADMINISTRATION
DEPARTMENT OF MANAGEMENT STUDIES
SSM COLLEGE OF ENGINEERING,
Komarapalayam, Namakkal-638183.
SEPTEMPER 2009

7/29/2019 Navan Ee Than
http://slidepdf.com/reader/full/navan-ee-than 2/73
BONAFIDE CERTIFICATE
This is to certify that the project work titled “A STUDY ON JOB
SATISFACTION OF WORKERS AT RHYTHM FASHION IN TIRUPUR” is a work of
NAVANEETHAKRISHNAN.S (REG. NO.088001614049) that carried out the same
under my supervision. Certified further that to the best of my knowledge the work
reported herein does not form part of any other project work or dissertation on the basis
of which a degree or award was conferred on an earlier occasion of this or any other
candidate. This project work is submitted to Anna University Coimbatore as partial
fulfillment of requirement for the award of degree of Master of Business Administration.
……………………………………….
Signature and Name of the Guide
…………………………………………
Signature and Name of the HOD
Submitted for the viva-voce examination held on
___________________ ___________________
(Signature of Internal (Signature of ExternalExaminer with date) Examiner with date)

7/29/2019 Navan Ee Than
http://slidepdf.com/reader/full/navan-ee-than 3/73
DECLARATION
I, NAVANEETHAKRISHNAN.S ,hereby declare that the summer training report,
entitled “A STUDY ON JOB SATISFACTION OF WORKERS AT RHYTHM FASHION
IN TIRUPUR” submitted to the Anna University Coimbatore in partial fulfillment of the
requirements for the award of the degree of MASTER OF BUSINESS
ADMINISTRATION is a record of original and independent research work done by me
during July 2009 to August 2009 under the supervision and guidance of Ms. S.PRIYA
DHARSHNI, MBA, lecturer , DEPARTMENT OF MANAGEMENT , SSM COLLEGE OF
ENGINEERING, KOMARAPALAYAM , and it has not formed the basis for the award of
any Degree / Diploma / Associate - ship / Fellowship or other similar title to any
candidate of any university .
Place: Signature of the student
Date: (NAVANEETHAKRISHNAN.S)

7/29/2019 Navan Ee Than
http://slidepdf.com/reader/full/navan-ee-than 4/73
ACKNOWLEDGEMENT
I am grateful to correspondent ‘cavalier’ Dr.M.S.Mathivanan, M.A., M.com,
M.Phil, H.D.C.(LON), H.G.D.M.(LON), PhD, chairman and correspondent of SSM
College of Engineering, komarapalayam for his encouragement in doing this project.
I express my special privilege and everlasting heartfelt thanks to Principal Prof.
Dr.A.Subramaian PhD, SSM College of Engineering for his guidance and
encouragement.
I am obliged to Prof. Mr.P.Krishna kumar, B.E., M.B.A., M.Phil, MCSD, HOD and
department of the business administration for their moral support to complete the project
work.
I take this opportunity to express my gratitude to my internal guide
Ms.S.Priyadharshni, MBA Department of Management studies, which offered constant
support and valuable guidance and remained as backbone for successful completion of
my project work.
I wish to express my special thanks to my parents and to my parents for completing
this project work.
Finally I am thankful to all the faculty members of the department of business
administration without whose continuous support; I would have not completed this
project successfully.
NAVANEETHAKRISHNAN.S
7/29/2019 Navan Ee Than
http://slidepdf.com/reader/full/navan-ee-than 5/73
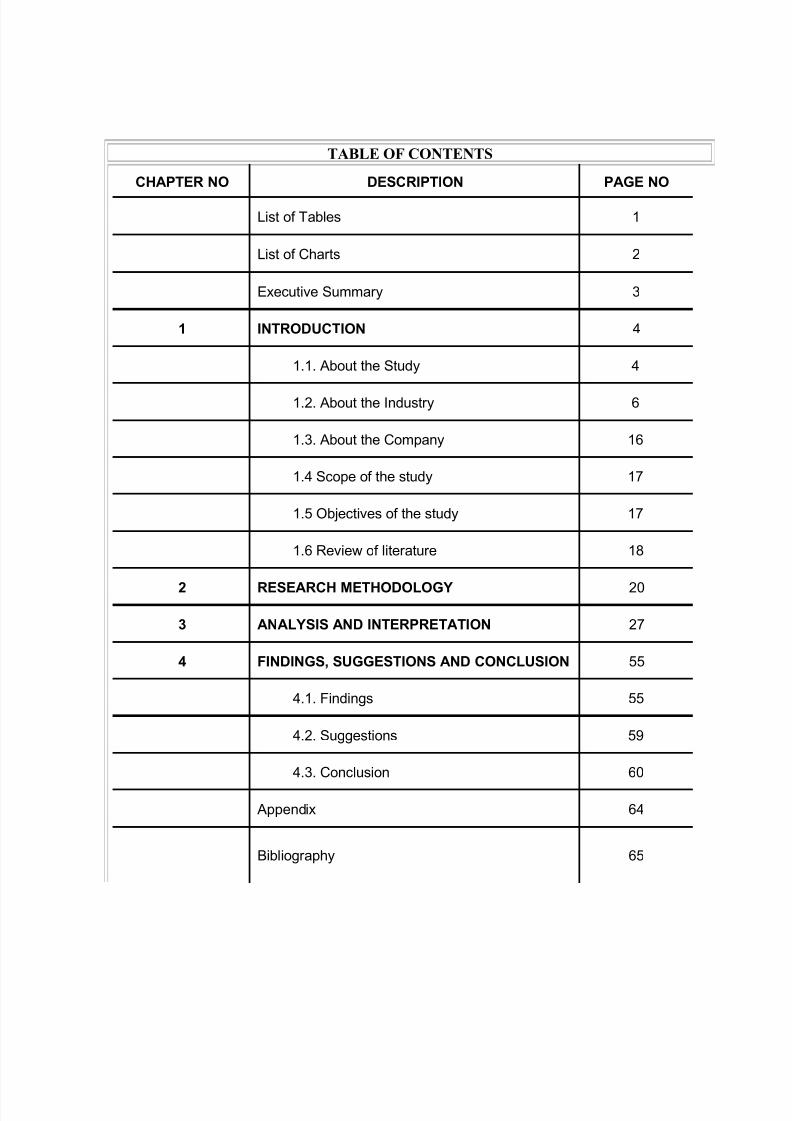
TABLE OF CONTENTS
CHAPTER NO DESCRIPTION PAGE NO
List of Tables 1
List of Charts 2
Executive Summary 3
1 INTRODUCTION 4
1.1. About the Study 4
1.2. About the Industry 6
1.3. About the Company 16
1.4 Scope of the study 17
1.5 Objectives of the study 17
1.6 Review of literature 18
2 RESEARCH METHODOLOGY 20
3 ANALYSIS AND INTERPRETATION 27
4 FINDINGS, SUGGESTIONS AND CONCLUSION 55
4.1. Findings 55
4.2. Suggestions 59
4.3. Conclusion 60
Appendix 64
Bibliography 65
7/29/2019 Navan Ee Than
http://slidepdf.com/reader/full/navan-ee-than 6/73
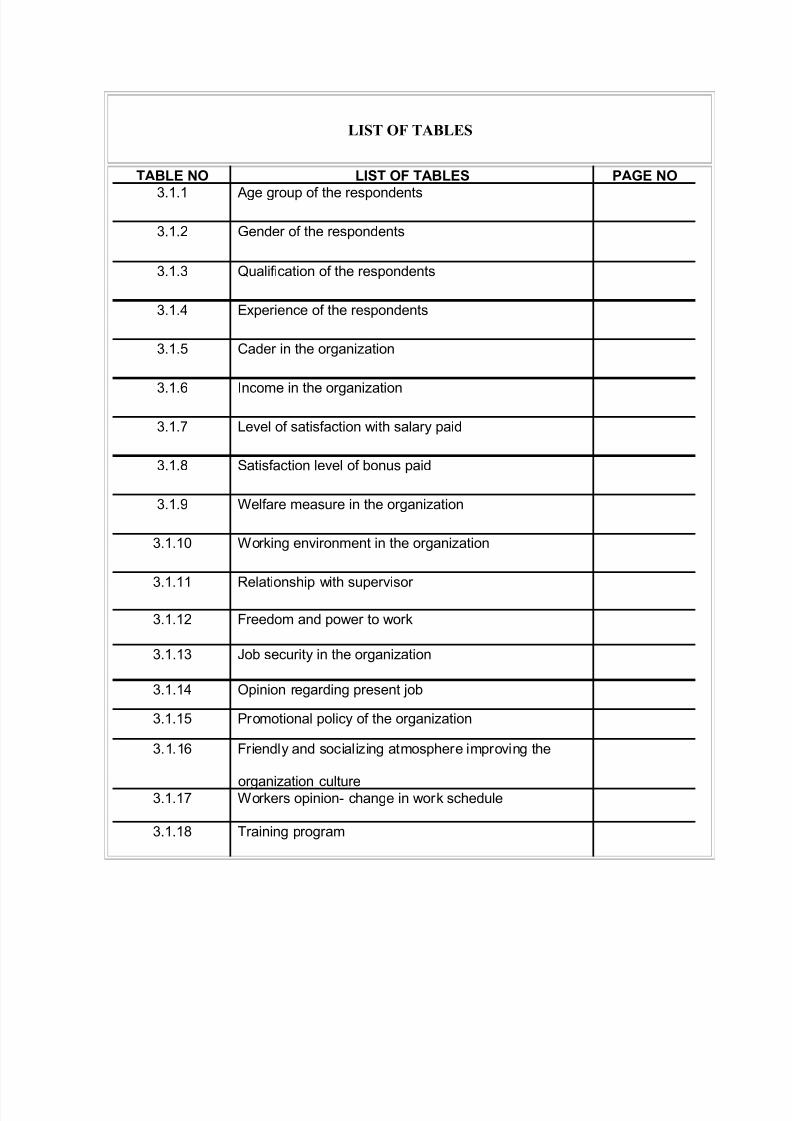
LIST OF TABLES
TABLE NO LIST OF TABLES PAGE NO
3.1.1 Age group of the respondents
3.1.2 Gender of the respondents
3.1.3 Qualification of the respondents
3.1.4 Experience of the respondents
3.1.5 Cader in the organization
3.1.6 Income in the organization
3.1.7 Level of satisfaction with salary paid
3.1.8 Satisfaction level of bonus paid
3.1.9 Welfare measure in the organization
3.1.10 Working environment in the organization
3.1.11 Relationship with supervisor
3.1.12 Freedom and power to work
3.1.13 Job security in the organization
3.1.14 Opinion regarding present job
3.1.15 Promotional policy of the organization
3.1.16 Friendly and socializing atmosphere improving the
organization culture3.1.17 Workers opinion- change in work schedule
3.1.18 Training program

7/29/2019 Navan Ee Than
http://slidepdf.com/reader/full/navan-ee-than 7/73
LIST OF CHART
CHART NO LIST OF CHART PAGE NO
3.1.1 Age group of the respondents
3.1.2 Gender of the respondents
3.1.3 Qualification of the respondents
3.1.4 Experience of the respondents
3.1.5 Cader in the organization
3.1.6 Income in the organization
3.1.7 Level of satisfaction with salary paid
3.1.8 Satisfaction level of bonus paid
3.1.9 Welfare measure in the organization
3.1.10 Working environment in the organization
3.1.11 Relationship with supervisor
3.1.12 Freedom and power to work
3.1.13 Job security in the organization
3.1.14 Opinion regarding present job
3.1.15 Promotional policy of the organization
3.1.16 Friendly and socializing atmosphere improving the
organization culture3.1.17 Workers opinion- change in work schedule
3.1.18 Training program

7/29/2019 Navan Ee Than
http://slidepdf.com/reader/full/navan-ee-than 8/73
EXECUTIVE SUMMARY
Job satisfaction is a positive reaction of a person toward his/her job. Job
satisfaction can be measured in many ways, industrial psychologist have developed
great effort to define and measuring job satisfaction.
I am going to measure job satisfaction primarily through questionnaires. These
questionnaires typically address satisfaction on various facets of the job as well as
provide an overall satisfaction score for each employee.
This study exposes the "JOB SATISFACTION" and reliable feed back of
employees in the company.
CHAPTER – 1
INTRODUCTION
7/29/2019 Navan Ee Than
http://slidepdf.com/reader/full/navan-ee-than 9/73
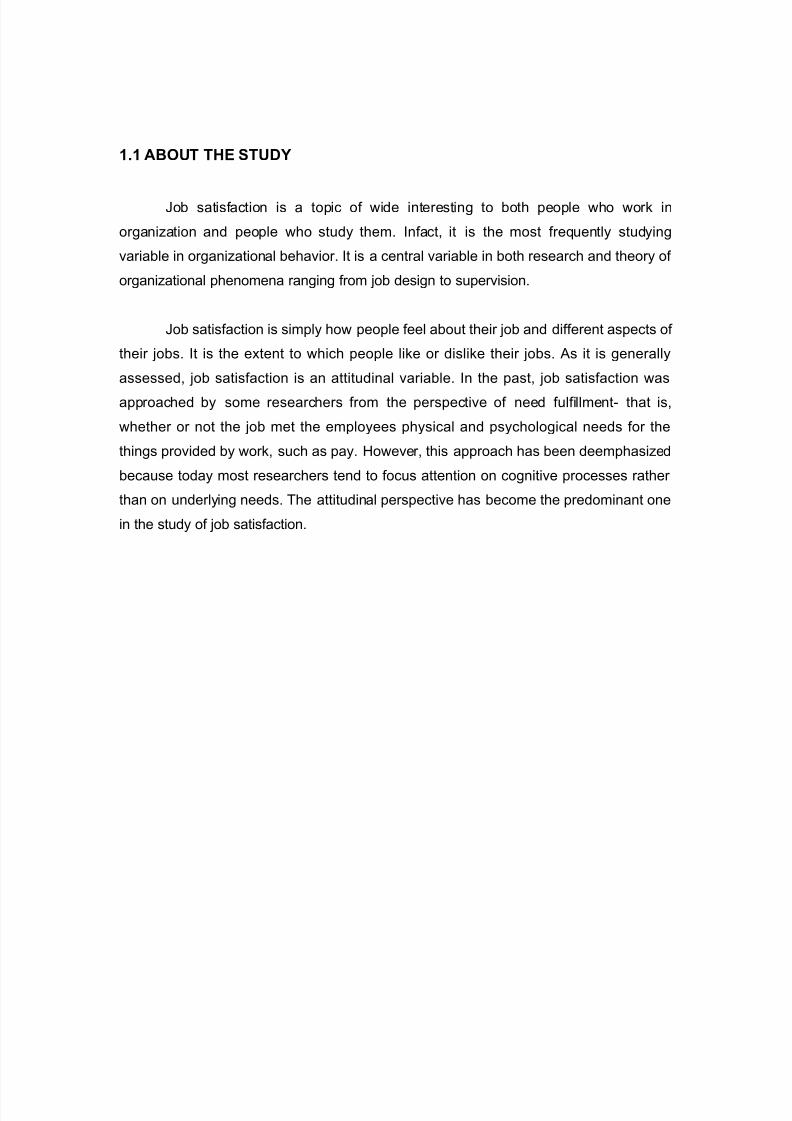
1.1 ABOUT THE STUDY
Job satisfaction is a topic of wide interesting to both people who work in
organization and people who study them. Infact, it is the most frequently studying
variable in organizational behavior. It is a central variable in both research and theory of
organizational phenomena ranging from job design to supervision.
Job satisfaction is simply how people feel about their job and different aspects of
their jobs. It is the extent to which people like or dislike their jobs. As it is generally
assessed, job satisfaction is an attitudinal variable. In the past, job satisfaction was
approached by some researchers from the perspective of need fulfillment- that is,
whether or not the job met the employees physical and psychological needs for the
things provided by work, such as pay. However, this approach has been deemphasized
because today most researchers tend to focus attention on cognitive processes rather
than on underlying needs. The attitudinal perspective has become the predominant one
in the study of job satisfaction.

7/29/2019 Navan Ee Than
http://slidepdf.com/reader/full/navan-ee-than 10/73
According to Fredrick Hertzberg, satisfaction and dissatisfaction are not opposite
poles of one dimension, they are two separate dimensions. Satisfaction is affected by
motivators and dissatisfaction by hygiene factors this is the key idea of Hertzberg, and it
has important implications for managers.
According to Hertzberg, hygiene issues are those which cannot motivate
Employees but can minimize dissatisfaction if handled properly.
Hygiene issues include company and administrative policies, supervision,
Salary, interpersonal relations and working conditions.
Motivation issues include achievement, recognition, responsibility,
advancement and work itself.
The organization should deal with hygiene issues first before moving on to
the motivational issues.
1.2. ABOUT THE INDSUTRY

7/29/2019 Navan Ee Than
http://slidepdf.com/reader/full/navan-ee-than 11/73
The Textile Industry
New innovations in clothing production, manufacture and design came during theIndustrial Revolution – these new wheels, looms, and spinning processes changedclothing manufacture forever.
The ‘rag trade’, as it is referred to in the UK and Australia is the manufacture,trade and distribution of textiles.
There were various stages – from a historical perspective – where the textile industryevolved from being a domestic small-scale industry, to the status of supremacy itcurrently holds. The ‘cottage stage’ was the first stage in its history where textiles wereproduced on a domestic basis.
During this period cloth was made from materials including wool, flax and cotton.The material depended on the area where the cloth was being produced, and the timethey were being made.
In the later half of the medieval period in the northern parts of Europe, cotton came to beregarded as an imported fiber. During the later phases of the 16th century cotton wasgrown in the warmer climes of America and Asia. When the Romans ruled, wool, leather and linen were the materials used for making clothing in Europe, while flax was theprimary material used in the northern parts of Europe.
During this era, excess cloth was bought by the merchants who visited various areas toprocure these left-over pieces. A variety of processes and innovations wereimplemented for the purpose of making clothing during this time. These processes weredependent on the material being used, but there were three basic steps commonly
employed in making clothing. These steps included preparing material fibers for thepurpose of spinning, knitting and weaving.
During the Industrial Revolution, new machines such as spinning wheels and handloomscame into the picture. Making clothing material quickly became an organized industry –as compared to the domesticated activity it had been associated with before. A number of new innovations led to the industrialization of the textile industry in Great Britain.
Clothing manufactured during the Industrial Revolution formed a big part of the exportsmade by Great Britain. They accounted for almost 25% of the total exports made at thattime, doubling in the period between 1701 and 1770.
The center of the cotton industry in Great Britain was Lancashire – and the amountexported from 1701 to 1770 had grown ten times. However, wool was the major exportitem at this point of time.
In the Industrial Revolution era, a lot of effort was made to increase the speed of theproduction through inventions such as the flying shuttle in 1733, the flyer-and-bobbinsystem, and the Roller Spinning machine by John Wyatt and Lewis Paul in 1738.

7/29/2019 Navan Ee Than
http://slidepdf.com/reader/full/navan-ee-than 12/73
Lewis Paul later came up with the carding machine in 1748 and in 1764 the spinning jenny was also developed. The water frame was invented in 1771 by Richard Arkwright.The power loom was invented in 1784 by Edmund Cartwright.
In the initial phases, textile mills were located in and around the rivers since they werepowered by water wheels. After the steam engine was invented, the dependence on the
rivers ceased to a great extent. In the later phases of the 20th century, shuttles that wereused in the textile industry were developed and became faster and thus more efficient.This led to the replacement of the older shuttles with the new ones.
Today, modern techniques, electronics and innovation have led to a competitive, low-priced textile industry offering almost any type of cloth or design a person could desire.With its low cost labour base, China has come to dominate the global textile industry
The history of development in World Textile industry was started in Britain as the spinning and
weaving machines were invented in that country.
High production of wool, cotton and silk over the world has boosted the industry in recent years.
Though the industry was started in UK, still in 19th Century the textile production passed to Europe
and North America after mechanization process in those areas. From time to time Japan, China and
India took part in industrializing their economies and concentrated more in that sector.
Japan, India, Hong Kong and China became leading producers due to their cheap labour supply,
which is an important factor for the industry.
Global Textile Scenario
According to statistics, the global textile market possesses a worth of more than $400 billions
presently. In a more globalize environment, the industry has faced high competition as well as
opportunities. It is predicted that Global textile production will grow by 25 percent between 2002
and 2010 and Asian region will largely contribute in this regard.
WTO In Textile Industry
The World Trade Organization (WTO) has taken so many steps for uplifting this sector. In the year
1995, WTO had renewed its MFA and adopted Agreement on Textiles and Clothing (ATC), which
states that all quotas on textile and clothing will be removed among WTO member countries.
However the level of exports in textiles from developing countries is increasing even if in the
presence of high tariffs and quantitative restrictions by economically developed countries.
Moreover the role of multifunctional textiles, eco-textiles, e-textiles and customized textiles are

7/29/2019 Navan Ee Than
http://slidepdf.com/reader/full/navan-ee-than 13/73
considered as the future of textile industry.
The following tables show the largest oil companies both by production and reserves as of the year
2003.

7/29/2019 Navan Ee Than
http://slidepdf.com/reader/full/navan-ee-than 14/73
1.3 ABOUT THE COMPANY
Introduction about the Company:
• The Rhythm Fashion Established In April 2000 and the plant was setup at
Tirupur in Tamilnadu in 2000.
• Since it has more dealers in TamilNadu.
• The Rhythm Fashion authorized main dealers in 2003.
Company Highlights
• The Rhythm Fashion is the largest dealers in Tirupur and surrounding area.
Management
• The Rhythm Fashion is a professionally managed company headed by
Nataraj.M, chairman, A.K.Saminathan, founder. The day-today affairs of the
company are managed by him assisted by the Executive Director and other key
personnel in each functional area.
• It has located in Tirupur, TamilNadu.

7/29/2019 Navan Ee Than
http://slidepdf.com/reader/full/navan-ee-than 15/73
1.4 SCOPE OF THE STUDTY
To analyze the findings of the stated objective and to suggest methods to
improve job satisfaction.
The present study aims to asses the job satisfaction of employees in the
organization.
The study helps to identify the various factors and their level of satisfaction of
employees towards their jobs.
Job satisfaction is as important as employee competence for the organization
to achieve its goals
1.5 OBJECTIVES OF THE STUDY:
To determine the level of job satisfaction of workers in Rhythm Fashion in
Tirupur.
To know the working condition provided by the company to the worker.
To identify the workers opportunities for present and future growth.
To measure the effectiveness of labour welfare measure provided by the
company
To offer suggestion for improving under job satisfaction in Rhythm Fashion in
Tirupur.

7/29/2019 Navan Ee Than
http://slidepdf.com/reader/full/navan-ee-than 16/73
1.6 REVIEW OF LITERATURE:
"Job satisfaction is in regard to one or state - of - mind regarding the nature of
their work". Job satisfaction can be influenced by a variety of factors.
The quality of one's relationship with their supervisor
The quality of the physical environment in which they work
Degree of full filament in their work etc.
Job satisfaction is one of the important factors that have drawn attention of
manager in the organization.
Definition:
"Job satisfaction is the mental feeling of favorable which an individual has about
his job".
“Job satisfaction is the amount of pleasure or contentment associated with the
job".
Two Dimension of job satisfaction:
Motivation issues
Hygiene issues
Hygiene factors:
Company and administrative policies organization policies can be a great source
of frustration for employees if the policies are unclear or necessary.

7/29/2019 Navan Ee Than
http://slidepdf.com/reader/full/navan-ee-than 17/73
Motivation factors:
Achievement:
The organization should make sure that the employees are placed in their
position to use their talents and not set up for failure.
Work itself:
The most important issue to job satisfaction is helping employees believe that the
work they are doing is important and that their task are meaning full.
Importance of job satisfaction:
Satisfaction has some relation with the mental health of people
Job satisfaction has some degree of positive correlation with physically
health of individuals.
Individuals can live with the organization
Reduces absenteeism and labour turn over and absentee and the
manager are compelled if they are unconvinced about merits of job
satisfaction to give priority weight age to job satisfaction.
Determinates of Job satisfaction:
The various factors influencing job satisfaction may be classified in to two factors
environmental factors:
Job content
Occupational level
Pay and promotion
Work group

7/29/2019 Navan Ee Than
http://slidepdf.com/reader/full/navan-ee-than 18/73
Supervision
Personal factors
Age
Sex
Educational level
Martial status
Experience
How to improve job satisfaction:
ii) Improving working condition
iii) Transferring discontented works
iv) Changing the perception of dissatisfaction employees
1. Improving working condition:
In one company job environment raised the new sale at electronic
technicians.
They are identifying the course at job satisfaction. The management can
evolve a strategy for remedial action.
2. Transferring discontented workers:
This transfer achieves a better fit between individuals and job
characteristics and promotes job satisfaction.
This kind of transfer may not be without certain constraints
The dissatisfied persons may be unwilling to move from the existing
position or he may be incompetent to hold other challenging job.

7/29/2019 Navan Ee Than
http://slidepdf.com/reader/full/navan-ee-than 19/73
Research and development:
In order to anticipated customer expectation our attitude and strategy rely on the
slogan" the best way to predict the future is to create it",
Manufacture:
Concrete block machine
Manufacture of favor moulds
Manufacture of retain wall block making machine
Improving Job satisfaction:
Job redesign
Job enrichment
Improving quality of life
Linking reward with performance
Improving over all organization climate
7/29/2019 Navan Ee Than
http://slidepdf.com/reader/full/navan-ee-than 20/73
CHAPTER 2
RESEARCH METHODOLOGY
Research methodology is a way to systematically show there search problem. The
research methodology considers the logic behind the method we use in the context of
our research study.
Descriptive Research Design
The study is descriptive in nature. Descriptive studies are more than just a
collection of data. They include measurements, classifications, analysis, comparisons
and interpretations. It tells about what exists at present by determining the nature and
degree of existing conditions.
SOURCES OF DATA:
Primary data:
The source of primary data is the employees. With the help of the questionnaire
distributed among the employees, the researcher collected the needful information from
the respondent which is the primary data for the research.
Secondary Data:
The secondary data has been collected form the publications, office records,
profile of the company, websites, which are been needed for the study.
Sampling size:
A random sample of 100 workers was taken for survey.

7/29/2019 Navan Ee Than
http://slidepdf.com/reader/full/navan-ee-than 21/73
Sampling technique:
The type of sampling used in this study is probability sampling.
Statistical tools used
1. Simple percentage analysis
2. Chi – Square test
3. Weighted average
4. ANOVA.
1. Simple percentage analysis
The percentage method is used for comparing certain feature. The collected data
represented in the from of tables and graphs in order to give effective visualization of
comparison made.
Actual population
Sample Percentage = ------------------------------ X 100
Sample size
2. – Square Analysis test
It is useful to determine the sign can’t relationship between the two ariables.
The formula is used for chi-square test.
(O-E)^2
Chi-square = -----------------
E
Where,
O = observed frequency

7/29/2019 Navan Ee Than
http://slidepdf.com/reader/full/navan-ee-than 22/73
E = expected frequency
Expected frequency is calculated as follows
Row total x column total
Expected value = --------------------------------------------
Grand total
Degree of freedom = (r-1) x (c-1)
Where,
R = Number of rows
C = Number of columns.
3. Weighted average
A set of observations computed by taking into account the corresponding
weights is known as the weighted average.
∑w¡x¡
Weighted average () = -------------------------
∑w¡
Where,
w¡ = Weights
x¡ = Samples.
3. ANOVA
Analysis of variance (Abbreviated as ANOVA) is an extremely useful
technique concerning researches in the fields of economics, biology, education,
psychology, sociology, and business/industry in researches of several other disciplines.
This technique is used here since multiple sample cases are involve
One – way ANOVA:
Under the one – way ANOVA, we consider only one factor and then
observe that the reason for said factor to be important is that several possible types of
7/29/2019 Navan Ee Than
http://slidepdf.com/reader/full/navan-ee-than 23/73
samples can occur within that factor. We then determine if there are differences within
that factor. The technique involves the following step
CHAPTER – 3
ANALYSIS AND INTERPRETATION
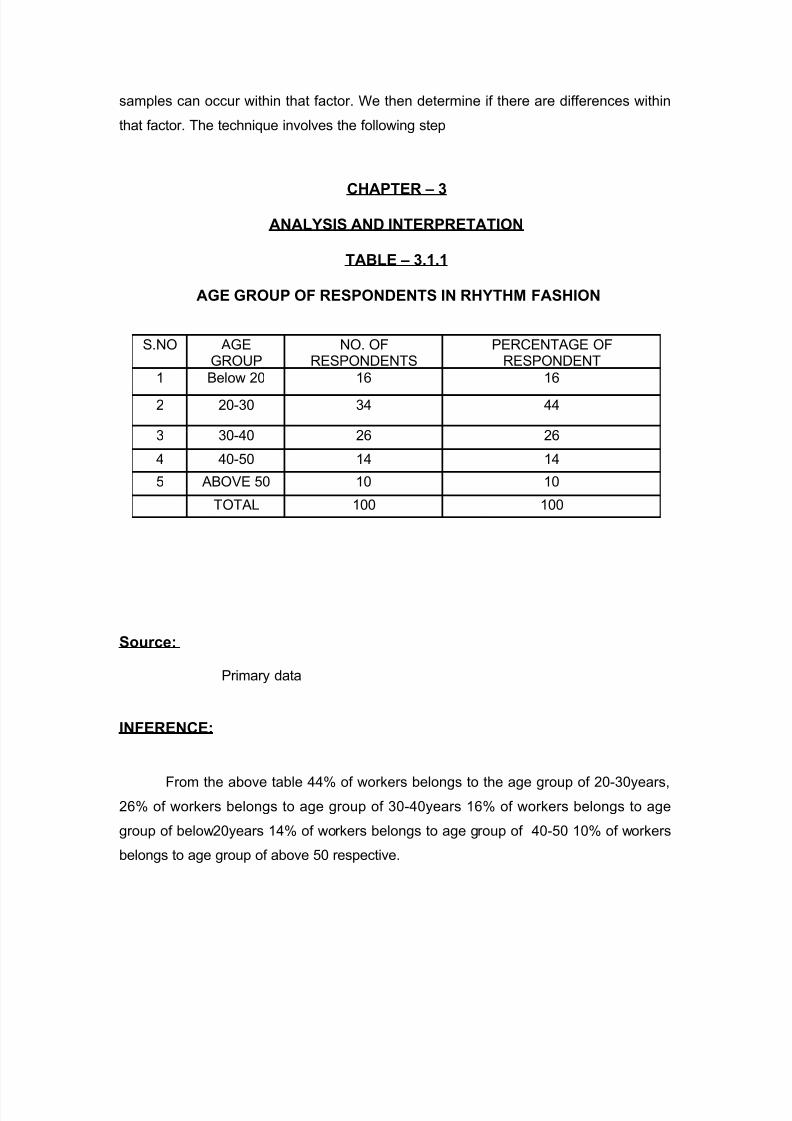
TABLE – 3.1.1
AGE GROUP OF RESPONDENTS IN RHYTHM FASHION
Source:
Primary data
INFERENCE:
From the above table 44% of workers belongs to the age group of 20-30years,26% of workers belongs to age group of 30-40years 16% of workers belongs to age
group of below20years 14% of workers belongs to age group of 40-50 10% of workers
belongs to age group of above 50 respective.
S.NO AGEGROUP
NO. OFRESPONDENTS
PERCENTAGE OFRESPONDENT
1 Below 20 16 16
2 20-30 34 44
3 30-40 26 26
4 40-50 14 14
5 ABOVE 50 10 10
TOTAL 100 100

7/29/2019 Navan Ee Than
http://slidepdf.com/reader/full/navan-ee-than 24/73
CHART -3.1.1
AGE GROUP OF RESPONDENTS IN RHYTHM FASHION
16
34
26
14
10
0
5
10
15
20
25
30
35
40
below20 20-30 30-40 40-50 above50
AGE GROUP OF WORKERS
N O O
F R E S P O N D E N D S

7/29/2019 Navan Ee Than
http://slidepdf.com/reader/full/navan-ee-than 25/73
TABLE-3.1.2
GENDER OF RESPONDENTS IN RHYTHM FASHION
S.NO GENDER NO OFRESPONDENTS
PERCENTAGE OFRESPONDENTS
1 MALE 62 622 FEMALE 38 38
TOTAL 100 100
Source:
Primary data
INFERENCE:
From the above table 62% of respondents are men.38% of respondents are
female in the organization.

7/29/2019 Navan Ee Than
http://slidepdf.com/reader/full/navan-ee-than 26/73
CHART-3.1.2
GENDER OF RESPONDENTS IN RHYTHM FASHION
62
38
0
10
20
30
40
50
60
70
MALE FEMALE
GENDER
N O O
F
R E S P O N D E N T S

7/29/2019 Navan Ee Than
http://slidepdf.com/reader/full/navan-ee-than 27/73
TABLE – 3.1.3
QUALIFICATION OF RESPONDENTS IN RHYTHM FASHION
S.NO EDUCATIONALQUALIFICATION
NO OFRESPONDENTS
PERCENTAGE OFRESPONDENTS
1 H.S.C 28 28
2 UG 36 36
3 PG 16 16
4 DIPLOMA 15 15
5 OTHERS 5 5
TOTAL 100 100
Source:
Primary data
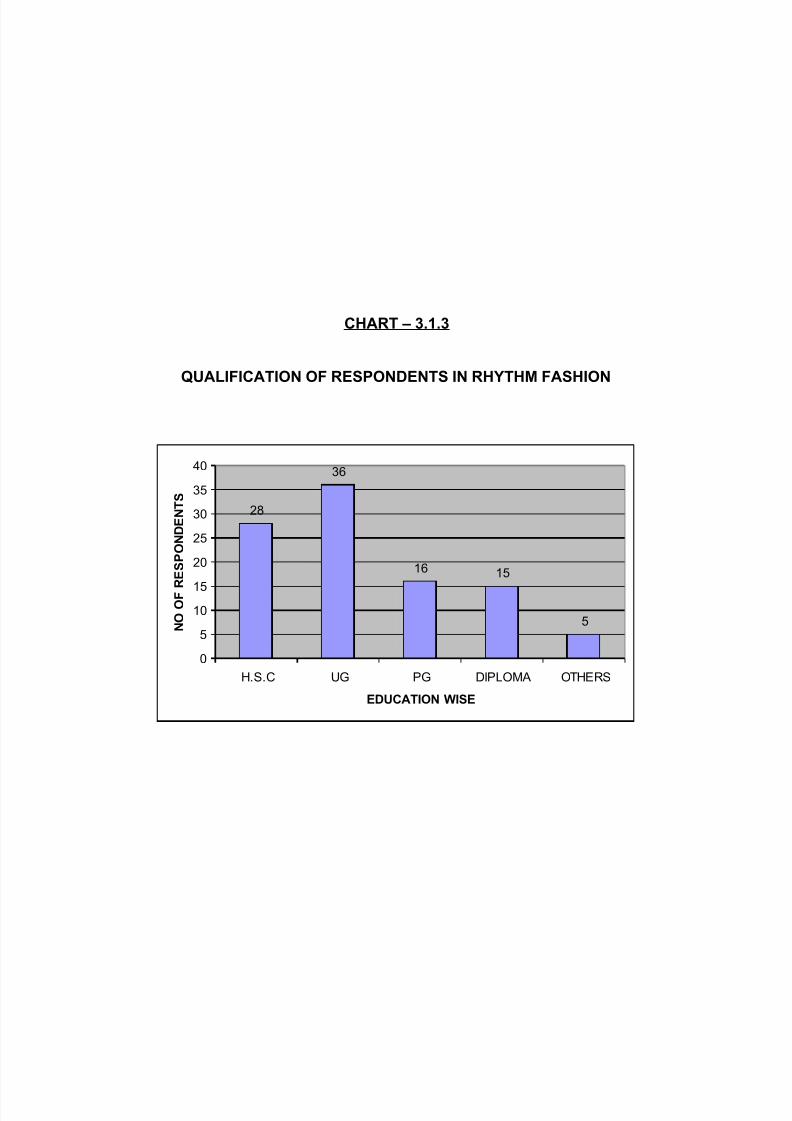
INFERENCE:
From the above table 36% of respondents are completed there graduates 28% of
respondents Up to Higher secondary, 16% of respondents are completed Post
Graduates, 15% of respondents are completed there Diploma,5% of respondents are
others in Rhythm Fashion
7/29/2019 Navan Ee Than
http://slidepdf.com/reader/full/navan-ee-than 28/73
CHART – 3.1.3
QUALIFICATION OF RESPONDENTS IN RHYTHM FASHION
28
36
16 15
5
0
5
10
15
20
25
30
35
40
H.S.C UG PG DIPLOMA OTHERS
EDUCATION WISE
N O O
F R E S P O N D E N T S

7/29/2019 Navan Ee Than
http://slidepdf.com/reader/full/navan-ee-than 29/73
TABLE –3.1. 4
EXPERIENCE OF THE RESPONDENTS IN RHYTHM FASHION
S.NO EXPERIENCE NO. OFRESPONDENTS
PERCENTAGE OFRESPONDENT
1 Below 2 Yrs 20 20
2 2-5 Yrs 26 26
3 6-9 Yrs 28 28
4 Above 10 Yrs 26 26
TOTAL 100 100
Source:
Primary data
INFERENCE:
From the above table, 28% of respondents having 6-9years
Experience, 26% of respondents having 2-5years experience, 26% respondents have
above ten years Experience, and 20% of respondents have below 2years experience.

7/29/2019 Navan Ee Than
http://slidepdf.com/reader/full/navan-ee-than 30/73
CHART -3.1.4
EXPERIENCE OF THE RESPONDENTS IN RHYTHM FASHION
20
2628
26
0
5
10
15
20
25
30
Below 2 Yrs 2-5 Yrs 6-9 Yrs Above 10 Yrs
EXPERIENCE OF WORKERS
N O
O F R E S P O N D E N T S
7/29/2019 Navan Ee Than
http://slidepdf.com/reader/full/navan-ee-than 31/73
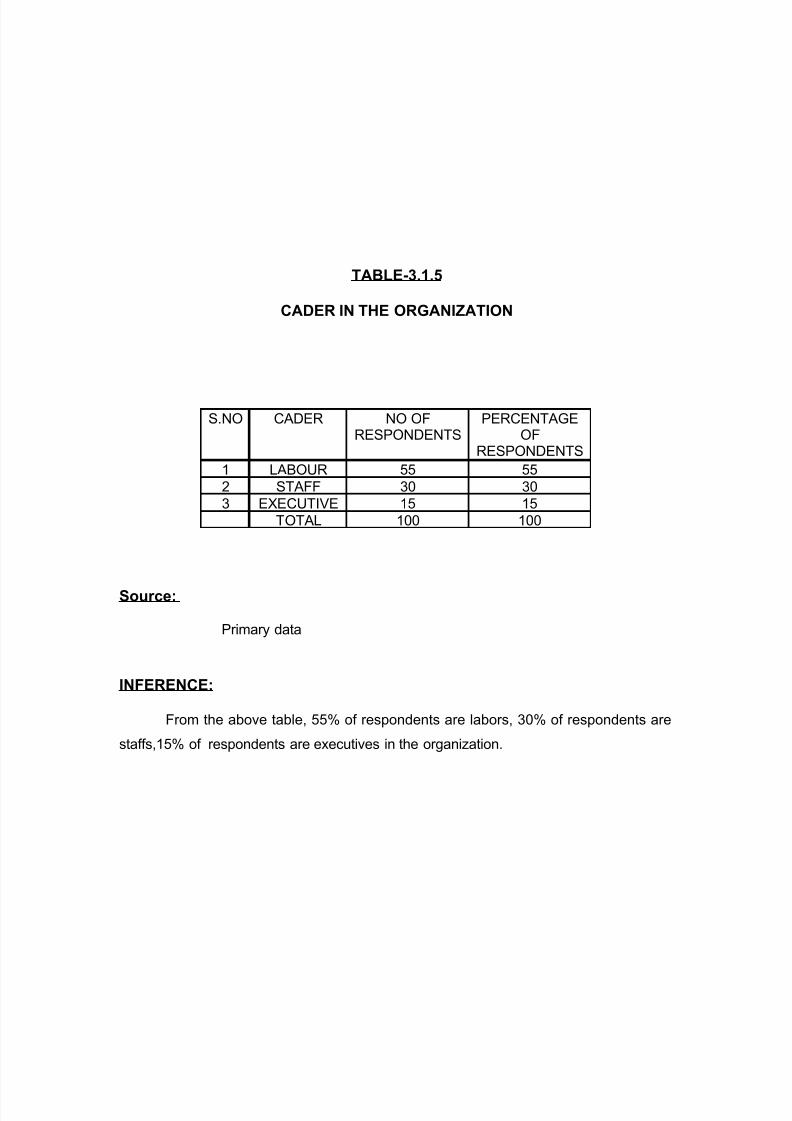
TABLE-3.1.5
CADER IN THE ORGANIZATION
S.NO CADER NO OFRESPONDENTS
PERCENTAGEOF
RESPONDENTS
1 LABOUR 55 55
2 STAFF 30 30
3 EXECUTIVE 15 15
TOTAL 100 100
Source:
Primary data
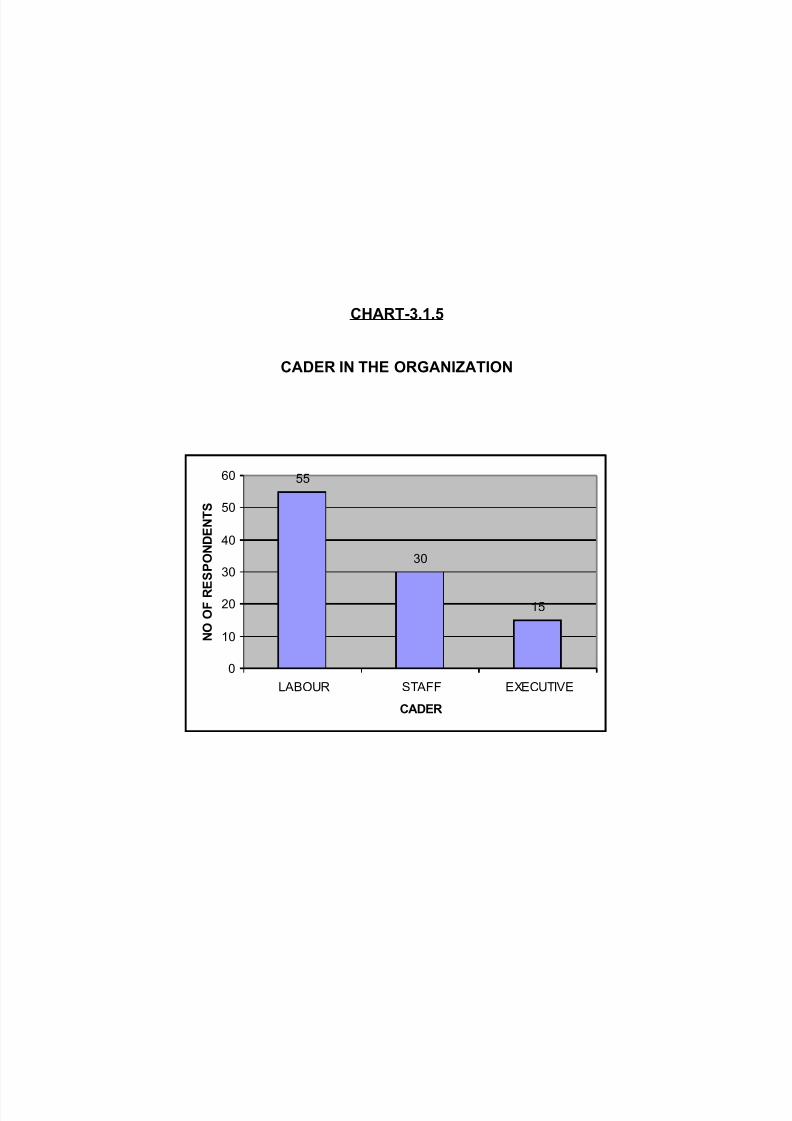
INFERENCE:
From the above table, 55% of respondents are labors, 30% of respondents are
staffs,15% of respondents are executives in the organization.
7/29/2019 Navan Ee Than
http://slidepdf.com/reader/full/navan-ee-than 32/73
CHART-3.1.5
CADER IN THE ORGANIZATION
55
30
15
0
10
20
30
40
50
60
LABOUR STAFF EXECUTIVE
CADER
N O O
F R E S P O N D E N T S

7/29/2019 Navan Ee Than
http://slidepdf.com/reader/full/navan-ee-than 33/73
TABLE-3.1.6
INCOME IN THE ORGANIZATION
S.NO INCOME NO OFRESPONDENTS
PERCENTAGEOF
RESPONDENTS
1 BelowRs.3000 35 35
2 Rs.3000-5000 28 28
3 Rs.5000-10000
20 20
4 Rs.10000-20000
17 17
TOTAL 100 100
Source:
Primary data
INFERENCE:
From the above table, 35% of respondents income below R.s 3000,
28% of respondents income R.s 3000-5000,20% of respondents income R.s5000-
10000,17% of staffs,15% of respondents income 10000-20000 in the organization.

7/29/2019 Navan Ee Than
http://slidepdf.com/reader/full/navan-ee-than 34/73
CHART-3.1.6
INCOME IN THE ORGANIZATION
35
28
20
17
0
5
10
15
20
25
30
35
40
BelowRs.3000 Rs.3000-5000 Rs.5000-10000 Rs.10000-20000
INCOME
N O O
F R E S P
O N D E N T S
7/29/2019 Navan Ee Than
http://slidepdf.com/reader/full/navan-ee-than 35/73
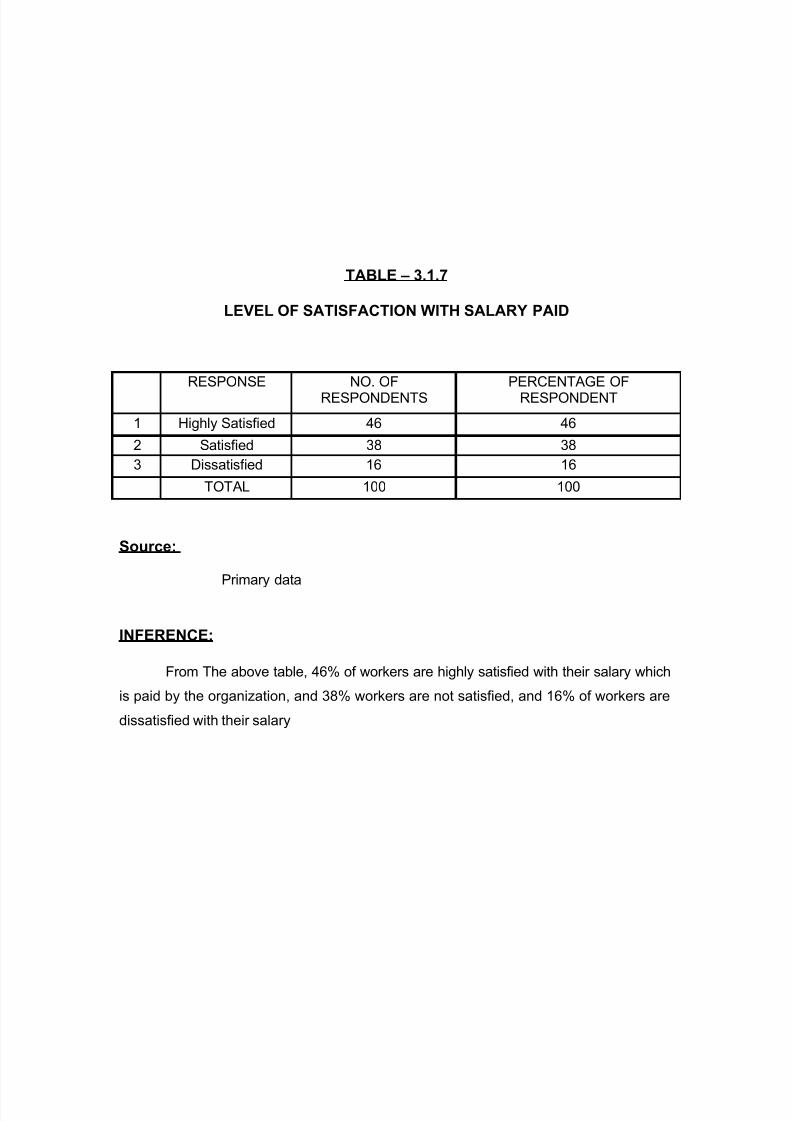
TABLE – 3.1.7
LEVEL OF SATISFACTION WITH SALARY PAID
RESPONSE NO. OFRESPONDENTS
PERCENTAGE OFRESPONDENT
1 Highly Satisfied 46 46
2 Satisfied 38 38
3 Dissatisfied 16 16
TOTAL 100 100
Source:
Primary data
INFERENCE:
From The above table, 46% of workers are highly satisfied with their salary which
is paid by the organization, and 38% workers are not satisfied, and 16% of workers are
dissatisfied with their salary

7/29/2019 Navan Ee Than
http://slidepdf.com/reader/full/navan-ee-than 36/73
CHART – 3.1.7
LEVEL OF SATISFACTION WITH SALARY PAID
46
38
16
0
5
10
15
20
25
30
35
40
45
50
Highly Satisfied Satisfied Dissatisfied
OPINIONS
N O O
F R E S P O N D E N T S

7/29/2019 Navan Ee Than
http://slidepdf.com/reader/full/navan-ee-than 37/73
TABLE – 3.1.8
SATISFACTION LEVEL OF BONUS PAID
S.NO RESPONSE NO. OFRESPONDENTS
PERCENTAGE OFRESPONDENT
1 Highly Satisfied 58 58
2 Satisfied 20 20
3 Dissatisfied 22 22
TOTAL 100 100
Source:
Primary data
INFERENCE:
From the above table shows that, 58% of the respondents says that
they have highly satisfied with the bonus, 20% of respondents says that they are not
satisfied with the bonus 22% of respondents are dissatisfied with the bonus, which is
paid by the organization.

7/29/2019 Navan Ee Than
http://slidepdf.com/reader/full/navan-ee-than 38/73
CHART- 3.1.8
SATISFACTION LEVEL OF BONUS PAID
58
20 22
0
10
20
30
40
50
60
70
Highly Satisfied Satisfied Dissatisfied
OPINIONS
N O O
F R E S P O N D E N T S

7/29/2019 Navan Ee Than
http://slidepdf.com/reader/full/navan-ee-than 39/73
TABLE-3.1.9
WELFARE MEASURE IN THE ORGANIZATION
S.NO RESPONSE NO. OFRESPONDENTS
PERCENTAGE OF RESPONDENT
1 HighlySatisfied
30 30
2 Satisfied 55 55
3 Some whatsatisfied
15 15
4 Dissatisfied 0 0
TOTAL 100 100
Source:
Primary data
INFERENCE:
From the above table shows that, 30% of the respondents says that
they have highly satisfied with the welfare measure, 55% of respondents says that they
are satisfied with the welfare measure, 15% of respondents are some what satisfied
with the welfare measure in the organization.

7/29/2019 Navan Ee Than
http://slidepdf.com/reader/full/navan-ee-than 40/73
CHART-3.1.9
WELFARE MEASURE IN THE ORGANIZATION
30
55
15
00
10
20
30
40
50
60
Highly
Satisfied
Satisfied Some what
satisfied
Dissatisfied
OPINIONS
N O O
F R E S P O N D E N T S

7/29/2019 Navan Ee Than
http://slidepdf.com/reader/full/navan-ee-than 41/73
TABLE –3.1.10
WORKING ENVIRONMENT IN THE ORGANIZATION
S.NO RESPONSE NO. OFRESPONDENTS
PERCENTAGE OF RESPONDENT
1 HighlySatisfied
24 24
2 Satisfied 68 68
3 Some whatsatisfied
8 8
4 Dissatisfied 0 0
TOTAL 100 100
Source:
Primary data
INFERENCE :
From the above table shows that 68% of respondents are satisfied
about their working environment, 24% of are highly satisfied about their working
environment, 8% are some what satisfied about their working environment.

7/29/2019 Navan Ee Than
http://slidepdf.com/reader/full/navan-ee-than 42/73
CHART -3.1.10
WORKING ENVIRONMENT IN THE ORGANIZATION
24
68
8
00
10
2030
40
50
60
70
80
Highly Satisfied Satisfied Some what
satisfied
Dissatisfied
OPINIONS
N O O
F R E S P O N D E N T S

7/29/2019 Navan Ee Than
http://slidepdf.com/reader/full/navan-ee-than 43/73
TABLE – 3.1.11
RELATIONSHIP WITH SUPERVISIOR
S.NO RELATIONSHIPWITH
SUPERVISOR
NO. OFRESPONDENTS
PERCENTAGE OFRESPONDENT
1 Yes 84 84
2 No 16 16
TOTAL 100 100
Source:
Primary data
INFERENCE:
From The above table shows that 84% of respondent’s feels that they
have good relationship with their supervisor 16% of respondents feels that they do not
have good relationship with their supervisor in the organization.

7/29/2019 Navan Ee Than
http://slidepdf.com/reader/full/navan-ee-than 44/73
CHART – 3.1.11
RELATIONSHIP WITH SUPERVISIOR
84
16
0
10
20
30
40
50
60
70
80
90
Yes No
OPINIONS
N O O
F R E S P
O N D E N T S

7/29/2019 Navan Ee Than
http://slidepdf.com/reader/full/navan-ee-than 45/73
TABLE – 3.1.12
FREEDOM AND POWER TO WORK
S.NO RESPONSE NO. OFRESPONDENTS
PERCENTAGE OF RESPONDENT
1 HighlySatisfied
24 24
2 Satisfied 58 58
3 Dissatisfied 14 14
4 HighlyDissatisfied
4 4
TOTAL 100 100
Source:
Primary data
INFERENCE:
From the above table shows that 24% of respondents says that they
have highly sayisfied,58% of respondents says that they have satisfied ,14% of
respondents says that they have dissatisfied,4% of respondents says that they have
highly dissatisfied in freedom and power to work in the organization.

7/29/2019 Navan Ee Than
http://slidepdf.com/reader/full/navan-ee-than 46/73
CHART–3.1.12
FREEDOM AND POWER TO WORK
24
58
14
4
0
10
20
30
40
50
60
70
Highly Satisfied Satisfied Dissatisfied Highly
Dissatisfied
OPINIONS
N
O O
F R E S P O N D E N T S

7/29/2019 Navan Ee Than
http://slidepdf.com/reader/full/navan-ee-than 47/73
TABLE – 3.1.13
JOB SECUIRTY IN THE ORGANISATION
S.NO RESPONSE NO. OFRESPONDENTS
PERCENTAGE OF RESPONDENT
1 HighlySatisfied
34 34
2 Satisfied 36 36
3 Some whatsatisfied
20 20
4 Dissatisfied 10 10
TOTAL 100 100
Source:
Primary data
INFERENCE:
From the above table shows that 36% of respondents satisfied with their Jobsecurity in their organization, 34% respondents are highly satisfied about their job
security, and 20% respondents are some what satisfied about their job security, 10%
respondents are dissatisfied about their job security in organization.

7/29/2019 Navan Ee Than
http://slidepdf.com/reader/full/navan-ee-than 48/73
CHART- 3.1.13
JOB SECUIRTY IN THE ORGANISATION
3436
20
10
0
5
10
15
20
25
30
35
40
Highly Satisfied Satisfied Some what
satisfied
Dissatisfied
OPINIONS
N O
O F
R E S P O N D E N T S

7/29/2019 Navan Ee Than
http://slidepdf.com/reader/full/navan-ee-than 49/73
TABLE – 3.1.14
OPINION REGARDING PRESENT JOB
S.NO RESPONSE NO. OFRESPONDENTS
PERCENTAGE OFRESPONDENT
1 Yes 66 66
2 No 34 34
TOTAL 100 100
Source:
Primary data
INFERENCE:
From the above table states that 66% of respondents feel that they are
happy about present job, and 34% of respondents do not feel happy about their present
job in organization.

7/29/2019 Navan Ee Than
http://slidepdf.com/reader/full/navan-ee-than 50/73
CHART – 3.1.14
OPINION REGARDING PRESENT JOB
66
34
0
10
20
30
40
50
60
70
Yes No
OPINIONS
N O O
F
R E S P O N D E N T S

7/29/2019 Navan Ee Than
http://slidepdf.com/reader/full/navan-ee-than 51/73
TABLE – 3.1.15
PROMOTIONAL POLICY OF THE ORGANIZATION
S.NO RESPONSE NO. OFRESPONDENTS
PERCENTAGE OFRESPONDENT
1 Highly Satisfied 32 32
2 Satisfied 38 38
3 Dissatisfied 30 30
TOTAL 100 100
Source:
Primary data
INFERENCE:
From the above analysis, 38% of respondents are satisfied with the
promotional policy of the concern, 32% of respondents are highly satisfied, and 30%
respondents are dissatisfied with the promotional policy of the concern.

7/29/2019 Navan Ee Than
http://slidepdf.com/reader/full/navan-ee-than 52/73
CHART- 3.1.15
PROMOTIONAL POLICY OF THE ORGANIZATION
32
38
30
0
5
10
15
20
25
30
35
40
Highly Sat isfied Satisfied Dissatis fied
OPINIONS
N O O
F R E S P O N D E N T S
7/29/2019 Navan Ee Than
http://slidepdf.com/reader/full/navan-ee-than 53/73
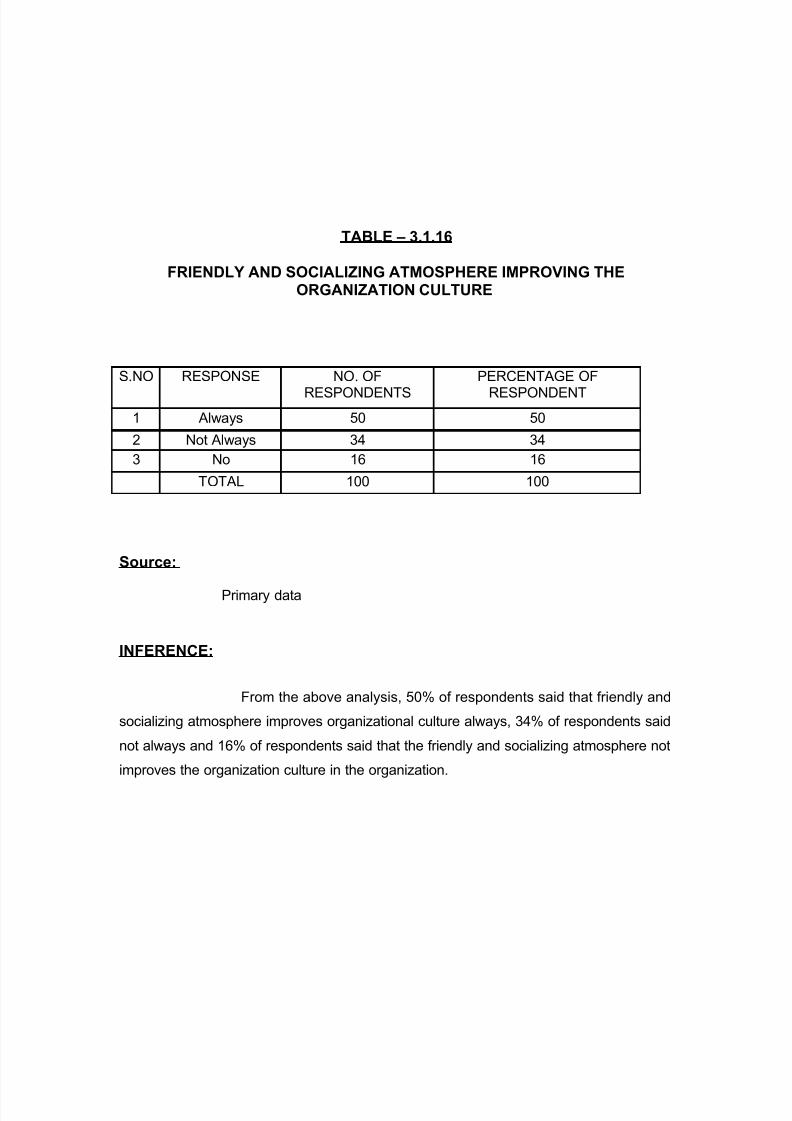
TABLE – 3.1.16
FRIENDLY AND SOCIALIZING ATMOSPHERE IMPROVING THEORGANIZATION CULTURE
Source:
Primary data
INFERENCE:
From the above analysis, 50% of respondents said that friendly and
socializing atmosphere improves organizational culture always, 34% of respondents said
not always and 16% of respondents said that the friendly and socializing atmosphere not
improves the organization culture in the organization.
S.NO RESPONSE NO. OF
RESPONDENTS
PERCENTAGE OF
RESPONDENT
1 Always 50 50
2 Not Always 34 34
3 No 16 16
TOTAL 100 100

7/29/2019 Navan Ee Than
http://slidepdf.com/reader/full/navan-ee-than 54/73
CHART – 3.1.16
FRIENDLY AND SOCIALIZING ATMOSPHERE IMPROVING THEORGANIZATION CULTURE
50
34
16
0
10
20
30
40
50
60
Always Not Always No
OPINIONS
N O O
F R E S P O N
D E N T S

7/29/2019 Navan Ee Than
http://slidepdf.com/reader/full/navan-ee-than 55/73
TABLE –3.1. 17
WORKERS OPINION - CHANGE IN WORK SHEDULE
Source:
Primary data
INFERENCE:
From the above table shows that 42% of respondents are always ready
to accept the change in the work schedule, 30% of respondents are ready to accept the
change in their work schedule but not always, 28% of respondents are not at all accept
for change in their work schedule.
S.NO RESPONSE NO. OFRESPONDENTS
PERCENTAGE OFRESPONDENT
1 Yes 42 42
2 Not always 30 30
3 No 28 28
TOTAL 100 100

7/29/2019 Navan Ee Than
http://slidepdf.com/reader/full/navan-ee-than 56/73
CHART – 3.1.17
WORKERS OPINION CHANGE IN WORK SHEDULE
42
3028
0
5
10
15
20
25
30
35
40
45
Yes Not always No
OPINIONS
N O O
F R E S P O N D E N T S

7/29/2019 Navan Ee Than
http://slidepdf.com/reader/full/navan-ee-than 57/73
TABLE – 3.1.18
TRAINING PROGRAM
S.NO RESPONSE NO. OFRESPONDENTS
PERCENTAGE OF RESPONDENT
1 HighlySatisfied
38 38
2 Satisfied 30 30
3 Some whatsatisfied
32 32
4 Dissatisfied 0 0
TOTAL 100 100
Source:
Primary data
INFERENCE:
From the above table shows 38% of respondents are Highly Satisfied
in there training program,30% of respondents are Satisfied in there training
program,32% of respondents are some what Satisfied in there training program in the
organization.

7/29/2019 Navan Ee Than
http://slidepdf.com/reader/full/navan-ee-than 58/73
CHART- 3.1.18
TRAINING PROGRAM
38
3032
00
5
10
15
20
25
30
35
40
Highly Satisfied Satisfied Some whatsatisfied
Dissatisfied
OPINIONS
N O O
F R E S P O N D E N T S

7/29/2019 Navan Ee Than
http://slidepdf.com/reader/full/navan-ee-than 59/73
TABLE –3.1.19
EMPLOYEES PARTICIPATION IN DECISION MAKING PROCESS
Source:
Primary data
INFERENCE:
From the above table reveals that 54% of workers feel that they are
allowed to take part in managerial decision making,46% respondents feels that they are
not allowed to take part in managerial decision making.
S.NO RESPONSE NO. OFRESPONDENTS
PERCENTAGE OFRESPONDENT
1 Yes 54 54
2 No 46 46
TOTAL 100 100

7/29/2019 Navan Ee Than
http://slidepdf.com/reader/full/navan-ee-than 60/73
CHART- 3.1.19
EMPLOYEES PARTICIPATION IN DECISION MAKING PROCESS
54
46
42
44
46
48
50
52
54
56
Yes No
OPINIONS
N O O
F
R E S P O N D E N T S

7/29/2019 Navan Ee Than
http://slidepdf.com/reader/full/navan-ee-than 61/73
TEST - 1
CHI – SQUARE ANALYSIS
RELATIONSHIP BETWEEN AGE AND SALARY
AGE Highly
satisfied
Satisfied Dissatisfied Total
Below20 10 3 3 16
20 – 30 16 14 4 34
30 – 40 8 12 6 26
40 - 50 9 3 2 14
Above50 3 6 1 10
Total 46 38 16 10
Null Hypothesis (Ho):
There is no significant relationship between age and salary.
Alternative Hypothesis (H1):
There is significant difference between age and salary.
Formula:
(O-E)^2Chi-square = -----------------
E
Where,
O = observed frequency
E = expected frequency
Expected frequency is calculated as follows
Row total x column totalExpected value = --------------------------------------------
Grand total

7/29/2019 Navan Ee Than
http://slidepdf.com/reader/full/navan-ee-than 62/73
Degree of freedom = (r-1) x (c-1)
Where,
R = Number of rows
C = Number of columns.
Degree of freedom = (r-1) x (c-1)
= (3-1) x (5-1) = 8
Calculated value 11.40Degree of freedom 8
Level of significance 5%
Table value 15.507
Result Accepted
Conclusion:
Since the calculated value is greater than the table value and hypothesis
is proved. So there is no significant difference between age and salary. All groups of
people are not satisfied regarding age and salary.
.
TEST – 2

7/29/2019 Navan Ee Than
http://slidepdf.com/reader/full/navan-ee-than 63/73
ANOVA
RELATIONSHIP BETWEEN GENDER AND PROMOTIONAL POLICY
Gender Highly satisfied Satisfied Dissatisfied Total
Male 20 20 22 62
Female 12 18 8 38
Total 32 38 30 100
Null Hypothesis (Ho):
There is no significant relationship between gender and promotional policy.
Alternative Hypothesis (H1):
There is significant difference between gender and promotional policy.
THE ANOVA TABLE
SOURCE OF
VARIATION
D.F S.S M.S.S VARIANCE
RATIO
Between
Error
2
3
17
132
9
44
0.2046
Total 5 149
The table value of F – Distribution is (2, 3) degree of freedom at 5% level
of significance is the table value showing ANOVA.

7/29/2019 Navan Ee Than
http://slidepdf.com/reader/full/navan-ee-than 64/73
Calculated value 0.2046
Degree of freedom (2,3 )
Level of significance 5%
Table value 9.55Result Accepted
Conclusion:
Since the calculated value of F is 0.2046 which is greater than the
table value of 9.55 at 5% level with degree of freedom being V1 =2 and V2 = 3 and
hence the hypothesis is proved. So there is no significant difference between gender
and promotional policy.
TEST – 3
WEIGHTED AVERAGE
3.1 DIFFICULT FACTORS SELECTING THE JOB SATIFACTION
weightedWeighted

7/29/2019 Navan Ee Than
http://slidepdf.com/reader/full/navan-ee-than 65/73
Factor average1 2 3 4 5 6 7 8 9
Salary 35 26 19 8 3 4 3 2 0 5.6
Welfare 18 14 28 10 12 10 4 3 1 7.8
bonus 8 6 6 30 15 18 10 5 2 10.4Training 2 4 13 10 12 8 8 14 5 12.1
Working
environment
6 30 12 12 8 8 14 5 5 9.3
Participation
in decision
making
4 5 3 16 20 18 28 4 2 12.1
Recognition 14 5 7 12 14 10 10 26 2 11.5
Job security 7 3 6 11 29 12 11 9 12 12.2
Opportunity
for further
growth
3 9 12 19 11 6 11 5 24 11.1
INTERPRETATION:
From the above table, it is inferred that the difficulties faced by the
respondents while selecting 1st rank to salary, 2nd rank to Working environment, 3rd rank
to Welfare, 4th rank to bonus, 5th rank to Job security, 6th rank to Training, 7th rank to
Participation in decision making, 8th rank to Recognition and 9th
rank to Opportunity for
further growth.
CHAPTER – 4
FINDINGS, SUGGESTIONS AND CONCLUSION
4.1 FINDINGS
1. It observed from the analysis that, 44% of workers belongs to the age group of 20-
30years, 26% of workers belongs to age group of 30-40years 16% of workers belongs to

7/29/2019 Navan Ee Than
http://slidepdf.com/reader/full/navan-ee-than 66/73
age group of below20years 14% of workers belongs to age group of 40-50 10% of
workers belongs to age group of above 50 respectively.
2. It identified from the analysis that, 62% of respondents are men.38% of respondents
are female in the organization.
3. It examined from the analysis that, 36% of respondents are completed there
graduates 28% of respondents Up to Higher secondary, 16% of respondents are
completed Post Graduates, 15% of respondents are completed there Diploma,5% of
respondents are others in Tirupur.
4. It clear from the analysis that, 28% of respondents having 6-9years Experience, 26%
of respondents having 2-5years experience, 26% respondents have above ten years
Experience, and 20% of respondents have below 2years experience.
5. It observed from the analysis that, 55% of respondents are labors, 30% of
respondents are staffs,15% of respondents are executives in the organization.
6. It inferred from the analysis that, 35% of respondents income below R.s 3000, 28% of
respondents income R.s 3000-5000,20% of respondents income R.s5000-10000,17% of
staffs,15% of respondents income 10000-20000 in the organization.
7. It noted from the analysis that, 46% of workers are highly satisfied with their salary
which is paid by the organization, and 38% workers are satisfied, and 16% of workers
are dissatisfied with their salary
8. It concluded from the analysis that, 58% of the respondents says that they have
highly satisfied with the bonus, 20% of respondents says that they are not satisfied with
the bonus 22% of respondents are dissatisfied with the bonus, which is paid by the
organization.
9. It observed from the analysis that, 30% of the respondents says that they have highly
satisfied with the welfare measure, 55% of respondents says that they are satisfied with
the welfare measure, 15% of respondents are some what satisfied with the welfare
measure in the organization.

7/29/2019 Navan Ee Than
http://slidepdf.com/reader/full/navan-ee-than 67/73
10. It identified from the analysis that, 68% of respondents are satisfied about their
working environment, 24% of are highly satisfied about their working environment, 8%
are some what satisfied about their working environment.
11. It examined from the analysis that, 84% of respondent’s feels that they have good
relationship with their supervisor 16% of respondents feels that they do not have good
relationship with their supervisor in the organization.
12. It clear from the analysis that, 24% of respondents says that they have highly
sayisfied,58% of respondents says that they have satisfied ,14% of respondents says
that they have dissatisfied,4% of respondents says that they have highly dissatisfied in
freedom and power to work in the organization.
13. It observed from the analysis that, 36% of respondents satisfied with their Job
security in their organization, 34% respondents are highly satisfied about their job
security, and 20% respondents are some what satisfied about their job security, 10%
respondents are dissatisfied about their job security in organization.
14. It inferred from the analysis that, 66% of respondents feel that they are happy about
present job and 34% of respondents do not feel happy about their present job in
organization.
15. It noted from the analysis that, 38% of respondents are satisfied with the promotionalpolicy of the concern, 32% of respondents are highly satisfied, and 30% respondents are
dissatisfied with the promotional policy of the concern.
16. It concluded from the analysis that, 50% of respondents said that friendly and
socializing atmosphere improves organizational culture always, 34% of respondents said

7/29/2019 Navan Ee Than
http://slidepdf.com/reader/full/navan-ee-than 68/73
not always and 16% of respondents said that the friendly and socializing atmosphere not
improves the organization culture in the organization
17. It observed from the analysis that, 42% of respondents are always ready to accept
the change in the work schedule, 30% of respondents are ready to accept the change in
their work schedule but not always, 28% of respondents are not at all accept for change
in their work schedule.
18. It identified from the analysis that, 38% of respondents are Highly Satisfied in there
training program,30% of respondents are Satisfied in there training program,32% of
respondents are some what Satisfied in there training program in the organization.
19. It determine from the analysis that, 54% of workers feel that they are allowed to take
part in managerial decision making,46% respondents feels that they are not allowed to
take part in managerial decision making.
4.2 SUGGESTIONS
Good performance always should be encouraged by the management
Manager and supervisor should maintain the performance record in order to give
sufficient feed back to the workers.

7/29/2019 Navan Ee Than
http://slidepdf.com/reader/full/navan-ee-than 69/73
A level of satisfaction should be obtained by management and it should improve
the financial and non financial factors in the organization.
Although workers are been given good payment, they should be further
motivated through their promotion.
Workers should also be included in the decision making process and their
opinion should also be taken into consideration.
To salary should be revised so that the employee may be satisfied.
Although the organization provides job security and welfare facilities it should be
further enhanced.
4.3 CONCLUSION
The project at Rhythm Fashion in Tirupur was a very good mix of the practicaland some theory knowledge.

7/29/2019 Navan Ee Than
http://slidepdf.com/reader/full/navan-ee-than 70/73
The project work that I have done on Job Satisfaction of Workers at RhythmFashion In Tirupur
It is found that there is a strong relationship between the salary
Paid and over all satisfaction of workers in the organization.
Even though there is a part of workers are not happy with their job it is found that
they are also comfortable in other aspects of their jobs like training ,, work
schedule, the promotion policies of the company.
I hope my project work would be of benefit in company to a certain extent and
also that a few of my suggestions would be help and considerable.
APPENDIX
1. Name
2. Age
a) Below 20 b) 20-30 c) 30-40 d) 40-50 e) above 50
3. Gender
a) Male b) Female

7/29/2019 Navan Ee Than
http://slidepdf.com/reader/full/navan-ee-than 71/73
4. Qualification
a) HSC b) U.G c) P.G d) Diploma e) Others
5. Experience
a) Below 2 years b) 2-5 c) 6-9 d) above 10
6. Cader
a) Labour b) staff c) executive 7. Income
a) Below 3000 b) 3000-5000 c) 5000-10000 d) 10000-20000
8. What extent is you satisfied with the salary?
a) Highly satisfied b) satisfied c) dissatisfied
9. What extent is you satisfied with the bonus?
a) Highly satisfied b) satisfied c) dissatisfied
10. What is your satisfactory level of welfare measure?
a) Highly satisfied b) satisfied c) some what satisfied d) dissatisfied
11. What is your satisfactory level with your work environment?
a) Highly satisfied b) satisfied c) some what satisfied d) dissatisfied
12. What you feel about relationship with your supervisor?
a) Yes b) no
13. What is your opinion about freedom and power to carry out your job?
a) Highly satisfied b) satisfied c) dissatisfied d) highly dissatisfied
14. What you feel about job security in your organization?
a) Highly satisfied b) satisfied c) some what satisfied d) dissatisfied
15. What is your feel of happiness with your present job?
a) Yes b) no
16. Are you satisfied with promotional policy in your concern?

7/29/2019 Navan Ee Than
http://slidepdf.com/reader/full/navan-ee-than 72/73
a) Highly satisfied b) satisfied c) dissatisfied
17. Will a friendly and socializing atmosphere improve the organizational culture?
a) Always b) Not always c) No
18. Do you accept any change in work schedule?
a) Yes b) Not always c) No
19. Are you allowed to participate in managerial decision making processes?
a) Yes b) no
20. How do you feel about the training program?
a) Highly satisfied b) satisfied c) some what satisfied d) dissatisfied
21. Rank the following factor which of support your job satisfaction(1 for most & 9 is least).
FACTOR RANK
Salary
Welfare
Bonus
training
Work environmentParticipation In decision making
recognition
Job security
Opportunity for further growth
BIBLIOGRAPHY
GUPTA , C.B., Human resource
management, New Delhi, Sultan
Chand & Sons 2004
Khanka, S.S., organizational behavior, New
Delhi, S. Chand & Company Ltd, 2000.
7/29/2019 Navan Ee Than
http://slidepdf.com/reader/full/navan-ee-than 73/73
Mamoria, C.B., Personnel Management, New
Delhi, Himalayan publishing house, 2001.
Kothari, C.R., Quantitative Techniques, New
Delhi, New age International Pvt, Ltd., Publishers 2004.
Web site:
www.google.com www.yahoo.com www.icf.gov.in


![Navan Centre & Fort, Armagh the Navan Fort] have been submitted to Ireland’s World Heritage Tentative List. As one of Ireland’s most famous and important archaeological sites,](https://img.pdfslide.net/doc/110x75/5ab3ced37f8b9a7e1d8e9cf1/navan-centre-fort-armagh-the-navan-fort-have-been-submitted-to-irelands-world.jpg)