Embed Size (px)
Citation preview
Journal of School Psychology 52 (2014) 549–565
Contents lists available at ScienceDirect
Journal of School Psychology
j ourna l homepage: www.e lsev ie r .com/ locate / j schpsyc
Navigating into, through, and beyond the middle grades: Therole of middle grades attendance in staying on track for highschool graduation☆
Michael J. Kieffer a,⁎,1, William H. Marinell b,1, Sabina Rak Neugebauer c,1
a Department of Teaching and Learning, Steinhardt School of Culture, Education, and Human Development, New York University, USAb Center for Educational Policy Research, Harvard University, USAc Department of Teaching and Learning, Loyola University Chicago, USA
a r t i c l e i n f o
☆ This work was supported by core funding from thewas provided by the Bill and Melinda Gates Foundationdesign and methodology to effective ways to visually retrack analyses. Janet Brand and Jessica Lent helped clesupport. Elise Cappella provided valuable feedback on a⁎ Corresponding author at: Department of Teaching &
NY 10003, USA.E-mail address: [email protected] (M.J. KieffeACTION EDITOR: Andrew Roach
1 Please note that each of the three authors made equ
http://dx.doi.org/10.1016/j.jsp.2014.09.0020022-4405/© 2014 Society for the Study of School Psyc
a b s t r a c t
Article history:Received 27 August 2013Received in revised form 8 September 2014Accepted 9 September 2014Available online 20 October 2014
In this longitudinal study, we investigated the use of attendance during middle school as abehavioral indicator of engagement to predict whether students are on track toward high schoolgraduation. We used administrative data from four cohorts of students in New York City schools(N = 303,845) to (a) explore patterns of change in attendance between Grades 4 and 8 and(b) determine the extent to which changes in attendance between Grades 4 and 8 predictwhich students are on track in Grade 9 for going on to graduate from high school. Results of latentgrowthmodeling indicated that students demonstrate themost substantial declines in attendanceduring Grade 8 and that attendance changes are most variable in this year, with some studentsdemonstrating much more dramatic declines than others. In addition, these changes inattendance were robust predictors of whether students were on track for high school graduation.To identify students who are at risk for not graduating for the purposes of providing appropriateinterventions, educators should pay attention to their commonly collected data on attendancerates as a behavioral indicator of engagement.© 2014 Society for the Study of School Psychology. Published by Elsevier Ltd. All rights reserved.
Keywords:AdolescenceGraduationEngagementMiddle school
1. Introduction
Studies of the predictors of high school graduation have generally focused on the high school years, with less research dedicated toinvestigating earlier indicators in middle school (Allensworth & Easton, 2005; Balfanz, Herzog, & Mac Iver, 2007; Kennelly &Monrad,2007). Similarly, interventions have typically centered on high school. In themost recentWhatWorks Clearinghouse (WWC) practiceguide on dropout prevention (Dynarski et al., 2008), only 1 of the 11 programswas aimed atmiddle school students. Since then, someadditional programs aimed at middle school students have been reviewed by WWC, but none demonstrated significant effects ondropout and met WWC evidence standards. Despite this focus on the high school years, researchers conceptualize dropping out
Research Alliance for New York City Schools (RANYCS) at New York University; RANYCS' core funding, in turn,and Robertson Foundation. James Kemple offered critical input about all facets of the project—from the study'spresent of our key findings. Nicky Stephenson made substantial analytical contributions, particularly to the on-an and prepare the NYC data for analysis, and Jonathan Winters and Walter Bourne provided technologicaln earlier draft of this manuscript.Learning, Steinhardt School of Culture, Education, and Human Development, New York University, New York,
r).
al contributions to this article and thus the order of authorship was assigned on the basis of alphabetical order.
hology. Published by Elsevier Ltd. All rights reserved.

550 M.J. Kieffer et al. / Journal of School Psychology 52 (2014) 549–565
from high school as part of a long-term process of disengagement from school, with negative developmental pathways that beginbefore Grade 9 (e.g., Reschly & Christenson, 2012). Although only a few empirical studies have tested this notion, their findingsdemonstrate the predictive power of earlier indicators and their utility for intervening early (Balfanz & Boccanfuso, 2007; Balfanzet al., 2007).
Middle school is an important transitional period for students, marked by increasing curricular demands (Shanahan & Shanahan,2008) as well as important changes in the organization and social structure of schools, including larger class sizes and multipleteachers (Eccles et al., 1993). These changes have been associated with declines in motivation and engagement (Finn, 1989;Simmons & Blyth, 1987) that can interact with growing academic demands to create a cycle of increasing under-performance(Wilhelm, 1995). These environmental changes make middle school a time of heightened risk for student disengagement and thusa particularly important period for studying early indicators that predict the likelihood of later dropout. Yet, middle school reformsthat intended to keep students on track have largely focused on curricular and pedagogical changes to increase students' academicperformance, and far less attention has been dedicated to indicators of school engagement and their potential contribution topreventing dropout (Goldsmith & Kantrov, 2001; Jackson & Davis, 2000; Juvonen, Le, Kaganoff, Augustine, & Constant, 2004).
To address the antecedents of high school dropout during the middle school years and go beyond solely academic indicators, thepresent study investigates the role of an indicator of behavioral engagement—attendance—during the middle school years inpredicting whether students stay on track toward high school graduation. Specifically, we use longitudinal, administrative datafromNew York City to explore students' growth trajectories in attendance between Grade 4 and Grade 8 and to determine the extentto which changes in attendance across these grades predict whether students are on track for on-time high school graduation. In sodoing, we aim to shed light on the value of monitoring attendance as an early indicator for determiningwhich students are falling offtrack for graduation. Our ultimate purpose is to inform systems to identify specific students for intervention at a point early enough intheir schooling to be effective.
1.1. Engagement and behavioral indicators
School engagement has received increasing attention among researchers studying high school dropout (Christenson, Reschly, &Wylie, 2012; Fredericks, Blumenfeld, & Paris, 2004). Engagement is conceptualized as a multidimensional construct (Frederickset al., 2004). However, there is great variability in how the different dimensions of engagement are operationalized in the literatureand the terminology used to describe them (Appleton, Christenson, & Furlong, 2008; Reschly & Christenson, 2012). This disagreementlies predominantly in the number and types of engagement dimensions or components that are included in this broader construct(Appleton et al., 2008). Some research posits a model of engagement that includes two components—a behavioral componentand an affective component (Finn, 1989; Marks, 2000; Newmann, Wehlage, & Lamborn, 1992). Examples of behavioral indicatorsinclude attendance, on-task behavior, and number of suspensions, where as examples of affective indicators (also termed emotionalindicators) include positive or negative attitudes as well as in interest in certain activities. More recent research argues for an engage-ment model that includes cognitive indicators, a three-component model where cognitive indicators include self-monitoringstrategies and the willingness to persist in problem solving in the face of difficult academic activities (e.g., Fredericks et al., 2004).Others have proposed a model that includes four components, adding an academic dimension, and using the term psychologicalengagement to describe aspects of engagementmost closely aligned with the affective component offered in previous conceptualiza-tions (Reschly & Christenson, 2012). Despite disagreements about the components to be included in the conceptualization ofengagement, behavioral engagement is the component most consistently included (Appleton et al., 2008).
The present investigation focuses on behavioral engagement and more specifically, student attendance, as an important indicatorin middle school. Our focus on behavioral engagement reflects the agreement across studies of the centrality of behavioral engage-ment to the larger construct of engagement as well as prior research that shows that behaviors such as attendance, grade pointaverages, and misbehaviors are good predictors of dropping out (Barrington & Hendricks, 1989; Morris, Ehren, & Lenz, 1991; Suh,Suh, & Houston, 2007). Our particular focus on one specific indicator—namely attendance—also reflects the call by educators andschool counselors for practical methods that can serve to flag students for early intervention and that can be managed easily withinschools existing data systems (Balfanz et al., 2007; Suh et al., 2007). Attendance can be a practically useful indicator, because it isobservable and less inferential compared to cognitive and affective indicators, and it is also efficient to collect and analyze withexisting school-based resources and personnel (Furlong & Christenson, 2008).
Finn's (1989) participation-identification model provides a way to understand the relation between attendance and dropout.Finn's seminal theory posits that students tend to enter school with a relatively positive approach to school, willing participants asa function of parent and teacher encouragement. With students' sustained participation in school activities and accompanyingacademic successes, students begin to identify with school. This identification with school establishes a sense of scholastic belongingthat boosts and propels future active engagement, such that small frustrations have little impact on this cycle of continued activeparticipation in school. However, this self-reinforcing process can also have the opposite effect whereby early disengagementcontributes to negative long-term consequences, such as dropout.
Specifically, levels of disengagement that predict dropout occur when there is an interaction among various cognitive, behavioral,and affective factors. Students disengage from school through behaviors (such as avoiding class or stayinghome from school), throughcognitive activities (such as not applying themselves to or focusing on academic tasks), and through affective orientations andattitudes (such as ceasing to value or identify with school). Any one of these in isolation may not necessarily lead to dropout, butinstead, it is the interplay among these factors that likely contributes to the success or failure of students' in school (Finn &Zimmer, 2012; Janosz, 2012; Reschly & Christenson, 2012; Voelkl, 2012). For instance, behaviors that keep students out of class

551M.J. Kieffer et al. / Journal of School Psychology 52 (2014) 549–565
may leave them behind academically, thereby promoting cognitive disengagement. Such behaviors may also make students lesssocially and emotionally connected to their teachers and peers, thereby promoting affective disengagement. Similarly, this self-reinforcing process can also occur when students have substantial academic challenges or negative experiences in school thatinfluence their decisions to behave in ways that keep them out of class.
Particularly relevant for the application of this model to the present study, is that, in the elementary grades attendance is obliga-tory, so young childrenhave little agency. However, as students gain increasing autonomy, as is the case inmiddle school, students canchoose and execute their preference tomiss school (Finn& Cox, 1992). Thus, this periodmarks a timewhen students can act upon thisself-reinforcing cycle whereby they attend less school, increase the likelihood that they fall behind academically due to missed classtime, further disengage from school, and ultimately dropout (Lloyd, 1978; Reschly &Christenson, 2012;Wehlage, Rutter, Smith, Lesko,& Fernandez, 1989).
The ultimate purpose of identifying early indicators of engagement that predict dropout is to facilitate the delivery of interventionsto students who need them. We follow Christenson, Sinclair, Lehr, and Godber (2001) and others in conceptualizing dropout as anevent that is the culmination of multiple events and experiences, not as a sudden decision. Given this cumulative conceptualization,early behavioral indicators such as attendance in Grades 4 to 8—if they are sufficiently predictive of later success—may provide anopportunity to intervene before students have completely disconnected from school.
1.2. Grade 9 antecedents
A substantial body of scholarship has hailed Grade 9, specifically, as a pivotal turning point for determining the likelihood ofdropout (Allensworth & Easton, 2007; Neild & Balfanz, 2006). For instance, longitudinal data on first-time ninth graders in 2000from 20,803 Chicago public schools demonstrated that course failure and attendance in Grade 9were highly predictive of high schoolgraduation, controlling for Grade 8 performance (Allensworth & Easton, 2007). Moreover, attendance predicted course failure muchbetter than prior achievement, with ninth-grade attendance being eight times as predictive of course failure as Grade 8 achievement.
Longitudinal research conducted from 2000–2005 by Neild and Balfanz (2006) in Philadelphia using the Kids Integrated DataSystem, which includes data drawn from the city's social service agencies as well as the School District of Philadelphia, foundthat the probability of dropout was largest in Grade 9, with 45% of the ninth graders in their study dropping out of school, and thelikelihood of dropout decreasing as students moved through the high school grades. It is worth noting that this pattern varies some-what by state, with Grade 10, 11, or 12 as themost likely time for dropout in some states, as indicated by analyses of national datasets(e.g., Landis & Reschly, 2011), and a non-trivial number of students drop out in the middle school years (e.g., Roderick, 1993;Rumberger, 1995). Consistent with previous studies (Rumberger, 1995), Neild and Balfanz also demonstrated that multiple factorsinfluenced the likelihood of dropout, including lower grade point averages, poor attendance, academic course failure, being overagefor grade, and being a male.
The research base on the importance of students' performance in Grade 9 in predicting the likelihood of their graduating afterfour years of high school prompted the development of “on-track indicators” that identify vulnerable students. Researchers at theConsortium on Chicago School Research (CCSR) used multiple variables in Grade 9 to create an on-track indicator for identifyingstudents on track toward graduation; specifically, the researchers used data from course failure in core courses, number of creditscompleted, overall GPA, and attendance to summarize students' likelihood of graduation with a single variable (Allensworth &Easton, 2007). It is worth noting that “indicator” is used by these researchers in the sense of an imperfect predictor of a later outcome(i.e., graduation), rather than in the sense of an observed indicator of a latent construct as used in latent variablemodels. This on-trackindicator has been adopted by school districts in Chicago to informa variety of decisions. It also informed the adoption of a simpler on-track indicator (that included only credits earned) by New York City Department of Education (DOE; see Kemple, Segeritz, &Stephenson, 2013). In light of the predictive power of this Grade 9 indicator to predict dropout, we include in the present study,our own high school on-track indicator (i.e., a composite of six student performance measures in Grade 9) to capture the likelihoodthat students will graduate on time and to use as the outcome when investigating the contribution of middle school indicators tostudents getting off track. In particular, we use this indicator rather than high school graduation as an outcome to incorporate datafrom our most recent cohorts who have not yet had the opportunity to graduate from high school.
1.3. Early behavioral indicators
These same indicators of behavioral engagement, when they are measured prior to students' starting high school, have also beenfound to be highly predictive of dropout, in a few long-term longitudinal studies. For example, Balfanz and Boccanfuso (2007)exploredmultiple factors to explain dropout in Grades 7, 8, and 9 and found that behavioral indicators (i.e., attendance and academiccourse performance) in Grade 6 were stronger predictors of dropout than Grade 9 behavioral indicators. Furthermore, results from astudy by Roderick (1993) found that indicators measured as early as Grade 4 can be predictive of dropout. Roderick identified twotypes of dropouts: those that dropped out in Grades 7, 8, and 9 (i.e., early dropouts) and those that dropped out in Grades 10 to 12(i.e., late dropouts). These groups demonstrated distinct academic and behavioral pathways on the way to dropout. Early dropouts—representing only 35% of dropouts in her sample—were those who even in Grade 4 demonstrated significantly lower grades thantheir peers who would graduate and who would go on to be late dropouts. These same students not only began lower than theirpeers but also continued to decline academically (with a 30% decline after Grade 4). For late dropouts, their academic performancein Grade 4 was not significantly different than that of their peers who went on to graduate. However, late dropouts' attendancebegan to decline significantly in Grade 6 and again in the transition to high school from Grade 8 to Grade 9. Accompanying academic
552 M.J. Kieffer et al. / Journal of School Psychology 52 (2014) 549–565
grade declines during themiddle school transitionwere almost three times as large as their graduating peers, whereas the high schooltransition for late dropouts was associated with a decline more than four times that of graduates. The results of this study, combinedwith those of Balfanz and Boccanfuso (2007), support the importance of measuring behavioral and academic indicators as early asGrade 4. They also support examining how students' behavioral indicators change over the course of middle school and how thesestudents persist or fall behind during transitional grades (Roderick & Camburn, 1999).
Further evidence ofmiddle school antecedents of dropout is supported by research conducted by Balfanz et al. (2007)who follow-ed 12,972 students in the Philadelphia school district for eight years. They found that demonstrating any one of several risk factors inGrade 6 (i.e., low attendance, a failing classroombehavior grade, a failing grade inmathematics, and a failing grade in English) resultedin only a 10% chance of graduating on time and a 20% chance for graduating a year late. Examining these factors in sixth grade alonewas able to identify 60% of the students who would not go on to graduate.
A few studies conducted with elementary school students also support the potential importance of engagement indicators forpredicting later dropout (Alexander, Entwisle, & Horsey, 1997; Barrington & Hendricks, 1989; Ensmingr & Slusarcick, 1992).Barrington and Hendricks (1989) determined that graduates could be distinguished from students who dropped out (with 66%accuracy as early as 3rd grade) solely based on student absences. They also found that these absences increased as students movedinto the upper grades, with seventh graders who eventually dropped out averaging 2.6 times more absences than their graduatingpeers. In a studywith students as young asfirst grade, Alexander et al. (1997) followed students for 14 years. Using logistic regressionto predict dropout, these researchers found that academic differences alone did not explain dropout. In addition, attendance signifi-cantly predicted dropout, after accounting for students' family context, background characteristics, personal resources, and schoolexperiences. Most relevant to the present investigation, Alexander and colleagues noted “the present analysis affords a glimpse ofthe beginning and end points of a long-term process of academic disengagement, but the intermediate stages remain to be filledin” (p. 102) The present study aims to “fill in” these pivotal intermediate stages that may provide potential insight for targetedintervention.
Despite the evidence provided by these well-designed studies, several questions remain about how students navigate into andthrough themiddle grades and how their struggles or success in navigating these developmental stages predict their later outcomes.Most notably, although prior studies were longitudinal, they typically examined declines based on year-to-year comparisons andinvestigated predictive relations comparing a single year's performance to later graduation (or investigated multiple years, butevaluated each as a separate predictor). In the current study, we used latent growthmodeling to explicitly describe students' growthtrajectories between Grade 4 and Grade 8, providing new insights into the changes in attendance across several developmentalperiods between these grades. We also used students' rates of growth (or rates of decline) in attendance, rather than a single year'slevels or year-to-year changes, as a predictor, which allowed us to investigate the extent to which changes in attendance over timepredict which students are on track for graduation more directly.
1.4. Current study
The current study was conducted in the context of a broader research project undertaken in collaboration with the ResearchAlliance for New York City Schools at New York University (for reports from the broader project, see Kemple et al., 2013; Kieffer &Marinell, 2012). The Research Alliance aims to provide evidence from rigorous studies to inform decisions about policies and practicesthat promote New York City students' development and academic success (see http:steinhardt.nyu.edu/research_alliance for moreinformation). The current study explores whether and when students struggle during the transitions into, through, and out of themiddle grades and how early in their schooling students who are vulnerable to falling off track can be identified. Using administrativedata from New York City schools, we investigated attendance as a behavioral indicator of engagement that is easily accessible toeducators. We began by exploring whether and how students' attendance changes between fourth and eighth grades to identifymoments during this period when students' attendance declines suggest that they may be becoming disengaged from school. Wethen investigated whether patterns of change in attendance between these grades predicted whether students were on track forhigh school graduation while controlling for their academic achievement and fourth-grade levels of attendance.
In pursuing this work, we aimed not only to contribute to the research literature in this area but also to demonstrate a practicalapproach to using administrative data to support educators' decision-making that is informed by the models for conductingpractice-relevant research originated by CCSR (e.g., Roderick, Easton, & Sebring, 2009) and the Strategic Educational Research Partner-ship (Donovan,Wigdor, & Snow, 2003). Given this, our approachwas informed not only by the research literature andmethodologicalconcerns but also by the pressing problems facing New York City educators. Most specifically, we aimed to conduct work that wouldbe relevant to educators' current challenges in improving middle-grades education and ultimate graduation rates. Education in NewYork City during the first decade of the 21st century was characterized bymajor policy shifts associated with the unique combinationof the 2003 implementation of No Child Left Behind (NCLB) and the 2003 implementation of Children First reforms under MayorMichael Bloomberg and School Chancellor Joel Klein (e.g., O'Day, Bitter, & Gomez, 2011). So, we were particularly concerned withcapturing trends that were stable throughout and after these changes and that would be relevant to educators in the post-NCLBand post-Children First period.
Our development of a Grade 9 on-track indicator (following thework of CCSR) and our decision to use this indicator as a proxy forstudents' likelihood of going on to graduate allowed us to incorporate data for cohorts of students who were enrolled in the middlegrades after the implementation of these policy changes. At the same time, we developed the Grade 9 on-track indicator using themost recent cohort data available (i.e., for students who were in Grades 9–12 after these policy shifts), so that it was based on themost relevant high school trends and graduation data. Thesemore recent graduation data, in particular, are likely to bemore accurate
553M.J. Kieffer et al. / Journal of School Psychology 52 (2014) 549–565
than earlier data, given changes in reporting requirements for dropout and on-time graduation data required by No Child Left Behind,which researchers have noted changed these data considerably (Institute of Educational Sciences, 2007).We hope that this approachcan also serve as a model for districts to conduct similar analyses without requiring seven years of longitudinal data (i.e., spanningGrades 6 to 12) or producing results that may be only relevant to students who enrolled in Grade 6 seven or more years prior tothe conduct of the research. As we describe in the sections that follow, this approach, compared to amore straight-forward predictionof observed graduation, imposes more methodological assumptions. However, we consider these disadvantages reasonable in theinterest of maximizing the relevance of the findings and the usability of the approach for data-based decision-making.
We addressed the following research questions:
1. What are common patterns of change in attendance between Grade 4 and Grade 8 for students in a large urban district?2. Towhat extent does change in attendance between Grade 4 and Grade 8 predict students' Grade 9 on-track indicator score (i.e., an
indicator of their probability of going on to graduate on time from high school), after controlling for levels and change in readingand mathematics achievement and Grade 4 levels of attendance?
2. Method
2.1. Participants
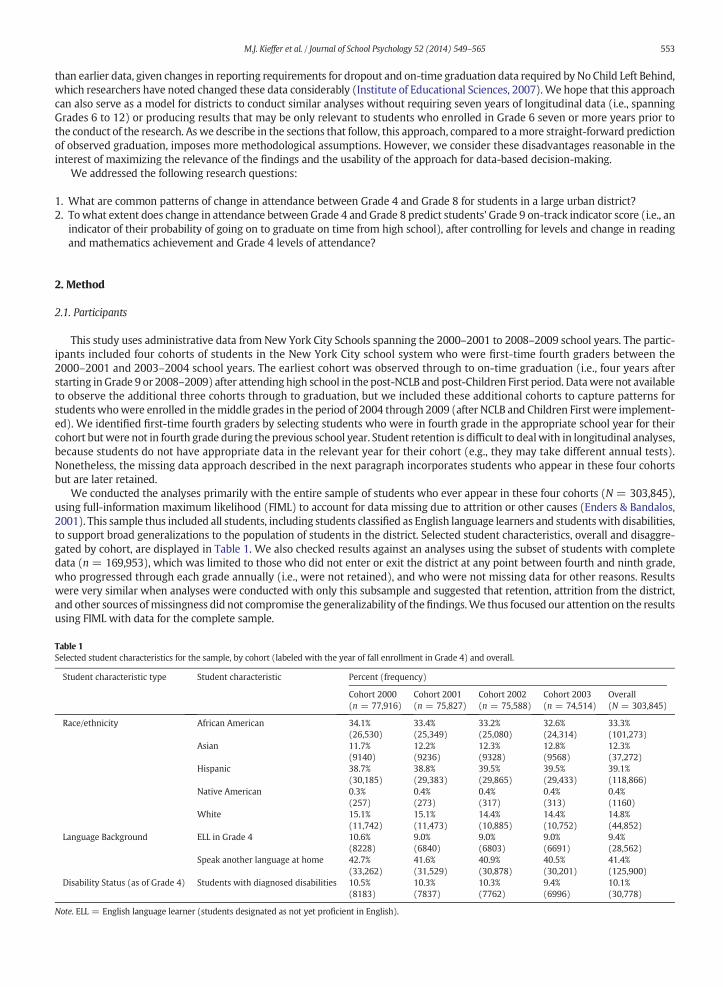
This study uses administrative data from New York City Schools spanning the 2000–2001 to 2008–2009 school years. The partic-ipants included four cohorts of students in the New York City school system who were first-time fourth graders between the2000–2001 and 2003–2004 school years. The earliest cohort was observed through to on-time graduation (i.e., four years afterstarting in Grade 9 or 2008–2009) after attending high school in the post-NCLB and post-Children First period. Datawere not availableto observe the additional three cohorts through to graduation, but we included these additional cohorts to capture patterns forstudents whowere enrolled in themiddle grades in the period of 2004 through 2009 (after NCLB and Children First were implement-ed). We identified first-time fourth graders by selecting students who were in fourth grade in the appropriate school year for theircohort butwere not in fourth grade during the previous school year. Student retention is difficult to dealwith in longitudinal analyses,because students do not have appropriate data in the relevant year for their cohort (e.g., they may take different annual tests).Nonetheless, the missing data approach described in the next paragraph incorporates students who appear in these four cohortsbut are later retained.
We conducted the analyses primarily with the entire sample of students who ever appear in these four cohorts (N = 303,845),using full-information maximum likelihood (FIML) to account for data missing due to attrition or other causes (Enders & Bandalos,2001). This sample thus included all students, including students classified as English language learners and students with disabilities,to support broad generalizations to the population of students in the district. Selected student characteristics, overall and disaggre-gated by cohort, are displayed in Table 1. We also checked results against an analyses using the subset of students with completedata (n = 169,953), which was limited to those who did not enter or exit the district at any point between fourth and ninth grade,who progressed through each grade annually (i.e., were not retained), and who were not missing data for other reasons. Resultswere very similar when analyses were conducted with only this subsample and suggested that retention, attrition from the district,and other sources ofmissingness did not compromise the generalizability of thefindings.We thus focused our attention on the resultsusing FIML with data for the complete sample.
Table 1Selected student characteristics for the sample, by cohort (labeled with the year of fall enrollment in Grade 4) and overall.
Student characteristic type Student characteristic Percent (frequency)
Cohort 2000(n = 77,916)
Cohort 2001(n = 75,827)
Cohort 2002(n = 75,588)
Cohort 2003(n = 74,514)
Overall(N = 303,845)
Race/ethnicity African American 34.1% 33.4% 33.2% 32.6% 33.3%(26,530) (25,349) (25,080) (24,314) (101,273)
Asian 11.7% 12.2% 12.3% 12.8% 12.3%(9140) (9236) (9328) (9568) (37,272)
Hispanic 38.7% 38.8% 39.5% 39.5% 39.1%(30,185) (29,383) (29,865) (29,433) (118,866)
Native American 0.3% 0.4% 0.4% 0.4% 0.4%(257) (273) (317) (313) (1160)
White 15.1% 15.1% 14.4% 14.4% 14.8%(11,742) (11,473) (10,885) (10,752) (44,852)
Language Background ELL in Grade 4 10.6% 9.0% 9.0% 9.0% 9.4%(8228) (6840) (6803) (6691) (28,562)
Speak another language at home 42.7% 41.6% 40.9% 40.5% 41.4%(33,262) (31,529) (30,878) (30,201) (125,900)
Disability Status (as of Grade 4) Students with diagnosed disabilities 10.5% 10.3% 10.3% 9.4% 10.1%(8183) (7837) (7762) (6996) (30,778)
Note. ELL = English language learner (students designated as not yet proficient in English).

554 M.J. Kieffer et al. / Journal of School Psychology 52 (2014) 549–565
2.2. Measures
2.2.1. Outcome: Grade 9 on-track indicatorDrawing on other research with New York City data reported in Kemple et al. (2013), we created a continuous on-track indicator
for students in all four cohorts based on their scores on six Grade 9 measures: credits earned, courses failed, grade point average,annual attendance rate, whether a NewYork State Regents test was attempted andwhether a NewYork State Regents testwas passed(see details on each of thesemeasures in the following paragraphs). To create this single indicator, students' scores on thesemultiplevariables were weighted by their relative strength in predicting high school graduation; these weights were estimated using datafrom the oneof the four cohorts (i.e., the studentswhoenrolled in fourth grade in 2000–2001, n= 77,916) thatwas observed throughtheir expected year of graduation (2008–2009), and theseweightswere then applied to Grade 9 data for students fromall four cohortsto estimate their on-track indicator score (see details on weighting in the Preliminary results section that follows). Although thisindicator was developed based on the approach taken by CCSR, we used indicator scores on a continuous scale (the log-odds of theestimated probability of graduating on time) in our analyses, rather than the Consortium's approach of dichotomizing this scoreinto “on-track” and “off-track” categories. Although the Consortium's dichotomous approach has the advantage of being easy to inter-pret by educators and policy-makers, using a continuous variable has the advantage of preservingmore information about variabilityin students' probability of being on track for graduation. It is worth noting that, given this use of on-time high school graduationcombined with our approach to missing data described in the preceding section, these analyses capture the probability of students'graduating vs. dropping out (regardless of the grade atwhich students dropped out). For details on the development of this indicator,evidence of its validity, and the assumptions underlying its use, see the Preliminary results section. In the following paragraphs, wedescribe each of the variables used to develop the Grade 9 on-track indicator with data from the cohort observed through to highschool graduation.
2.2.2. High school graduationConsistent with Kemple et al. (2013), on-time high school graduation was a dichotomous variable indicating whether or not
students received a Regents diploma or Regents diplomawith advanced standing after four years of startingGrade 9. This informationwas recorded by school officials in October, 2009, after the spring of expected graduation. It is alsoworth noting that a third credentialwith less stringent requirements, referred to as a local diploma, was also available for the cohort of interest, but has since begunphased out in New York City and across New York State. Due to heightened public scrutiny of high school graduation rates in NewYork City and across the country (e.g., Dillon, 2008), this variable was thoroughly audited for reliability by the New York City DOE.
2.2.3. Credits earned and courses failed in Grade 9Two variables were used to capture information about the course students passed and failed in Grade 9, drawn from electronic
school transcript records. The first variable, credits earned, was a continuous variable representing the total number of credits earnedfrom courses taken and passed over the course of the year. Forty-four credits are required for graduating with a Regents diploma, sostudents would be expected to earn at least eleven credits during Grade 9. The second variable, course failed, was a continuousvariable representing the number of courses in which students enrolled and received a failing grade. Because students had someflexibility in the number of courses taken during Grade 9, these two variables did not provide entirely redundant information. Prioranalyses with New York City data using information on course taken supports the reliability and validity of this information inpredicting high school graduation, across multiple cohorts and student subgroups (Kemple et al., 2013).
2.2.4. Grade point average in Grade 9A continuous variable for grade point averagewas calculated using grades for all courses taken during the ninth-grade year, drawn
from electronic school transcript records. This was created using a standard method in which the mean was estimates across thenumeric value for each course grade, with the resulting scale ranging from 0 to 100. Prior studies support the reliability of gradepoint averages as indicators of school achievement and engagement aswell as the validity of this variable as a predictor of high schoolgraduation (e.g., Allensworth & Easton, 2007; Neild & Balfanz, 2006).
2.2.5. Annual attendance rate in Grade 9Annual attendance ratewasmeasured as continuous variable representing the percentage of the days enrolled (i.e., the percent of
days that a studentwas present, relative to the number of days enrolled) across the fall and spring semesters of their ninth-grade year,drawn from electronic school attendance records. Because school attendance is required by law for students up to sixteen years of age,and because these data are used for a variety of accountability purposes, they were carefully audited by the New York City DOE toensure their reliability. Prior studies support the validity of Grade 9 attendance as an indicator of behavioral engagement (see precedingliterature review).
2.2.6. New York Regents tests in Grade 9We used two variables related to the New York State Regents tests, a series of examinations in five subject areas (English, Math,
Science, U.S. History, andGlobal History) that are required to be taken at some point during high school, drawn from electronic schooltest score files. In the years studied (i.e., prior to the implementation of Common Core assessments in NewYork State), students wererequired to take and receive a passing score on these tests in all five areas to receive a Regents diploma, while a Regents diplomawithadvanced standing requires passing these exams as well as exams in two additional subject areas. Students had flexibility regarding

555M.J. Kieffer et al. / Journal of School Psychology 52 (2014) 549–565
when to take these exams during their high school years, so choosing to take one or more regents in Grade 9 suggests that studentswere making early progress toward completing this graduation requirement. Our first measure was a dichotomous variable forwhether or not students attempted one or more Regents test in any subject during Grade 9. Our secondmeasure was a dichotomousvariable forwhether or not students passed one ormore Regents test in any subject duringGrade 9; studentswhodid not attempt oneormore Regents test and thus did not have the opportunity to pass a Regents test received a 0 value for this variable. Technical reportsfrom the New York State Regents exam for the relevant year (2005–2006) are no longer publically available online, so evidenceregarding the reliability and validity of continuous scores on these exams is not available. Nonetheless, prior analyses withNew York City data using dichotomous variables such as these as indicators of remaining on track support their validity in predictinghigh school graduation, across multiple cohorts and student subgroups (Kemple et al., 2013).
2.2.7. Question predictor: attendance in Grades 4–8For each cohort, attendance variableswere created for each semester (fall and spring) yielding two attendance rate values for each
year (across five years, grades fourth through eighth). Attendance wasmeasured as a continuous variable representing the percent ofthe days enrolled (i.e., the percent of days that a student was present, relative to the number of days enrolled), drawn from electronicschool records. Thus, students who were enrolled for only part of a given semester contributed a value for that time point, whereasstudents not enrolled in a given semester did not contribute a value for that time point. The data available did not allow us todistinguish between excused and unexcused absences or between days on which students attended, but were tardy, and days onwhich students arrived on time. AswithGrade 9 attendance, these datawere carefully audited by theNewYork CityDOE for reliabilityand have validity evidence as indicators of behavioral engagement (see preceding literature review).
2.2.8. Control variable: achievement in Grades 4–8Achievement in mathematics and English language arts was assessed using the New York State tests. Tests were taken annually,
yielding one score per year. The New York State tests were developed to assess students' performance on the New York Statestandards through a contract with CTB/McGraw-Hill, which provided technical reports for each year involved in the current study(available at http://www.p12.nysed.gov/assessment/reports/). These technical reports indicate adequate internal consistencyreliability (range = .83–.90 for English language arts and range = .89–.95 for mathematics, across grade levels and cohorts) andreport several types of validity evidence, including content-based evidence, evidence of unidimensionality, and minimization ofbias through procedures including evaluation of differential item functioning by race/ethnicity, gender, and socioeconomicstatus. Scores are typically reported as three-digit continuous scaled scores and as ordinal proficiency levels (i.e., excelling, proficient,partially proficient, well below proficient).
One challenge with using these extant test scores is that the scales for these tests changed over the years of administration, andefforts were not made to use vertical linking methods to account for these scaling changes, so the resulting scaled scores are noton a comparable scale across grades. Given this challenge, we rescaled participants' scores to produce within-grade, within-year z-scores, based on the district means and standard deviations. This approach is not ideal for growth modeling because it subtractsout the normative trajectory for growth and assumes homogeneity of variance across time. However, given the limitations of thescaling of the test scores, it is more appropriate than using the original scaled scores. It also has benefits over using proficiency levels,in that it preserves the continuous nature of achievement, as opposed to arbitrarily dividing the distribution into discrete categories.Nonetheless, we treated growth in achievement as a control variable, rather than a variable of interest, and we thus refrainedfrom interpreting these growth rates directly or drawing substantive conclusions from them. Because English language arts andmathematics scores were highly correlated (r's = .71 to .90 across grades), we created a composite for achievement at each gradeby averaging the z-scores for that grade.
2.3. Procedure
The New York City DOE collects attendance information from schools twice a year and collects state achievement and Regents testinformation from theNewYork State Department of Education annually. The NewYork City DOE's Research and Policy Support Groupthen provided the data to the Research Alliance for New York City Schools in multiple administrative datasets in comma-separatedvalues formatted files. A Memorandum of Understanding between the Research Alliance and New York City DOE provides guidelinesfor data access to ensure confidentiality standards. Since its founding in 2008, the Research Alliance has had a datamanagement team,which included a DataManagerwho had previously worked for many years on theNewYork City DOE's datamanagement team. Thisteam developed extensive protocols for maintaining data quality and security, including extensive data cleaning, organizing, andauditing, as well as efforts to resolve data irregularities with key contact in the NYC DOE. Student identifying information is storedin a specified level of a secure server, which can only be accessed by the Research Alliance DataManager for the purposes of matchingincoming student records to new identification codes created by the Research Alliance. In a separate secure level on the server, theselatter codes are then used to integrate information across different data files as well as data files from different years, using SAS. Thefinal dataset used by the research teamwas stripped of all identifiers, and each member of the research teamwith access to the datasigned a non-disclosure agreement, which had been approved by the New York City DOE as part of the Memorandum ofUnderstanding.
556 M.J. Kieffer et al. / Journal of School Psychology 52 (2014) 549–565
3. Results
3.1. Preliminary results
3.1.1. Development of the Grade 9 on-track indicatorAs described in the Measures section above, we developed a single Grade 9 on-track indicator to capture information about the
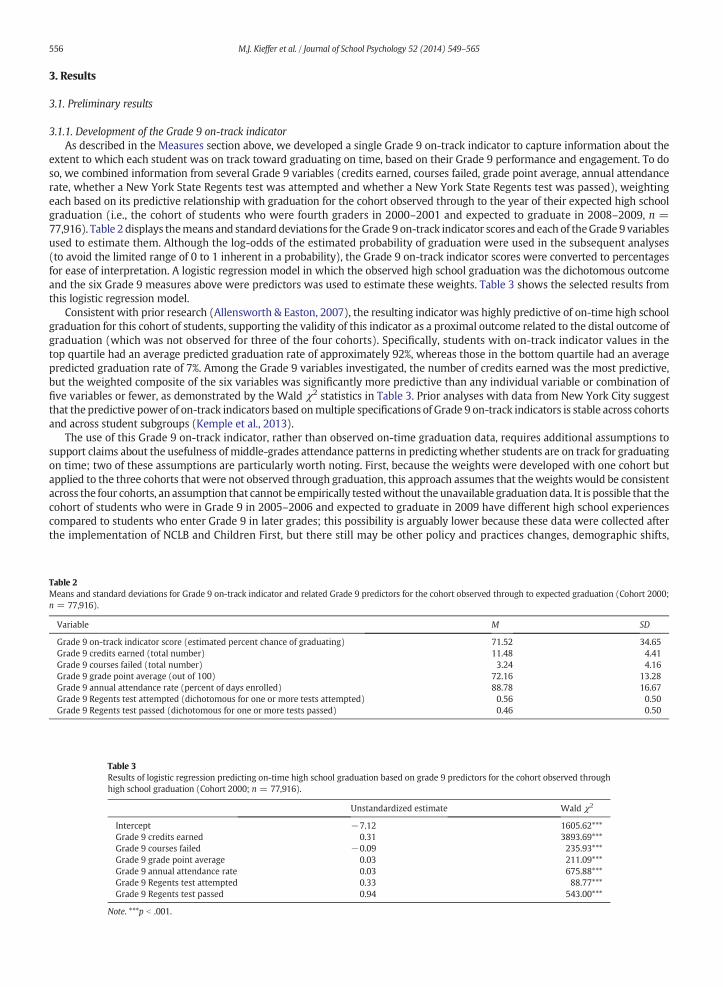
extent to which each student was on track toward graduating on time, based on their Grade 9 performance and engagement. To doso, we combined information from several Grade 9 variables (credits earned, courses failed, grade point average, annual attendancerate, whether a New York State Regents test was attempted and whether a New York State Regents test was passed), weightingeach based on its predictive relationship with graduation for the cohort observed through to the year of their expected high schoolgraduation (i.e., the cohort of students who were fourth graders in 2000–2001 and expected to graduate in 2008–2009, n =77,916). Table 2 displays themeans and standard deviations for theGrade 9 on-track indicator scores and each of theGrade 9 variablesused to estimate them. Although the log-odds of the estimated probability of graduation were used in the subsequent analyses(to avoid the limited range of 0 to 1 inherent in a probability), the Grade 9 on-track indicator scores were converted to percentagesfor ease of interpretation. A logistic regression model in which the observed high school graduation was the dichotomous outcomeand the six Grade 9 measures above were predictors was used to estimate these weights. Table 3 shows the selected results fromthis logistic regression model.
Consistent with prior research (Allensworth & Easton, 2007), the resulting indicator was highly predictive of on-time high schoolgraduation for this cohort of students, supporting the validity of this indicator as a proximal outcome related to the distal outcome ofgraduation (which was not observed for three of the four cohorts). Specifically, students with on-track indicator values in thetop quartile had an average predicted graduation rate of approximately 92%, whereas those in the bottom quartile had an averagepredicted graduation rate of 7%. Among the Grade 9 variables investigated, the number of credits earned was the most predictive,but the weighted composite of the six variables was significantly more predictive than any individual variable or combination offive variables or fewer, as demonstrated by the Wald χ2 statistics in Table 3. Prior analyses with data from New York City suggestthat the predictive power of on-track indicators based onmultiple specifications of Grade 9 on-track indicators is stable across cohortsand across student subgroups (Kemple et al., 2013).
The use of this Grade 9 on-track indicator, rather than observed on-time graduation data, requires additional assumptions tosupport claims about the usefulness of middle-grades attendance patterns in predictingwhether students are on track for graduatingon time; two of these assumptions are particularly worth noting. First, because the weights were developed with one cohort butapplied to the three cohorts that were not observed through graduation, this approach assumes that theweights would be consistentacross the four cohorts, an assumption that cannot be empirically testedwithout the unavailable graduation data. It is possible that thecohort of students who were in Grade 9 in 2005–2006 and expected to graduate in 2009 have different high school experiencescompared to students who enter Grade 9 in later grades; this possibility is arguably lower because these data were collected afterthe implementation of NCLB and Children First, but there still may be other policy and practices changes, demographic shifts,
Table 2Means and standard deviations for Grade 9 on-track indicator and related Grade 9 predictors for the cohort observed through to expected graduation (Cohort 2000;n = 77,916).
Variable M SD
Grade 9 on-track indicator score (estimated percent chance of graduating) 71.52 34.65Grade 9 credits earned (total number) 11.48 4.41Grade 9 courses failed (total number) 3.24 4.16Grade 9 grade point average (out of 100) 72.16 13.28Grade 9 annual attendance rate (percent of days enrolled) 88.78 16.67Grade 9 Regents test attempted (dichotomous for one or more tests attempted) 0.56 0.50Grade 9 Regents test passed (dichotomous for one or more tests passed) 0.46 0.50
Table 3Results of logistic regression predicting on-time high school graduation based on grade 9 predictors for the cohort observed throughhigh school graduation (Cohort 2000; n = 77,916).
Unstandardized estimate Wald χ2
Intercept −7.12 1605.62***Grade 9 credits earned 0.31 3893.69***Grade 9 courses failed −0.09 235.93***Grade 9 grade point average 0.03 211.09***Grade 9 annual attendance rate 0.03 675.88***Grade 9 Regents test attempted 0.33 88.77***Grade 9 Regents test passed 0.94 543.00***
Note. ***p b .001.

Table 4Means (with standard deviations in parentheses) for attendance rates by semester in Grades 4–8, by cohort (labeled with the year of fall enrollment in Grade 4) andoverall.
Attendance Rates (percent of days enrolled)
Cohort Fall,Grade 4
Spring,Grade 4
Fall,Grade 5
Spring,Grade 5
Fall,Grade 6
Spring,Grade 6
Fall,Grade 7
Spring,Grade 7
Fall,Grade 8
Spring,Grade 8
Cohort 2000 93.81 92.42 92.49 92.56 92.30 92.08 91.47 91.05 91.42 88.08(n = 77,916) (8.47) (8.48) (12.95) (7.63) (12.81) (8.92) (12.15) (10.92) (12.27) (12.26)Cohort 2001 93.92 93.07 93.36 92.71 92.26 92.37 92.07 90.69 90.95 87.92(n = 75,827) (7.56) (7.52) (10.97) (7.63) (12.19) (9.00) (11.85) (10.94) (11.99) (12.08)Cohort 2002 94.19 93.12 93.32 93.02 92.57 91.76 91.86 90.56 92.00 88.43(n = 75,588) (6.89) (7.55) (10.15) (7.82) (12.26) (9.56) (11.42) (10.83) (11.73) (11.87)Cohort 2003 93.97 93.59 93.73 92.63 92.53 91.80 92.88 90.90 92.43 89.27(n = 74,514) (7.05) (7.63) (9.84) (7.90) (11.24) (9.07) (11.29) (10.54) (11.23) (11.59)Overall 94.00 92.91 93.06 92.14 92.03 91.05 91.39 89.64 90.75 87.08(N = 303,845) (7.53) (8.25) (11.35) (9.06) (12.58) (10.91) (12.47) (12.64) (12.95) (13.88)
557M.J. Kieffer et al. / Journal of School Psychology 52 (2014) 549–565
or other factors thatmake theseweights less applicable to later cohorts. Second, because the Grade 9 on-track indicator is a strong butnot perfect predictor of on-time graduation, the indicator scores have more error in prediction than observed graduation scores.
3.1.2. Descriptive statisticsMeans and standard deviations for our question predictor, attendance rates in Grades 4–8, are displayed by semester and grade, for
the entire sample and disaggregated by cohort, in Table 4. As shown, observed attendance rates appear to be slightly lower in eachspring compared to each fall and decline over the grades studied. In particular, they demonstrate a notable decline in the Spring ofGrade 8 compared to earlier periods. These trends are consistent across the four cohorts. As described in the preceding Measuressection, within-grade and within-cohort z-scores were used to represent achievement in Grades 4–8, so the means for each ofthese variables would be 0 and the corresponding standard deviation would be 1 in each grade for each cohort. We refrain fromdisplaying descriptive statistics using the original scale scores, because they could be misleading regarding trends over time for thereasons discussed in the preceding section.
3.2. Patterns of change in attendance
After examining the descriptive statistics for attendance, we explored patterns of growth in attendance between Grades 4 andGrades 8 by inspecting empirical growth plots (Singer & Willett, 2003), and comparing various potential measurement models forgrowth in attendance. Specifically, we used latent growth modeling in a structural equation modeling framework (Bollen & Curran,2006) to fit a series of measurement models that use a piecewise specification for growth. Piecewise models allow for nonlineartrajectories in which students demonstrate different rates of growth during different specified periods. They have the advantage ofdirectlymodeling true rates of growth (i.e., growth rates that are freed of occasion-specific measurement error) for each theoreticallyimportant period for which sufficient data points are available. Fig. 1 displays a path diagram for the hypothesized measurementmodel for growth in attendance. In this figure, latent variables for initial status in attendance and four period-specific rates of growthin attendance are represented as ovals, observed indicators for attendance rate at each occasion are represented as rectangles, andloadings on the latent variables are represented as single-headed arrows with the values to which they were fixed. As shown,students' individual growth trajectories in attendance were specified to have an initial (Fall, Grade 4) status and four slopesrepresenting growth in four distinct periods before and during the middle grades: (1) Fall, Grade 4 to Fall, Grade 5; (2) Fall, Grade5 to Spring, Grade 6; (3) Spring, Grade 6 to Spring, Grade 7; and (4) Spring, Grade 7 to Spring, Grade 8. Each slope was allowed tovary across students, and the slopes were allowed to covary with one another and with students' initial (Fall, Grade 4) status, asshown by the double-headed arrows. Inspection of empirical growth plots (Singer & Willett, 2003) suggested that this piecewisemodel was appropriate to compare the population average growth trajectory as well as individual differences in the shape andelevation of students' growth trajectories.
Fitting of variousmeasurementmodels for attendance also indicated that the goodness of fit of thismodel to the datawas superiorto other theoretically viable specifications. Likelihood ratio tests indicates significantly better fit for this piecewise growthmodel thana linear growthmodel (Δχ2= 55,381.44; df=15; p b .001), a polynomial quadraticmodel (Δχ2= 18,981.48; df=11; p b .001), andpiecewise models with fewer slopes, including a two-slope model (Δχ2 = 30,087.346; df = 10; p b .001) and a three-slope model(Δχ2 = 10,937.7064; df = 6; p b .001). It is worth noting that the second period is longer due to the number of measurementoccasions; with 10 occasions, a four-slopemodel is only possible if one slope covers a longer period than the other three. Comparisonsof alternatemodels indicated that this particular piecewisemodel with a longer second period fitted the data better than alternatives,such as a four-slope model with a longer third period across a range of goodness-of-fit indices (i.e., Akaike Information Criteria andRoot Mean Square Error of Approximation). Given the large sample size and associated high statistical power, it is unsurprisingthat a more complicated model fits the data significantly better than simpler models. In this case, we used theoretical and practicalconcerns to decide upon this final model. Specifically, this model provides the most specific information about attendance changesduring four particular periods between Grades 4 and 8, which is useful for identifying which periods are characterized by the largest
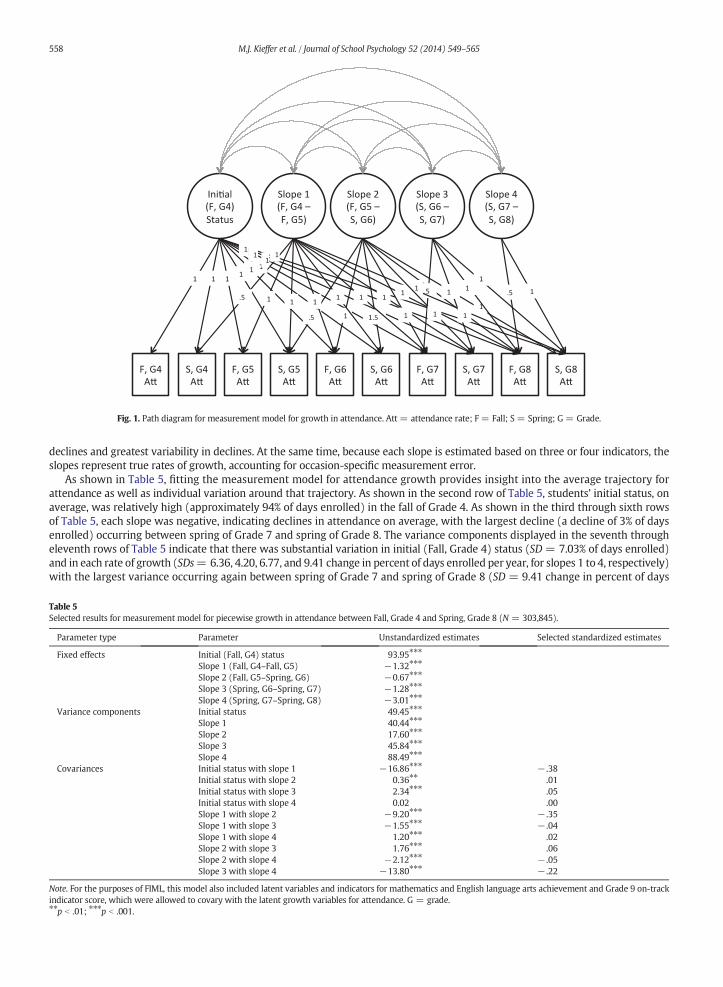
Fig. 1. Path diagram for measurement model for growth in attendance. Att = attendance rate; F = Fall; S = Spring; G = Grade.
558 M.J. Kieffer et al. / Journal of School Psychology 52 (2014) 549–565
declines and greatest variability in declines. At the same time, because each slope is estimated based on three or four indicators, theslopes represent true rates of growth, accounting for occasion-specific measurement error.
As shown in Table 5, fitting the measurement model for attendance growth provides insight into the average trajectory forattendance as well as individual variation around that trajectory. As shown in the second row of Table 5, students' initial status, onaverage, was relatively high (approximately 94% of days enrolled) in the fall of Grade 4. As shown in the third through sixth rowsof Table 5, each slope was negative, indicating declines in attendance on average, with the largest decline (a decline of 3% of daysenrolled) occurring between spring of Grade 7 and spring of Grade 8. The variance components displayed in the seventh througheleventh rows of Table 5 indicate that there was substantial variation in initial (Fall, Grade 4) status (SD = 7.03% of days enrolled)and in each rate of growth (SDs= 6.36, 4.20, 6.77, and 9.41 change in percent of days enrolled per year, for slopes 1 to 4, respectively)with the largest variance occurring again between spring of Grade 7 and spring of Grade 8 (SD = 9.41 change in percent of days
Table 5Selected results for measurement model for piecewise growth in attendance between Fall, Grade 4 and Spring, Grade 8 (N = 303,845).
Parameter type Parameter Unstandardized estimates Selected standardized estimates
Fixed effects Initial (Fall, G4) status 93.95⁎⁎⁎
Slope 1 (Fall, G4–Fall, G5) −1.32⁎⁎⁎
Slope 2 (Fall, G5–Spring, G6) −0.67⁎⁎⁎
Slope 3 (Spring, G6–Spring, G7) −1.28⁎⁎⁎
Slope 4 (Spring, G7–Spring, G8) −3.01⁎⁎⁎
Variance components Initial status 49.45⁎⁎⁎
Slope 1 40.44⁎⁎⁎
Slope 2 17.60⁎⁎⁎
Slope 3 45.84⁎⁎⁎
Slope 4 88.49⁎⁎⁎
Covariances Initial status with slope 1 −16.86⁎⁎⁎ − .38Initial status with slope 2 0.36⁎⁎ .01Initial status with slope 3 2.34⁎⁎⁎ .05Initial status with slope 4 0.02 .00Slope 1 with slope 2 −9.20⁎⁎⁎ − .35Slope 1 with slope 3 −1.55⁎⁎⁎ − .04Slope 1 with slope 4 1.20⁎⁎⁎ .02Slope 2 with slope 3 1.76⁎⁎⁎ .06Slope 2 with slope 4 −2.12⁎⁎⁎ − .05Slope 3 with slope 4 −13.80⁎⁎⁎ − .22
Note. For the purposes of FIML, this model also included latent variables and indicators for mathematics and English language arts achievement and Grade 9 on-trackindicator score, which were allowed to covary with the latent growth variables for attendance. G = grade.⁎⁎p b .01; ⁎⁎⁎p b .001.
Grade
Fig. 2. Fitted growth trajectories representing patterns of change in attendance between fall semester of Grade 4 and spring semester of Grade 8 for a random subsampleof 20 students in New York City schools. Whole numbers indicate fall semester (e.g., 4 = fall of Grade 4), whereas .5 indicates spring semester (e.g., 8.5 = spring ofGrade 8).
559M.J. Kieffer et al. / Journal of School Psychology 52 (2014) 549–565
enrolled per year). Together, these two findings suggest that this period involves not only the largest average decline in attendancebut also the widest variation in declines, such that some students decline to a much greater extent than in previous periods.
In addition, the fitted measurement model for growth in attendance provides insight into the relation between early levels andlater rates of growth in attendance (represented as double-headed arrows in Fig. 1). In Table 5, correlations between students' initialstatus and their rates of growth are displayed in the twelfth through fifteenth rows of the right column titled “Selected StandardizedEstimates.” As shown, initial status had amoderately sized negative relation with students' rates of growth between fall, Grade 4 andfall, Grade 5 (r = − .38) but only trivially sized relations with students' rates of growth during later periods (r = .00 to .05). Theseresults suggest that students' levels of attendance prior to the middle grades provide little information for predicting whether theywill decline in attendance during the middle grades.
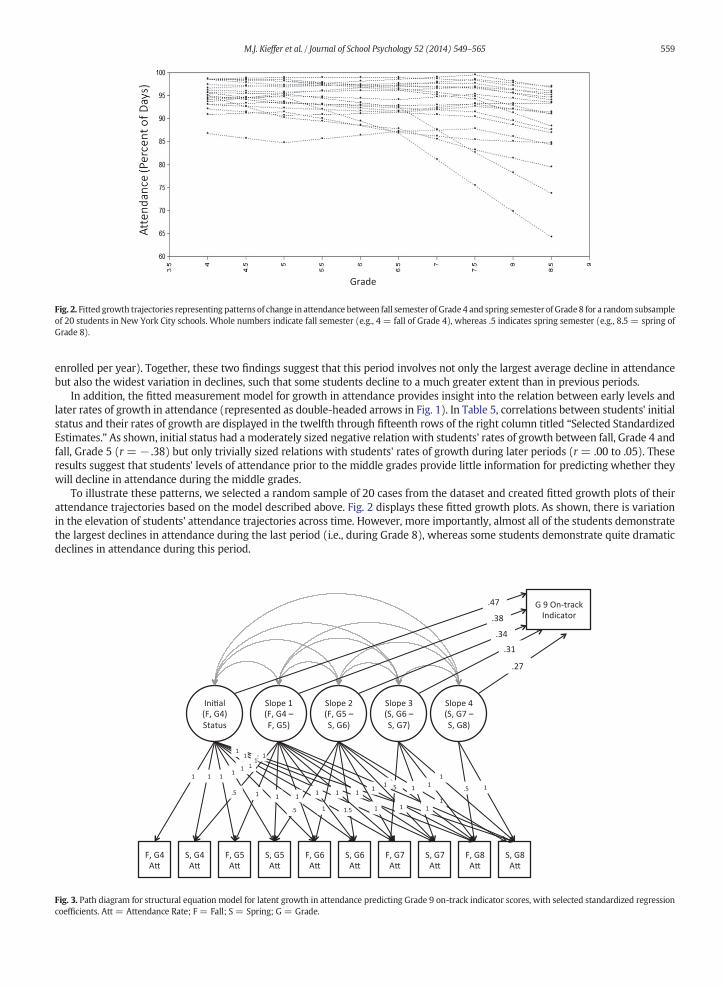
To illustrate these patterns, we selected a random sample of 20 cases from the dataset and created fitted growth plots of theirattendance trajectories based on the model described above. Fig. 2 displays these fitted growth plots. As shown, there is variationin the elevation of students' attendance trajectories across time. However, more importantly, almost all of the students demonstratethe largest declines in attendance during the last period (i.e., during Grade 8), whereas some students demonstrate quite dramaticdeclines in attendance during this period.
Fig. 3. Path diagram for structural equation model for latent growth in attendance predicting Grade 9 on-track indicator scores, with selected standardized regressioncoefficients. Att = Attendance Rate; F = Fall; S = Spring; G = Grade.
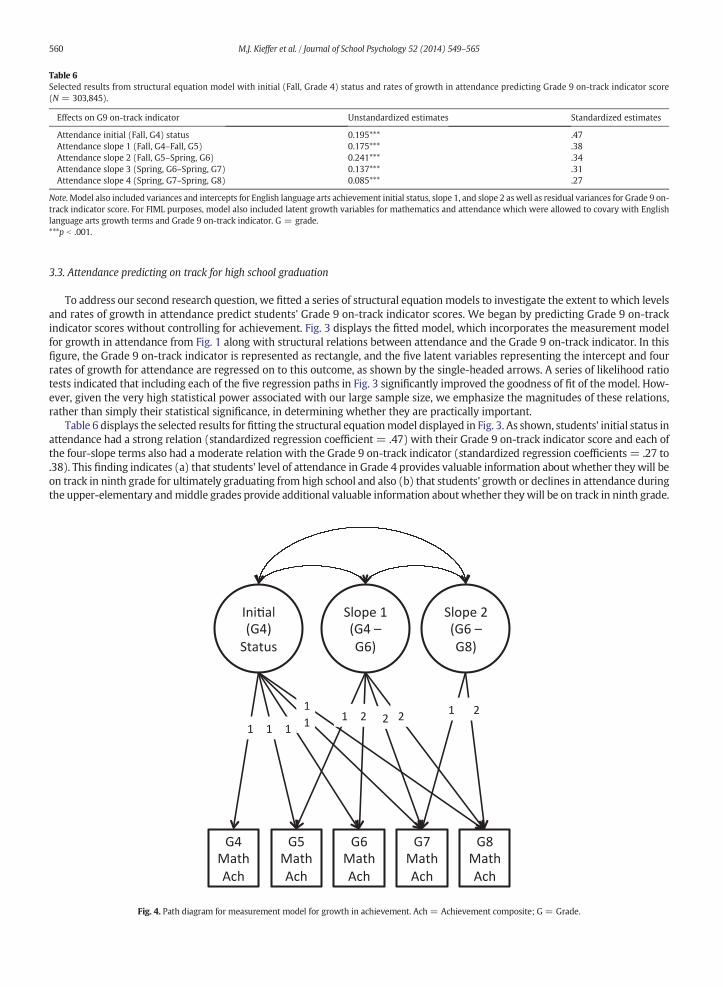
Table 6Selected results from structural equation model with initial (Fall, Grade 4) status and rates of growth in attendance predicting Grade 9 on-track indicator score(N = 303,845).
Effects on G9 on-track indicator Unstandardized estimates Standardized estimates
Attendance initial (Fall, G4) status 0.195*** .47Attendance slope 1 (Fall, G4–Fall, G5) 0.175*** .38Attendance slope 2 (Fall, G5–Spring, G6) 0.241*** .34Attendance slope 3 (Spring, G6–Spring, G7) 0.137*** .31Attendance slope 4 (Spring, G7–Spring, G8) 0.085*** .27
Note. Model also included variances and intercepts for English language arts achievement initial status, slope 1, and slope 2 aswell as residual variances for Grade 9 on-track indicator score. For FIML purposes, model also included latent growth variables for mathematics and attendance which were allowed to covary with Englishlanguage arts growth terms and Grade 9 on-track indicator. G = grade.***p b .001.
560 M.J. Kieffer et al. / Journal of School Psychology 52 (2014) 549–565
3.3. Attendance predicting on track for high school graduation
To address our second research question, we fitted a series of structural equation models to investigate the extent to which levelsand rates of growth in attendance predict students' Grade 9 on-track indicator scores. We began by predicting Grade 9 on-trackindicator scores without controlling for achievement. Fig. 3 displays the fitted model, which incorporates the measurement modelfor growth in attendance from Fig. 1 along with structural relations between attendance and the Grade 9 on-track indicator. In thisfigure, the Grade 9 on-track indicator is represented as rectangle, and the five latent variables representing the intercept and fourrates of growth for attendance are regressed on to this outcome, as shown by the single-headed arrows. A series of likelihood ratiotests indicated that including each of the five regression paths in Fig. 3 significantly improved the goodness of fit of the model. How-ever, given the very high statistical power associated with our large sample size, we emphasize the magnitudes of these relations,rather than simply their statistical significance, in determining whether they are practically important.
Table 6 displays the selected results for fitting the structural equationmodel displayed in Fig. 3. As shown, students' initial status inattendance had a strong relation (standardized regression coefficient = .47) with their Grade 9 on-track indicator score and each ofthe four-slope terms also had a moderate relation with the Grade 9 on-track indicator (standardized regression coefficients = .27 to.38). This finding indicates (a) that students' level of attendance in Grade 4 provides valuable information about whether they will beon track in ninth grade for ultimately graduating from high school and also (b) that students' growth or declines in attendance duringthe upper-elementary andmiddle grades provide additional valuable information aboutwhether theywill be on track in ninth grade.
Fig. 4. Path diagram for measurement model for growth in achievement. Ach = Achievement composite; G = Grade.
G 9 On-trackIndicator
Ini al(F, G4)Statusin A
Slope 4(S, G7 –S, G8)in A
Slope 1(F, G4 –F, G5)in A
Slope 2(F, G5 –S, G6)in A
Slope 3(S, G6 –S, G7)in A
Ini al(G4)StatusIn Ach
Slope 1(G4 –G6) inAch
Slope 2(G6 –G8) inAch
.21.21.22.26
.30
.37
.17
.22
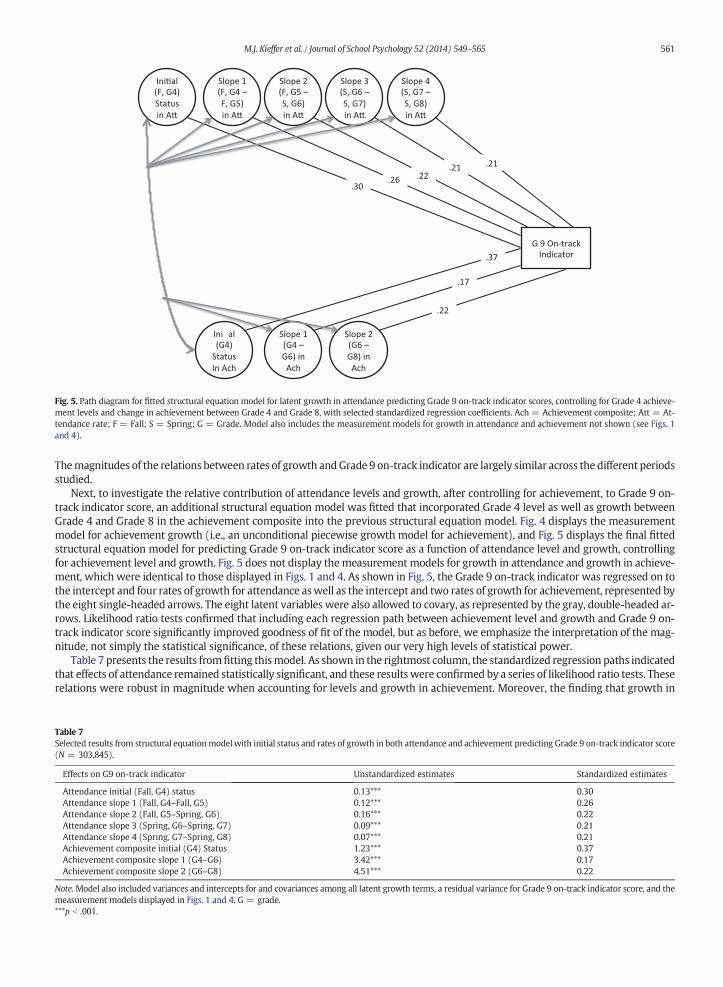
Fig. 5. Path diagram for fitted structural equation model for latent growth in attendance predicting Grade 9 on-track indicator scores, controlling for Grade 4 achieve-ment levels and change in achievement between Grade 4 and Grade 8, with selected standardized regression coefficients. Ach = Achievement composite; Att = At-tendance rate; F = Fall; S = Spring; G = Grade. Model also includes the measurement models for growth in attendance and achievement not shown (see Figs. 1and 4).
561M.J. Kieffer et al. / Journal of School Psychology 52 (2014) 549–565
Themagnitudes of the relations between rates of growth andGrade 9 on-track indicator are largely similar across the different periodsstudied.
Next, to investigate the relative contribution of attendance levels and growth, after controlling for achievement, to Grade 9 on-track indicator score, an additional structural equation model was fitted that incorporated Grade 4 level as well as growth betweenGrade 4 and Grade 8 in the achievement composite into the previous structural equation model. Fig. 4 displays the measurementmodel for achievement growth (i.e., an unconditional piecewise growth model for achievement), and Fig. 5 displays the final fittedstructural equation model for predicting Grade 9 on-track indicator score as a function of attendance level and growth, controllingfor achievement level and growth. Fig. 5 does not display themeasurement models for growth in attendance and growth in achieve-ment, which were identical to those displayed in Figs. 1 and 4. As shown in Fig. 5, the Grade 9 on-track indicator was regressed on tothe intercept and four rates of growth for attendance aswell as the intercept and two rates of growth for achievement, represented bythe eight single-headed arrows. The eight latent variables were also allowed to covary, as represented by the gray, double-headed ar-rows. Likelihood ratio tests confirmed that including each regression path between achievement level and growth and Grade 9 on-track indicator score significantly improved goodness of fit of the model, but as before, we emphasize the interpretation of the mag-nitude, not simply the statistical significance, of these relations, given our very high levels of statistical power.
Table 7 presents the results fromfitting thismodel. As shown in the rightmost column, the standardized regression paths indicatedthat effects of attendance remained statistically significant, and these resultswere confirmed by a series of likelihood ratio tests. Theserelations were robust in magnitude when accounting for levels and growth in achievement. Moreover, the finding that growth in
Table 7Selected results from structural equationmodel with initial status and rates of growth in both attendance and achievement predicting Grade 9 on-track indicator score(N = 303,845).
Effects on G9 on-track indicator Unstandardized estimates Standardized estimates
Attendance initial (Fall, G4) status 0.13*** 0.30Attendance slope 1 (Fall, G4–Fall, G5) 0.12*** 0.26Attendance slope 2 (Fall, G5–Spring, G6) 0.16*** 0.22Attendance slope 3 (Spring, G6–Spring, G7) 0.09*** 0.21Attendance slope 4 (Spring, G7–Spring, G8) 0.07*** 0.21Achievement composite initial (G4) Status 1.23*** 0.37Achievement composite slope 1 (G4–G6) 3.42*** 0.17Achievement composite slope 2 (G6–G8) 4.51*** 0.22
Note. Model also included variances and intercepts for and covariances among all latent growth terms, a residual variance for Grade 9 on-track indicator score, and themeasurement models displayed in Figs. 1 and 4. G = grade.***p b .001.
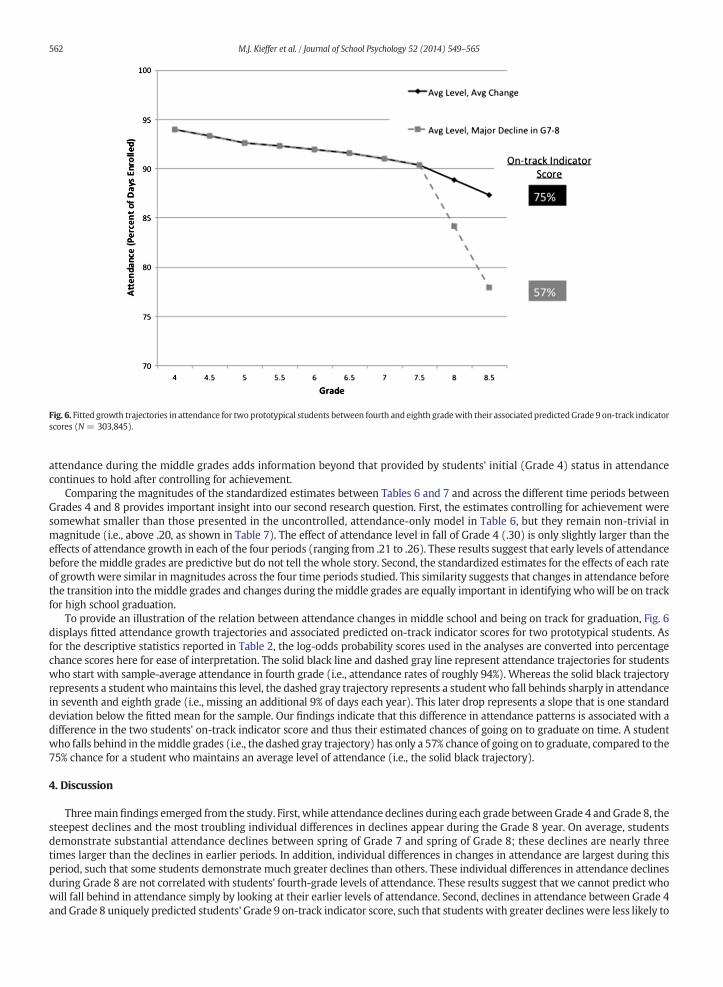
Fig. 6. Fitted growth trajectories in attendance for twoprototypical students between fourth and eighth gradewith their associated predictedGrade 9 on-track indicatorscores (N = 303,845).
562 M.J. Kieffer et al. / Journal of School Psychology 52 (2014) 549–565
attendance during the middle grades adds information beyond that provided by students' initial (Grade 4) status in attendancecontinues to hold after controlling for achievement.
Comparing the magnitudes of the standardized estimates between Tables 6 and 7 and across the different time periods betweenGrades 4 and 8 provides important insight into our second research question. First, the estimates controlling for achievement weresomewhat smaller than those presented in the uncontrolled, attendance-only model in Table 6, but they remain non-trivial inmagnitude (i.e., above .20, as shown in Table 7). The effect of attendance level in fall of Grade 4 (.30) is only slightly larger than theeffects of attendance growth in each of the four periods (ranging from .21 to .26). These results suggest that early levels of attendancebefore themiddle grades are predictive but do not tell the whole story. Second, the standardized estimates for the effects of each rateof growth were similar in magnitudes across the four time periods studied. This similarity suggests that changes in attendance beforethe transition into themiddle grades and changes during themiddle grades are equally important in identifying whowill be on trackfor high school graduation.
To provide an illustration of the relation between attendance changes in middle school and being on track for graduation, Fig. 6displays fitted attendance growth trajectories and associated predicted on-track indicator scores for two prototypical students. Asfor the descriptive statistics reported in Table 2, the log-odds probability scores used in the analyses are converted into percentagechance scores here for ease of interpretation. The solid black line and dashed gray line represent attendance trajectories for studentswho start with sample-average attendance in fourth grade (i.e., attendance rates of roughly 94%). Whereas the solid black trajectoryrepresents a student whomaintains this level, the dashed gray trajectory represents a student who fall behinds sharply in attendancein seventh and eighth grade (i.e., missing an additional 9% of days each year). This later drop represents a slope that is one standarddeviation below the fitted mean for the sample. Our findings indicate that this difference in attendance patterns is associated with adifference in the two students' on-track indicator score and thus their estimated chances of going on to graduate on time. A studentwho falls behind in themiddle grades (i.e., the dashed gray trajectory) has only a 57% chance of going on to graduate, compared to the75% chance for a student who maintains an average level of attendance (i.e., the solid black trajectory).
4. Discussion
Threemainfindings emerged from the study. First, while attendance declines during each grade between Grade 4 and Grade 8, thesteepest declines and the most troubling individual differences in declines appear during the Grade 8 year. On average, studentsdemonstrate substantial attendance declines between spring of Grade 7 and spring of Grade 8; these declines are nearly threetimes larger than the declines in earlier periods. In addition, individual differences in changes in attendance are largest during thisperiod, such that some students demonstrate much greater declines than others. These individual differences in attendance declinesduring Grade 8 are not correlated with students' fourth-grade levels of attendance. These results suggest that we cannot predict whowill fall behind in attendance simply by looking at their earlier levels of attendance. Second, declines in attendance between Grade 4and Grade 8 uniquely predicted students' Grade 9 on-track indicator score, such that students with greater declineswere less likely to

563M.J. Kieffer et al. / Journal of School Psychology 52 (2014) 549–565
be on track for high school graduation even after controlling for achievement levels and growth during this period and attendancelevels in the fall of Grade 4. Third, the magnitude of effects for rates of change in predicting the on-track indicator was similar acrossthe four time periods between Grade 4 and Grade 8. These results suggest that declines in attendance during the upper-elementarygrades and those during the middle grades are both valuable to identifying which students are off track for high school graduation.Taken together, these findings have important implications for researchers and educators.
4.1. Attending to attendance
Our findings suggest that attendance—a universally collected and readily available type of student data—can provide importantinsight into efforts to identify students who may fall off track so that they can benefit from early intervention in the middle gradesto prevent them from dropping out of high school. These findings about the value of attending to attendance converge with substan-tial prior research focused on the high school years (e.g., Allensworth & Easton, 2007; Neild & Balfanz, 2006; Rumberger, 1995) aswellas a few studies focused on the middle grades (Morris et al., 1991; Roderick, 1993) in highlighting the importance of behavioralindicators of school engagement in predicting the ultimate outcome of high school graduation. Although our findings may be mostrelevant to the unique circumstances of New York City schools, the largest system of public schools in the United States and onelocated in the country's largest and arguably most diverse urban area, this convergence of findings from research in other large citiessuggests that this growing research base can provide insights that can be applied to other urban contexts.
Our findings also suggest that looking at attendance data at only one point in time will not tell the complete story. Althoughstudents' early levels of attendance provided some important information, changes in their attendance were also important inpredicting which students would fall off track by ninth grade. In finding the changes in attendance predict on-track status beyondGrade 4 levels alone, we extend prior research that has rarely, if ever, used growth modeling to directly examine changes in atten-dance over time. The predictive power of changes in attendance is also consistent with Finn's (1989) participation-identificationmodel. In Finn's model, absences create a self-reinforcing cycle where missed school causes students to fall behind academically,alienates students from school activities, and leads them to successive absences and cumulatively resulting in dropout (Finn, 1989;Lloyd, 1978; Wehlage et al., 1989). In light of Finn's model for explaining cumulative risk for dropout, our findings support therecommendation of Roderick (1993) and others that educators need to use the data they collect on students' attendance to examinetheir progress over time and work to identify and intervene for those students who demonstrate major declines in attendance. Givenour finding that most students show lower attendance levels in the spring compared to the fall, it is important for such tracking tofollow students across three or more semesters to detect genuine declines in attendance beyond this seasonal trend.
4.2. The middle grades matter
Grade 9 has been the focus for most research (e.g., Allensworth & Easton, 2007; Neild & Balfanz, 2006) and intervention efforts(e.g., Kemple & Herlihy, 2004: Sinclair, Christenson, Evelo, & Hurley, 1998). Evidence suggests that this focus makes sense, giventhe strong relationship between Grade 9 performance and high school graduation. However, our current findings suggest that suchefforts may be necessary, but not sufficient, for producing major gains in keeping students on track for graduation. We found thatstudents who are off track for high school graduation could be identified much earlier not only based on their early levels ofattendance but also based on their declines in attendance during the upper-elementary and middle school grades. By finding thatchanges in attendance, not only levels of attendance, matter for identifying students who are off track, we provide evidence thatthe upper-elementary and middle grades may be important periods for early efforts to improve attendance and other aspects ofbehavioral engagement. Given that only one dropout prevention program for middle school has met the WWC standards for rigorand effectiveness to date (Dynarski et al., 2008), there is a clear need for research that evaluates levers that can be used to improvebehavioral engagement in the middle grades and thereby prevent students from falling off track. Such levers may include personal-izing school environments with individualized interventions (such as mentoring), or school-wide supports (such as creating smallschool models or small learning communities). There is some evidence that increases in school-based relationships can strengthenstudents' sense of belonging and connection to school and in turn prevent behavioral disengagement (Quint, Bloom, Black,Stephens, & Akey, 2005; Schaefer & Rivera, 2012; Sinclair et al., 1998).
Our study was also designed to shed light on which developmental periods between Grades 4 and 8 are most important foreducators to invest in such prevention efforts. In this regard, we have begun to address Alexander et al. (1997) call to action forresearchers to explore the intermediate stages and their contribution to long-term disengagement. Our findings on the relativeimportance of the upper-elementary and middle school grades are somewhat mixed. On one hand, the most dramatic declines inattendance—both for all students on average and for those students who decline most—occur during Grade 8. This finding suggeststhat the final year of the middle grades is a crucial point of intervention for behavioral engagement. Efforts to investigate how toprevent disengagement in Grades 8 are certainly called for, and such efforts might be reasonably combined with efforts to improveGrade9 performance by viewing the beginning ofGrade 8 through the endofGrade 9 as an important timeof transition (Roderick, 1993).
On the other hand, we found attendance declines during Grade 8 to be no more predictive of being off track in Grade 9 thandeclines in earlier periods. This finding suggests that an exclusive focus on Grades 8 to 9 may be misguided. Rather, when possible,efforts to improve engagement and prevent dropout should consider the entire span of the upper-elementary and middle schoolgrades. For example, interventions in these grades might focus on increasing positive student engagement as a means of combatingundesirable student behaviors associated with students getting off track. There are multiple intervention approaches for addressingpositive student engagement. There are promising behavioral interventions that include positive rewards, reinforcements, and

564 M.J. Kieffer et al. / Journal of School Psychology 52 (2014) 549–565
behavior plans (Vannest, Davis, Davis, Mason, & Burke, 2010) as well as instructional interventions that focus on assisted or cooper-ative learningmethods (Rohrbeck, Ginsburg-Block, Fantuzzo, &Miller, 2003; Slavin & Cooper, 1999) and on academic goal structuresand expanded opportunities for student autonomy (e.g., Anderman & Anderman, 2010). An additional area is relational interventionsthat support relationship-building among students and adults. Through these mentoring relationships appropriate academic andbehavioral goals are set and students' ability to meet these goals are monitored (Anderson, Christenson, Sinclair, & Lehr, 2004;Sinclair et al., 1998). It bears mentioning that an important consideration for appropriate interventions is that students' myriad con-texts (i.e., students' families, schools, peer groups, and communities) all serve as potentially significant targets of intervention(Reschly & Christenson, 2012). Combing these various techniques to increase engagement (i.e., relationship-building, academicperformance growth, and behavior plans) and attending to students varied contexts (Reschly & Christenson, 2012) in concert withcareful student data tracking (to catch problem behaviors as they arise) has the potential to interrupt the cycle of increasingdisengagement (Dynarski et al., 2008). Although these interventions show promise for preventing later dropout, it remains anopen question at what point in students' schooling and with what level of intensity these programs will be most effective.
Our findings diverge somewhat from other studies (e.g., Balfanz et al., 2007) in regard to the importance of the transition intoGrade 6. Although our findings suggest that declines in attendance during this transition are predictive of being off track later,there were smaller declines and less variability in attendance during this period than during the periods before and after it. We donot take these later findings as evidence that the transition into Grade 6 does not involve new risks for school engagement, but itdoes raise the possibility that attendance during this period may not decline as much as other evidence suggests. Future researchon this transition is needed.
4.3. Limitations and future research
As a secondary analysis of extant administrative data, our analysiswas limited in someways by the data available at the time of thestudy. First, we focused specifically on attendance in the current study because these data were readily available across the 6 yearsstudied and are a type of data that are nearly universally available to educators. However, given that school disengagement involvesself-reinforcing processes involving cognitive and affective factors as well as behavioral factors (e.g., Reschly & Christenson, 2012;Voelkl, 2012), the lack of information on cognitive and affective engagement in the current study is an important limitation tonote. Future research on students' progress through the middle grades should go beyond a focus on measuring behavioral engage-ment by also incorporating indicators of cognitive engagement (e.g., student or teacher reports of students' strategic thinking duringcourse assignments) and affective engagement (e.g., student reports of positive or negative attitudes toward school).
Second, we acknowledge that attendance may be a noisy indicator of behavioral engagement that is influenced by family andneighborhood characteristics on which we did not have data. Future studies controlling for these factors may yield more preciseestimates of the predictive power of attendance, after accounting for these confounding influences. Third, rather than directly usinghigh school graduation as our outcome, we used the proxy of an on-track indicator based on Grade 9 performance because we didnot have data for the most recent cohorts extending through to their year of graduation. We made this decision because we wantedto include the most recent evidence on the middle grades, and because the Grade 9 indicator was highly related to high schoolgraduation. Nonetheless, future research should confirm these results using high school graduation directly as an outcome.
In addition, we chose to not exclude English language learners and students with disabilities from the sample, so as to supportgeneralizations that would hold for the broad and diverse population of students in New York City, but we do not mean to implythat all the relations found would be the same in these populations. Future research is also needed on whether the patterns foundhold for particular subgroups of students, including English language learners, students with disabilities, and students who areretained. Finally, our current analyses cannot shed light on why Grade 8 is a particularly risky time for declines in attendance orwhy certain students fall behind in attendance in the middle grades. Future research, ideally using a combination of quantitativeand qualitative methods to investigate the complex individual and ecological factors that may contribute to disengagement in themiddle grades, is much needed.
4.4. Conclusion
This study provides new longitudinal evidence for the value of one indicator of behavioral engagement—attendance—in predictingwhether students in the upper-elementary andmiddle grades are on track toward high school graduation. By examining changes, andnot only levels, of attendance across years, we find that declines in this indicator may be an important early warning sign to identifywhich students are falling off track. Together, our findings highlight the need for research and intervention efforts to look earlier thanthe high school grades when aiming to prevent dropout. We hope that this work will stimulate new efforts to look across the gradespan to identify opportune moments and methods to intervene to better support students on the path toward graduation.
References
Alexander, K. L., Entwisle, D. R., & Horsey, C. S. (1997). From first grade forward: Early foundations of high school dropout. Sociology of Education, 70, 87–107.Allensworth, E. M., & Easton, J. (2005). The on-track indicator as a predictor of high school graduation. Chicago: Consortium on Chicago School Research.Allensworth, E. M., & Easton, J. Q. (2007). What matters for staying on-track and graduating in Chicago Public High Schools: A close look at course grades, failures, and
attendance in the freshman year. Chicago, IL: University of Chicago, Consortium on Chicago School Research.Anderman, E. M., & Anderman, L. H. (2010). Classroom motivation. Columbus, OH: Merrill/Prentice Hall.
565M.J. Kieffer et al. / Journal of School Psychology 52 (2014) 549–565
Anderson, A. R., Christenson, S. L., Sinclair, M. F., & Lehr, C. A. (2004). Check & connect: The importance of relationships for promoting engagement with school. Journalof School Psychology, 42, 95–113.
Appleton, J. J., Christenson, S. L., & Furlong, M. J. (2008). Student engagement with school: Critical conceptual and methodological issues of the construct. Psychology inthe Schools, 45, 369–386.
Balfanz, R., & Boccanfuso, C. (2007). Falling off the path to graduation: Middle grade indicators in Boston. Baltimore, MD: Center for Social Organization of Schools.Balfanz, R., Herzog, L., & Mac Iver, D. J. (2007). Preventing student disengagement and keeping students on the graduation path in urban middle-grades schools: Early
identification and effective interventions. Educational Psychologist, 42, 223–235.Barrington, B. L., & Hendricks, B. (1989). Differentiating characteristics of high school graduates, dropouts, and nongraduates. Journal of Educational Research, 82,
309–319.Bollen, K. A., & Curran, P. J. (2006). Latent curve models: A structural equation perspective. Hoboken, NJ: Wiley.Christenson, S. L., Reschly, A. L., & Wylie, C. (2012). Handbook of research on student engagement. New York, NY: Springer.Christenson, S. L., Sinclair, M. F., Lehr, C. A., & Godber, Y. (2001). Promoting successful school completion: Critical conceptual and methodological guidelines. School
Psychology Quarterly, 16, 468–484.Dillon, S. (2008, April 1). U.S. to require states to use a single school dropout formula. New York Times (Retrieved from http://www.nytimes.com/2008/04/01/education/
01child.html?_r=1&.).Donovan, M. S., Wigdor, A. K., & Snow, C. E. (Eds.). (2003). Strategic education research partnership. Washington, DC: National Academies Press.Dynarski, M., Clarke, L., Cobb, B., Finn, J., Rumberger, R., & Smink, J. (2008). Dropout prevention: A practice guide (NCEE 2008–4025).Washington, DC: National Center for
Education Evaluation and Regional Assistance, Institute of Education Sciences, U.S. Department of Education.Eccles, J., Midgley, C., Buchanan, C., Wigfield, A., Reuman, D., & MacIver, D. (1993). Development during adolescence: The impact of stage/environment fit on young
adolescents' experiences in schools and families. American Psychologist, 48, 90–101.Enders, C. K., & Bandalos, D. L. (2001). The relative performance of full information maximum likelihood estimation for missing data in structural equation models.
Structural Equation Modeling, 8, 430–457.Ensmingr, M. E., & Slusarcick, A. L. (1992). Paths to high school graduation or dropout: A longitudinal study of a first-grade cohort. Sociology of Education, 65, 97–113.Finn, J. D. (1989). Withdrawing from school. Review of Educational Research, 59, 117–142.Finn, J. D., & Cox, D. (1992). Participation and withdrawal among fourth-grade pupils. American Educational Research Journal, 29, 141–162.Finn, J. D., & Zimmer, K. S. (2012). Student engagement: What is it? Why does it matter? In S. L. Christenson, A. L. Reschly, & C. Wylie (Eds.), Handbook of research on
student engagement (pp. 97–131). New York, NY: Springer Science.Fredericks, J. A., Blumenfeld, P. C., & Paris, A. H. (2004). School engagement: Potential of the concept, state of the evidence. Review of Educational Research, 74, 59–109.Furlong, M. J., & Christenson, S. L. (2008). Engaging students at school and with learning: A relevant construct for all students. Psychology in the Schools, 45, 365–368.Goldsmith, L. T., & Kantrov, I. (2001). Guiding curriculum decisions for middle-grades mathematics. Newton, MA: Education Development Center.Institute of Educational Sciences, U.S. Department of Education (2007). National assessment of Title I, final report: Volume I: Implementation (2007).Washington, DC: Author.Jackson, A. W., & Davis, G. A. (2000). Turning points 2000: Educating adolescents in the 21st century. New York, NY: Teachers College Press.Janosz, M. (2012). Part IV Commentary: Outcomes of engagement and engagement as an outcome: Some consensus, divergences, and unanswered questions. In S. L.
Christenson, A. L. Reschly, & C. Wylies (Eds.), Handbook of research on student engagement (pp. 695–703). New York, NY: Springer Science.Juvonen, J., Le, V., Kaganoff, T., Augustine, C., & Constant, L. (2004). Focus on the wonder years: Challenges facing the American middle school. Santa Monica, CA: Rand.Kemple, J. J., & Herlihy, C. (2004). The talent development high school model: Context, components, and initial impacts on ninth-grade students' engagement and
performance. New York, NY: MDRC.Kemple, J. J., Segeritz, M. D., & Stephenson, N. (2013). Building on-track indicators for high school graduation and college readiness: Evidence from New York City.
Journal of Education for Students Placed at Risk (JESPAR), 18, 7–28.Kennelly, L., & Monrad, M. (2007). Approaches to dropout prevention: Heeding early warning signs with appropriate interventions.Washington, DC: National High School
Center.Kieffer, M. J., & Marinell, W. H. (2012). Navigating the middle grades: Evidence from New York City. New York City: Research Alliance for New York City Schools
(Retrieved from: http://steinhardt.nyu.edu/research_alliance/publications/).Landis, R. N., & Reschly, A. L. (2011). An examination of compulsory school attendance ages and high school dropout and completion. Educational Policy, 25, 719–761.Lloyd, D. N. (1978). Prediction of school failure from third-grade data. Educational and Psychological Measurement, 38, 1193–1200.Marks, H. M. (2000). Student engagement in instructional activity: Patterns in the elementary,middle, and high school years. American Educational Research Journal, 37,
153–184.Morris, J. D., Ehren, B. J., & Lenz, B. K. (1991). Building a model to predict which fourth through eighth graders will drop out in high school. Journal of Experimental
Education, 59, 286–293.Neild, R. C., & Balfanz, R. (2006). Unfulfilled promise: The dimensions and characteristics of Philadelphia's dropout crisis, 2000–2005. Philadelphia, PA: Philadelphia Youth
Transitions Collaborative.Newmann, F. M., Wehlage, G. G., & Lamborn, S. D. (1992). The significance and sources of student engagement. In F. M. Newmann (Ed.), Student engagement and
achievement in American secondary schools (pp. 11–39). New York, NY: Teachers College Press.O'Day, J. A., Bitter, C. S., & Gomez, L. M. (2011). Education reform in New York City: Ambitious change in the nation's most complex school system. Cambridge, MA: Harvard
Education Press.Quint, J., Bloom, H., Black, A., Stephens, L., & Akey, T. M. (2005). The challenge of scaling up educational reform: Findings and lessons from first things first. New York, NY:
MDRC.Reschly, A. L., & Christenson, S. L. (2012). Jingle, jangle, and conceptual haziness: Evolution and future directions of the engagement construct. In S. L. Christenson, A. L.
Reschly, & C. Wylie (Eds.), Handbook of research on student engagement (pp. 3–19). New York, NY: Springer.Roderick, M. (1993). The path to dropping out: Evidence for intervention. Westport, CT: Auburn House.Roderick, M., & Camburn, E. (1999). Risk and recovery from course failure in the early years of high school. American Educational Research Journal, 36, 303–343.Roderick, M., Easton, J. Q., & Sebring, P. B. (2009). The consortium on Chicago school research: A new model for the role of research in supporting urban school reform.
Chicago, IL: University of Chicago, Consortium on Chicago School Research.Rohrbeck, C. A., Ginsburg-Block, M. D., Fantuzzo, J. W., & Miller, T. R. (2003). Peer-assisted learning interventions with elementary school students: A meta-analytic
review. Journal of Educational Psychology, 95, 240–257.Rumberger, R. W. (1995). Dropping out of middle school: A multilevel analysis of students and schools. American Educational Research Journal, 32, 583–625.Schaefer, M. B., & Rivera, L. M. (2012). College and career readiness in the middle grades. Middle Grades Research Journal, 7, 51–66.Shanahan, T., & Shanahan, C. (2008). Teaching disciplinary literacy to adolescents: Rethinking content-area literacy. Harvard Educational Review, 78, 40–59.Simmons, R. G., & Blyth, D. A. (1987). Moving into adolescence: The impact of pubertal change and school context. Hawthorne, NY: Aldine de Gruyter.Sinclair, M. F., Christenson, S. L., Evelo, D., & Hurley, C. (1998). Dropout prevention for high-risk youth with disabilities: Efficacy of a sustained school engagement
procedure. Exceptional Children, 65, 7–21.Singer, J. D., & Willett, J. B. (2003). Applied longitudinal data analysis: Modeling change and event occurrence. New York, NY: Oxford University Press.Slavin, R. E., & Cooper, R. (1999). Improving intergroup relations: Lessons learned from cooperative learning programs. Journal of Social Issues, 55, 647–663.Suh, S., Suh, J., & Houston, I. (2007). Predictors of categorical at-risk high school dropouts. Journal of Counseling and Development, 85, 196–203.Vannest, K. J., Davis, J. L., Davis, C. R., Mason, B. A., & Burke, M. D. (2010). Effective intervention for behavior with a daily behavior report card: A meta-analysis. School
Psychology Review, 39, 654–672.Voelkl, K. E. (2012). School identification. In S. L. Christenson, A. L. Reschly, & C. Wylies (Eds.), Handbook of research on student engagement (pp. 193–218). New York,
NY: Springer Science.Wehlage, G. G., Rutter, R. A., Smith, G. A., Lesko, N., & Fernandez, R. R. (1989). Reducing the risk: Schools as communities of support. London, UK: Falmer Press.Wilhelm, J. D. (1995). Reading is seeing: Using visual response to improve the literary reading of reluctant readers. Journal of Reading Behavior, 27, 467–503.