Embed Size (px)
Citation preview

Navigating the U.S. Oil Export Debate
By Jason Bordof f and Trevor HouserJANUARY 2015
b | CHAPTER NAME
ABOUT THE CENTER ON GLOBAL ENERGY POLICY
The Center on Global Energy Policy provides independent, balanced, data-driven analysis to help policymakers
navigate the complex world of energy. We approach energy as an economic, security, and environmental concern.
And we draw on the resources of a world-class institution, faculty with real-world experience, and a location in
the world’s finance and media capital. Visit us at energypolicy.columbia.edu
facebook.com/ColumbiaUEnergy twitter.com/ColumbiaUEnergy
ABOUT THE SCHOOL OF INTERNATIONAL AND PUBLIC AFFAIRS
SIPA’s mission is to empower people to serve the global public interest. Our goal is to foster economic growth,
sustainable development, social progress, and democratic governance by educating public policy professionals,
producing policy-related research, and conveying the results to the world. Based in New York City, with a student
body that is 50 percent international and educational partners in cities around the world, SIPA is the most global
of public policy schools. For more information, please visit www.sipa.columbia.edu
ABOUT THE RHODIUM GROUP (RHG)
Rhodium Group (RHG) combines policy experience, quantitative economic tools and on-the-ground research to
analyze disruptive global trends. Our work supports the investment management, strategic planning and policy
needs of firms in the financial, corporate, non-profit and government sectors. RHG has offices in New York, California
and Washington, and associates in Shanghai and New Delhi. More information is available at www.rhg.com

energypolicy.columbia.edu | JANUARY 2015 | 1
NAVIGATING THE U.S. OIL EXPORT DEBATE
Columbia University in the City of New York
By Jason Bordof f and Trevor Houser
JANUARY 2015
NAVIGATING THE U.S. OIL EXPORT DEBATE
2 | CENTER ON GLObAL ENERGY POLICY | COLUMbIA SIPA
For exceptional research assistance, the authors thank Keith Benes, Shashank Mohan and Akos Losz.
For very helpful comments on earlier drafts of this study, the authors thank John Auers, Ed Morse,
Michael Levi, Colin Fenton, Meghan O’Sullivan, Carlos Pascual, David Sandalow, Adrian Lajous,
Christopher Wall, Jacob Dweck, Ken Medlock, Antoine Halff, James Stock, Sarah Emerson and
Joe Aldy. For excellent editorial assistance, the authors thank Matthew Robinson.
ACKNOWLEDGEMENTS

NAVIGATING THE U.S. OIL EXPORT DEBATE
energypolicy.columbia.edu | JANUARY 2015 | 3
Jason Bordoff joined the Columbia faculty after serving until January 2013 as Special Assistant to the President and Senior Director for Energy and Climate Change on the Staff of the National Security Council, and, prior to that, holding senior policy positions on the White House’s National Economic Council and Council on Environmental Quality. One of the world’s top energy policy experts, he joined the Administration in April 2009. At Columbia’s School of International and Pub-lic Affairs, Bordoff is a professor of professional prac-tice and serves as founding Director of SIPA’s Center on Global Energy Policy. Bordoff ’s research and policy interests lie at the intersection of economics, energy, en-vironment, and national security. He is a frequent com-mentator on TV and radio, including NPR, Bloomberg, CNBC and BBC, has appeared on the Colbert Report, and has published in the New York Times, Wall Street Journal, Financial Times and other leading news out-lets. Prior to joining the White House, Bordoff was the Policy Director of the Hamilton Project, an economic policy initiative housed at the Brookings Institution. He is a member of the Council on Foreign Relations and the National Petroleum Council, a consultant to the National Intelligence Council, and serves on the boards of Winrock International (a leading nonprofit organiza-tion that works to empower the disadvantaged, increase economic opportunity, and sustain natural resources), the New York Energy Forum, and the Association of Marshall Scholars. During the Clinton Administration, Bordoff served as an advisor to the Deputy Secretary of the US Treasury Department. He was also a consultant with McKinsey & Company, one of the leading global strategy consultancies. Bordoff graduated with honors from Harvard Law School, where he was treasurer and an editor of the Harvard Law Review, and clerked on the US Court of Appeals for the DC Circuit. He also holds an MLitt degree from Oxford University, where he stud-ied as a Marshall Scholar, and a BA magna cum laude and Phi Beta Kappa from Brown University.
Trevor Houser is a partner with the Rhodium Group (RHG) and leads the firm’s energy and natural resources practice. Mr. Houser’s work supports the investment man-agement, strategic planning and policy needs of RHG cli-ents in the financial, corporate and government sectors. Mr. Houser is also a visiting fellow at the Peterson Institute for International Economics in Washington and serves on the US Trade Representative’s Trade and Environment Policy Advisory Committee (TEPAC). He is a member of the Council on Foreign Relations and the National Committee on US-China Relations and serves on the Advisory Board of Center for US-China Relations at the Asia Society. During 2009, Mr. Houser left RHG temporarily to serve as Senior Advisor to the US State Department where he worked on a broad range of international energy, natural resource and environmental policy issues. While in government, Mr. Houser negotiated seven bilateral US-China energy agree-ments, including the US-China Shale Gas Initiative and the establishment of the US-China Clean Energy Research Center. Mr. Houser speaks regularly on international ener-gy market and policy trends to private sector, public poli-cy and academic audiences, including regular appearances at the Peterson Institute for International Economic, the Aspen Institute, the Brookings Institution, the Council on Foreign Relations, the Center for Strategic and Internation-al Studies, the Center on Global Energy Policy, Resources for the Future, the Asia Society, the World Affairs Council, and Chatham House. He has presented to the Board of Di-rectors or management committees of a number of Fortune 500 companies, guest lectured at a range of universities, including Harvard, Stanford, Columbia, Princeton, NYU, and UT Austin, and testified before the House Energy and Commerce Committee, the House Select Committee on Energy Independence and Global Warming, the US Hel-sinki Commission and the US-China Economic and Secu-rity Review Commission.
ABOUT THE AUTHORS

NAVIGATING THE U.S. OIL EXPORT DEBATE
4 | CENTER ON GLObAL ENERGY POLICY | COLUMbIA SIPA
Recent innovations in the oil and gas sector have cata-lyzed a renaissance in US production and a dramatic turn-around in America’s international energy trade position. US crude oil production has increased from 5 million barrels per day (b/d) in late 2006 to 9 million b/d in late 2014. Total petroleum production is over 12 million b/d, making the US the largest liquids supplier in the world. Rising production and declining petroleum consumption has reduced US import dependence from 60 percent to 26 percent over the past eight years.
Although the US will likely continue to consume more oil than we produce, and thus remain a net petroleum im-porter, there are growing concerns about the ability of the US refining system to absorb future growth in domestic crude production. Virtually all the recent and projected growth in US crude output is lighter weight and lower sulfur than the Canadian, Mexican, Venezuelan and Mid-dle Eastern crudes many US refineries are currently con-figured to process. Refineries elsewhere in the world pro-cess light oil, but under current law, US crude oil exports are largely (though not entirely) prohibited. The growing mismatch between domestic crude supply and domestic refining capacity is prompting a re-evaluation of these ex-port restrictions.
There are both proponents and opponents of increasing the amount of crude oil that can be exported from the United States. Domestic oil producers worry that with-out access to foreign markets, they will have to discount their oil to incentivize refiners to process it at existing facilities or cover the investment required to build new ones. Lower market prices for US crude producers could reduce upstream investment and future domestic produc-tion growth. Many refiners worry that allowing crude oil exports will raise domestic crude prices, harm their com-petitiveness and reduce the incentive for new refining investments. Consumers worry that exporting oil could increase gasoline and diesel prices and leave them more vulnerable to future international supply disruptions. And some environmental groups worry that allowing exports
will result in more shale development domestically and more greenhouse gas emissions globally.
This report reviews the origin and current form of US crude export restrictions and analyzes the energy market, economic, security, geopolitical, trade and environmental implications of modifying or lifting those restrictions.
In short, we find:
• The original rationale for crude export restrictions no longer applies. Today’s oil market looks very different than in the 1970s when current crude oil export restrictions were first put in place. At that time, the US had adopted domestic price controls to combat inflation and crude export restrictions were necessary to make those price controls effec-tive. While price controls have long since fallen away, crude export restrictions remain.
• If recent production growth rates continue, a shortage of US light crude refining capacity will likely reduce domestic crude prices relative to in-ternational levels, slowing the pace of upstream investment and future crude output. Modifying or removing crude export restrictions would prevent this from occurring by allowing domestic produc-ers to compete in global markets.
• Permitting companies to export crude oil in great-er quantities may reduce the rents refiners receive relative to leaving current restrictions in place, but will likely decrease the price Americans pay for gasoline, diesel and other petroleum products and benefit the US economy as a whole.
• While the nature of the impact of lifting crude ex-port restrictions is relatively clear, the timing and magnitude is highly uncertain. The recent decline in oil prices will slow the pace of US production growth and may delay the point at which domestic light crude refining capacity shortages occur. The speed and cost at which refiners could add or re-
EXECUTIVE SUMMARY

NAVIGATING THE U.S. OIL EXPORT DEBATE
energypolicy.columbia.edu | JANUARY 2015 | 5
configure capacity is unknown, as is the response of producers elsewhere in the world to any change in US supply.
• In light of these and other variables, we estimate lifting current crude export restrictions could in-crease US crude production anywhere between 0 and 1.2 million barrels per day on average between now and 2025, and reduce domestic gasoline pric-es by between 0 and 12 cents per gallon.
• Allowing exports would make the US more resil-ient, not less, to supply disruptions elsewhere in the world. Greater integration into global markets would make US oil supply more responsive to in-ternational market developments, mitigating the impact on American consumers and the US econ-omy of production losses in other countries.
• Lifting crude export restrictions is consistent with past and present US trade policy priorities, would enhance US credibility in current and fu-ture trade negotiations, and avoid creating a prec-edent that could harm US trade policy objectives down the road.
• Increased US crude production can weaken the economic power, fiscal strength and geopolitical influence of other large oil producing countries. The magnitude of any export policy-driven im-pact is small, however, relative to recent oil mar-ket developments. More important for US foreign policy are the current crude trade relationships re-tained and new ones created if export restrictions are modified or lifted, along with the potential for greater US diplomatic leverage in future applica-tion of sanctions or pursuit of other objectives.
• To the extent allowing exports lowers crude oil and petroleum product prices, global oil demand will increase, along with oil-related CO2 emissions. While we do not believe export restrictions are an
appropriate or cost-effective way to reduce CO2 emissions, it is critical that more aggressive policy actions in other areas are taken to demonstrate that boosting domestic supply can be consistent with meeting our climate objectives.

6 | CENTER ON GLObAL ENERGY POLICY | COLUMbIA SIPA
TABLE OF CONTENTS
ACKNOWLEDGMENTS ...................................................... 2
ABOUT THE AUTHORS ..................................................... 3
EXECUTIVE SUMMARY ..................................................... 4
INTRODUCTION ................................................................. 8
THE ORIGIN OF OIL EXPORT RESTRICTIONS ................10Where oil trade restrictions got their start Inflation and price controlsThe emergence of export restrictions The Emergency Petroleum Allocation Act of 1973
The Trans-Alaska Pipeline System Act
Congress makes oil export restrictions permanentThe evolution of export restrictions through Executive Branch action
Current regulations governing petroleum exports Crude oil
Refined products
Condensate
THE CURRENT DEBATE OVER EXPORTING US OIL ..... 19The US oil boom Getting the oil to market A mismatch between domestic supply and refinery demandWhen do export restrictions begin to bite? Displacing imports
Increasing exports
When does the point of saturation occur?
THE ECONOMIC IMPACT OF ALLOWING EXPORTS ..... 29Economic theory and empirical evidenceExisting estimatesUnderstanding the variables Global oil price
US resource base
Refinery economics
Global oil market response
Bounding the possibilities US resource base
Refinery economics
International market response
Global oil prices
Putting it together
From energy to economics
THE ENERGY SECURITY CONSEQUENCES OF ALLOWING OIL EXPORTS ............................................. 47
A different oil marketThe benefits of interdependenceThe economic security implications of trade and demand More extreme supply disruption scenarios
GEOPOLITICAL AND TRADE POLICY CONSIDERATIONS ......................................................... 51
Existing trade commitments Current and future trade talksGeopolitics More trade
Diplomatic leverage
ENVIRONMENTAL CONSIDERATIONS ............................ 55Local environmental impactsClimate change consequences
POLICY OPTIONS ........................................................... 58Use of presidential national interest authorityFlexible administrative interpretation of existing regulationsAdministrative modification of existing regulationsCongressional action
CONCLUSION .................................................................. 61
NOTES .............................................................................. 62
BIBLIOGRAPHY ............................................................... 73

NAVIGATING THE U.S. OIL EXPORT DEBATE
energypolicy.columbia.edu | JANUARY 2015 | 7
FIGURESFigure 1: US crude oil production and net crude oil imports 1920–1980 ......................................................... 10
Figure 2: Prices paid by US refiners for domestic and imported crude oil .......................................................... 12
Figure 3: US crude oil production and net imports 1973–2014 ...................................................................... 19
Figure 4: Crude and refined product net imports ............. 20Figure 5: Crude by rail ...................................................... 21Figure 6: WTI-LLS spread ................................................ 22Figure 7: Petroleum Administration for Defense Districts (PADDs) ........................................................................... 22
Figure 8: US crude in context ........................................... 24Figure 9: LLS-Brent spread .............................................. 25Figure 10: US crude imports by API gravity ..................... 26Figure 11: US oil imports by country of origin .................. 27Figure 12: US crude exports to Canada ........................... 28Figure 13: Refinery acquisition cost of crude by PADD ..... 30Figure 14: Wholesale gasoline price by PADD ................. 31Figure 15: Increase in US crude production from lifting export restrictions, 2015–2025 ....................................... 32
Figure 16: Reduction in refined product prices from lifting crude export restrictions, 2015–2025 ............................. 32
Figure 17: Increase in GDP from lifting crude export restrictions, 2015–2025 .................................................. 33
Figure 18: US crude oil supply curve, 2020 ..................... 35Figure 19: International crude price projections in surveyed reports ............................................................ 36
Figure 20: Crude production forecasts ............................. 38Figure 21: US crude supply elasticity ............................... 38Figure 22: Domestic crude price discount due to export restrictions ...................................................................... 41
Figure 23: Crude price response ...................................... 42Figure 24: Refined product price reduction ...................... 43Figure 25: Increase in GDP from lifting crude export restrictions ...................................................................... 45
Figure 26: Estimated cumulative effect of 10 percent oil price shock on GDP ....................................................... 50
Figure 27: Wells-to-wheels crude oil GHG emissions ...... 56
TABLESTable 1: US refining capacity (2013) ................................. 21Table 2: Crude quality definitions ..................................... 23Table 3: Global refining capacity (2013) ........................... 24Table 4: Impact of allowing crude oil exports ................... 34
BOXESA Brief History of Oil Price Regulation .............................. 11BIS Administration Export Licenses for Short Supply Controls ...........................................................................16
The PADD System ............................................................ 22What About Gasoline Prices? ...........................................30Supply Elasticity .............................................................. 39Lessons from Trade in Refined Petroleum ....................... 47US Response to Supply Disruptions ................................ 49

NAVIGATING THE U.S. OIL EXPORT DEBATE
8 | CENTER ON GLObAL ENERGY POLICY | COLUMbIA SIPA
The application of hydraulic fracturing, horizontal drilling and seismic imaging to unlock oil from shale and other tight geologic formations has catalyzed a renaissance in US production and a dramatic turnaround in America’s international energy trade position. US crude oil pro-duction has increased more than 70 percent over the past eight years, from just over 5 million barrels per day (b/d) in late 2006 to 9 million b/d in late 2014.1 Combined with a more than 100 percent increase in output of natu-ral gas liquids (NGLs), US oil production is approaching 12 million b/d.2 Biofuels and refinery gains increase over-all US liquids output by another 2 million b/d, making the United States the world’s largest producer.3
Although the United States will likely remain a net crude importer for the foreseeable future, there are growing con-cerns about the ability of the US refining system—much of which is currently configured to process heavy, sour im-ported crude—to absorb rapidly growing domestic light tight oil (LTO) production. Processing LTO in a refinery optimized for heavy crudes changes the mix of products produced (e.g., gasoline, diesel, kerosene, and fuel oil) and can reduce overall refinery sales revenue. Building new refineries to process domestic LTO takes both time and money. There are refineries elsewhere in the world config-ured to process light oil, but under current US law crude oil exports are largely prohibited.
US oil producers worry that without access to foreign markets, they will have to discount their oil to incentiv-ize refiners to process it at existing facilities or to cover the investment required to build new ones. Lower do-mestic oil prices would reduce the revenue producers earn on their current output and could impact drilling activity and thus future growth in supply. Refiners worry that allowing crude oil exports will cause them to lose revenue, potentially becoming unprofitable in some cas-es, and reduce the incentive for investment in new do-mestic capacity. Consumers worry that lifting crude ex-port restrictions could increase gasoline and diesel prices and leave them vulnerable to future international supply
disruptions. For many environmental groups, allowing crude exports exacerbates existing concerns over the lo-cal and global environmental impact of the US oil and gas renaissance.
This report, a collaboration between the Center on Glob-al Energy Policy at Columbia University and the econom-ic research firm Rhodium Group, attempts to help both policymakers and stakeholders navigate this complex is-sue by providing an overview of the origin and current form of crude export restrictions in the United States and an objective, fact-based assessment of the energy market, economic, security, geopolitical, trade, and environmen-tal implications of modifying or lifting those restrictions. The report is organized in seven sections:
1. The origin of US oil export limits. Current export restrictions were adopted during the 1970s, a period of extreme economic interventionism, including econo-my-wide wage and price controls. By 1981 the price controls on crude oil had been eliminated, but export restrictions persisted. At several points since the 1970s, presidents from both political parties have taken steps to relax these restrictions for targeted reasons—from ad-dressing excess production of heavy California crude oil to fostering free trade in energy with Canada to opening markets for Alaskan crude. The recent spike in US crude production has prompted a reevaluation of crude export restrictions as a whole.
2. What’s driving the current debate. We examine the renaissance in US oil production and how it is chang-ing the country’s energy trade position. We provide an overview of the domestic refinery system and its ability to process additional LTO. We discuss the factors deter-mining when and to what extent the current crude export restrictions will distort market outcomes on a persistent and significant basis, including the impact of the recent drop in oil prices.
3. The economic impacts of allowing exports. This section begins with a discussion of what economic the-
INTRODUCTION

NAVIGATING THE U.S. OIL EXPORT DEBATE
energypolicy.columbia.edu | JANUARY 2015 | 9
ory and empirical evidence can tell us about the impact of allowing crude exports on producers, refiners, and consumers. We review all major crude oil export stud-ies conducted to date and explain the assumptions and methodological choices that determine their findings. We identify the variables that will determine the impact of allowing crude exports on domestic production, re-fined petroleum prices, and overall economic output. We suggest a likely range of potential impacts based on both our review of existing studies and assessment of current oil market dynamics.
4. Energy security consequences. For decades, policy-makers have extolled the benefits of “energy indepen-dence.” Allowing crude exports would increase US in-tegration in global oil markets, seemingly at odds with long-held energy security objectives. We stress-test past energy security assumptions and evaluate both the pros and cons of greater energy interdependence.
5. Geopolitical and trade policy considerations. We examine the consistency of current crude export restric-tions with existing international trade commitments and implications for current and future trade talks. We review the broader geopolitical implications of allowing crude exports, including the impact on US diplomatic leverage and specific bilateral relationships.
6. Environmental risks. We discuss the local environ-mental risks associated with domestic tight oil produc-tion, and quantify the potential impact on global green-house gas (GHG) emissions of allowing crude exports.
7. Policy options. We describe the policy tools available to policymakers to modify current export restrictions if they choose to do so, including both congressional and administrative actions.
Although the United States will likely remain a net crude importer for the foreseeable future, there are growing concerns about the ability of the US refining system—much of which is currently configured to process heavy, sour imported crude—to absorb rapidly growing domestic light tight oil (LTO) production.

NAVIGATING THE U.S. OIL EXPORT DEBATE
10 | CENTER ON GLObAL ENERGY POLICY | COLUMbIA SIPA
THE ORIGIN OF OIL EXPORT RESTRICTIONS
The 1970s shook the oil industry to the core and brought en-ergy security to the fore of American public consciousness. Re-source nationalization, the end of the dominance of the “Seven Sisters” international oil companies, the Arab oil embargo, and the revolution in Iran redrew the global energy map.
These events in the 1970s are often credited with giving rise to concerns about oil “scarcity” that ultimately led to restrictions on the export of oil. But the seeds of the oil ex-port ban were sown years earlier. Preceding the export ban was more than a decade of oil import restrictions aimed at addressing the threat to US producers posed by cheap Middle East crude. Despite these protections, US oil pro-duction peaked in 1970 and began a decades-long decline.
The peak in production immediately preceded a series of far-reaching economic measures by President Nixon to fight rising inflation, rising unemployment, and a growing US
balance of payments deficit. Nixon started by taking the US dollar off the gold standard and followed up with econo-my-wide price and wage controls. Oil exports were not an issue at first, as the price of crude within the United States was higher than international levels. After the 1973 Arab oil embargo, however, international crude prices soared, giv-ing US producers an incentive to sell their crude abroad. To defend domestic price controls, the government introduced oil export restrictions. While price controls have long since been abandoned, oil export restrictions persist.
WHERE OIL TRADE RESTRICTIONS GOT THEIR START
While current export laws date back to the 1970s, the United States began restricting oil trade in the 1950s. At that time cheap oil from Venezuela and the Middle East
-2,000
0
2,000
4,000
6,000
8,000
10,000
12,000
1920
1925
1930
1935
1940
1945
1950
1955
1960
1965
1970
1975
1980
US Net Imports of Crude Oil US Crude oil production
Figure 1: US crude oil production and net crude oil imports 1920–1980(1,000s b/d)
Source: EIA.

NAVIGATING THE U.S. OIL EXPORT DEBATE
energypolicy.columbia.edu | JANUARY 2015 | 11
was making its way to US shores in rising volumes, threat-ening more expensive domestic production (Figure 1). In response, President Eisenhower limited imports of crude oil, refined fuel, and unfinished oils under the Mandato-ry Oil Import Program (MOIP) in 1959.4 The rationale behind the import restrictions was that “crude oil and the principal crude oil derivatives and products are being im-ported in such quantities and under such circumstances as to threaten to impair the national security.”5 The concern was not just increased US import dependence, but also that domestic production capacity would wither in the face of the surplus of foreign supply. MOIP import limits resulted in up to a 70 percent premium for US oil relative
to oil produced in the Middle East and spurred an increase in domestic oil production.6 US crude output rose by near-ly 2.6 million b/d between 1959 and 1970,7 the second largest expansion in US history, behind only the nearly 3.6 million b/d increase in US crude production over the last five years.8 While protectionist measures did result in greater US production, critics argued they also resulted in excessive resource depletion, created “deadweight” eco-nomic losses, facilitated an unjustified transfer of wealth to refiners who were allocated import rights and could thus obtain cheaper international crude, and drove up prices for US consumers relative to those in other nations.9
The Nixon administration’s ninety-day freeze on prices, including oil, in August 1971 was Phase I of what came to be a four-phase program of price controls.1 The price controls applied to more than just oil, but oil was usually treated differently than other goods during each subse-quent phase. Phase II of the price controls in November 1971 were more flexible than Phase I by allowing prices to be raised to reflect increases in input costs, but oil prices were effectively frozen at Phase I levels. Oil supply issues became more acute, and regional heating oil shortages emerged in the winter of 1971. Gasoline shortages hit in the summer of 1972.2 And the heating oil shortages were repeated in the winter of 1972–1973, especially in inland areas without access to imported products.3 In early 1973, the economy-wide price control regime had moved to Phase III, which was a voluntary version of the Phase II controls. Under this voluntary system, the ongo-ing heating oil shortage resulted in a very sharp increase in heating oil prices. As a result, in March 1973 the admin-istration set a special rule reimposing strict price controls on the twenty-three largest oil companies (accounting for 95 percent of oil sales).4
The large firms subject to these Phase III price controls had a reduced incentive to import oil because they could not pass along the increasing prices for imported crude oil, and a reduced incentive to invest in expanding production, which contributed to the supply crunch. Moreover, smaller producers and refiners were exempt from price controls, providing them with a competitive advantage and leading
to increased calls for the federal government to become involved in not just setting prices of oil products but in regulating a “fair” allocation of oil.
In response to generally rising prices through the first half of 1973, the Nixon administration instituted a sixty-day economy-wide price freeze from June to August 1973. After August 1973, the price control system moved to Phase IV, again with the petroleum industry subject to a separate set of more stringent price controls.
The core of these Phase IV price controls on oil was a two-tiered pricing system for domestic crude oil. To try to re-move the disincentive for investing in more production, the system distinguished between “old oil” and “new oil.” Old oil was that from fields already in production, while new oil was that from fields in which the government was hop-ing to spur development.5 The price for old oil was con-trolled, but the price for new oil was not (imported oil also remained uncontrolled).6 To administer the system, the federal government had to become heavily involved in ad-ministering an increasingly complex set of allocation rules.
These Phase IV oil price controls and allocation rules were later codified and extended by the Emergency Petroleum Allocation Act of 1973, passed in November 1973.
Price controls remained in place until President Carter be-gan to phase them out in 1979, part of an effort to boost domestic production, with President Reagan completing their elimination in 1981.
A BRIEF HISTORY OF OIL PRICE REGULATION

NAVIGATING THE U.S. OIL EXPORT DEBATE
12 | CENTER ON GLObAL ENERGY POLICY | COLUMbIA SIPA
Despite artificially high domestic oil prices, US consump-tion grew rapidly. US gasoline demand expanded by 46 percent between 1960 and 1970 due to overall economic growth, suburbanization, and the proliferation of large, inefficient passenger vehicles.10 Increasing amounts of pe-troleum products were also being used in factories, pow-er plants, and homes, partly in response to air pollution concerns that prompted utilities to switch from coal to less-polluting oil.11
INFLATION AND PRICE CONTROLS
The first signs of an oil supply crunch were already emerg-ing by 1970, with warnings about potential brownouts, blackouts, and fuel rationing in some regions.12 US crude production peaked in 1970 at just over 9.6 million b/d. In March 1971, for the first time in a quarter century, the Texas Railroad Commission allowed all-out production at 100 percent of its capacity, a historic watershed in the US oil industry that ended the practice of holding actual pro-duction below capacity, providing the world with a securi-ty reserve that could be called on in times of emergency.13
As oil production headed into its long decline, and de-mand showed no sign of slowing, it was clear that imports would have to make up a larger proportion of US supply. In recognition, import quotas under the MOIP began to be relaxed throughout 1970 to bring in more oil supplies.14 Imports as a share of total oil consumption thus rose from 19 percent in 1967 to 36 percent in 1973.15
At the same time, the economy was experiencing wor-rying levels of inflation (as high as 6 percent annually in 1970),16 high levels of unemployment, and a sharp dete-rioration in the US balance of payments. With political pressure mounting to address these economic issues and an election looming in 1972, President Nixon took several unprecedented economic steps. On August 15, 1971, he announced a plan that included taking the US off the gold standard, and instituting a 90-day economy-wide freeze on wages and prices—including on oil.17 The temporary freeze turned into a program of various price and wage control measures that persisted for the next three years—and continued for the next decade for crude oil (See box, “A Brief History of Oil Price Regulation”).18
$0
$5
$10
$15
$20
$25
$30
$35
$40
1968
1969
1970
1971
1972
1973
1974
1975
1976
1977
1978
1979
1980
US domestic nominal US imported nominal
Figure 2: Prices paid by US refiners for domestic and imported crude oil In nominal US dollars/barrel
Source: EIA, “Crude Oil Refiner Acquisition Costs.”

NAVIGATING THE U.S. OIL EXPORT DEBATE
energypolicy.columbia.edu | JANUARY 2015 | 13
THE EMERGENCE OF EXPORT RESTRICTIONS
Even before the Arab oil embargo caused an oil scarcity panic, the phrase “energy crisis” had already emerged as part of the American political vocabulary along with growing concern that a major supply problem loomed.19 In April 1973 Nixon delivered his second energy mes-sage to Congress outlining additional measures to spur greater development of all domestic energy resources and improving conservation measures. For oil, he not only discussed greater domestic production but an-nounced that he was abolishing the import quota sys-tem because domestic supply could no longer keep up with demand.20
Then, in October 1973, the Arab oil embargo jolted the energy system by taking 5 million b/d off the world oil market at a time when demand was growing at an annual rate of nearly 8 percent.21 As concerns about energy sup-plies swelled, President Nixon announced Project Inde-pendence, which laid out conservation measures and plans to develop reserves in an effort to make the country energy independent by 1980.
When President Nixon had first imposed petroleum price controls, domestic US crude prices (around $3.50 per barrel) were higher than the prevailing global oil price (at less than $3 per barrel in 1970). By 1974, glob-al oil prices had risen to $12.52 per barrel while domes-tic oil prices averaged $7.18, thus creating an incentive for producers to look abroad to sell at higher prices, which would have undermined the price control system (Figure 2).
The Emergency Petroleum Allocation Act of 1973
The Emergency Petroleum Allocation Act (EPAA) of 1973, passed on 27 November 1973, codified and ex-tended the complex set of Phase IV oil price controls and allocation regulations that had been adopted earlier that year.22 The EPAA also determined that “shortages of crude oil, residual fuel oil, and refined petroleum product caused by inadequate domestic production, environmental con-straints, and the unavailability of imports sufficient to sat-isfy domestic demand, now exist or are imminent.”23 The stated purpose of the EPAA was to authorize and direct the president to exercise specific temporary authority to deal with the artificial oil shortage by allocating oil sup-plies, including ensuring that such supplies were allocated
to end users in the United States. To implement the export restriction in the act, crude oil was controlled for short supply reasons under the Export Administration Act of 1969, which authorized the president to limit exports of resources determined to be scarce. This action subjected exports of crude and refined products to regulation and licensing by the Bureau of East West Trade (predecessor to the Bureau of Industry and Security [BIS]), which would allocate limited oil exports to countries based on preexist-ing trade relations.24
The Trans-Alaska Pipeline System Act
The Trans-Alaska Pipeline System (TAPS) Act sought to speed up development of Alaska’s vast North Slope re-sources, which had been discovered in 1968. The devel-opment of those resources had been held up in part by environmental concerns regarding their extraction and in part by a debate over the pipeline route that would be used to get the crude to market.
Lawmakers from the northern Midwest favored a pipe-line through Canada, which would feed regional refin-eries. Proponents of an alternative pipeline to a port at Valdez, Alaska, argued that this would be the quickest way to get crude to market. Opponents argued that a sea route meant some of the oil would end up in Japan, the market where it would likely fetch the highest price. Indeed, a 1971 study by the Department of the Interior found that British Petroleum, which owned 50 percent of the Prudhoe Bay field reserves, had signed an agreement with a group of Japanese oil companies “which would include marketing an undisclosed amount of (Alaskan) crude oil in Japan.”25
The compromise TAPS Act, passed shortly before the EPAA in 1973, selected the route to the Port of Valdez and amended the Minerals Leasing Act (MLA) of 1920 to forbid the export of crude from any pipeline granted rights of way through Section 20 of that act, subject to some exceptions discussed later.26
The act allowed some exports with countries bordering the United States, exports of convenience of transport (i.e., through the Panama Canal to the US Gulf Coast),27 or ex-changes for equal quantities of crude oil for the efficiency of trade, which helped protect the vital Canadian-US cross border trade.28

NAVIGATING THE U.S. OIL EXPORT DEBATE
14 | CENTER ON GLObAL ENERGY POLICY | COLUMbIA SIPA
CONGRESS MAKES OIL EXPORT RESTRICTIONS PERMANENT
While the Arab oil embargo ended in March 1974, height-ened political attention to oil shortages and security of supply persisted. President Gerald Ford highlighted energy independence in his 1975 State of the Union message and signed the Energy Policy and Conservation Act (EPCA) into law in December 1975. EPCA expanded the two-tiered oil pricing system into a three-tiered system, created the Strategic Petroleum Reserve, made the United States a member of the International Energy Program (IEP) through the newly formed International Energy Agency, and increased fuel efficiency requirements. It also direct-ed the president to “promulgate a rule prohibiting the ex-port of crude oil and natural gas produced in the United States,” with some exceptions, including those necessary for participation in the IEP. This was a more direct statu-tory export prohibition than that in the EPAA.
EPCA provided authority and discretion to the president by allowing him to make a “class of seller or purchaser, country of destination, or any other reasonable classification or basis as the President determines” exempt from the ban, as long as it is determined to be in the national interest and align with the purpose of EPCA. In considering the national interest, the presidential finding must take into account that EPCA does not interfere with exchanges of crude oil with foreign governments or persons for the convenience of increased efficiency of transportation, temporary exports for conve-nience or increased transport efficiency and which will later be reimported, or historical trading relations with Canada and Mexico. With respect to price controls for crude oil, EPCA gave the president the authority to loosen them and to do away with them entirely anytime after 1979.
As the government moved to create laws governing the development of oil and natural gas resources, it expanded efforts to increase domestic production through the Naval Petroleum Reserve Production Act (NPRPA) of 1976 and the Outer Continental Self Lands Act (OCSLA) Amend-ments of 1978. In all these cases, production is “subject to all of the limitations and licensing requirements of the Ex-port Administration Act.” And exports are only permitted if the president finds such exports “are in the national interest” and “will not diminish the total quantity or quality of petro-leum available in the United States” or, in the case of OCS-LA, “will not increase reliance on imported oil or gas.”29
THE EVOLUTION OF EXPORT RESTRICTIONS THROUGH EXECUTIVE BRANCH ACTION
Findings by both the president and the secretary of com-merce subsequently altered these laws. President Jimmy Carter announced in June 1979 a phased decontrol of oil prices as part of an effort to stimulate domestic production, while international oil prices spiked from $14 a barrel to $35 a barrel in early 1981 following the Iranian Revolution.30 In his first executive order upon entering office in 1981, President Ronald Reagan finished the job by eliminating the remaining price controls for oil and refined products.31
In October 1981 the Department of Commerce removed quantitative limits on the export of all refined products. An interagency task force had concluded that allowing exports of refined products would be in the national interest, that the domestic economy was no longer threatened by excessive drain of a scarce natural resource, and that US consumers would benefit if refiners had greater marketing flexibility.32
In 1985 President Reagan determined export of crude oil to Canada for internal consumption was in the national interest, as part of a declaration liberalizing energy trade between the two countries. The findings were made un-der EPCA, Section 28 of the MLA, the Trans-Alaska Pipe-line Authorization Act, and the OCSLA.33 Notably, crude transported over the Trans-Alaska Pipeline or derived from the Naval Petroleum Reserves was excluded.
Using authority delegated by the president pursuant to section 103 of EPCA in 1976, the secretary of commerce determined (also in 1985) that exports of crude oil from Alaska’s Cook Inlet were in the national interest and should not be subject to the restrictions in EPCA, NPRPA, OCS-LA, or MLA. The finding cited the incentives that would be created for exploration and development of domestic crude, transportation, and for the energy security of our al-lies, and said the initiative “will also encourage other coun-tries to remove trade barriers to US goods and services. It does not affect our energy security as we retain the flexibil-ity to react to changes in the world’s available oil supply.”34
In 1988 President Ronald Reagan allowed certain addi-tional oil exports to Canada as part of the United States–Canada Free Trade Agreement. Up to 50,000 b/d of crude transported over the Trans-Alaska Pipeline were allowed to be shipped to Canada, as well as oil derived from the Na-tional Petroleum Reserves.35

NAVIGATING THE U.S. OIL EXPORT DEBATE
energypolicy.columbia.edu | JANUARY 2015 | 15
In 1992 President George Bush found that exports of heavy California crude (API of 20 degrees or lower) of up to 25,000 b/d were in the national interest.36 Production of heavy California crude had eclipsed the ability of the state’s refiners to process that quality crude, resulting in a surplus that was driving down prices at the same time that the world oil price had crashed. The California Indepen-dent Petroleum Association at the time noted that demand for the crude in the state was also weakening due to new state air quality restrictions, and that due to the Jones Act tanker laws, the heavy California crude could not be mar-keted into the US East Coast competitively against foreign heavy crude.37 Rather than abandon certain wells, the ex-port outlet was deemed to provide a potential price boost that would make continued production economic.
Exports of crude oil from Alaska’s North Slope were al-lowed under a finding by President Bill Clinton in 1996, which stated that exports of crude oil that had been trans-ported over rights-of-way granted in Section 203 of the Trans-Alaska Pipeline Authorization Act were in the na-tional interest.38 The finding followed the passage of a law by Congress in 1995 that authorized such exports subject to a presidential determination. Along with determina-tions that the exports would not diminish the total quan-tity or quality of oil available to the United States and that it would not cause shortages or sustained oil price increases significantly above world market levels, it was noted in the Federal Registry that only US-flagged and -owned ves-sels (but not necessarily US-built) were allowed to carry TAPS oil for export. Critics of the ban on ANS exports had attacked it on claims that development of Alaskan oil was restricted, as prices into the domestic market did not promote production and were limiting economic and jobs growth. The General Accounting Office found in a 1999 study that lifting the ban resulted in higher Alaskan North Slope and California oil prices than would otherwise have been the case, and thus “future production should increase because the ban was lifted.”39
CURRENT REGULATIONS GOVERNING PETROLEUM EXPORTS
Crude oil
Current BIS regulations reflect these various administra-tive decisions over the years to create specific categories of
allowable exports of crude oil. Crude oil exports are not allowed unless they fit into one of the following categories, for which an export license from BIS is required, or upon an individualized showing that export is in the national interest:40
• Exports from Alaska’s Cook Inlet
• Exports to Canada for consumption or use therein
• Exports in connection with refining or exchange of strategic petroleum reserve oil
• Exports of heavy California crude oil up to an av-erage volume not to exceed 25,000 b/d
• Exports that are consistent with certain interna-tional agreements
• Exports that are consistent with findings made by the president under an applicable statute
• Exports of foreign origin crude oil where the ex-porter can demonstrate that it has not been com-ingled with oil of US origin
• Exports pursuant to an exchange meeting statu-tory criteria
As noted above, exports from Alaska’s North Slope are also permitted under a license exemption. (The regulations re-fer to exports transported by pipeline over rights of way granted via the Trans-Alaska Pipeline System, which covers only Alaska North Slope crude.)
If the application to BIS falls within one of these categories, it is presumed to be permissible and is generally granted in a timely fashion. The largest category of exports is typi-cally to Canada. There have also been increasing volumes of foreign crude (mainly from Canada) that have been re-exported from the United States. These require that the exporter can demonstrate to BIS that the oil has not been commingled with oil of US origin. Recent reports have noted that Canadian crude has been re-exported, albeit in relatively small amounts, to Italy, Singapore, Spain, and Switzerland.41
Beyond these permitted categories, BIS will also review other applications on a case-by-case basis and “generally will approve such applications if BIS determines that the proposed export is consistent with the national interest

NAVIGATING THE U.S. OIL EXPORT DEBATE
16 | CENTER ON GLObAL ENERGY POLICY | COLUMbIA SIPA
and the purposes of the Energy Policy and Conservation Act (EPCA).” BIS explains that certain kinds of transac-tions will be considered to meet that standard, the most important of which are swaps.
According to BIS, a swap is in the national interest when it:
• will result directly in the importation into the US of an equal or greater quantity and an equal or bet-ter quality (emphasis added) of crude oil or of a quantity and quality of petroleum products . . . that is not less than the quantity and quality of commodities that would be derived from the re-fining of the crude oil for which an export license is sought;
• will take place only under contracts that may be terminated if the petroleum supplies of the US are interrupted or seriously threatened; and
• in which the applicant can demonstrate that, for compelling economic or technological rea-sons that are beyond the control of the appli-cant, the crude oil cannot be reasonably mar-keted in the US.
There is considerable uncertainty as to precisely how this regulatory language might be implemented. It may be challenging for applicants to demonstrate that the crude could not be reasonably marketed in the United States for “compelling economic or technological reasons.” After all, there is some price at which refiners will take the crude (ei-ther making necessary capital investments in equipment to run more light crude and/or reducing total throughput), raising the question of how large the differential needs to be between US and world crude prices to be a “compelling economic reason.”
Additionally, light oil is typically valued more highly than heavy oil in the global market and thus could be consid-ered better quality. In the United States, however, signifi-cant refinery investments have been made to process heavy crude (see following section). As a result, exchange appli-cations may have difficulty demonstrating that the heavy oil being imported is of “equal or better quality” than the light oil being exported. This may be addressed, potential-ly, by importing more heavy crude than the export vol-ume, demonstrating the better margin yield for domestic refiners of processing imported heavy oil, or by importing product rather than crude.
In September of 1979, Congress passed the renewal of the Export Administration Act, which regulates exports of dual-use goods and technologies (i.e., goods with civilian uses that could also “contribute to the military potential” of other countries), and exports of scarce goods to pro-tect the economy from the “excessive drain” of scarce materials. The 1979 EAA did not independently repeat the export restriction on domestically produced crude oil, as that restriction was already in place pursuant to EPCA.
Licenses are controlled by the department’s Bureau of In-dustry and Security, and the rules of licensing are spelled out in the Export Administration Regulations, which im-plement the provisions of the EAA’s short supply control list. While EPCA directs the president to restrict crude oil exports, it is through the authority granted by the EAA to the president that BIS promulgated regulations to control
exports for national short supply purposes, as well as na-tional security and foreign policy.
Over the years, the number of goods controlled for short supply reasons has dwindled. Short supply controls cur-rently cover only crude oil, unprocessed western red ce-dar from federal or state lands under harvest contracts entered into after 30 September 1979 (excluding unpro-cessed western red cedar timber harvested from public lands in Alaska, private lands, and Indian lands), and horses exported by sea for the purpose of slaughter.
The 1979 EAA expired in 1989 but has been reautho-rized several times over the years. The last reauthoriza-tion expired in 2001, and it has since been extended by presidents using the authority granted in the International Emergency Economic Powers Act through a declaration of national emergency.1
BIS ADMINISTRATION EXPORT LICENSES FOR SHORT SUPPLY CONTROLS

NAVIGATING THE U.S. OIL EXPORT DEBATE
energypolicy.columbia.edu | JANUARY 2015 | 17
For most of these categories of permissible exports, a li-cense is required from BIS. That licensing process is not public, so we do not know how many licenses have been granted or how many applications have been submitted. The lack of transparency is due to the sensitive national se-curity issues, such as dual-use technologies, that BIS often deals with in its licensing regime, as well as the commercial sensitivity of crude oil export licenses that are granted on a cargo-by-cargo basis. This is in contrast, for example, to the public approval process for natural gas exports, which are granted for a period of time to a particular entity.
Refined products
Refined product exports are allowed and do not require a license. This means that the distinction between “crude oil” and “refined products” is crucial to current export policy.
Under BIS regulations, the distinction between crude oil and refined products turns on whether the liquid hydro-carbons at issue have been processed through a crude dis-tillation tower. In the regulations,42 crude oil is defined as a mixture of hydrocarbons that:
• existed in liquid phase in underground reservoirs;
• remains liquid at atmospheric pressure after pass-ing through surface separating facilities; and
• which has not been processed through a crude oil dis-tillation tower (emphasis added).
According to this definition, any liquid hydrocarbon that has been through a crude oil distillation tower is not crude oil, and therefore can be exported without a license. In-deed, as discussed in the following section, the United States today is the largest refined petroleum exporter in the world. Product exports are mostly out of the Gulf Coast, while product imports are mostly to the East Coast.43
Generally, people had understood the requirement of processing through a distillation tower to equal being processed through a full-fledged refinery, or at least to be separated into multiple, unfinished product streams. Re-cently, various companies have been investing in less ex-pensive condensate splitters (costing hundreds of millions of dollars as opposed to billions of dollars for a full-fledged refinery) along the Gulf Coast to process crude oil for ex-port. And, as explained in the next section, at least two recent BIS classification rulings indicate that even simpler processing of stabilization followed by treatment through a distillation tower qualifies very light crude oil, known as “condensate,” for export as a refined product.
On 30 December 2014, BIS issued a set of FAQs that identified six factors it will consider, among others, in de-termining whether liquid hydrocarbons have been “pro-cessed through a crude oil distillation tower.”44 In short, BIS requires that the distillation process materially trans-form the crude oil inputs into a chemically distinct output that is of different API gravity and has a particular purpose other than just making the crude exportable, such as use as feedstock, diluent or gasoline blend stock.
While it will be necessary to see how BIS applies these criteria in practice in order to fully understand their im-pact, the new FAQs make clear a few important points. First, BIS has clearly indicated that “processes that uti-lize pressure reduction alone to separate vapors from liquid or pressure changes at a uniform temperature, such as flash drums with heater treaters or separators, do not constitute processing through a crude oil distilla-tion tower.” Second, it is clear that companies may now export lightly processed condensate that has been both stabilized and processed through a field distillation tow-er, as was approved in the summer of 2014 for at least two other companies (discussed in the next section).
Under BIS regulations, the distinction between crude oil and refined products turns on whether the liquid hydrocarbons at issue have been processed through a crude distillation tower.

NAVIGATING THE U.S. OIL EXPORT DEBATE
18 | CENTER ON GLObAL ENERGY POLICY | COLUMbIA SIPA
Indeed, given that a license is not needed to export re-fined product, the new BIS FAQs should make it easi-er for other companies, including the many reportedly with pending classification requests at BIS, to self-cer-tify their cargoes as available for export and bypass BIS classification rulings altogether. Third, although much of the commentary around the new FAQs focused on their impact on condensate exports, with projections of condensate exports in the range of 300,000 to 500,000 b/d,45 the language of the FAQs applies to all liquid hy-drocarbons, and it remains to be seen whether simple processing with a distillation tower of light oil (e.g., 40 or 45 API gravity) would also be sufficient to make the light oil exportable as refined product.
Condensate
Condensate is very light hydrocarbon liquid. While there is no precise definition, it is generally considered to be higher than 50 degrees API gravity.46 Condensate is treated differently for export purposes depending on its source—even if the liquid from the different sources are chemically essentially the same thing. Condensate that comes straight off a wellhead—so-called lease condensate—is considered crude oil from the perspective of BIS regulations and thus is not exportable without a license.47 “Plant condensate”48 that results from the processing of natural gas, on the other hand, is allowed to be exported.
Recently, BIS issued at least two classification rulings49 to Pioneer Natural Resources and Enterprise Product Part-ners that, according to public reports of the nonpublic rul-ings, found that Eagle Ford condensate that has been both stabilized and processed through a field distillation tower50 is considered refined product and, thus, can be exported. The reports of these rulings took many by surprise because this is a much simpler process than that used in a full-fledged refinery.
There remains some uncertainty about how much pro-cessing of the condensate is required to classify it as a refined product rather than crude oil. As discussed in the prior section, that uncertainty was significantly mitigated by recent FAQs released by BIS that seem to make clear that the sort of lightly processed condensate approved for export by Pioneer and Enterprise will be permissible for others to export as well. This clarification is import-ant because stabilization and field distillation towers are
much cheaper than splitters, hydroskimmers, or distilla-tion towers at refineries.
Some observers have noted that potential conflict exists with BIS treatment of lease condensate as crude oil in the first place since the BIS regulations state that crude oil “ex-isted in liquid phase in underground reservoirs.” But most lease condensate exists in a gas phase underground and condenses at atmospheric conditions.51 This legal claim may face difficulty, however, because the BIS regulations explicitly include “lease condensate” in the definition of crude oil.52

NAVIGATING THE U.S. OIL EXPORT DEBATE
energypolicy.columbia.edu | JANUARY 2015 | 19
THE US OIL BOOM
While US oil export restrictions have evolved gradually over the past forty years, US oil market conditions changed dramatically over the past few years, prompting a reevalua-tion of export restrictions in their entirety. The application of hydraulic fracturing, horizontal drilling, and seismic imaging to tight oil formations has catalyzed a renaissance in US oil production. After peaking at 11.3 million b/d in 1970, US production began a multi-decade decline, falling to 6.8 million b/d in 2006.53 US oil demand grew by 6 million b/d over the same period, leaving the country de-pendent on imports for up to 60 percent of total supply.54 Since 2008, however, US oil production has recovered dra-matically. Crude supply is up more than 3.8 million b/d as of September 2014, to 8.86 million b/d, with significant
gains in 2012, 2013 and 2014.55 Production of oil-like natural gas liquids (NGLs) from shale and other gas wells has doubled from 1.7 to 3.3 million b/d, bringing the total US supply to 11.9 million b/d.56 This surge has entirely erased the previous multidecade decline (Figure 3).
While US oil supply has grown, demand has declined nearly 1.8 million b/d since 2006.57 Vehicle efficiency has improved significantly due to both high oil prices and new federal fuel economy standards.58 Changing driving pat-terns have limited the growth of vehicle usage.59 Tax incen-tives and federal mandates for ethanol have further eroded the domestic market for gasoline.60
In the face of falling demand, the surge in domestic crude production has translated into a sharp reduction in the US
THE CURRENT DEBATE OVER EXPORTING US OIL
0
2,000
4,000
6,000
8,000
10,000
12,000
14,000
16,000
1973
19
74
1975
19
76
1977
19
78
1979
19
80
1981
19
82
1983
19
84
1985
19
86
1987
19
88
1989
19
90
1991
19
92
1993
19
94
1995
19
96
1997
19
98
1999
20
00
2001
20
02
2003
20
04
2005
20
06
2007
20
08
2009
20
10
2011
20
12
2013
20
14
Production
Net Imports
Figure 3: US oil production and net imports 1973–2014Crude, condensates and NGLs, 1,000s b/d
Source: EIA, Monthly Energy Review, December 2014.

NAVIGATING THE U.S. OIL EXPORT DEBATE
20 | CENTER ON GLObAL ENERGY POLICY | COLUMbIA SIPA
petroleum trade deficit. In 2006 the United States imported more than 12 million b/d, on net, of crude oil and refined petroleum products (Figure 3). During the first three quarters of 2014, that number fell to 5.2 million b/d. As discussed above, there is no legal restriction on the export of refined pe-troleum products, and in less than a decade the United States has gone from being the world’s largest product importer to the largest exporter of refined products on a gross basis (and second largest on a net basis).61 In 2006 the United States imported 2.5 million b/d of net gasoline, diesel, fuel oil, and other petroleum products (Figure 4). During the first three quarters of 2014, the United States exported 2.2 million b/d net. Net US crude imports have fallen from 10.1 million b/d to 7.1 million b/d over the same period.
GETTING THE OIL TO MARKET
This dramatic turnaround in US oil production has upend-ed the domestic oil transportation system. When US crude production was declining, most new pipeline and refinery investments were made to facilitate the transport and pro-
cessing of imported crude. Pipelines were built out to move crude from the US Gulf Coast to refineries in the Midwest. More than half of all US refining capacity is located along the US Gulf Coast (Table 1) known as the “PADD 3” region in the oil industry (see separate box on the PADD system), close to large import terminals. Another quarter of US ca-pacity is on the East and West Coasts (PADD 1 and PADD 5 respectively). That leaves a little less than a quarter of US capacity in interior states (PADD 2 and PADD 4), where much of the recent surge in US oil production has occurred.
As these “Midcontinent” refineries became quickly saturat-ed with domestic crude, much of it produced in the Bakken region of nearby North Dakota, producers began seeking out other markets.62 Over the past few years pipelines run-ning from the Gulf of Mexico inland have been reversed, and midstream companies have scrambled to build addi-tional capacity. In the absence of sufficient pipeline capacity, producers have returned to shipping oil by rail, a practice previously abandoned due to relatively high transportation costs (Figure 5). Rail shipments have given East Coast and, increasingly West Coast, refineries access to domestic crude.
-6,000
-4,000
-2,000
0
2,000
4,000
6,000
8,000
10,000
12,000
1973
19
74
1975
19
76
1977
19
78
1979
19
80
1981
19
82
1983
19
84
1985
19
86
1987
19
88
1989
19
90
1991
19
92
1993
19
94
1995
19
96
1997
19
98
1999
20
00
2001
20
02
2003
20
04
2005
20
06
2007
20
08
2009
20
10
2011
20
12
2013
20
14
Crude Oil
Refined Products
Figure 4: Crude and refined product net imports1,000s b/d
Source: EIA, Monthly Energy Review, December 2014.

NAVIGATING THE U.S. OIL EXPORT DEBATE
energypolicy.columbia.edu | JANUARY 2015 | 21
The lag between domestic production and take-away capacity to move oil from the Midcontinent to the Gulf Coast resulted in a sizeable discount for inland crude prices, such as West Texas Intermediate (WTI), the US oil benchmark priced in Cushing, Oklahoma, and coast-al crude prices, such as the Louisiana Light Sweet (LLS) crude produced offshore in the Gulf of Mexico (Figure 6). Between 2011 and 2013, WTI sold for $15 per barrel less
on average than LLS because of WTI’s relatively limited market opportunities. As transportation bottlenecks have improved, and inland producers are able to get their prod-uct to Gulf Coast refineries, that price gap has closed. But due to the nature of those Gulf Coast refineries, many of which have invested heavily to process specific kinds of imported crude oil, there are concerns about how much domestic crude they can absorb.
Region Nelson
Complexity Index63
Bottom of the Barrel Index64
Sulfur Content (%)
API Gravity (degrees)
Capacity (operable, 1,000 b/d)
Production (gross input,
1,000 b/d) Utilization Rate (%)
PADD 1 8.99 0.44 0.76 34.40 1,295 1,079 83.3
PADD 2 9.88 0.52 1.45 33.14 3,769 3,378 89.6
PADD 3 11.57 0.58 1.52 30.03 9,094 8,154 89.7
PADD 4 8.50 0.41 1.42 34.00 630 580 92.1
PADD 5 11.16 0.64 1.39 27.76 3,029 2,533 83.6
US TOTAL 10.84 0.56 1.43 30.79 17,818 15,724 88.2
Table 1: US refining capacity (2013)
Source: Oil & Gas Journal, EIA and Rhodium Group estimates.
2,86
0
2,49
8
2,83
2
2,65
0
3,39
5
6,78
4
8,58
3
10,8
43
11,3
24
11,3
89
16,7
89
26,2
47
36,5
44 51
,474
64,6
58 81
,024
97,1
35
108,
605
92,3
12 10
8,59
0
110,
164
119,
634
0
20,000
40,000
60,000
80,000
100,000
120,000
140,000
Q1
2009
Q2
2009
Q3
2009
Q4
2009
Q1
2010
Q2
2010
Q3
2010
Q4
2010
Q1
2011
Q2
2011
Q3
2011
Q4
2011
Q1
2012
Q2
2012
Q3
2012
Q4
2012
Q1
2013
Q2
2013
Q3
2013
Q4
2013
Q1
2014
Q2
2014
Figure 5: Crude by railOriginated carloads of crude oil on Class I railroads
Source: American Association of Railroads.

NAVIGATING THE U.S. OIL EXPORT DEBATE
22 | CENTER ON GLObAL ENERGY POLICY | COLUMbIA SIPA
A MISMATCH BETWEEN DOMESTIC SUPPLY AND REFINERY DEMAND
As noted in Table 1, PADD 3 refineries have more than 9 million b/d of combined refining capacity. In 2006 three-quarters of the oil they processed was imported. That has fallen to roughly half, due to growth in domestic sup-ply. Yet while PADD 3 refineries still buy around 3.9 mil-
lion b/d of crude and unfinished oils from abroad, there are limits to how much they will be willing to switch to domestically produced oil.65
Crude oil is not a single chemical compound, but rather many, many compounds that are combinations of hydro-gen and carbon atoms (i.e., hydrocarbons). Crudes pro-duced in different places have different chemical charac-
-$35
-$30
-$25
-$20
-$15
-$10
-$5
$0
$5 Ja
n-00
Ju
l-00
Jan-
01
Jul-0
1 Ja
n-02
Ju
l-02
Jan-
03
Jul-0
3 Ja
n-04
Ju
l-04
Jan-
05
Jul-0
5 Ja
n-06
Ju
l-06
Jan-
07
Jul-0
7 Ja
n-08
Ju
l-08
Jan-
09
Jul-0
9 Ja
n-10
Ju
l-10
Jan-
11
Jul-1
1 Ja
n-12
Ju
l-12
Jan-
13
Jul-1
3 Ja
n-14
Ju
l-14
Figure 6: WTI-LLS spreadUSD per barrel
Source: Bloomberg.
The United States is divided into five so-called Petroleum Administration for De-fense Districts (PADDs). These were origi-nally established during World War II with the aim of allocating petroleum products within the war economy. The administra-tion system was abolished by 1946, but PADDs are still widely used for data col-lection and statistical reporting purposes.1
THE PADD SYSTEM Figure 7: Petroleum Administration for Defense Districts (PADDs)
Source: EIA.
NAVIGATING THE U.S. OIL EXPORT DEBATE
energypolicy.columbia.edu | JANUARY 2015 | 23
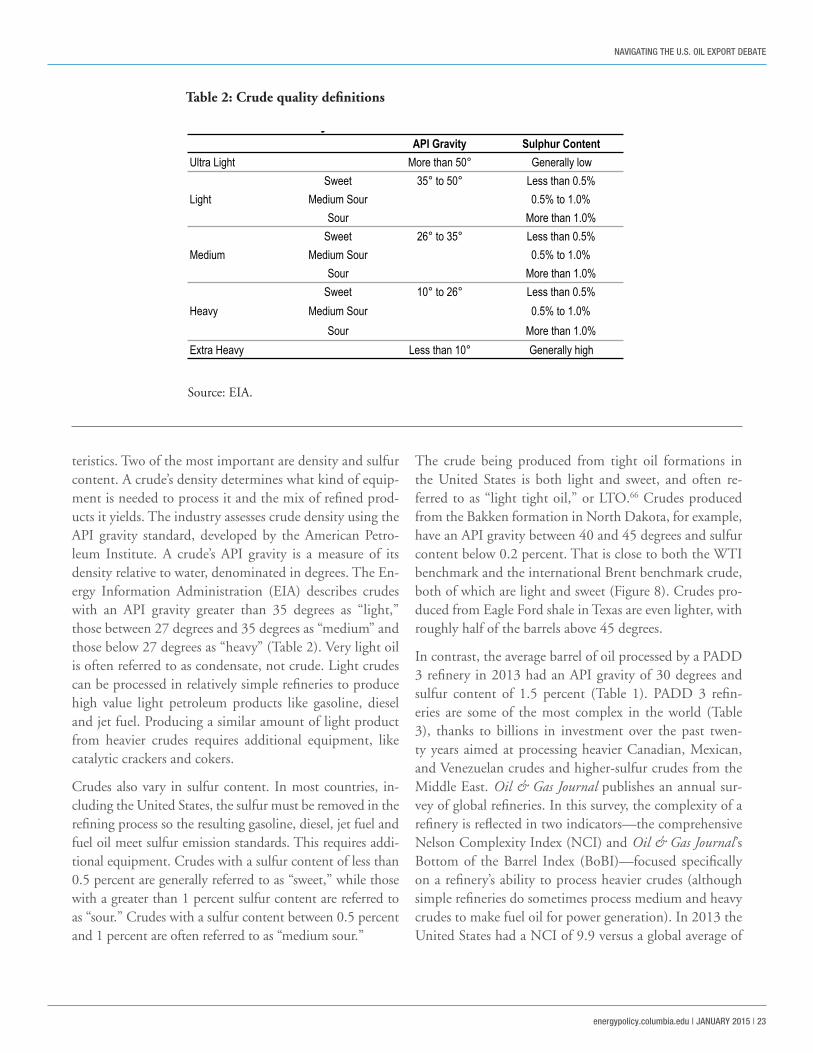
teristics. Two of the most important are density and sulfur content. A crude’s density determines what kind of equip-ment is needed to process it and the mix of refined prod-ucts it yields. The industry assesses crude density using the API gravity standard, developed by the American Petro-leum Institute. A crude’s API gravity is a measure of its density relative to water, denominated in degrees. The En-ergy Information Administration (EIA) describes crudes with an API gravity greater than 35 degrees as “light,” those between 27 degrees and 35 degrees as “medium” and those below 27 degrees as “heavy” (Table 2). Very light oil is often referred to as condensate, not crude. Light crudes can be processed in relatively simple refineries to produce high value light petroleum products like gasoline, diesel and jet fuel. Producing a similar amount of light product from heavier crudes requires additional equipment, like catalytic crackers and cokers.
Crudes also vary in sulfur content. In most countries, in-cluding the United States, the sulfur must be removed in the refining process so the resulting gasoline, diesel, jet fuel and fuel oil meet sulfur emission standards. This requires addi-tional equipment. Crudes with a sulfur content of less than 0.5 percent are generally referred to as “sweet,” while those with a greater than 1 percent sulfur content are referred to as “sour.” Crudes with a sulfur content between 0.5 percent and 1 percent are often referred to as “medium sour.”
The crude being produced from tight oil formations in the United States is both light and sweet, and often re-ferred to as “light tight oil,” or LTO.66 Crudes produced from the Bakken formation in North Dakota, for example, have an API gravity between 40 and 45 degrees and sulfur content below 0.2 percent. That is close to both the WTI benchmark and the international Brent benchmark crude, both of which are light and sweet (Figure 8). Crudes pro-duced from Eagle Ford shale in Texas are even lighter, with roughly half of the barrels above 45 degrees.
In contrast, the average barrel of oil processed by a PADD 3 refinery in 2013 had an API gravity of 30 degrees and sulfur content of 1.5 percent (Table 1). PADD 3 refin-eries are some of the most complex in the world (Table 3), thanks to billions in investment over the past twen-ty years aimed at processing heavier Canadian, Mexican, and Venezuelan crudes and higher-sulfur crudes from the Middle East. Oil & Gas Journal publishes an annual sur-vey of global refineries. In this survey, the complexity of a refinery is reflected in two indicators—the comprehensive Nelson Complexity Index (NCI) and Oil & Gas Journal ’s Bottom of the Barrel Index (BoBI)—focused specifically on a refinery’s ability to process heavier crudes (although simple refineries do sometimes process medium and heavy crudes to make fuel oil for power generation). In 2013 the United States had a NCI of 9.9 versus a global average of
API Gravity Sulphur ContentUltra Light More than 50° Generally low
Sweet 35° to 50° Less than 0.5%Medium Sour 0.5% to 1.0%
Sour More than 1.0%Sweet 26° to 35° Less than 0.5%
Medium Sour 0.5% to 1.0%Sour More than 1.0%
Sweet 10° to 26° Less than 0.5%Medium Sour 0.5% to 1.0%
Sour More than 1.0%Extra Heavy Less than 10° Generally high
Table 2: Crude Quality
Light
Medium
Heavy
Table 2: Crude quality definitions
Source: EIA.

NAVIGATING THE U.S. OIL EXPORT DEBATE
24 | CENTER ON GLObAL ENERGY POLICY | COLUMbIA SIPA
6.9, and a BoBI 0.52 vs. a global average of 0.28. Within the United States, PADD 3 refineries had a NCI of 11.6 and a BoBI of 0.58.
It is entirely possible for a complex PADD 3 refinery to pro-cess domestically produced LTO—indeed, they are process-
ing significant quantities today by blending it with other crudes. At some point, however, increasing the LTO share of the crude slate becomes economically challenging as pro-cessing limits are encountered, primarily with respect to the refineries’ capabilities to process “light ends” (e.g., naphtha,
Brent
Mexican Mayan
Bakken
Eagle Ford
WTI
Canadian Athabaska West Canadian Select
15
20
25
30
35
40
45
50
55
60
0.0 0.5 1.0 1.5 2.0 2.5 3.0 3.5 4.0
API G
ravit
y (de
gree
s)
Sulfur Content (percent)
FSU Europe North America Latin America Middle East Africa Asia Pacific
Figure 8: US crude in contextAPI Gravity (y-axis), sulfur content (x-axis), and production volume (bubble size)
Source: Energy Intelligence and Rhodium Group estimates.
Table 3: Global refining capacity (2013)
Region Number of Refineries
Capacity (operable, th bbl/d) Nelson Complexity Index Bottom of the Barrel
IndexUnited States 124 17,815 9.88 0.52Other North America 23 3,497 8.54 0.38South America 64 5,860 5.33 0.28Western Europe 94 13,582 7.67 0.27Eastern Europe 89 10,602 5.72 0.15Africa 45 3,218 4.01 0.11Middle East 44 7,393 4.27 0.14Asia Pacific 162 25,279 5.26 0.20Total 645 87,246 6.87 0.28Source: Oil & Gas Journal
Table 3: Global Refining Capacity (2013)
Source: Oil & Gas Journal and Rhodium Group estimates.

NAVIGATING THE U.S. OIL EXPORT DEBATE
energypolicy.columbia.edu | JANUARY 2015 | 25
butane, propane, and gas). Even with additional investment to run higher volumes of LTO, refineries will be challenged by the lower-valued light products that LTO yields and by the inability to fully utilize expensive downstream upgrad-ing equipment, resulting in a reduction in the quantity of some high-value products, especially diesel and jet fuel.
Since some refiners will be displacing lower cost heavy and medium crudes, idling the high cost processing equipment that allowed them to do this, they will likely require a dis-count from domestic crude producers to justify this change in crude slate. An alternative to backing out heavier im-ports in existing refineries is to build new refining capacity configured specifically for domestic LTO. Some of this has already started to occur, mostly via splitters or small ex-pansions in areas with advantaged access to the growing volumes of domestic crude, such as Montana, North Da-kota, Utah, and Texas. As crude production continues to grow, and with export restrictions still in place, additional “crude-to-product” facilities will be constructed.
New refineries come at a cost as well, however. The capital ex-penditures entailed must be recovered, either through higher refined product prices or discounted crude acquisition costs.
Uncertainty over whether the administration may change ex-isting export policies, combined with permitting and regulato-ry barriers, may also constrain additional refining investment.
WHEN DO EXPORT RESTRICTIONS BEGIN TO BITE?
Because of this mismatch between domestic crude produc-tion and United States refinery configuration, restrictions on crude exports have already begun to distort market outcomes, even though the United States remains a large crude importer on net. LLS is a light sweet crude, sim-ilar to WTI, Bakken, Eagle Ford, and the international benchmark Brent. Unlike WTI or other inland US crudes, however, there are no transportation barriers between LLS and Gulf Coast refineries. Due to this proximity, LLS has traditionally traded at a slight premium to Brent (Figure 9). In October and November of 2013, however, LLS trad-ed at a $9 discount to Brent, on average. This was due to a combination of three factors—the alleviation of trans-portation bottlenecks that brought more inland LTO to the Gulf Coast, seasonal refinery maintenance (known as “turnaround”) that reduced Gulf Coast crude demand,
-$20
-$15
-$10
-$5
$0
$5
$10
$15
Jan-
00
Jul-0
0 Ja
n-01
Ju
l-01
Jan-
02
Jul-0
2 Ja
n-03
Ju
l-03
Jan-
04
Jul-0
4 Ja
n-05
Ju
l-05
Jan-
06
Jul-0
6 Ja
n-07
Ju
l-07
Jan-
08
Jul-0
8 Ja
n-09
Ju
l-09
Jan-
10
Jul-1
0 Ja
n-11
Ju
l-11
Jan-
12
Jul-1
2 Ja
n-13
Ju
l-13
Jan-
14
Jul-1
4
Figure 9: LLS-Brent spreadUSD per barrel
Source: Bloomberg.

NAVIGATING THE U.S. OIL EXPORT DEBATE
26 | CENTER ON GLObAL ENERGY POLICY | COLUMbIA SIPA
and the loss of Libyan production that left the global mar-ket short of light crude and caused Brent crude prices to rise. Were US companies allowed to export crude, the sea-sonal weakness in domestic refinery demand would likely have been reduced by foreign demand for LTO, keeping the LLS-Brent spread more in line with historical averages.
The LLS-Brent spread closed by the end of 2013 and re-mained small during the 2014 maintenance season. This suggests the market impact of crude export restrictions has thus far been small. When export restrictions start distort-ing markets on a persistent and significant basis depends on the future rate of US crude production growth, the ability to further displace imports, and the ability to ex-pand exports currently allowed under US law.
Displacing imports
Foreign light crude (35 degrees and above) has been almost entirely backed out of the US refining complex due to the availability and cost competitiveness of domestic LTO. In
2006 the United States imported 3.3 million b/d of light crude. During the first three quarters of 2014, the United States only imported 637,000 b/d of light crude (Figure 10). The principal foreign casualty of lower US demand for imported light crude has been West African producers, Nigeria in particular. In 2006 the United States imported 1.8 million b/d of West African crude. During the first three quarters of 2014, that number fell to 273,000 b/d (Figure 11). This has put downward pressure on West Afri-can crude prices. With the Atlantic Basin now a net crude producer, West African crudes must compete with Latin American and traditional Middle East suppliers in Asia. With refining overcapacity and increasing ability to pro-cess heavy, sour oil in Asia, West African differentials have been compressed, creating an indirect benefit from the US tight oil boom for struggling European refiners who can now access light oil more cheaply.
Lighter medium crude imports (30 to 35 degrees) have also fallen, from 4 million b/d in 2006 to 2.7 million
0
1,000
2,000
3,000
4,000
5,000
6,000
Sep-
05
Dec-0
5 Ma
r-06
Jun-
06
Sep-
06
Dec-0
6 Ma
r-07
Jun-
07
Sep-
07
Dec-0
7 Ma
r-08
Jun-
08
Sep-
08
Dec-0
8 Ma
r-09
Jun-
09
Sep-
09
Dec-0
9 Ma
r-10
Jun-
10
Sep-
10
Dec-1
0 Ma
r-11
Jun-
11
Sep-
11
Dec-1
1 Ma
r-12
Jun-
12
Sep-
12
Dec-1
2 Ma
r-13
Jun-
13
Sep-
13
Dec-1
3 Ma
r-14
Jun-
14
Sep-
14
35.1 and Above 30.1 to 35.0 20.1 to 30.0 20.0 and Below
Figure 10: US crude imports by API gravity1,000 b/d, three month moving average
Source: EIA, “Petroleum and Other Liquids: Data,” 2014.

NAVIGATING THE U.S. OIL EXPORT DEBATE
energypolicy.columbia.edu | JANUARY 2015 | 27
b/d during the first three quarters of 2014. The ability of US LTO to further displace medium imports is limit-ed by the economics of blending and the willingness of some Persian Gulf producers to lose US market share. Saudi Arabia, for example, has reduced exports to the United States but continues to demonstrate an interest in retaining a significant foothold in the US market—to maintain diversity of buyers, to supply the massive Mo-tiva refinery on the Gulf Coast (which is half-owned by Saudi Aramco, the country’s national oil company), and potentially for strategic considerations.67 Iraqi, Mexican and Venezuelan crude exports to the United States face similar challenges, and those governments will face simi-lar dilemmas over whether retaining US market share is a strategic priority and how much of a price discount they are willing to accept to do so.
Increasing exports
As discussed previously, US crude exports are allowed in some cases, most notably to NAFTA partner Can-ada. Along with backing out light oil imports to the
United States, the biggest outlet for US light oil pro-duction to date has been to displace other light im-ports to Canada. US exports to Canada have skyrock-eted over the past couple of years, from 67,000 b/d in 2012 to nearly 300,000 b/d during the first three quarters of 2014 (Figure 12). There are limits on the ability of Canada alone, however, to absorb much more US crude. In 2013, Canada imported an average of 600,000 b/d of light crude oil, out of 640,000 b/d of total oil imports.68
The crude export exceptions under current law that al-low for exports to countries other than Canada permit much lower volumes. The recent move by the Commerce Department to approve the export of lightly processed condensate, however, has opened up another modestly sized export channel. If the administration were to con-tinue to approve condensate export requests as suggested by the BIS December 2014 FAQs discussed earlier, it is estimated that anywhere from 300,000 to 500,000 b/d or more of condensates might eventually be exported from the United States.69
0
500
1,000
1,500
2,000
2,500
3,000
3,500
4,000
Sep-
05
Jan-
06
May-0
6
Sep-
06
Jan-
07
May-0
7
Sep-
07
Jan-
08
May-0
8
Sep-
08
Jan-
09
May-0
9
Sep-
09
Jan-
10
May-1
0
Sep-
10
Jan-
11
May-1
1
Sep-
11
Jan-
12
May-1
2
Sep-
12
Jan-
13
May-1
3
Sep-
13
Jan-
14
May-1
4
Sep-
14
Canada Persian Gulf Mexico Venezuela West Africa
Figure 11: US oil imports by country of origin1,000 b/d, three month moving average
Source: EIA, “Petroleum and Other Liquids: Data,” 2014.

NAVIGATING THE U.S. OIL EXPORT DEBATE
28 | CENTER ON GLObAL ENERGY POLICY | COLUMbIA SIPA
When does the point of saturation occur?
Estimating exactly how much additional US LTO pro-duction can be absorbed by domestic refineries without significant yield declines or capacity additions is chal-lenging. Refinery consultants Turner Mason estimate that absent additional refinery investment, the domestic market will reach saturation on a nonseasonal basis when crude production reaches 10 to 11 million b/d.70 This is similar to the findings of recent studies by consultancies ICF71 and NERA.72
When will that occur? In November 2014 US crude production was 9.1 million b/d.73 In the Reference case of their 2014 Annual Energy Outlook, the EIA sees US crude production peaking at 9.6 million b/d in 2019, never reaching Turner Mason’s estimated point of satura-tion.74 In the EIA’s High Oil and Gas Resource side case, which has been a better predictor of US crude produc-tion in recent years than the Reference case, output passes
10 million b/d in 2016.75 US oil production passes 10 million b/d that year in a number of private sector fore-casts, including Citigroup, Goldman Sachs, and energy consultancy Rystad. Other research puts the point of sat-uration lower than 10 million b/d. A recent study from energy consultancy IHS, for example, estimates that mar-ket saturation will occur at between 9 and 10 million b/d of domestic crude production.76
Since these production estimates were made, there has been a sharp drop in both US and global oil prices. Brent prices have fallen from a high of $115 per barrel in June 2014 to below $65 a barrel as of mid-December 2014. WTI prices have fallen from $108 per barrel to below $60 over the same period. It is too early to assess the magnitude of the impact of this decline in oil pric-es (if sustained) on the US crude production outlook, but directionally it will reduce production growth and delay the point at which the domestic market reaches saturation.
0
50
100
150
200
250
300
350
400
450
Sep
-05
Jan-
06
May
-06
Sep
-06
Jan-
07
May
-07
Sep
-07
Jan-
08
May
-08
Sep
-08
Jan-
09
May
-09
Sep
-09
Jan-
10
May
-10
Sep
-10
Jan-
11
May
-11
Sep
-11
Jan-
12
May
-12
Sep
-12
Jan-
13
May
-13
Sep
-13
Jan-
14
May
-14
Sep
-14
Figure 12: US crude exports to Canada1,000 b/d
Source: EIA, “Petroleum and Other Liquids: Data,” 2014.

NAVIGATING THE U.S. OIL EXPORT DEBATE
energypolicy.columbia.edu | JANUARY 2015 | 29
If and when the point of saturation is reached, what will the impact be on US crude production, refinery invest-ment, gasoline prices, and economic performance? And what would the effect be of modifying or removing current export restrictions? This question has become the subject of considerable speculation among policymakers, indus-try, and the press, and the focus of a growing number of economic studies. To help guide stakeholders through this debate, we provide an overview of the relevant econom-ic theory and highlight insights that can be derived from empirical experience. We provide an apples-to-apples com-parison of existing studies that seeks to quantify the po-tential impact, and describe the variables that matter most in determining outcomes. Finally, we bound the range of potential impacts given current energy market uncertainty, and attempt to put those impacts in a broader economic context for different stakeholders.
ECONOMIC THEORY AND EMPIRICAL EVIDENCE
As detailed in a companion piece by Ken Medlock at Rice University’s Baker Institute, trade restrictions inhib-it commodity flows, which, in turn, affects price forma-tion.77 In a competitive global crude market without any trade restrictions, the selling price for a barrel of crude produced in the United States will be determined by the cost of producing the marginal barrel globally—adjusted for transportation costs and differences in crude quality. Indeed, there is generally a very tight correlation in crude selling prices, regardless of geographic origin. Trade re-strictions, however, can create a disconnect between the global price of crude and the price producers in a partic-ular country are able to charge by limiting their market options.
The domestic crude infrastructure bottlenecks that emerged in the United States in 2010 and 2011 offer an empirical example of how trade restrictions could im-pact domestic crude prices once the point of saturation
is reached. As discussed previously, a shortage of pipe-line capacity going from the US Midcontinent to coast-al refineries created an inland crude surplus that led to an average $15 discount between Cushing, Oklahoma, and the Gulf Coast for a barrel of similar quality crude between 2011 and 2013. At the margin, lower domes-tic wellhead oil prices will lead to lower domestic crude production, whether due to infrastructure constraints or export restrictions.
If domestic crude prices are likely to be higher if export restrictions are lifted, won’t domestic gasoline, diesel, and other refined product prices also rise? Indeed, concern about the potential impact on American consumers is the reason most frequently cited for leaving current crude ex-port restrictions in place.78 However, both economic the-ory and empirical evidence suggest refined product prices would fall, not rise, as explained in the box “What About Gasoline Prices?”79
While an increase in domestic crude production and de-crease in domestic refined product prices resulting from a modification of current crude export restrictions would likely harm the profitability of US refiners compared to the rents they might capture with such a restriction in place, it would help the US economy as a whole. Houser and Mohan (2014)80 find that the US shale boom has increased overall economic output in three ways:
1. increased investment in oil and gas production and demand for the labor and equipment associ-ated with that investment;
2. lower household and business energy costs due to a decline in oil and gas prices; and
3. improved terms of trade as both the price and quantity of imported oil and gas declines.
The magnitude of these benefits depends not only on the extent of the production increase and price decline, but also the overall state of the US economy. The economic benefits are greater when the economy is operating below
THE ECONOMIC IMPACT OF ALLOWING EXPORTS

NAVIGATING THE U.S. OIL EXPORT DEBATE
30 | CENTER ON GLObAL ENERGY POLICY | COLUMbIA SIPA
full employment, such as it is today. To the extent remov-ing current crude export restrictions increases domestic crude production and reduces refined product prices, the nature of the economic impact will be similar to that of the US shale boom overall.
EXISTING ESTIMATES
While economic theory and empirical evidence strongly suggests that lifting current export restrictions will direc-tionally increase domestic crude production, reduce gaso-line and other refined product prices, and increase economic output, the magnitude of the impact is highly uncertain.
Over the past year a number of studies have been pub-lished attempting to quantify the impact of modifying
or removing current crude export restrictions. The first, commissioned by the American Petroleum Institute (API), was conducted by energy consultancy ICF Inter-national and published in March 2014.81 The second ma-jor study, also commissioned by US oil producers, was published by consultancy IHS in May 2014.82 A third major study was conducted by economic consultancy NERA and published by the Brookings Institution in September 2014.83 In October, the Aspen Institute pub-lished a study conducted in cooperation with the MAPI Foundation and Inforum Forecasting at the University of Maryland (referred to as the MAPI study in this report), which focused on the impacts of lifting crude export restrictions on US manufacturing, largely adopting the IHS estimates of the impact of the ban on crude produc-tion and product prices.84
Perhaps the key issue, substantively and politically, in the debate about whether to allow crude exports has been the perception that such a move would push up prices at the pump for consumers. Both economic theory and empirical evidence, however, suggest refined product prices would fall, not rise, if exports were allowed.
There is a relatively liquid global market for refined products, just as there is for crude oil. The wholesale price of gasoline in the United States, for example, is generally determined by the mar-
ginal cost of producing a gallon of gasoline around the world, adjusted for quality and transportation costs. Unlike crude oil, however, there are no restrictions on gasoline exports, and thus no reason to expect a similar price discount. If the United States reaches the point of saturation and we see a trade policy–driven discount in domestic crude prices similar to the infrastructure-driven discount experienced over the past few years, the cost to refiners of producing gasoline, diesel, and other products will fall. But there is no reason why the domestic refiners would
WHAT ABOUT GASOLINE PRICES?
$0
$20
$40
$60
$80
$100
$120
$140
$160
Sep-
04
Jan-
05
May-0
5
Sep-
05
Jan-
06
May-0
6
Sep-
06
Jan-
07
May-0
7
Sep-
07
Jan-
08
May-0
8
Sep-
08
Jan-
09
May-0
9
Sep-
09
Jan-
10
May-1
0
Sep-
10
Jan-
11
May-1
1
Sep-
11
Jan-
12
May-1
2
Sep-
12
Jan-
13
May-1
3
Sep-
13
Jan-
14
May-1
4
Sep-
14
PADD I PADD II
PADD III PADD IV
PADD V
Source: EIA, “Refiner Acquisition Cost of Crude Oil.”
Figure 13: Refinery acquisition cost of crude by PADDUSD per barrel

NAVIGATING THE U.S. OIL EXPORT DEBATE
energypolicy.columbia.edu | JANUARY 2015 | 31
Partially in response to these studies, a refiner advocacy group called Consumers and Refiners United for Domes-tic Energy (CRUDE) commissioned an analysis by con-sultancy Baker & O’Brien, which was also released in late September 2014.85 As the policy debate surrounding crude exports has grown, a number of investment banks have also begun assessing the impact of the current restrictions as well.
In analyzing the same policy question, these studies ar-rive at very different results. The ICF study, for exam-ple, finds that allowing crude exports would result in a very small increase in domestic production—between 100,000 and 400,000 b/d on average between 2015 and 2025 depending on the scenario (Figure 15). In the IHS study, lifting crude export restrictions boosts domestic
production by 1.0 to 1.7 million b/d over the same peri-od. As it was largely based on the IHS analysis, the MAPI study shows similar results. The NERA study projects the largest increase in domestic crude production between 2015 and 2025 from lifting export restrictions—between 1.1 and 2.8 million b/d on average, depending on as-sumptions about the US tight oil resource base. Gold-man Sachs (GS) sees US crude production growing by 1.5 million b/d in 2020 if exports are allowed.86 The Bak-er & O’Brien study estimates that planned refinery ca-pacity will be sufficient to absorb all projected growth in domestic crude production but does not explicitly model the impact of that refinery investment on wellhead crude pricing or production rates.
pass those savings along to consumers. US refiners will have access to global product markets and the ability to sell gasoline and diesel abroad at prevailing global prices.
Indeed, this is exactly what’s occurred over the past few years. Between 2011 and 2013, PADD 2 refiners paid 16 percent less, on average, per barrel of crude than PADD 1 refiners, thanks to infrastructure bottlenecks between the US Midcontinent and the East Coast (Figure 13). PADD 4 refiners paid 22 percent less. Yet the price of gasoline sold by PADD 2 and PADD 4 re-finers was only 1 percent and 1.4 percent lower than PADD 1
refiners over this period respectively (Figure 14). Lower crude costs improved refiner profitability but did not lower prices for consumers. Likewise we would not expect refiners to pass on an export restriction-driven discount in domestic crude costs in refined product prices. To the extent that such a domestic crude discount reduces US crude production, it would increase global crude prices. Higher global crude prices would translate into higher global marginal refining costs which would raise the global price of gasoline, diesel and other refined product prices from which domestic product prices are set.
$0.0
$0.5
$1.0
$1.5
$2.0
$2.5
$3.0
$3.5
$4.0
Sep-
04
Jan-
05
May-0
5
Sep-
05
Jan-
06
May-0
6
Sep-
06
Jan-
07
May-0
7
Sep-
07
Jan-
08
May-0
8
Sep-
08
Jan-
09
May-0
9
Sep-
09
Jan-
10
May-1
0
Sep-
10
Jan-
11
May-1
1
Sep-
11
Jan-
12
May-1
2
Sep-
12
Jan-
13
May-1
3
Sep-
13
Jan-
14
May-1
4
Sep-
14
PADD I PADD II PADD III PADD IV PADD V
Source: EIA, “Refiner Gasoline Prices by Grade and Sales Type.”
Figure 14: Wholesale gasoline price by PADDUSD per gallon

NAVIGATING THE U.S. OIL EXPORT DEBATE
32 | CENTER ON GLObAL ENERGY POLICY | COLUMbIA SIPA
0.1 0.4
1.0
1.7 1.3
2.5
1.2
1.9 1.5
0.0
0.5
1.0
1.5
2.0
2.5
3.0
3.5
4.0 Lo
w Di
ffere
ntial
High
Diffe
renti
al
Base
Pro
ducti
on
Poten
tial P
rodu
ction
Refer
ence
High
O&G
Res
ource
Low
Expo
rts
High
Exp
orts
No E
xpor
t Ban
ICF IHS NERA MAPI GS*
Figure 15: Increase in US crude production from lifting export restrictions, 2015–2025Million b/d
Source: ICF, IHS, NERA, Aspen Institute, Goldman Sachs, and Rhodium Group estimates.*2020 only.
2.2 3.9
7.3
12.0
3.8
10.1
8.0 9.0
0
2
4
6
8
10
12
14
16
Low
Diffe
renti
al
High
Diffe
renti
al
Base
Pro
ducti
on
Poten
tial P
rodu
ction
Refer
ence
High
O&G
Res
ource
Low
Expo
rts
High
Exp
orts
No E
xpor
t Ban
ICF IHS NERA MAPI GS*
NA
Figure 16: Reduction in refined product prices from lifting crude export restrictions, 2015–20252013 cents per gallon
Source: ICF, IHS, NERA, Aspen Institute, Goldman Sachs and Rhodium Group estimates. *2020 only.

NAVIGATING THE U.S. OIL EXPORT DEBATE
energypolicy.columbia.edu | JANUARY 2015 | 33
Not surprisingly, the projected impact of lifting crude export restrictions on domestic refined product prices varies considerably across studies as well. The ICF study projects a 2 to 4 cent per gallon decline, on average be-tween 2015 and 2025, while IHS expects 7 to 12 cents (Figure 16). Most of this is explained by the difference in projected US crude production response to lifting export restrictions, but other modeling assumptions matter as well. For example, in its High Oil and Gas Resource scenario, NERA projects a crude production increase 65 percent larger than in the IHS Potential Production case, but resulting in a reduction in refined product prices that is 16 percent lower. Neither the GS nor Baker & O’Brien studies estimate—or if so, they do not report—the impact of allowing crude exports on refined product prices.
The largest difference among the studies is in the pro-jected economic impact of allowing crude exports. In the ICF study, US GDP is up to $34 billion higher on average between 2015 and 2025 if exports are al-lowed, or 0.18 percent (Figure 17). In the IHS Poten-tial Production scenario, GDP is $169 billion higher, on average, during that period, or 0.9 percent. Despite
projecting an increase in crude production growth from allowing exports that is considerably higher than IHS, NERA finds a GDP benefit roughly half the IHS level. MAPI finds GDP benefits even larger than IHS, while GS estimates that lifting the crude ban would be a net economic drag until late in the decade when allowing exports increases GDP.87 Interestingly, the GDP gains from allowing exports fall dramatically by 2030 in the IHS Base Production and NERA Refer-ence scenarios, while in the ICF Low Differential sce-nario they increase over time (Table 4).
UNDERSTANDING THE VARIABLES
To help policymakers and other stakeholders compare these existing studies, as well as evaluate for themselves which future they think most likely to eventuate, and under what circumstances, we walk through the individual variables that will determine the ultimate impact of allowing crude exports, identify the assumptions existing studies make for each, discuss alternative assumptions that could be made, and map out the resulting effects on US crude production, refined product prices, and US economic growth.
$9 $34
$92
$169
$49
$90 $114
$172
$58
$0 $20 $40 $60 $80
$100 $120 $140 $160 $180 $200 $220 $240
Low
Diffe
renti
al
High
Diffe
renti
al
Base
Pro
ducti
on
Poten
tial P
rodu
ction
Refer
ence
High
O&G
Res
ource
Low
Expo
rts
High
Exp
orts
No E
xpor
t Ban
ICF IHS NERA MAPI GS*
Figure 17: Increase in GDP from lifting crude export restrictions, 2015–2025Billion 2013 USD
Source: ICF, IHS, NERA, Aspen Institute, Goldman Sachs and Rhodium Group estimates.*2020 only.

NAVIGATING THE U.S. OIL EXPORT DEBATE
34 | CENTER ON GLObAL ENERGY POLICY | COLUMbIA SIPA
Table 4: Impact of allowing crude oil exports
2015 2016 2017 2018 2019 2020 2025 2030 2035Increase in US Crude Prices ($ per barrel)
Low Differential 0.8 2.2 2.4 3.9 2.3 1.3High Differential 7.8 7.2 5.4 3.7 2.3 1.3Base Production 0.0 23.2 13.7 10.6 5.5 3.8 3.9Potential Production 3.9 26.8 17.8 12.5 6.5 4.9 4.9Reference 12.0 10.0 5.0 3.0 2.0High O&G Resource 14.0 17.0 21.0 25.0 27.0Low Exports 0.0 24.9 20.1 16.2 11.0 7.9 6.3High Exports 0.0 23.9 19.0 15.1 9.9 6.8 5.0
GS No Export Ban 4.8 8.6 7.5 6.5 5.5 4.5Increase in Crude Production (million bbl/d)
Low Differential 0.0 0.1 0.1 0.2 0.2 0.2High Differential 0.2 0.4 0.5 0.5 0.3 0.1Base Production 0.0 0.8 1.1 1.2 1.0 1.1 1.2 1.3Potential Production 0.0 1.2 1.8 1.7 1.6 1.8 2.2 2.4Reference 1.5 1.3 0.4 0.2 0.2High O&G Resource 2.1 2.8 3.5 3.8 4.2Low Exports 0.0 0.3 0.6 0.9 1.2 1.4 2.2High Exports 0.0 0.4 0.9 1.3 1.7 2.1 3.3
GS No Export Ban 0.0 0.0 0.0 0.5 1.0 1.5
Low Differential 0.2 -0.1 0.3 0.5 0.5 0.6High Differential 0.7 0.7 1.1 1.1 0.6 0.3Base Production 0.0 3.8 4.1 3.8 3.3 3.5 3.5 3.5Potential Production 0.0 3.6 4.8 5.1 5.0 5.1 5.7 5.6Reference 4.0 2.0 1.0 1.0 0.0High O&G Resource 7.0 6.0 6.0 7.0 8.0Low Exports 0.0 2.1 2.1 2.1 2.2 2.2 2.5High Exports 0.0 3.1 3.1 3.2 3.3 3.3 3.7
GS No Export Ban 0.0 1.0 1.9 2.8 3.6 4.5 0.0
Low Differential 2.2 2.1 0.0 0.5 1.5 2.9High Differential 3.4 3.9 2.0 2.0 1.8 2.1Base Production 0.0 -8.1 -9.4 -8.3 -7.7 -7.7 -7.7Potential Production 0.0 -8.1 -11.4 -11.9 -11.9 -11.9 -11.9Reference 9 4 0 1 0High O&G Resource 12 11 10 10 10Low Exports 0.0 3.0 6.0 8.0 8.0 8.0 8.0High Exports 0.0 5.0 8.0 9.0 9.0 9.0 9.0
GS No Export Ban
Low Differential 3 8 11 16 18 24High Differential 20 33 39 36 23 13Base Production -2 72 133 135 118 107 81 32Potential Production -5 104 195 220 206 199 174 105Reference 66 39 15 8 4High O&G Resource 95 83 102 141 193
Increase in US GDP (billion 2013 USD)
Reduction in Global Crude Prices (2013 USD per barrel)
ICF
NERA
ICF
IHS
ICF
IHS
NERA
MAPI
IHS
NERA
MAPI
ICF
IHS*
NERA
MAPI
Reduction in Refined Product Prices (2013 cents per gallon)
Table 4: Impact of lifting the crude export restriction
IHS
NERA
MAPI
ICF
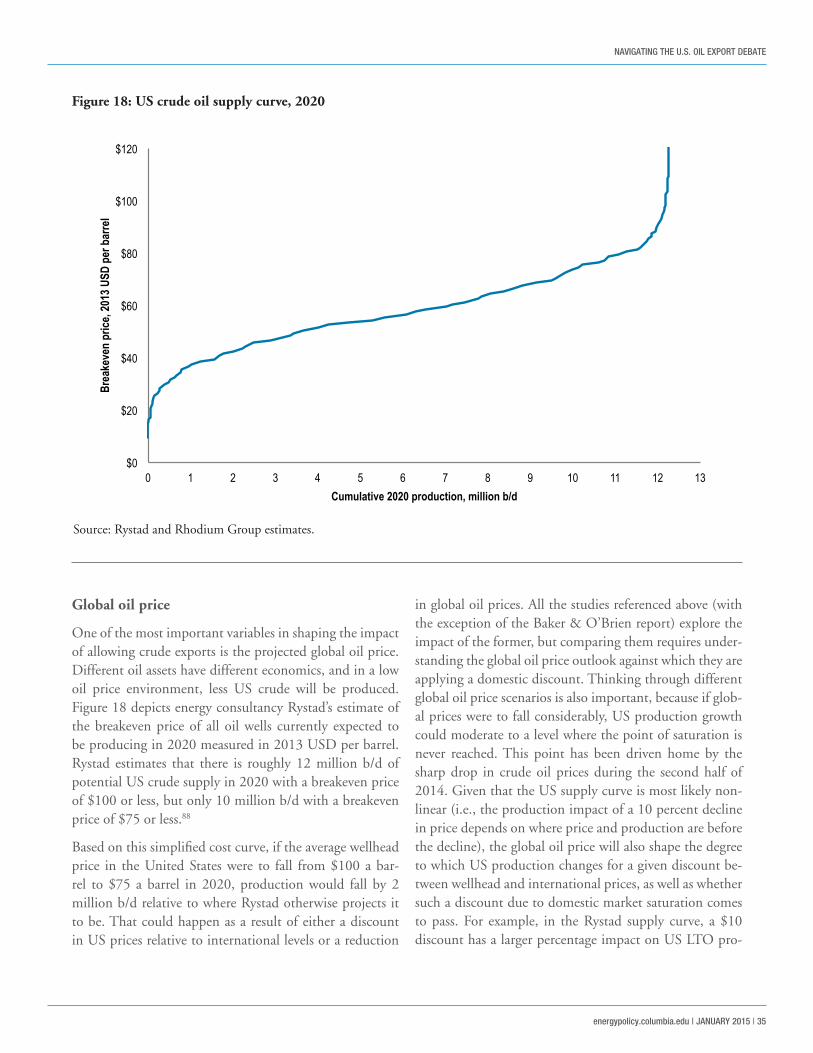
NAVIGATING THE U.S. OIL EXPORT DEBATE
energypolicy.columbia.edu | JANUARY 2015 | 35
Global oil price
One of the most important variables in shaping the impact of allowing crude exports is the projected global oil price. Different oil assets have different economics, and in a low oil price environment, less US crude will be produced. Figure 18 depicts energy consultancy Rystad’s estimate of the breakeven price of all oil wells currently expected to be producing in 2020 measured in 2013 USD per barrel. Rystad estimates that there is roughly 12 million b/d of potential US crude supply in 2020 with a breakeven price of $100 or less, but only 10 million b/d with a breakeven price of $75 or less.88
Based on this simplified cost curve, if the average wellhead price in the United States were to fall from $100 a bar-rel to $75 a barrel in 2020, production would fall by 2 million b/d relative to where Rystad otherwise projects it to be. That could happen as a result of either a discount in US prices relative to international levels or a reduction
in global oil prices. All the studies referenced above (with the exception of the Baker & O’Brien report) explore the impact of the former, but comparing them requires under-standing the global oil price outlook against which they are applying a domestic discount. Thinking through different global oil price scenarios is also important, because if glob-al prices were to fall considerably, US production growth could moderate to a level where the point of saturation is never reached. This point has been driven home by the sharp drop in crude oil prices during the second half of 2014. Given that the US supply curve is most likely non-linear (i.e., the production impact of a 10 percent decline in price depends on where price and production are before the decline), the global oil price will also shape the degree to which US production changes for a given discount be-tween wellhead and international prices, as well as whether such a discount due to domestic market saturation comes to pass. For example, in the Rystad supply curve, a $10 discount has a larger percentage impact on US LTO pro-
$0
$20
$40
$60
$80
$100
$120
0 1 2 3 4 5 6 7 8 9 10 11 12 13
Brea
keve
n pr
ice, 2
013 U
SD p
er b
arre
l
Cumulative 2020 production, million b/d
Figure 18: US crude oil supply curve, 2020
Source: Rystad and Rhodium Group estimates.

NAVIGATING THE U.S. OIL EXPORT DEBATE
36 | CENTER ON GLObAL ENERGY POLICY | COLUMbIA SIPA
duction when prices are at $80 per barrel than when they are at $100 a barrel.
Figure 19 compares international crude price projec-tions from existing studies, assuming exports are al-lowed, alongside the EIA’s 2014 Annual Energy Out-look projections for three scenarios (Reference, Low Oil & Gas Resource and High Oil & Gas Resource) and for Rystad’s reference case supply projections. With the exception of NERA and GS, there is pretty tight con-vergence across studies between $96 and $99 a barrel on average between 2015 and 2020 in real 2013 USD. The GS report uses a $91 per barrel average price projection over that period, while the NERA study uses $86–$87. After 2020 there is more divergence, ranging from $99 per barrel on average between 2020 and 2030 in the NERA High Oil & Gas Resource case to $118 per bar-rel in the MAPI report.
There are two important takeaways from this compari-son. First, global oil price assumptions are not a major factor in explaining the significant differences in study results. Second, existing analysis has explored a fairly nar-row range of possible oil price futures, and one that looks increasingly outdated given the sharp drop in global oil
prices during the second half of 2014 and significant downward revision in many analysts’ price projections out to 2020.89 As mentioned previously, both spot and futures prices for Brent and WTI were significantly be-low the projections included in Figure 19 at the time this study went to press.
US resource base
How much oil the United States produces at a given price is the second major variable in assessing the energy market and economic impact of allowing crude exports. Given the dramatic and unexpected turnaround in US crude produc-tion over the past few years, this variable is also among the hardest to project, and indeed there is wide variation among the crude production forecasts used in the existing studies. Figure 20 compares these forecasts, all in a scenar-io in which the exports are freely allowed. The EIA 2014 projections are included for reference, along with Rystad’s central production forecast.
Each study uses a slightly different approach to forecast-ing US crude production. The ICF study uses their De-tailed Production Report (DPR) to project drilling activ-ity likely to occur at a given oil price.90 While they have
0
20
40
60
80
100
120
140
160
1990 1995 2000 2005 2010 2015 2020 2025 2030 2035
GS MAPI NERA - High O&G Resource NERA - Reference Rystad IHS - Potential Production IHS - Base Production ICF EIA - Low O&G Resource EIA - High O&G Resource EIA - Reference Historical
Figure 19: International crude price projections in surveyed reports 2013 USD per barrel, absent crude oil export restrictions

NAVIGATING THE U.S. OIL EXPORT DEBATE
energypolicy.columbia.edu | JANUARY 2015 | 37
one of the higher oil price projections of the group in the short term ($98 per barrel on average between 2015 and 2020), they have a relatively low crude production fore-cast. Output is less than 8.5 million b/d in 2015 (a little below August 2014 levels) and reaches 9.3 million b/d in 2017 and 10.6 million b/d in 2020. ICF only includes one production projection in their report in a scenario where exports are allowed. Their Low Differential and High Differential scenarios focus on export-restricted futures only.
The IHS study includes two production projections, one called Base Production and the other Potential Production. Like ICF, they model both based on forecasted drilling activity at a given oil price. The difference between the two is assumed level of drilling technology improvement and availability of less well understood tight oil plays. In the Base Production scenario, crude output grows to 9.25 million b/d in 2015, 10 million b/d in 2017, and 11 mil-lion b/d in 2020. In the Potential Production scenario, US crude output reaches 13 million b/d in 2020 and peaks at more than 14 million b/d between 2020 and 2030. The MAPI report claims to adopt the IHS energy market as-sumptions and has a crude production forecast somewhere between the two IHS scenarios.
The NERA study takes a different approach to project-ing US crude production from the ICF or IHS reports. Rather than model drilling activity directly, they take the production forecasts from the EIA Reference and High Oil & Gas Resource cases as their Reference (REF) and High Oil & Gas Resource (HOGR) scenarios in the presence of export limitations. They then construct a piecewise linear function91 to estimate how US LTO and condensate pro-duction would increase if the crude ban were lifted. Below $55 and $40 per barrel they assume no LTO or condensate is produced respectively. Above those prices, they build a supply curve based on the annual price and production projections from the EIA under each scenario. For exam-ple, in the EIA HOGR scenario, in 2020 wellhead oil pric-es are $87.85 per barrel in 2020 and LTO production is 6.49 million b/d. The following year, wellhead oil prices rise to $88.16 and LTO production grows to 6.85 mil-lion b/d. Therefore, NERA assumes that a $0.31 change in wellhead prices (if prices are in the $87-$89 per bar-rel range) results in a 360,000 b/d change in production. They take the price and production point estimates for
each year of the EIA projections to build out their US LTO supply curve.
NERA finds a large (and persistent, in the HOGR sce-nario) domestic price discount due to the export ban (discussed later). For example, in the HOGR scenario in 2025, domestic LTO prices are $76 a barrel with the ban and $97 without it. When they apply the $21 per barrel increase in LTO prices from lifting the ban to their “with ban” supply curve, 2025 US crude production grows from 11.7 million b/d to 15.2 million b/d, the highest of any of the forecasts by a comfortable margin.
NERA’s methodology raises several questions. While the EIA’s Annual Energy Outlook assumes the crude export ban remains in place, it results in a relatively small dis-count between domestic and international prices. For ex-ample, in the EIA High Oil & Gas Resource case, Brent prices are $101 per barrel in 2025, measured in real 2013 dollars (Figure 19). Domestic wellhead prices are $94 a barrel, relatively close to NERA’s “no ban” HOGR case. Yet production in EIA’s modeling is 12.5 million b/d in 2025, substantially lower than NERA’s 15.2 mil-lion b/d. NERA’s supply curve, and the EIA projections upon which it is based, are internally inconsistent. The National Energy Modeling System (NEMS) used by EIA to produce their Annual Energy Outlook models well-by-well drilling activity explicitly, the combined effect of which is the overall crude production numbers NERA uses to build its supply curve. A reported change in total crude production from one year to the next is not sim-ply the result of the year-on-year change in crude pric-es but rather drilling decisions made both in that year and previous years based on current and projected crude prices. As discussed below, when we model NERA’s well-head price projections endogenously in NEMS, we see a supply response very different than that reported in the NERA study.
The GS report has the highest 2020 crude projections (the last year of the study’s forecast) at 14.4 million b/d. GS has recently revised down their estimates, however, due to falling global oil prices. US crude production in all the existing studies, as well as the Rystad central projections, is above the EIA Reference case after 2017. None of the studies explore a low resource or low produc-tion scenario.

NAVIGATING THE U.S. OIL EXPORT DEBATE
38 | CENTER ON GLObAL ENERGY POLICY | COLUMbIA SIPA
0
2
4
6
8
10
12
14
16
18
1990 1995 2000 2005 2010 2015 2020 2025 2030 2035
GS MAPI NERA - High O&G Resource NERA - Reference Rystad IHS - Potential Production IHS - Base Production ICF EIA - Low O&G Resource EIA - High O&G Resource EIA - Reference Historical
Figure 20: Crude production forecastsMillion b/d, absent crude oil export restrictions
0.4 0.7
1.5 1.8
1.2 1.0
1.3
2.1
1.5
0.0
0.5
1.0
1.5
2.0
2.5
3.0
Low
Diffe
renti
al
High
Diffe
renti
al
Base
Pro
ducti
on
Poten
tial P
rodu
ction
Refer
ence
High
O&G
Res
ource
Low
Expo
rts
High
Exp
orts
No E
xpor
t Ban
ICF IHS NERA MAPI GS*
Figure 21: US crude supply elasticityChange in crude production/change in wellhead price, 2015–2025 average
Source: ICF, IHS, NERA, Aspen Institute, Goldman Sachs and Rhodium Group estimates. *2020 only.

NAVIGATING THE U.S. OIL EXPORT DEBATE
energypolicy.columbia.edu | JANUARY 2015 | 39
The other important US resource base assumption in shaping study outcomes is the responsiveness of US pro-duction to changes in wellhead price, or the price elastic-ity of domestic supply (see “Supply Elasticity” box). That responsiveness depends on a host of factors, including the current cost of production, the extent to which oil compa-nies and service providers reduce costs when under price pressure, and the timing and duration of a given drop in wellhead prices. The net effect of these factors determines the magnitude of the impact on domestic crude oil pro-duction of a given export ban-driven discount in domestic crude prices. Figure 21 shows the average price elasticity of US crude supply between 2015 and 2025 from the ex-isting export studies. In the ICF study, the average price elasticity of US supply is between 0.4 and 0.7 on average between 2015 and 2025. In the IHS study (and by exten-sion the MAPI study) the supply elasticity is considerably higher—1.5 to 1.8 between 2015 and 2025—on par with the GS estimates for 2020. The NERA elasticities are in the middle at 1 to 1.1.
All these elasticities are considerably higher than the esti-mates of long-term oil supply elasticity found in the aca-demic literature (0.15 to 0.25),92 though robust economet-ric estimates are hard to come by. That is not surprising, as tight oil production is often considered more price elastic than traditional sources of oil supply.93 We explored the elasticity of US tight oil supply in the NEMS model by running the model over a range of price paths holding the resource base constant. We found supply elasticities be-tween 0.1 to 0.5, depending on the base price and year.
The Oil & Gas Module in NEMS models production in a similar manner to the ICF and IHS studies, adjusting drilling activity based on well economics and current and forecast crude oil prices. While more simplified, we also explored the implicit price elasticity in the Rystad supply curve and found elasticities ranging from 0.1 to 1 between $100 a barrel and $60 a barrel, with the elasticity growing as base oil price declines.
The drop in global and domestic crude oil prices during the second half of 2014 should provide empirical evidence on the price elasticity of US tight oil supply. If production falls considerably, the elasticities in the IHS, NERA, MAPI and GS studies, though higher than past estimates, may be correct. The number of new drilling permits fell sharply in the fourth quarter of 2014,94 and a number of US pro-ducers have reduced their 2015 investment plans.95 There are several reasons, however, why declines in drilling per-mits and new capital investment may lead to proportion-ally smaller declines in actual production. These include productivity improvements, the disproportionate share of production that comes from a small number of “sweet spots,” and the large number of drilled but uncompleted wells.96 Short-term factors, such as hedging or lease terms, may induce a firm to continue operating at a loss for a pe-riod of time, so we may not have a firm grasp on tight oil price elasticity until well into 2015.
If US crude production does not sharply decline in abso-lute terms, however, the price elasticities used in the IHS, NERA, MAPI and GS analysis will need to be significantly revised. Take, for example, the supply response projected
In economics, the price elasticity of supply is a measure of the sensitivity of supply of a given good to changes in price.1 For oil production, supply elasticity measures how the number of barrels produced changes with well-head price. Supply elasticity is expressed as the percent change in supply over the percent change in price.
If elasticity is greater than one, the good is said to be “elas-tic.” Elastic supply means that the percentage change in quantity supplied will be greater than the percentage
change in price. The more elastic supply is, the more sen-sitive it is to changes in price. If elasticity is less than one, the good is said to be “inelastic.” Inelastic supply means that percentage change in quantity supplied is less than the percentage change in price. If elasticity is equal to one, the good is said to be “unit elastic,” which means that per-centage change in quantity supplied moves one for one with the percentage change in price (e.g., if price falls by 10 percent, then supply falls by 10 percent).
SUPPLY ELASTICITY

NAVIGATING THE U.S. OIL EXPORT DEBATE
40 | CENTER ON GLObAL ENERGY POLICY | COLUMbIA SIPA
in the IHS study. In their Base Production scenario, well-head prices fall from $87 per barrel in 2015 to $73 per bar-rel in 2016 if the crude ban remains in place. As a result, production falls from 9.2 million b/d to 8.8 million b/d over that period. If the crude ban is lifted, wellhead prices rise to $96 per barrel in 2016 and crude production grows to 9.7 million b/d. Thanks to the decline in global oil pric-es (not the export ban), front month WTI prices had fall-en to below $56 per barrel by the time we went to press, with prices further out on the curve trading below $64 per barrel through 2016.97 Using the IHS elasticities, US pro-duction should fall well below 8 million b/d. The NERA analysis assumes US LTO production will stop entirely if prices fall below $55 per barrel. Yet, a number of analysts are now projecting US producers will be able to cut costs and maintain production growth, albeit at a slower pace, in a low-price environment.98
Refinery economics
Arguably the single most important variable in shaping the impact of export restrictions on domestic crude produc-tion and product prices is the ability and willingness of US refineries to adapt. The ICF, IHS, and NERA studies all employ detailed petroleum models to assess the response of US refineries to growing domestic LTO supply. The ICF study uses two scenarios to assess the range of possible re-finery responses. Their Low Differential scenario assumes all current light crude imports are displaced along with a larger share of current medium crude imports, at no cost. Announced refinery capacity comes online without delay. In the High Differential scenario, refineries have greater difficulty displacing imports and new projects are delayed. In the Low Differential scenario, domestic crude price dis-counts due to the ban start out at a couple of dollars per barrel and peak at $4 a barrel in 2025 (Figure 22). In the High Differential case, the discount starts out at nearly $8 per barrel in 2015 but drops to $4 in 2025 and $2 in 2030 as additional refinery capacity comes online. These relatively small discounts, combined with a comparatively inelastic US supply base, explains why ICF projects con-siderably smaller crude production increases from allowing exports than the other studies.
Crude production growth is faster in the IHS study than the ICF report, pushing the United States to the point of saturation sooner. There is a lag in building sufficient new refining capacity, resulting in a $23 to $27 per barrel dis-
count for domestic crude in 2016, depending on the sce-nario. IHS expects refiners to respond to this price spread by building relatively low-cost, simple refineries such as “toppers” and “hydroskimmers,”99 bringing the price dis-count down to $4 to $5 a barrel by 2020, the level needed to recoup refinery capital expenditures. This lag between price signal and new investment is consistent with the US experience with ultra-low sulfur diesel regulations.100 The 2016–2020 discount has large and lasting impacts on US crude production in the IHS analysis, however, as ev-idenced by the relatively high supply elasticity shown in Figure 21.
The opposite is true in the NERA study. While NERA uses a lower supply elasticity than IHS, they are consider-ably more pessimistic regarding the ability of US refineries to adapt. In their analysis, refineries refuse to make any capital expenditures that cannot be paid back in two years or less due to uncertainty about the future of the crude export ban. In the High O&G Resource case, this results in a persistent and growing domestic crude discount, up to $27 a barrel in 2035.
We asked leading refinery consultant Turner Mason to as-sess the cost and scale of refinery capacity additions neces-sary to absorb the projected crude production increase in the EIA Reference and High Oil & Gas Resource scenar-ios, as well as an Upper Bound scenario consistent with the IHS Potential Production case.101 In Turner Mason’s view the point of saturation is never reached in the EIA Reference case but occurs in 2016 in the High Oil & Gas Resource and Upper Bound scenarios. If only processed condensate could be exported, they anticipate the indus-try will respond to projected crude production growth by building condensate stabilizers and ultra-low sulfur diesel hydroskimmers. In the High Oil & Gas Resource scenario, Turner Mason projects 3 to 4 condensate stabilizers and 13 to 15 hydroskimmers would be required, at a combined cost of $13 to $16 billion. In the Upper Bound scenario, that grows to 30 to 35 stabilizers and/or hydroskimmers at a cost of $26 to $31 billion. Recouping this investment will require a $5.00 to $6.50 per barrel discount, in Turn-er Mason’s estimation—similar to the findings in the IHS report. If exports are restricted completely, including of processed condensate, the projected stabilizers would be replaced by higher-cost hydroskimmers, and the total in-vestment required would rise by $1 billion. The eventual
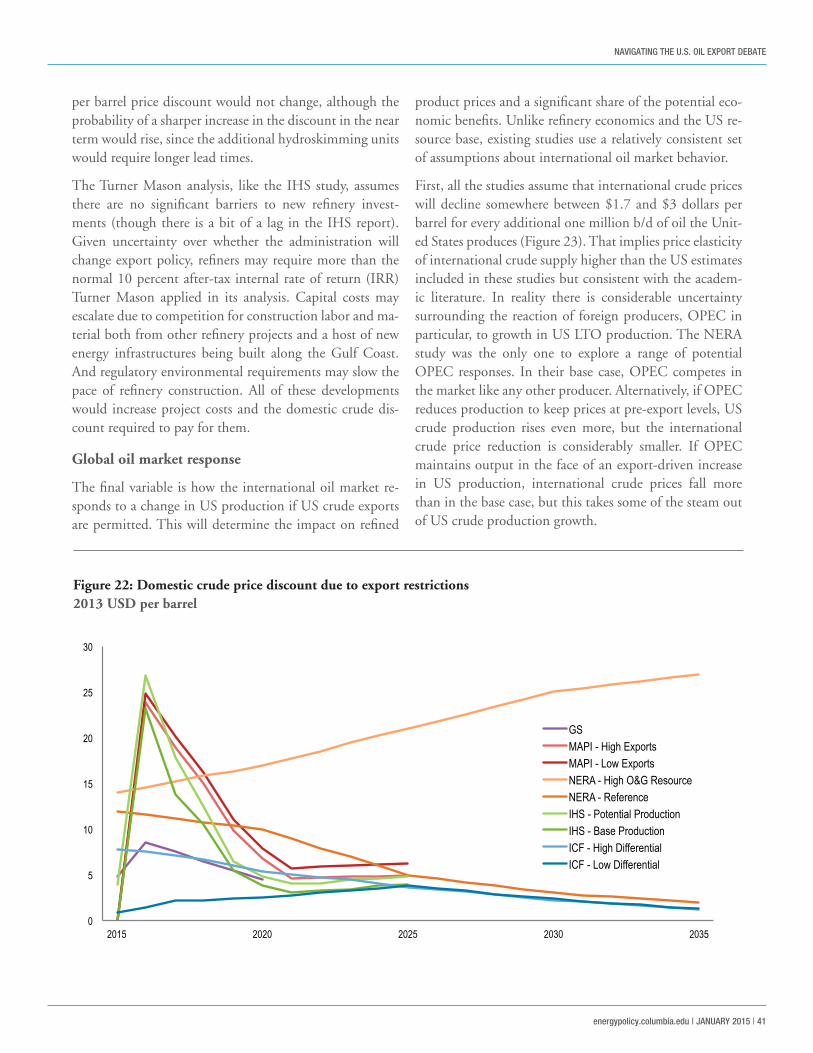
NAVIGATING THE U.S. OIL EXPORT DEBATE
energypolicy.columbia.edu | JANUARY 2015 | 41
per barrel price discount would not change, although the probability of a sharper increase in the discount in the near term would rise, since the additional hydroskimming units would require longer lead times.
The Turner Mason analysis, like the IHS study, assumes there are no significant barriers to new refinery invest-ments (though there is a bit of a lag in the IHS report). Given uncertainty over whether the administration will change export policy, refiners may require more than the normal 10 percent after-tax internal rate of return (IRR) Turner Mason applied in its analysis. Capital costs may escalate due to competition for construction labor and ma-terial both from other refinery projects and a host of new energy infrastructures being built along the Gulf Coast. And regulatory environmental requirements may slow the pace of refinery construction. All of these developments would increase project costs and the domestic crude dis-count required to pay for them.
Global oil market response
The final variable is how the international oil market re-sponds to a change in US production if US crude exports are permitted. This will determine the impact on refined
product prices and a significant share of the potential eco-nomic benefits. Unlike refinery economics and the US re-source base, existing studies use a relatively consistent set of assumptions about international oil market behavior.
First, all the studies assume that international crude prices will decline somewhere between $1.7 and $3 dollars per barrel for every additional one million b/d of oil the Unit-ed States produces (Figure 23). That implies price elasticity of international crude supply higher than the US estimates included in these studies but consistent with the academ-ic literature. In reality there is considerable uncertainty surrounding the reaction of foreign producers, OPEC in particular, to growth in US LTO production. The NERA study was the only one to explore a range of potential OPEC responses. In their base case, OPEC competes in the market like any other producer. Alternatively, if OPEC reduces production to keep prices at pre-export levels, US crude production rises even more, but the international crude price reduction is considerably smaller. If OPEC maintains output in the face of an export-driven increase in US production, international crude prices fall more than in the base case, but this takes some of the steam out of US crude production growth.
0
5
10
15
20
25
30
2015 2020 2025 2030 2035
GS MAPI - High Exports MAPI - Low Exports NERA - High O&G Resource NERA - Reference IHS - Potential Production IHS - Base Production ICF - High Differential ICF - Low Differential
Figure 22: Domestic crude price discount due to export restrictions2013 USD per barrel

NAVIGATING THE U.S. OIL EXPORT DEBATE
42 | CENTER ON GLObAL ENERGY POLICY | COLUMbIA SIPA
There is also a great deal of consistency across studies in the assumed relationship between international crude prices and domestic refined petroleum prices (Figure 24)—in step with the economic theory and empirical evidence cited at the beginning of this section. NERA, IHS, and MAPI as-sume that for every $1 per barrel decline in international crude prices, domestic gasoline prices will fall by 1.7 to 2.9 cents. ICF is a bit of an outlier, with a 4.1 cent decline in the High Differential case, and a change too small to derive a meaningful elasticity in the Low Differential case. Resources for the Future similarly found that allowing crude exports would lower gasoline prices 1.7 to 4.5 cents.102
While the relationship between international crude pric-es and US refined product prices is strong and empirical-ly validated (see “What About Gasoline Prices?” box), US decisions regarding the crude export ban could alter glob-al refining balances. If the ban remains in place, US re-finers should add capacity, causing foreign refiners to ad-just by slowing capacity additions. Global product prices in this scenario should be higher overall than if the ban were lifted because US crude supply will be lower and
international crude costs higher. If foreign refiners did not adjust in response to US refinery investment, how-ever, there could be excess global refinery capacity, which would at the margin reduce global product prices (to the detriment of refiners). The latter case may be more likely, as there is already overcapacity in global refining, new additions are still planned, and European refineries may continue to increase utilization rates, taking advantage of the rising supplies of cheaper light crude in the Atlantic Basin created as US imports decline.
BOUNDING THE POSSIBILITIES
Given this wide range of market variables, what, if anything, can be said about the magnitude of the impact of lifting export restrictions on domestic crude production and re-fined product prices? If we treat all variables above as equally likely, the increase in US crude production between 2015 and 2025 from lifting export restrictions could be anywhere from 100,000 b/d (ICF Low Differential scenario) to 4.4 million b/d (combining the IHS Potential Production sup-
2.4 2.2
3.2
2.7
1.8
2.5
1.7 1.7
3.0
0.0
0.5
1.0
1.5
2.0
2.5
3.0
3.5
4.0
Low
Diffe
renti
al
High
Diffe
renti
al
Base
Pro
ducti
on
Poten
tial P
rodu
ction
Refer
ence
High
O&G
Res
ource
Low
Expo
rts
High
Exp
orts
No E
xpor
t Ban
ICF IHS NERA MAPI GS*
Figure 23: Crude price response2013 USD per barrel reduction in international crude prices per million b/d increase in US crude production, 2015–2025
Source: ICF, IHS, NERA, Aspen Institute, Goldman Sachs, and Rhodium Group estimates. *2020 only.
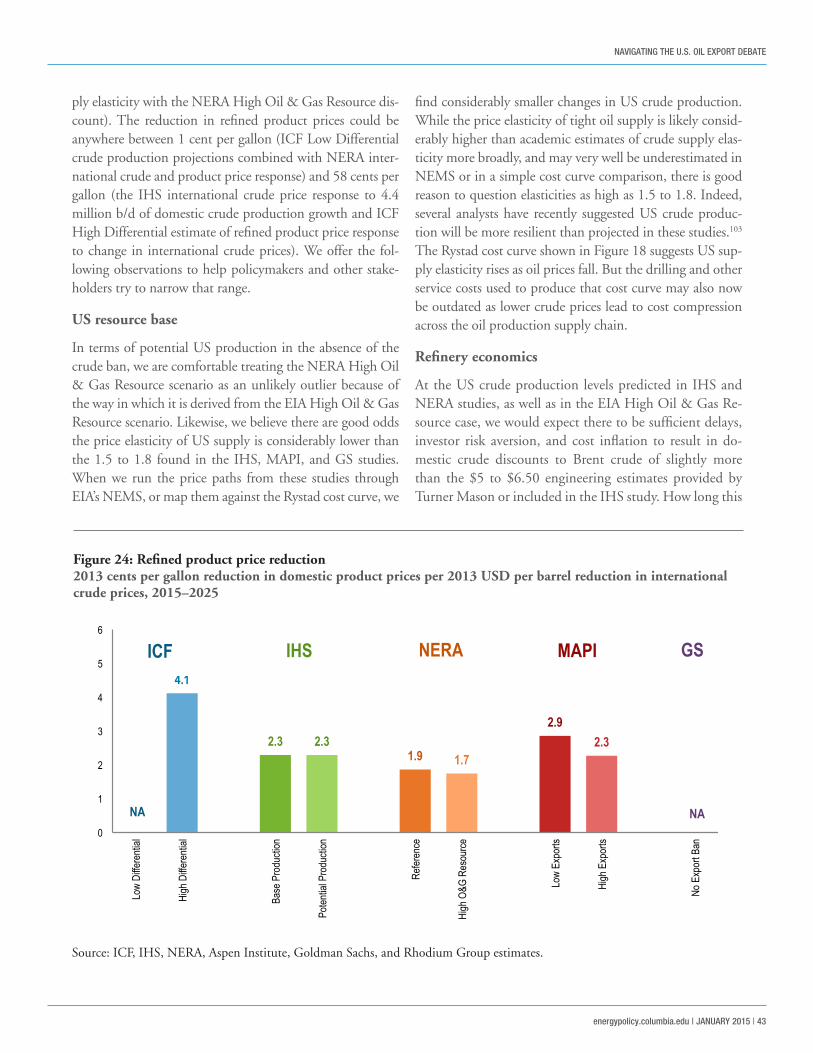
NAVIGATING THE U.S. OIL EXPORT DEBATE
energypolicy.columbia.edu | JANUARY 2015 | 43
ply elasticity with the NERA High Oil & Gas Resource dis-count). The reduction in refined product prices could be anywhere between 1 cent per gallon (ICF Low Differential crude production projections combined with NERA inter-national crude and product price response) and 58 cents per gallon (the IHS international crude price response to 4.4 million b/d of domestic crude production growth and ICF High Differential estimate of refined product price response to change in international crude prices). We offer the fol-lowing observations to help policymakers and other stake-holders try to narrow that range.
US resource base
In terms of potential US production in the absence of the crude ban, we are comfortable treating the NERA High Oil & Gas Resource scenario as an unlikely outlier because of the way in which it is derived from the EIA High Oil & Gas Resource scenario. Likewise, we believe there are good odds the price elasticity of US supply is considerably lower than the 1.5 to 1.8 found in the IHS, MAPI, and GS studies. When we run the price paths from these studies through EIA’s NEMS, or map them against the Rystad cost curve, we
find considerably smaller changes in US crude production. While the price elasticity of tight oil supply is likely consid-erably higher than academic estimates of crude supply elas-ticity more broadly, and may very well be underestimated in NEMS or in a simple cost curve comparison, there is good reason to question elasticities as high as 1.5 to 1.8. Indeed, several analysts have recently suggested US crude produc-tion will be more resilient than projected in these studies.103 The Rystad cost curve shown in Figure 18 suggests US sup-ply elasticity rises as oil prices fall. But the drilling and other service costs used to produce that cost curve may also now be outdated as lower crude prices lead to cost compression across the oil production supply chain.
Refinery economics
At the US crude production levels predicted in IHS and NERA studies, as well as in the EIA High Oil & Gas Re-source case, we would expect there to be sufficient delays, investor risk aversion, and cost inflation to result in do-mestic crude discounts to Brent crude of slightly more than the $5 to $6.50 engineering estimates provided by Turner Mason or included in the IHS study. How long this
4.1
2.3 2.3 1.9 1.7
2.9 2.3
0
1
2
3
4
5
6
Low
Diffe
renti
al
High
Diffe
renti
al
Base
Pro
ducti
on
Poten
tial P
rodu
ction
Refer
ence
High
O&G
Res
ource
Low
Expo
rts
High
Exp
orts
No E
xpor
t Ban
ICF IHS NERA MAPI GS
NA NA
Figure 24: Refined product price reduction2013 cents per gallon reduction in domestic product prices per 2013 USD per barrel reduction in international crude prices, 2015–2025
Source: ICF, IHS, NERA, Aspen Institute, Goldman Sachs, and Rhodium Group estimates.

NAVIGATING THE U.S. OIL EXPORT DEBATE
44 | CENTER ON GLObAL ENERGY POLICY | COLUMbIA SIPA
larger discount lasts would depend in part on the outlook for export policy changes and the extent and duration of completion for engineering and construction labor from other large energy projects along the Gulf Coast. On the other hand, we believe the NERA study is overly pessimis-tic on the ability of US refiners to respond, as investors are unlikely to ignore the prospect of profiting from a discount of $20 or more for domestic crude relative to international prices for two solid decades due solely to policy risk that can be hedged through financial markets, although induc-ing such private sector investments through export restric-tions is not economically efficient.
International market response
While there is a high degree of alignment among existing studies on the international market response to increased US crude production, in reality this is an area of consider-able uncertainty. While in the past market observers have generally assumed OPEC will offset a large share of non-OPEC production growth to defend prices, current OPEC behavior in response to the US shale boom casts doubts on the cartel’s ability or desire to offset non-OPEC supply. This means the reduction in global oil prices and domestic gasoline prices for a given increase in US crude production could be larger than existing studies estimate. Short-term responses to market changes must be distinguished, how-ever, from longer-term decisions that OPEC members may or may not make to invest in production capacity.
The key country in this regard is Saudi Arabia, the only OPEC member that retains any meaningful amount of spare capacity and which has frequently been seen as the “swing supplier” to balance oil markets. The results of the November 2014 OPEC meeting, in which the producer group decided not to remove oil from the market to sup-port prices, suggest OPEC, in particular Saudi Arabia, may not feel capable of cutting enough production to support prices or want to lose that much market share. The Saudis have indicated that they require cuts from fellow OPEC and non-OPEC members alike to support prices, yet such co-ordinated discipline seems increasingly unlikely.104 Iran and Venezuela face a severe budgetary squeeze from falling pric-es, challenging their ability to meet social commitments that maintain political stability and creating a powerful incentive to evade OPEC production quotas. Production in Libya is already sharply reduced due to domestic conflict. Iraq, like other OPEC members, is working aggressively to capture
market share in Asia. Outside OPEC, Russia is extremely vulnerable to falling oil prices, especially in the face of west-ern sanctions, so it is not willing to cut output. Moreover, the ability of the Saudis to offset the glut of light crude created by rising US oil flows by cutting medium and heavy produc-tion may be limited.105 Clearing out the oversupply from the Atlantic Basin might require painful supply reductions from African OPEC producers such as Nigeria and Angola.106 For these reasons, OPEC’s ability to play its historical role as a market balancer may be substantially weakened by the US light oil boom in the short to medium term, although many forecasters see OPEC market share growing after 2020.107
Global oil prices
The sharp decline in global oil prices during the second half of 2014 due to rapid US supply growth, the return of disrupted barrels from Libya and other countries, and weak demand raises questions about the US production projections included in most of the existing crude export studies. As stated earlier, spot and futures prices both for Brent and WTI were considerably lower when we went to press than price forecasts used in any of the existing crude export studies, and if current crude prices persist and the supply elasticities used in the IHS and NERA studies are correct, their US production outlooks will need to be considerably revised, which would push back the point at which domestic market saturation might be reached. We are more optimistic about the resilience of US producers to current oil prices and therefore skeptical of the high supply elasticities used by IHS, NERA, and others, but lower oil prices will certainly have some impact both on the growth rate of US crude production and the effect of lifting cur-rent export restrictions.
Putting it together
Based on the above assessment and current oil market uncer-tainty, lifting current restrictions on crude oil exports would likely lead to higher domestic production of 0 to 1.2 million b/d on average between 2015 and 2025. The lower-bound estimate captures production scenarios in which market sat-uration never occurs, such as under the EIA’s 2014 Annual Energy Outlook Reference Case. While the EIA’s Reference Case projection is the lowest among those surveyed in this report, crude oil prices are now significantly lower than the prices used in all the projections included, which creates downside risk to their production forecasts.

NAVIGATING THE U.S. OIL EXPORT DEBATE
energypolicy.columbia.edu | JANUARY 2015 | 45
To arrive at our upper-bound estimate of 1.2 million b/d, we assume that global crude prices return to $100 per bar-rel quickly and that US production in the absence of ex-port restrictions averages 12 million b/d between 2015 and 2025 (the upper end of the projections surveyed in this report). To evaluate the maximum likely impact of the ban in this environment, we assume a $10 per barrel average discount for domestic crude between 2015 and 2025 and a price elasticity of domestic supply of 1.0—the highest of any point on the Rystad supply curve and more than twice as high as the highest point found in the NEMS modeling we performed across a range of crude price scenarios. We believe a supply elasticity of 1.0 is a safe upper-bound es-timate, even though it is below that used in the IHS and MAPI studies. An elasticity significantly lower than 1.0 is more appropriate if US shale production proves to be resilient in the face of the recent price drop, as several an-alysts project.108 Also, while the change in US production at the upper end of our range is below that found in the high production scenarios in the IHS, MAPI, and NERA studies, we believe it could result in an equally large reduc-tion in refined product prices due to a more relaxed OPEC response (up to 12 cents per gallon in our analysis). This
is equally, if not more, important from an economic stand-point than the change in US crude production growth. Complete methodological detail is available online at http://www.rhg.com/crudeexports.
FROM ENERGY TO ECONOMICS
What effect will an increase in US crude production and decrease in refined product prices have on US economic growth? Houser and Mohan (2014) find that as a result of the shale gas and tight oil boom, US economic output will be up to 2.3 percent higher in 2020 than it would have been otherwise thanks to higher production and low-er prices.109 Likewise, in examining the impact of removing crude export restrictions, the existing studies find a posi-tive impact on growth.
The magnitude of that impact varies due not just to the underlying energy market results (for example, the ex-tent of the increase in US crude production and reduc-tion in refined product prices) but also the economic methodology employed in each study. For example, the NERA and GS studies find roughly half the econom-ic benefit of each barrel of additional US crude pro-
$93.5
$80.8 $93.3
$100.5
$37.6 $35.2
$92.2 $92.3
$38.7
$0
$20
$40
$60
$80
$100
$120
$140
Low
Diffe
renti
al
High
Diffe
renti
al
Base
Pro
ducti
on
Poten
tial P
rodu
ction
Refer
ence
High
O&G
Res
ource
Low
Expo
rts
High
Exp
orts
No E
xpor
t Ban
ICF IHS NERA MAPI GS*
Figure 25: Increase in GDP from lifting crude export restrictionsBillion 2013 US per million b/d of additional US crude production, 2015–2025
Source: ICF, IHS, NERA, Aspen Institute, Goldman Sachs and Rhodium Group estimates.*2020 only.

NAVIGATING THE U.S. OIL EXPORT DEBATE
46 | CENTER ON GLObAL ENERGY POLICY | COLUMbIA SIPA
duction between 2015 and 2025 as the ICF, IHS, and MAPI studies (Figure 25).
The ICF, MAPI, and GS studies employ partial equilibri-um models that sum the “direct,” “indirect,” and “induced” economic impacts of an increase in crude production and a decrease in refined product prices, and a decline in refinery profit margins and investment. Direct impacts are those that occur within a given sector, such as oil production. Indirect impacts are the knock-on effects in industries that supply the directly impacted sectors, such as manufactur-ers of the steel pipe used for oil drilling. Induced impacts are in industries affected by changes in labor compensation in directly and indirectly impacted sectors, for example the restaurants where oil workers spend their paychecks. The GS study arrives at different results than the ICF and MAPI studies, which are based on different estimates of the relative partial equilibrium impact of increased oil pro-duction versus refinery utilization and investment—for ex-ample, they believe the direct, indirect, and induced eco-nomic benefits of increased domestic refinery utilization outweigh the direct, indirect and induced economic costs of lower domestic crude production, at least for a period of time.
In contrast, the NERA study employs a general equilibri-um model that captures additional economic effects. For example, increased investment and employment in the oil and gas sector means less labor and capital available for other types of economic activity. These general equilib-rium dynamics produce a “net” economic benefit that is smaller than the “gross” economic benefit found in partial equilibrium studies.
When the economy is recovering from recession, as the US economy still is today, the “net” numbers are closer to the “gross” because there is surplus labor and capital avail-able for employment/investment. The IHS study employs a macroeconomic model that captures short-term business cycles within a long-term equilibrium framework. With an assumption that the US economy will not return to full employment for several years, the IHS study finds larger net economic impacts between 2015 and 2025 than the NERA report (harmonized for projected increase in crude production). These gains dissipate with time, however, as the economy returns to full employment. For example, in the IHS Potential Production case, US GDP is 1 percent higher in 2020 if export restrictions are lifted, but only 0.4
percent higher in 2030. That means GDP growth between 2020 and 2030 is lower in the crude export case, though the overall level of GDP remains higher.
As with the shale gas and tight oil boom itself,110 an in-crease in domestic production and reduction in refined product prices resulting from a change in US crude ex-port policy can help accelerate the pace of US economic recovery. The investment in refining capacity required if export restrictions remain in place would have the same sort of stimulative effect as upstream oil and gas produc-tion but would not produce the same decline in refined product prices with its attendant economic benefits. In the context of the US economy as a whole, the magni-tude of the benefit of lifting crude export restrictions is modest, but it is a benefit all the same. That directional impact, combined with the geopolitical considerations described in the following chapter, should guide policy-makers thinking about more than point estimates of the impact on US GDP one or two decades from now, which are difficult to make given the fast-changing nature of both the US and global oil market.

NAVIGATING THE U.S. OIL EXPORT DEBATE
energypolicy.columbia.edu | JANUARY 2015 | 47
A DIFFERENT OIL MARKET
The previous section described the potential energy mar-ket and economic impact of lifting crude export restric-tions given relatively stable global oil market conditions. But those export restrictions were adopted in response to severe global supply disruptions, starting with the Arab oil embargo of 1973. President Nixon’s Project Independence, aimed at achieving oil self-sufficiency by 1980, was intend-ed to protect the country from physical oil supply shortag-es. Now that oil self-sufficiency is potentially within reach, won’t lifting crude export restrictions put the country at risk by leaving it dependent on imported oil while export-ing domestic production to other countries?
Today’s oil market is very different than it was during the 1970s. At that time, most oil was sold under long-term contracts.111 A disruption in contracted shipments could result in a physical shortage for the buyer because of the
lack of strategic and commercial stockpiles or a spot mar-ket where buyers could find alternative sources of supply. In the intervening years, the oil market has become the largest and most liquid commodity market on earth, with the vast majority of cargos bought and sold for a price in-dexed to benchmark spot crude prices and mature pric-ing hubs in regions including Europe (Brent), the Unit-ed States (WTI), and the Middle East (Dubai). A supply disruption in one country increases crude prices globally, which incentivizes both additional sources of supply and greater conservation and efficiency.112
In response to the supply disruptions of the 1970s, major oil consuming countries have also established strategic re-serves held by governments or companies, which can be released to add supply to the market during large disrup-tions to provide insurance against particularly severe global supply shocks. The International Energy Agency was cre-
THE ENERGY SECURITY CONSEQUENCES OF ALLOWING OIL EXPORTS
Less than a decade ago, the United States was the larg-est importer of petroleum products in the world. Access to those global markets allowed supply to keep pace with rising US gasoline demand. In recent years, however, the market has changed dramatically. US petroleum product demand has declined, especially for gasoline, due to im-proved vehicle efficiency, changing driving patterns, and the increasing substitution of nonpetroleum fuels such as ethanol for crude-based components. As crude production in the United States has swelled, so has the production of petroleum products, reflecting a combination of discounted domestic crude prices, complex refining capacity, access to export markets, and lower natural gas prices that boost re-finery economics.1 Total gross exports of finished petroleum products, natural gas liquids, other liquids including etha-nol, and crude oil topped 5.3 million b/d in July and August 2014, up a staggering 4 million b/d since 2005.
Despite the turnaround in the US refined product trade balance, free product trade continues to provide US en-ergy markets with much needed flexibility. Due to refinery configurations, as well as other factors, including Jones Act shipping costs,2 some regions of the United States remain net importers of refined petroleum products. The United States became a net exporter of distillate in 2008 and has imported gasoline for decades. Yet in each of the last two winters, when gasoline demand was low, the Unit-ed States became a net exporter of gasoline for brief peri-ods of time—a remarkable reversal of past trends.3 Access to the global market during these periods allowed refiners to continue to run at high capacity notwithstanding these seasonal variations, which boosted gasoline supply overall both in the United States and the global market. Restric-tions on export of gasoline and diesel would have removed this incentive and likely raised US pump prices.
LESSONS FROM TRADE IN REFINED PETROLEUM

NAVIGATING THE U.S. OIL EXPORT DEBATE
48 | CENTER ON GLObAL ENERGY POLICY | COLUMbIA SIPA
ated to coordinate and manage standards for international reserves and responses to oil market emergencies among OECD countries. In recent years, efforts have been made to extend reserve management practices to major non-OECD countries such as China, India, and Brazil.
Another major change over the past four decades has been the development of global refined product markets. Refin-ers can now sell their products globally and distributors can look abroad for their gasoline, diesel, fuel, and LPG, and there are mature refined product spot markets in New York, Rotterdam, Singapore, and elsewhere, and a growing volume of international refined product trade. As men-tioned earlier, the United States is now the largest refined product exporter in the world. This means that refined product prices in the United States are set by the glob-al market, and that the United States cannot disconnect itself from global markets, barring new restrictions on re-fined product trade. “Energy independence,” as the term is most often used, is not a viable option. Even if the United States achieves crude self-sufficiency, American businesses and consumers will still be vulnerable to global oil supply disruptions.113 As noted in the box “Lessons from Trade in Refined Petroleum,” international product trade has also meant that the market can respond more efficiently to changing patterns of global supply and demand.
THE BENEFITS OF INTERDEPENDENCE
The interdependence of the US and global oil market is not a bad thing. While politicians have extolled the bene-fits of “energy independence,” most scholars have preferred to focus instead on “energy security,”114 defined broadly as the availability (Are supplies on the market?), accessi-bility (Can you get to them?), and affordability (Can you get them at a competitive price?) of energy resources.115 Indeed, better integrating US crude into global oil mar-kets can improve both US and global energy security by all three measures.
Permitting US crude exports can mitigate the impact of an international supply disruption on the price Americans pay at the pump. As discussed previously, US refined prod-uct prices are set by global crude prices, and the impact of an international crude supply disruption on global crude prices depends on the speed at which other sources of crude supply can come online. US tight oil is the largest marginal
source of global oil supply today. It is also relatively quick to bring production online and less capital intensive com-pared to other marginal crude sources, meaning it likely would respond faster to changes in global prices than con-ventional oil production.116 If current crude export restric-tions result in a meaningful disconnect between interna-tional and domestic crude oil prices, an increase in global crude prices as the result of a non-US supply disruption will not be fully passed through to US crude producers, reducing their incentive to scale up production to offset supply disruptions elsewhere in the world.
The United States derives benefits from its participation in global oil markets, which allow it to mitigate the im-pact of supply disruptions, whether domestic crude pro-duction losses or disruptions in long-term import supply. As discussed in the “US Response to Supply Disruptions” box, large-scale US crude production losses due to extreme weather are not uncommon. The ability to offset these outages through increased imports confers an energy secu-rity benefit to the United States. Global market integration is also critical in helping the United States adjust when tra-ditional sources of imports are disrupted, as occurred with Venezuelan imports in 2002/2003. While crude export restrictions do not prevent the United States from tapping global markets for imports, were other countries to adopt similar policies, the United States would lose this source of supply flexibility and security. As a matter of principal, moreover, crude export restrictions are inconsistent with the US enjoying the benefits of petroleum trade and the US commitment to free and open markets.
As discussed in previous sections, lifting current crude ex-port restrictions would increase US production, although the size of this growth is unknown. To the extent that US supply is less prone to disruption than the global average due to political stability, an increase in US output could also reduce the severity and frequency of large global sup-ply shocks by increasing the share of stable oil supplies to the global market.117
THE ECONOMIC SECURITY IMPLICATIONS OF TRADE AND DEMAND
Lifting current crude export restrictions would also damp-en the economic impact of a given global oil price shock within the United States in other ways. Broadly speaking,

NAVIGATING THE U.S. OIL EXPORT DEBATE
energypolicy.columbia.edu | JANUARY 2015 | 49
oil price shocks impact the US economy in three ways.118 First, they increase business costs and reduce real household income. Second, they put upward pressure on prices econ-omy-wide, which can result in tighter monetary policy. Third, as long as the United States is a net oil importer, oil shocks deteriorate the country’s terms of trade and can result in large temporary increases in the country’s current account deficit.
To the extent lifting crude export restrictions increases US production, net US oil imports will decline. This is true even though gross imports increase as more light oil is exported and more heavy oil imported than would be the case were the export restriction to remain in place. In a recent report, the White House Council of Economic Advisers (CEA) found the “resilience of the economy to international supply shocks—macroeconomic energy se-
curity—is enhanced by reducing spending on net petro-leum imports and by reducing oil dependence.”119 This is due both to the smaller terms of trade penalty from an oil price shock, and the fact that more of the increase in oil producer revenue stays within the United States. Figure 26 shows CEA’s estimate of the difference in the impact on GDP of a 10 percent increase in oil prices where net oil imports represent 1 percent of total GDP versus a scenario where they are higher, representing 2 percent of total GDP.120
On the other hand, if lifting crude export restrictions re-sults in a decrease in gasoline and other refined product prices (as our previous discussion suggests it would), US oil demand will grow, exacerbating the impact of a given change in prices on household incomes, business expenses and overall inflation. Given the magnitude of the potential
Over the past decade, extreme weather events have had a substantial impact on crude production and refining along the Gulf Coast. Twice in the past ten years, in 2005 and 2008, hurricanes shut in 100 percent of offshore Gulf of Mexico production for at least several days. In the case of Hurricanes Katrina and Rita in 2005, 50 percent or more of production was shut in for 12 weeks. The damage in 2008 was not as severe, and the recovery was more rapid, re-sulting in approximately 20 percent of production remain-ing shut in after twelve weeks.1
These hurricanes also caused substantial Gulf Coast re-fining outages, up to 5 million b/d in 2005 and 4 million b/d in 2008.
In response to the 2005 supply disruption, the IEA co-ordinated a release of 60 million barrels of crude oil and petroleum products from strategic reserves. Refiners and wholesalers substantially increased refined product im-ports to offset the loss of domestic supply.2 Gasoline im-ports also increased during the 2008 supply disruption, though to a lesser degree.3
Several years earlier, in December 2002, Venezuelan opposition forces seeking the removal of Hugo Chavez
from power started a general strike, which resulted in a temporary oil production loss of about 3 million b/d. Al-though the political buildup to the strike had been close-ly watched by industry and the US government, the size and duration of the oil production decline took both by surprise.4 Subsequently, in March 2003, the US invaded Iraq, which again impacted supply and price.
The Venezuelan supply disruption impacted the United States more than any other country. Over the course of two months, US imports of crude and refined products from Venezuela dropped from more than 1.6 million b/d in November 2002 to 400,000 b/d in January 2003.5 Though many US refineries were heavily dependent on Venezuelan crude, by February 2003 they had managed to replace all lost Venezuelan supply with imports from other countries.6
In both cases of disruption, the adverse impact of the dis-ruption was significantly eased by the ability of the US to access the global petroleum market and increase imports of crude oil and refined products from other countries, along with the use of government-held strategic stocks. The US benefits from the integration of the global petro-leum market, and restrictions on crude oil exports are inconsistent with that principle.
US RESPONSE TO SUPPLY DISRUPTIONS

NAVIGATING THE U.S. OIL EXPORT DEBATE
50 | CENTER ON GLObAL ENERGY POLICY | COLUMbIA SIPA
refined product price decline projected in existing crude export studies, the impact on overall US oil demand would be small (likely 5 to 15 percent of the increase in produc-tion) so overall net imports would still decline. Assessing the net impact of higher demand and lower net imports is beyond the scope of this paper, but it is likely considerably smaller than the security and other benefits from greater global market integration.
MORE EXTREME SUPPLY DISRUPTION SCENARIOS
Thus far we have been discussing supply disruptions of a magnitude that increase global prices, but do not result in a widespread physical scarcity. What about more severe scenarios, such as global military conflict or the complete loss of a major producer like Saudi Arabia or Russia? If the United States suddenly found itself in a position where it could not import crude oil regardless of price, would we regret having lifted crude export restrictions?
Though this likely goes without saying, the United States will always have the ability to halt crude oil (as well as refined product) exports if it is in the country’s national interest to do so. The more important question is how quickly refiners would be able to switch from imported to domestic crude were such a scenario to arise. There would certainly be adjustment costs. As discussed in the previous section, running light crudes through a com-plex refinery can result in yield loss, and building hydro-skimmers takes time and money. The scale of investment is relatively minor relative to the broader economic and military costs that would likely accompany such a severe supply disruption scenario. Preserving current crude ex-port restrictions purely as a hedge against such low-prob-ability outcomes is high-cost insurance. Other options are likely more efficient, such as reconfiguring the strate-gic petroleum reserve to better suit the rapidly evolving US oil market landscape.
-‐0.7
-‐0.6
-‐0.5
-‐0.4
-‐0.3
-‐0.2
-‐0.1
0 0 1 2 3 4 5 6 7 8
1% Net Import Share
2% Net Import Share
Figure 26: Estimated cumulative effect of 10 percent oil price shock on GDPPercent change in GDP, quarters after shock
Source: White House Council of Economic Advisers.

NAVIGATING THE U.S. OIL EXPORT DEBATE
energypolicy.columbia.edu | JANUARY 2015 | 51
Since the founding of the postwar global trading system, the United States has been a leading proponent of open trade. For most of that time the United States was a net en-ergy importer, so access to international energy and natural resource supplies was an important trade policy priority. The United States has also traditionally supported open international trade on the principle that it improves eco-nomic welfare both for importers and exporters. With the surprise turnaround in US oil production and trade bal-ance, and with crude export restrictions beginning to dis-tort trade outcomes, America’s commitment to free trade principles is now being put to the test.
EXISTING TRADE COMMITMENTS
Crude oil is considered a good and thus subject to the disciplines of the General Agreement on Trade and Tariffs (GATT) and the World Trade Organization (WTO). Sev-eral GATT provisions are relevant to current crude export restrictions. Article XI disciplines the use of nonfiscal ex-port restrictions, such as quotas, export bans, or nonauto-matic export licensing.121 It states:
No prohibition or restriction other than duties, taxes or other charges, whether made effective through quotas, import or export licenses or other measures, shall be in-stituted or maintained by any contracting party on the importation of any product of the territory or any other contracting party or on the exportation or sale for export of any product destined for the territory of any other party.
An allowance is made under Article XI:2(a) for “export pro-hibitions or restrictions temporarily applied to prevent or re-lieve critical shortages of foodstuffs or other products essen-tial to the exportation of the contracting party.” A country imposing an export restriction could also argue the policy qualifies for one of the exceptions under Article XX, such as Article XX(g), which justifies measures “relating to the conservation of exhaustible natural resources.” The United States has a long history of successfully arguing against the use of such exceptions in export restriction cases.
In 1987, the United States challenged a provision of the 1976 Canadian Fisheries Act that prohibited the exporta-tion of some types of herring and salmon. Canada argued that its export restrictions were integral to their overall West Coast fisheries conservation and management regime and were thus justified under Article XX(g) of the GATT.122 A dispute settlement panel found that while salmon and herring were “exhaustible natural resources” and Canadi-an export restrictions did have some relationship to their conservation, that was not their primary aim and thus an Article XX(g) exception did not apply.
The United States in June 2009 requested WTO dispute settlement consultations with China regarding export re-strictions imposed on bauxite, coke, fluorspar, magnesium, manganese, silicon carbide, silicon metal, yellow phospho-rus, and zinc—important raw material inputs into steel and other manufacturing processes.123 The EU and Mexico did the same, and in December a single WTO dispute panel was established.124 China argued that the restrictions were justi-fied under Article XI:2(a) and Article XX(g), among other defenses. In its July 2011 report, the WTO panel rejected China’s claims. Regarding XI:2(a), the Panel found that XI:2(a) only applies to measures taken for a limited time to address a particular crisis causing a critical shortage. The Panel also found that China did not have a basis for an Ar-ticle XX(g) exception to many of the US, EU and Mexican complaints, due to special provisions included in its WTO accession agreement, but that in any event the Chinese pol-icy did not meet the Article XX(g) test because export re-strictions were not coupled with “restrictions on domestic production or consumption.”125 In January 2012, the WTO Appellate Body upheld this decision.126
Two months after the Appellate Body ruling, the United States challenged other Chinese export restrictions on the same grounds, this time covering rare earth resources, in-cluding tungsten and molybdenum.127 Canada, the EU and Japan subsequently joined the consultations. China again claimed an Article XX(g) exception. As with the raw materials case, the dispute panel found that China could
GEOPOLITICAL AND TRADE POLICY CONSIDERATIONS

NAVIGATING THE U.S. OIL EXPORT DEBATE
52 | CENTER ON GLObAL ENERGY POLICY | COLUMbIA SIPA
not claim the exception under given terms of its WTO accession agreement, but that in any event the exception would not apply because the export restrictions were de-signed to achieve industrial policy rather than conserva-tion goals and that China did not place a similar focus on restricting domestic production and consumption.128 This decision was also upheld by the Appellate Body.
Should the United States choose to maintain current crude export restrictions, it could be in the position of having to make the same Article XX(g) exception arguments that it successfully defeated in the Canadian and Chinese trade disputes described above. The precedent established in those cases would likely make such an Article XX(g) de-fense challenging. The United States would likely need to show the restrictions were related to the conservation of natural resources and that the export restrictions were matched with similarly aggressive efforts to reduce domes-tic oil demand and production.
The United States could also argue for an Article XXI ex-ception on national security grounds.129 This is the excep-tion generally cited in defense of US short supply controls on crude oil and refined petroleum products and dual-use military items. But Article XXI only allows an essential security exception “taken in time of war or other emer-gency in international relations.” Commenters have not-ed that although short supply restrictions have never been challenged before the WTO, they are suspect, as they are permanent, rather than in response to a temporary emer-gency.130 Beyond the Article XI disciplines, US export restrictions could also come under the disciplines of the WTO’s Agreement on Subsidies and Countervailing Mea-sures (ASCM) if they result in a significant discount for domestic crude compared to international crude. Trading partners could accuse the United States of subsidizing do-mestic refineries at the expense of foreign competitors.
CURRENT AND FUTURE TRADE TALKS
Equally, if not more, important as assessing the consistency of current crude export restrictions with existing US inter-national trade commitments, is assessing the implications of maintaining them on other US trade policy priorities. Were the United States to be challenged in the WTO and succeed in arguing for an Article XX(g) or Article XXI ex-ception, it would create a precedent that could limit the
ability of the US to challenge other countries export re-strictions in the future. Beyond the case law, it could also damage US credibility in arguing for the removal of do-mestic energy subsidies or export restrictions more broad-ly, or win non-energy concessions in current trade talks with the European and Asian countries.
In the negotiations over the Transatlantic Trade and In-vestment Partnership (TTIP), for example, the Europeans have argued for the inclusion of an energy chapter and the elimination of US energy export restrictions. In its initial negotiating position, the EU noted that for energy and raw materials an agreement should include “the elimina-tion of export restrictions, including duties or any measure that have a similar effect.”131 A subsequently leaked EU non-paper highlighted the crisis in Ukraine as an example of the threats to EU energy supply security that free trade in energy could help address.132 It also noted the success of US-EU cooperation in challenging China’s export restric-tions, and how maintaining export restrictions would un-dermine those efforts. “Combatting resource nationalism, together vis-à-vis third countries while at the same time al-lowing for export restrictions to exist between us sends the wrong message to our partners and offers some of these re-source-rich countries a great opportunity to interpret trade rules in a way which is detrimental to our economies.”
As the United States Trade Representative noted upon the conclusion of the China raw materials case, “by upholding rules on fair access to raw materials, this decision is a win not only for the United States, but also for every nation that respects the principles of openness and fairness. Those principles are the pillars of the rules-based global trading system, and we must protect them vigilantly.”133
GEOPOLITICS
All else equal, an increase in US crude production result-ing from the removal of current crude export restrictions would reduce non-US crude production and global crude oil prices. Using global supply-and-demand elasticities both from the academic literature and existing crude ex-port studies, even a 1.2 million b/d increase would have a relatively modest impact on global oil prices (a decline of $0 to $4 per barrel on average between 2015 and 2025) and non-US oil supply (a decrease of 200,000 to 1.0 mil-lion b/d on average between 2015 and 2025) relative to a

NAVIGATING THE U.S. OIL EXPORT DEBATE
energypolicy.columbia.edu | JANUARY 2015 | 53
global oil market expected to be producing more than 80 million b/d of crude oil (excluding other liquids) during that period (full methodology available at http://www.rhg.com/crudeexports). Still, it is useful to consider the po-tential geopolitical effects, if only directionally. Obviously, this effect also depends upon OPEC’s response to an in-crease in US supply and whether OPEC producers offset the increase by cutting output.
Lower global crude prices and lower non-US crude produc-tion reduces the economic power, fiscal resources and geo-political influence of large oil producing countries, from Saudi Arabia to Canada. Additional supply on the market also increases competition and reduces any one country’s ability to leverage its resources to gain geopolitical influ-ence. Conventional wisdom is that reducing oil revenue for geopolitical rivals like Russia and Iran is a geopolitical benefit to the United States. That is certainly the theory behind the recent application of financial sanctions against Russia and Iran. There is also a view that reducing the oil market share of autocratic allies like Saudi Arabia will free the United States to pursue other foreign policy objectives like human rights protection and democratization.134
Reducing foreign producers’ oil revenue and market share could have negative geopolitical consequences as well. Af-ter several years with oil prices at $100 or above, oil-pro-ducing countries have significantly increased oil-funded spending on domestic social programs, domestic security, and national defense.135 A sharp drop in oil prices such as the one that occurred in the second half of 2014 will challenge the sustainability of those fiscal plans, raising the prospect of political unrest. That could be positive, if cur-rent autocratic regimes become more democratic. It could also lead to broader instability in the Middle East, Africa, and Latin America, with attendant national security risks for the United States.
It is important not to overstate the magnitude of these im-pacts, either positive or negative. Even a 1.2 million b/d increase in US crude production as a result of lifting crude export restrictions could easily be overwhelmed by other market events. Despite the notable inability of OPEC to reduce output at its November 2014 meeting, OPEC, and Saudi Arabia in particular, will continue to play on outsize role in the global oil market in the longer term.136 This is due both to its current and projected market share137 and its unique ability to hold spare production capacity, which
is defined as the ability to bring production online within 30 days and sustain it for more than 90 days.138 This abil-ity to play the role of swing supplier has given Saudi Ara-bia unique market power and geopolitical influence but also helped balance the market in response to short-term supply disruptions or demand shocks.139 The political fate of oil-producing countries will be determined much more by other factors, such as the baseline crude-oil price out-look and domestic fiscal discipline. But at the margin, an export-driven increase in US oil production would likely geopolitically advantage the United States.
More trade
While the impact of lifting crude export restrictions on US production and global prices is uncertain and likely mod-est in the global context, the impact on US oil trade flows may be significant. With export restrictions in place, US refiners will continue to switch from imported to domestic crude and add capacity to handle more domestic supply, thus backing out more imports. If export restrictions are lifted, imports will be higher than they would otherwise be and the United States will likely export additional light tight oil production—although the global market for light oil and condensate is not without its limits. While net US oil imports will be lower without the export restrictions, thanks to an increase in domestic production, gross crude imports will be higher, as refiners import a certain type of crude that is best suited to their refineries and produc-ers export other types of crude to better-suited refineries abroad, as discussed in previous sections.
This increased trade, both of imports and exports, could have geopolitical consequences. Given the size and liquid-ity of the global oil market, where a country buys its crude from should theoretically make little difference in the event of a supply disruption. But the supply security concerns of politicians and defense planners mean specific bilateral trade flows can have significant geopolitical implications in practice.140 Oil importing countries, from the United States to Japan, have long attached special importance to their bilateral relationship with crude trading partners. The importing country is often seen as the subjugate in such relationships, though, ironically, Chinese oil imports are generally seen by the West as providing Beijing with geopolitical leverage. Yet like all freely entered commercial engagements, the benefits of trade are mutual. Beyond the

NAVIGATING THE U.S. OIL EXPORT DEBATE
54 | CENTER ON GLObAL ENERGY POLICY | COLUMbIA SIPA
direct economic gains, trade generally improves bilateral relations more broadly, opens new lines of communication and reduces the odds of conflict.141 Lifting crude export restrictions extends US geopolitical influence by maintain-ing current trade relationships on the import side and gen-erating new ones through exports.
Diplomatic leverage
As with international trade, the most significant geopoliti-cal impact of lifting crude export restrictions might be on overall US diplomatic leverage and credibility rather than direct market or security outcomes. Recent application of financial sanctions to achieve foreign policy objectives pro-vides an excellent example.
While sanctions have long been a feature of the US foreign policy arsenal, they are being used in increasingly novel and targeted ways, often against large energy producing coun-tries, not only to cut off energy flows but also to isolate them from international financial and commercial systems through financial tools, pressure, and market forces.142
Two recent examples are the imposition of financial sanc-tions on Iran and Russia, two of the world’s largest oil pro-ducers. In both cases, success required addressing concerns both within the United States and other countries that global oil prices would not spike in response to a sanc-tions-driven loss of supply. That concern was most acute in the Russian case, as the country is responsible for more than 10 percent of global crude oil supply, and resulted in narrower sanctions targeted at future oil investment rather than current oil supply.143 Oil price concerns were also a major obstacle in building international support for much broader sanctions against Iran.
The United States has prohibited trade with Iran for years.144 In 2011 it designated a number of Iranian elites as engaged in terrorism or nuclear proliferation, making both US and foreign companies and individuals doing business with these Iranian elites subject to sanction un-der the Comprehensive Iran Sanctions and Accountabil-ity Act (CISADA).145 Later that year, the US Congress included provisions in the National Defense Authoriza-tion Act (NDAA) that instructed the administration to persuade other countries to “significantly” reduce their purchases of Iranian crude oil or face sanctions in the United States.146
With crude oil prices spiking to $125 per barrel shortly after the NDAA was signed into law, US diplomats had a difficult task in persuading Iran’s oil buyers to reduce pur-chases and diversify their sources of supply. Iran’s custom-ers were concerned about their ability to find alternative sources of supply without putting further upward pressure on prices. Saudi Arabia’s decision to increase production helped placate these fears, as did speculation of a stock-pile release by IEA member countries (particularly since IEA countries had released strategic oil reserves the prior year, in June 2011, in response to the Libya disruption). The rapid growth in US production was also a significant factor.147 It increased the range of supply options available to other countries by displacing US imports, and helped moderate the increase in global oil prices resulting from a loss in Iranian supply.
To the extent that maintaining US crude export restric-tions reduces US production growth, future attempts to build international support for sanctions against oil-pro-ducing countries may be less successful. More important, it will be tough for US diplomats to press other countries to reduce crude imports from a target country in the in-terest of global peace and security if the United States is unwilling to help make alternative supplies available.

NAVIGATING THE U.S. OIL EXPORT DEBATE
energypolicy.columbia.edu | JANUARY 2015 | 55
While an increase in US crude oil production resulting from a modification or removal of current export restric-tions has economic, security, and foreign policy benefits, it also carries environmental risks.
LOCAL ENVIRONMENTAL IMPACTS
Development of oil and gas from shale and other tight for-mations poses environmental risks that must be managed at both the state and federal level. US tight oil and shale gas production is set to grow independent of export policy decisions, so it is critical that states and the federal govern-ment continue to improve the level of regulation and en-forcement. There are a number of local risks that have been identified with development of shale gas and oil.148 While a full accounting of the research into the impacts of shale de-velopment is beyond the scope of this study,149 an advisory board to the US Secretary of Energy identified four main areas of concern: “(1) Possible pollution of drinking wa-ter from methane and chemicals used in fracturing fluids; (2) Air pollution; (3) Community disruption during shale gas production; and (4) Cumulative adverse impacts that intensive shale production can have on communities and ecosystems.”150 Best-practice regulations continue to be developed and improved and can be implemented at mod-est cost.151 For example, the International Energy Agency found that drilling shale wells at the highest standards for safety increases production costs by only 7 percent.152
CLIMATE CHANGE CONSEQUENCES
Lifting current crude oil export restrictions has global envi-ronmental implications as well. According to the Environ-mental Protection Agency (EPA)’s greenhouse gas (GHG) emission inventory, the production and transportation of oil was responsible for 32 million metric tons (MMT) of carbon dioxide (CO2) or other GHGs in 2012, measured on a CO2-equivalent basis (CO2e).153 That’s relatively small in context of the 6,256 MMT of gross GHGs the Unit-ed States emitted that year. More consequential are CO2
emissions from the combustion of refined petroleum prod-ucts in vehicles, buildings, and industrial facilities, which accounted for 34 percent of total US GHG emissions in 2012. Oil combustion is responsible for a smaller share of emissions outside the United States but still accounts for nearly a quarter of the global GHG total.154
To the extent US crude exports increase domestic produc-tion and lower oil and gasoline prices, changing US crude oil export restrictions would likely lead to higher US and global oil-related GHG emissions by increasing consump-tion globally. Crude exports may also impact international crude and refined product trade flows, although this latter consideration is quite minor. The transport of crude and refined product accounts for only 1.1 to 2.5 percent of the “wells-to-wheels” GHG emissions from a barrel of oil, depending on the type of fuel (Figure 27). Therefore, we focus our analysis on the impact of lifting crude export restrictions on global oil production and consumption, ex-cluding consideration of trade flow effects.155
As discussed previously, our analysis suggests that lifting current crude oil export restrictions could increase US crude production by anywhere between 0 and 1.2 million b/d on average between 2015 and 2025. Assessing the global GHG impact of this increase requires answering two separate questions:
1. How much of the increase in US production is offset by a decrease in production elsewhere in the world—i.e., how much does total global supply and demand increase on net?
2. Where does the decrease in non-US production occur?
The answer to the first question depends on price elasticity of global oil demand (how responsive global crude demand is to a change in global crude price) and the price elasticity of non-US crude supply (how responsive non-US crude production is to a given change in global crude price). There is a wealth of academic literature that attempts to econometrically estimate the long-term price elasticity of
ENVIRONMENTAL CONSIDERATIONS

NAVIGATING THE U.S. OIL EXPORT DEBATE
56 | CENTER ON GLObAL ENERGY POLICY | COLUMbIA SIPA
global oil demand. Estimates vary depending on the time period and region of study, but most fall between –0.072156 and –0.3.157 An elasticity of –0.072 means that a 1 percent reduction in global crude prices would lead to a 0.072 per-cent increase in global crude demand. An elasticity of –0.3 increases the demand response to 0.3 percent. The EIA uses a non-US demand elasticity of –0.25 in their Annual Energy Outlook modeling. The ICF study uses an elastic-ity of –0.23. NERA starts with an elasticity of –0.1 that grows to –0.5 over time. IHS does not report their specific demand elasticity estimates.
Empirically deriving the long-term price elasticity of global oil supply is much more challenging due to the rapidly changing cost structure of global oil production and the presence of a large producer cartel (OPEC). The few estimates available range from 0.15 (IMF 2012) to 0.25 (Krichene 2002). A supply elasticity of 0.15 means that a 1 percent increase in global crude price would result in a 0.15 percent increase in global crude supply. An elasticity of 0.25 would increase the supply response to 0.25 percent. The EIA uses a non-US supply elastic-
ity of 0.25 in their modeling. ICF uses an elasticity of 0.281. NERA uses an elasticity of 0.3 that grows to 1.0 over time.
On the one hand, it may be in OPEC’s collective interest to offset an increase in US production with domestic sup-ply cuts to try to prevent a drop in global oil prices and maximize export revenue. That would result in a higher price elasticity of non-US crude supply. For example, the NERA study includes side cases in which OPEC cuts pro-duction to fully offset the increase in US output. The price elasticity of non-US crude supply is over 3.5 on average between 2015 and 2025 in this scenario, as opposed to 0.4 in NERA’s core High Oil & Gas Resource scenario where OPEC production decisions are made based on marginal cost. While US production increases by 3.3 million b/d on average between 2015 and 2025, OPEC supply cuts mean global demand only increases by 200,000 b/d. In NERA’s default High Oil & Gas Resource scenario, US production grows by 2.8 million b/d on average between 2015 and 2025 and global demand grows by 900,000 b/d.
0
100
200
300
400
500
600
700
Cana
da (S
AGD
SCO)
Vene
zuela
(Petr
ozua
ta)
Nige
ria (B
onny
Ligh
t)
Iraq (
Basra
Ligh
t)
Cana
da (M
ining
dilbi
t)
Mexic
o (Ma
yan)
Russ
ia (U
rals)
US (B
akke
n)
Saud
i Ara
bia (A
rab L
ight)
Braz
il (Tu
pi)
North
Sea
(Stat
fjord
)
US (E
agle
Ford
)
Refined Product Combustion Refined Product Transport Crude Refining Crude Transport Upgrading Crude Production
Figure 27: Wells-to-wheels crude oil GHG emissionskgCO2e/barrel of refined product
Source: IHS CERA 2012 and IHS Energy 2014. Includes emissions from upstream fuels used to produce, upgrade or refine crude oil (wide boundary).

NAVIGATING THE U.S. OIL EXPORT DEBATE
energypolicy.columbia.edu | JANUARY 2015 | 57
On the other hand, OPEC has a mixed track record at best of functioning effectively as a cartel, as already discussed. This is particularly true during periods when global demand growth is weak and non-OPEC supply is expanding. When that oc-curred in the 1980s, OPEC cohesion broke down and crude prices collapsed. With market conditions somewhat similar today, there is speculation that Saudi Arabia and other OPEC countries will continue to be reluctant to cut output and in-stead let prices stay low so that other producers are forced to scale back. Such behavior (which lowers the price elasticity of global oil supply) is great for consumers but also means that a given increase in US production will result in a larger increase in global oil demand. Although it is too early to rule out OPEC cuts in the current environment, the recent meeting of OPEC in November 2014 adds further weight to the view that OPEC may not act as a cartel to cut back production in response to a further increase in US supply.
Given the uncertainty around the long-run price elasticity of both crude oil supply and demand, a 1.2 million b/d increase in US production due to removing current export restrictions could result in anywhere between a 0 and 1 million b/d increase in global crude demand (see Rhodi-um Group GHG analysis at http://www.rhg.com/crudeex-ports).158 As mentioned above, the GHG emissions from this increase in demand will depend on the GHG-intensi-ty of US LTO production versus the 200,000 to 1.2 mil-lion b/d of non-US crude production displaced. Projecting which sources of crude production will decline in response to an increase in US output is even more challenging than estimating the magnitude of that decline. We assess the net GHG impact of a 0 to 1 million b/d net increase in global crude demand under two scenarios:
Scenario 1: All the reduction in non-US crude output oc-curs in relatively GHG-intensive sources of production. As a proxy we use synthetic crude oil (SCO) produced from the Canadian oil sands using the Steam Assisted Gravity Drain-age (SAGD) production process. IHS estimates the wells-to-wheels GHG emissions from this crude source is 598 kilograms of CO2e per barrel of refined product (Figure 27).
Scenario 2: All the reduction in non-US crude output oc-curs in relatively GHG-light sources of production. As a proxy we used Statfjord crude produced in Europe’s North Sea. IHS estimates the wells-to-wheels GHG emissions from this crude source is 459 kilograms of CO2e per barrel of refined product (Figure 27).
In reality, a range of crudes will likely be displaced by high-er US LTO production, but this approach was selected to provide upper and lower bound estimates. For the Unit-ed States, we assume the increase in LTO production will have a wells-to-wheels GHG profile of 467 kilograms of CO2e per barrel, an average of IHS’s estimates of the Bak-ken (479) and the Eagle Ford (455) oils.
Using this approach, if easing export restriction resulted in 1.2 million b/d of increased US LTO production, the net impact on global GHG emissions would be –57 to +168 MMTCO2e. A smaller increase in US production would result in a smaller increase (or at the other end of the range a smaller decrease) in CO2 emissions.
In factoring potential GHG emissions into any policy deci-sion regarding current crude oil export restrictions, the fact that the majority of any increase in crude oil demand (and associated CO2) would occur outside the United States is an important consideration. International climate diplomacy is organized around the principle that countries have autonomy in determining how to reduce emissions within their borders. There is great variation across countries both in natural re-source endowments and economic circumstances, and each country has its own political considerations and constraints. Making progress on climate thus requires affording countries the flexibility to design domestically tailored emission reduc-tion strategies. For some countries, renewable energy deploy-ment might make the most sense. For others, reducing defor-estation may be a better initial focus. The countries in which oil demand could increase if US export restrictions are lifted may welcome the reduction in oil prices and prefer to reduce emissions in other parts of their economies. They also have the option of preventing lower prices from translating into higher demand (and associated emissions) through vehicle ef-ficiency improvements or fossil fuel subsidy reform. But those are choices best left to them to make.
It is also important to consider the cost of addressing GHG emissions through crude export restrictions relative to other policy choices. There are a wide range of more cost-effective policy options for reducing global GHG emissions, from EPA’s recently proposed CO2 emissions standards for existing power plants, to federal regulation of fugitive methane emissions from oil and gas production, to extended heavy-duty vehicle standards or tightened light duty vehicle standards. And these emission reductions would all occur at home.159

NAVIGATING THE U.S. OIL EXPORT DEBATE
58 | CENTER ON GLObAL ENERGY POLICY | COLUMbIA SIPA
Much discussion has focused on whether lawmakers will “lift the ban” on crude oil exports. Events throughout 2014, however, have made clear that while there are statutory re-strictions on crude oil exports, there are also a number of exceptions to those restrictions, and a range of options for further loosening restrictions should policymakers wish to do so. Indeed, under current law crude exports are expect-ed to reach around 500,000 b/d by early 2015, up from 27,000 b/d on average during the 2000s.160 The United States now exports more crude oil than OPEC member Ec-uador.161 These levels could rise further even absent govern-ment action through a combination of exports to Canada, re-exports, processed condensate exports, and exports from Alaska.162 Allowing crude exports above these levels, howev-er, would require action by the administration, using legal authority it has under existing law, or action by Congress to change those laws. Broadly speaking, there are four potential policy routes to ease the crude export restrictions.
USE OF PRESIDENTIAL NATIONAL INTEREST AUTHORITY
First, the president has the authority under EPCA to allow crude oil exports based on a national-interest determina-tion by making a “class of seller or purchaser, country of destination, or any other reasonable classification or ba-sis as the president determines” exempt from the ban. As noted earlier, this authority has been used by three other presidents on five different occasions. The president could make such a national interest finding for a certain group of nations—for example, that it is in the national interest to permit crude exports to free trade agreement countries or to NATO allies. Whatever the category of countries, if the goal is to ensure that the US oil price is not artificially discounted relative to the world price, it would be import-ant to ensure the countries permitted for export provide adequate refinery demand for US light crude oil. Alter-natively, the president could allow crude oil exports of a certain quality, such as above 40 or 45 degrees API gravity, acknowledging how the US oil production outlook has
changed and how it is mismatched with legacy US refining capacity. The president could also find it is in the national interest to lift the export ban entirely.
FLEXIBLE ADMINISTRATIVE INTERPRETATION OF EXISTING REGULATIONS
Second, the Department of Commerce could proceed with a flexible approach in its application of existing laws and regulations. This approach seems to have been evident re-cently when it granted classification rulings to Pioneer and Enterprise to export condensate processed through stabi-lizers that include a simple distillation tower.163 And it was further evident when BIS on December 30 2014 issued a set of FAQs that identified six factors it will consider, among others, in determining whether liquid hydrocar-bons have been “processed through a crude oil distillation tower.”164 As discussed previously, these factors make clear that other companies may now export lightly processed condensate that has been both stabilized and processed through a field distillation tower, and may open the door beyond condensate to some exports of light oil (e.g., 40 or 45 API gravity) processed through simple and cheaper (around $150 to 200 million) stabilization and distillation units.165 The volume of condensate and light oil that will be permissible to export will be determined by how flexi-bly and permissively BIS interprets the new FAQs that it has issued. Because the classification rulings are not public, it is difficult to know exactly how the FAQs will be applied in practice and what reasoning is used to reach findings about what may or may not be exported.
Similarly, the Commerce Department may be asked to ap-prove licenses for exchange transactions. As noted above, that will require Commerce to make determinations about such questions as how to determine whether one type of crude is “of an equal or greater quality” to another, or whether a batch of crude “cannot reasonably be market-ed in the US” for “compelling economic or technological reasons.”166
POLICY OPTIONS

NAVIGATING THE U.S. OIL EXPORT DEBATE
energypolicy.columbia.edu | JANUARY 2015 | 59
To the extent Commerce has some discretion to be more or less permissive in how it applies existing regulatory lan-guage to create certain pathways to ease the current export restriction, adopting a more flexible approach may provide more outlets for light oil and condensate.
Beyond condensate and exchanges, Commerce has the authority to approve exports on a case-by-case basis “if BIS determines that the proposed export is consistent with the national interest and the purposes of the En-ergy Policy and Conservation Act (EPCA).” Presently the regulations specify the types of transactions that will generally be approved, such as exchanges, although it notes “BIS will consider all applications for approval.” Commerce could take an expansive view of the types of transactions it will approve on a case-by-case basis and could further amend its regulations to specify additional types of transactions beyond exchanges that will generally be approved, for example, light oil above a certain API gravity threshold.
ADMINISTRATIVE MODIFICATION OF EXIST-ING REGULATIONS
Third, the Department of Commerce could change the existing regulations to loosen the export restriction. Be-cause there is no definition of crude oil in EPCA, such a change could be done by the Department of Commerce, although it would likely require a notice and comment rulemaking under the Administrative Procedure Act. For example, it might consider whether to modify the defi-nition of crude oil in the BIS regulations to explicitly exclude condensate (defined as a certain API gravity, say
50 degrees and above). This would allow condensate to be exported straight from the wellhead, rather than re-quiring that it be processed into a refined product so it could be sold abroad.
At present, the same exact condensate molecules may in some cases already be treated differently for the purposes of export, depending on whether they came from the field or from a natural gas processing plant, so such a change would have some justification in addressing that inconsis-tency. Moreover, such a change would be consistent with the way crude is defined in several other contexts.167 Not-withstanding sanctions, Iranian exports have increased re-cently because they are exporting a larger volume of con-densate, which is not considered crude under the existing sanctions law.168 This creates the rather ironic outcome that Iran can export condensate because the law does not consider it crude oil, while US producers cannot because the law does consider it crude oil.
Such a regulatory change would raise thorny questions—for example, exactly how does one define condensate? And if the definition is just based on an API gravity level, can different crudes be mixed to create a blend crude that meets that cutoff point?
Allowing condensate exports via the application of more flexible administrative interpretation, either minimally processed as refined product or directly from the wellhead, is appealing as a political matter because it can be done with minimal modifications to existing regulations instead of requiring a presidential national interest finding. More-over, such an approach would allow time for the public and policymakers to develop a greater understanding of
The volume of condensate and light oil that will be permissible to export will be determined by how flexibly and permissively BIS interprets the new FAQs that it has issued.
NAVIGATING THE U.S. OIL EXPORT DEBATE
60 | CENTER ON GLObAL ENERGY POLICY | COLUMbIA SIPA
the magnitude of the potential market problem and exist-ing uncertainties about the cost of accommodating a light-er crude slate.
While allowing condensates to be sold to other countries would be a meaningful adjustment to current export restric-tions, there are limitations policymakers should consider. It is important to bear in mind that condensate exports provide some relief but do leave the fundamental market problem largely unaddressed. While condensate produc-tion has grown rapidly, the EIA estimates it accounts for only 10 percent of the total increase in US light oil supply growth since 2011.169 Allowing condensate exports, lightly processed or direct from the wellhead, is projected to result in exports of roughly 300,000 to 500,000 b/d and thus put off the potential light sweet surplus by roughly one to two years, although the oil price drop may extend this period by slowing the rate of US production growth.170
CONGRESSIONAL ACTION
Finally, Congress could change the law. Although this would provide the most long-term certainty, and would be necessary to completely remove the export restriction rather than just narrow its scope or create national interest exceptions to it, the current challenges evident with pass-ing any legislation through Congress suggest this may not be likely any time soon. While incoming Senate Energy Committee chair Lisa Murkowski has been very vocal in supporting lifting the restriction, few other members of either party have yet spoken out forcefully on the issue.171 That is not surprising, given political sensitivity to gasoline prices and the public perception that domestic oil supply should be kept within the United States in an attempt to lower domestic gasoline prices.172 Unlike some other energy production–related issues, such as the highly visible Keystone XL decision, which often break down along par-ty lines, supporting oil exports may be perceived as politi-cally perilous by politicians of both political parties.

NAVIGATING THE U.S. OIL EXPORT DEBATE
energypolicy.columbia.edu | JANUARY 2015 | 61
Today’s oil market looks very different than it did in the 1970s, when current crude oil export restrictions were first put in place. At that time, the United States had adopted domestic price controls to combat inflation, and crude ex-port restrictions were necessary to make those price con-trols effective. While price controls have long since fallen away, crude export restrictions remain. They have been modified over time to reflect market changes, but the cur-rent US tight oil boom is putting the regime as a whole to the test.
We find that the original rationale for crude export restric-tions no longer applies. If recent production growth rates continue, we will exhaust the ability of existing refineries to process additional US light crude within the next few years. If that happens, current crude export restrictions will distort market outcomes, reducing US crude output, increasing the price of gasoline and other refined product prices, and harming the US economy. While the direction of the impact is clear, the magnitude and timing is highly uncertain, and has likely been overstated in some recent analysis. This is particularly true given the recent drop in global oil prices, which all else equal will slow the rate of US production growth and delay the point at which cur-rent crude export restrictions really begin to bite.
Allowing free trade in crude oil would not, as many fear, harm US energy security. Indeed, at the margin, it would make the United States more resilient to supply disrup-tions elsewhere in the world. Lifting crude export restric-tions would also be consistent with past US trade policy positions and be supportive of current trade policy objec-tives. And increased US production can weaken the eco-nomic power, fiscal strength and geopolitical influence of other large oil producers, as the recent oil price drop has demonstrated.
To the extent that allowing crude exports increases over-all US production and thus lowers oil and gasoline prices here and around the world, it will likely lead to more glob-al consumption and thus CO2 emissions relative to what
they otherwise would have been. While we do not believe export restrictions are an appropriate or cost-effective way to reduce CO2 emissions, it is critical that more aggres-sive policy actions be taken to address climate change. Full implementation of recently proposed CO2 emission standards for existing power plants under the Clean Air Act, regulation of fugitive methane emissions from oil and gas production, extension of fuel economy standards for heavy-duty vehicles, and strengthened fuel economy standards for light-duty vehicles are all cost-effective and meaningful steps. We can support domestic production while still meeting our climate change objectives, but that requires new policy to reduce US oil consumption and production-related GHG emissions, as well as action in other sectors.
CONCLUSION

NAVIGATING THE U.S. OIL EXPORT DEBATE
62 | CENTER ON GLObAL ENERGY POLICY | COLUMbIA SIPA
1 Preliminary weekly data from the US Energy Information Administration shows that US crude oil production topped 9 million b/d in November 2014. See “Petroleum and Other Liq-uids: Weekly US Field Production of Crude Oil,” http://www.eia.gov/dnav/pet/hist/LeafHandler.ashx?n=PET&s=WCRF-PUS2&f=W.
2 Consistent with the practice of the International Ener-gy Agency (IEA) and US Energy Information Administration (EIA), this study uses the term “oil” to refer to crude oil, con-densates, and natural gas liquids (NGLs). EIA defines lease con-densates as light liquid hydrocarbons recovered from lease sep-arators or field facilities at associated and nonassociated natural gas wells, and natural gas liquids as a group of hydrocarbons including ethane, propane, normal butane, isobutane, and natu-ral gasoline (generally including natural gas plant liquids and all liquefied refinery gases except olefins). For more detailed defini-tions, see the EIA “Glossary” http://www.eia.gov/tools/glossary/index.cfm?id=A.
3 IEA, “Oil Market Report,” December 2014. At the time of publication, Russia and Saudi Arabia still surpassed the United States in crude oil production.
4 Imports of these fuels were limited to a fixed percentage of domestic oil production. Imports to the West Coast were less stringent, as were imports of residual fuel to the United States. For further details, see J. Kalt, The Economics and Politics of Oil Price Regulation (Cambridge, MA: MIT Press, 1981), p. 6.
5 Presidential Proclamation 3279 (1959), http://www.presi-dency.ucsb.edu/ws/?pid=11676.
6 D. Yergin, The Prize: The Epic Quest for Oil, Money and Power (New York: Simon and Schuster, 1992), p. 539.
7 EIA, “Petroleum and Other Liquids: US Field Production of Crude Oil,” http://www.eia.gov/dnav/pet/hist/LeafHandler.ashx?n=PET&s=MCRFPUS2&f=M.
8 Based on EIA data showing US crude oil production of 5.4 million b/d in January 2010 and average production of 8.99 million b/d for the four weeks to 11 November 2014. For monthly data see “US Field Production of Crude Oil,” http://www.eia.gov/dnav/pet/hist/LeafHandler.ashx?n=PET&s=M-
CRFPUS2&f=M and for weekly data see “Petroleum and Other Liquids: Weekly Supply Estimates,” http://www.eia.gov/dnav/pet/pet_sum_sndw_dcus_nus_4.htm.
9 J. Kalt, Economics and Politics of Oil Price Regulation, pp. 5–6; D. Bohi and R. Milton, Limiting Oil Imports: An Econom-ic History and Analysis (Baltimore: Johns Hopkins University Press, 1978), p. 307. While increased production necessarily leads to faster resource depletion, some political leaders had long argued that national security was best served by conserv-ing domestic supply for the future. J. Frankel, “National Secu-rity and Domestic Oil Depletion,” Discussion Paper 2014-58 (Cambridge, MA: Harvard Environmental Economics Pro-gram, September 2014).
10 Yergin, The Prize, p. 548.
11 Ibid., p. 550. The Clean Air Act of 1963 was the first fed-eral legislation aimed at controlling air pollution. “Clean Air Act of 1963,” (PL 88-206, 17 December 1963), United States Stat-ute at Large, http://www.gpo.gov/fdsys/pkg/STATUTE-77/pdf/STATUTE-77-Pg392.pdf.
12 “Man-Made Fuel Crisis,” New York Times op-ed, 2 Octo-ber 1970.
13 Yergin, The Prize, p. 549.
14 R. Weisberg, The Politics of Crude Oil Pricing in the Middle East, 1970–1975, (Berkeley, CA: Institute of International Stud-ies, 1977), p. 49. In the latter half of the 1960s, an increasing number of exceptions to the import quotas had been allowed for various petroleum products (including fuel oil, asphalt, and home heating oil) in response to higher prices and political pressure.
15 Yergin, The Prize, p. 549.
16 Bureau of Labor Statistics, “Consumer Price Index-All Ur-ban Consumers; US All Items, 1967=100,” http://data.bls.gov/cgi-bin/surveymost?cu.
17 These controls were implemented pursuant to the Eco-nomic Stabilization Act of 1970. Kalt, Economics and Politics of Oil Price Regulation, p. 9.
NOTES

NAVIGATING THE U.S. OIL EXPORT DEBATE
energypolicy.columbia.edu | JANUARY 2015 | 63
18 D. Yergin. and J. Stanislaw, The Commanding Heights: The Battle for the World Economy, (New York: Simon & Schuster, 1998), chap. 2.
19 Yergin, The Prize, p. 572. In June 1971 President Nix-on delivered the first ever Presidential Message on energy re-sources to Congress. He noted that recent brownouts, threat-ened fuel shortages, and rising fuel costs demonstrated that the United States could no longer assume it would have a sufficient supply of energy. He outlined a plan to increase research and development spending, increase domestic pro-duction of oil and gas, and address environmental issues such as air pollution. R. Nixon, “Special Message to Congress on Energy Resources,” 4 June 1971. The American Presidency Project, http://www.presidency.ucsb.edu/ws/?pid=3038.
20 R. Nixon, “Special Message to the Congress on Energy Policy.”
21 BP Statistical Review, “Oil Consumption,” 2014, http://www.bp.com/en/global/corporate/aboutbp/energy-economics/sta-tistical-review-of-world-energy/statistical-reviewdownloads.html.
22 “Emergency Petroleum Allocation Act of 1973” (PL 93–159, 27 November 1973), United States Statute at Large, http://uscode.house.gov/statutes/pl/93/159.pdf.
23 Ibid.
24 US Department of Commerce, “Export Administration Report, Fourth Quarter,” 1973, https://archive.org/stream/ex-portadminist00unit/exportadminist00unit_djvu.txt.
25 US Department of the Interior, Office of Economic Anal-ysis, “An Analysis of the Economic and Security Aspects of the Trans-Alaska Pipeline,” vol. 1, p. F-20, December 1971.
26 Ibid.
27 It was expected (and indeed came to pass) that some of the oil produced from the North Slope would pass through Panama to reach US refining centers other than California, the main antic-ipated destination, specifically the Gulf Coast and the East Coast. This would technically require the oil being temporarily exported. US General Accounting Office, Report to Congressional Com-mittees, “Alaskan North Slope Oil: Limited Effects of Lifting Ex-port Ban on Oil and Shipping Industries and Consumers,” 1 July 1999, http://www.gao.gov/assets/160/156640.pdf, p. 33.
28 In November 1974 Canada announced that it would be phasing out exports to the United States in an effort to bolster its domestic industry, cutting off supplies to US Northern Tier refineries in border states. A US and Canadian working group
came up with a plan to allow crude exchanges of equal quanti-ties between Canadian and US refiners to keep some traditional trade ongoing and help keep transport costs in check—allowed within the language of the TAPS Amendment. The informal program was adopted in August 1976. “Crude pro Quo: The Use of Oil Exchanges to Increase Efficiency,” prepared by Senate Minority Staff on the US Senate Committee on Energy and Nat-ural Resources, 22 May 2014, p. 2, http://www.energy.senate.gov/public/index.cfm/files/serve?File_id=22ab820b-5a47-4bc8-a025-a8507817a790.
29 “Rights-of-Way for Pipelines through Federal Lands,” 30 U.S.C. §185(u), http://www.gpo.gov/fdsys/pkg/USCODE-2011- title30/html/USCODE-2011-title30-chap3A-subchapI-sec185.htm; “Outer Continental Shelf Lands Act of 1978” (PL 95-372, Sep. 18, 1978), United States Statute at Large, http://www.gpo.gov/fdsys/pkg/STATUTE-92/pdf/STATUTE-92-Pg629.pdf; “Naval Petroleum Reserve Production Act of 1976” (PL 94-258, Apr. 5, 1976), United States Statute at Large, http://www.gpo.gov/fdsys/pkg/STATUTE-90/pdf/STATUTE-90Pg303.pdf.
30 Energy Information Administration, “Petroleum Chronol-ogy of Events 1970 to 2000,” http://www.eia.gov/pub/oil_gas/petroleum/analysis_publications/chronology/petroleumchro-nology2000.htm#T_8_.
31 R. Reagan, “Decontrol of Crude Oil and Refined Petro-leum Products,” 28 January 1981. http://www.presidency.ucsb.edu/ws/?pid=43901. The Carter Administration had begun to decontrol prices on crude oil in 1979; decontrol of refined petro-leum products had begun in 1976. Kalt, Economics and Politics of Oil Price Regulation, pp. 16–19.
32 US Department of Commerce, “Elimination of Quantita-tive Limitations on Export of Refined Petroleum Products,” 46 Federal Register 49108, 6 October 1981.
33 R. Reagan, “Presidential Findings on the United States-Ca-nadian Crude Oil Transfers,” 14 June 1985. The American Presi-dency Project, http://www.presidency.ucsb.edu/ws/?pid=38774.
34 US Department of Commerce, “Exports of Crude Oil De-rived from Alaska’s Cook Inlet,” 50 Federal Register 52798, 26 December 1985.
35 R. Reagan, “Presidential Findings Regarding the Export of Alaskan Crude Oil to Canada,” 31 December 1988, http://www.reagan.utexas.edu/archives/speeches/1988/123188e.htm.
36 G. H. W. Bush, Presidential Memorandum for Secretary of Commerce [and] Secretary of Energy, “Exports of Domestically Pro-duced Heavy Crude Oil,” 22 October 1993, reproduced in US Sen-

NAVIGATING THE U.S. OIL EXPORT DEBATE
64 | CENTER ON GLObAL ENERGY POLICY | COLUMbIA SIPA
ate Energy and Natural Resources Committee, Minority Staff Report, “Past is Precedent: Executive Power to Authorize Crude Oil Exports,” 3 March 2014, http://www.energy.senate.gov/public/index.cfm/files/serve?File_id=c78fdaf5-04ae-4586-b4d1-6562bb9cdae0.
37 “US Department of Commerce Grants First Export Li-cense of Surplus California Heavy Crude Oil.” Free Library, 1991 PR Newswire Association LLC, 1 December 2014, http://www.thefreelibrary.com/U.S.+DEPARTMENT+OF+COM-MERCE+GRANTS+FIRST+EXPORT+LICENSE+OF+SUR-PLUS...-a011589178
38 W. Clinton, “Memorandum on Exports of Alaskan North Slope Crude Oil,” 28 April 1996, American Presidency Project, http://www.presidency.ucsb.edu/ws/?pid=52737.
39 US General Accounting Office. “Alaskan North Slope Oil: Limited Effects of Lifting Export Ban on Oil and Shipping In-dustries and Consumers.” Report to Congressional Committees, 1 July 1999. http://www.gao.gov/assets/160/156640.pdf.
40 BIS, “Short Supply Controls,” https://www.bis.doc.gov/index.php/forms-documents/doc_download/968-754.
41 EIA, “This Week in Petroleum,” 22 October 2014, http://www.eia.gov/petroleum/weekly/archive/2014/141022/includes/analysis_print.cfm. EIA information for September 2014 also indicates that there was a re-export to Germany. Energy Infor-mation Administration, “Petroleum and Other Liquids: Exports by Destination,” http://www.eia.gov/dnav/pet/pet_move_exp-c_a_EPC0_EEX_mbblpd_m.htm.
42 US Department of Commerce, “Export Administration Regulations, Short Supply Controls, Crude Oil,” 15 Code of Federal Regulations 754.2(a),” https://www.bis.doc.gov/index.php/forms-documents/doc_download/968-754.
43 In June 2014, the East Coast (PADD 1) accounted for 918,000 b/d of the 1.76 million b/d of product imports; the Gulf Coast (PADD 3) accounted for 2.7 million b/d of the total 3.76 million b/d product exports. See Energy Information Administration, “Petroleum and Oth-er Liquids: Exports,” 26 November 2014, http://www.eia.gov/dnav/pet/pet_move_exp_dc_nus-z00_mbblpd_m.htm.
44 The BIS FAQ states: “The factors BIS will consider in reviewing commodity classifications to determine whether the product has been ‘processed through a crude oil distillation tow-er’ include, among others:
(1) Whether the distillation process materially transforms the crude oil, by using heat to induce evaporation and condensa-
tion, into liquid streams that are chemically distinct from the crude oil input;
(2) The change in API gravity between the input of the process and the output of the process;
(3) The change in percentage of different types of hydrocarbons between the input and output of the process;
(4) Whether the streams resulting from distillation have purpos-es other than allowing the product to be classified as exportable petroleum products, such as use as petrochemical feedstock, di-luent, and gasoline blendstock;
(5) Whether the distillation process utilizes temperature gradi-ents and has significant internal structures, such as trays or pack-ing, and differentiated output streams;
(6) Whether the distillation uses towers with more mechanical com-plexity and heat, higher residence time, internal structures that pro-mote condensation and better separation, and a consistent quality liquid streams (also called cuts or fractions) than equipment used to separate vapors and liquids for transportation needs.”
For further details, see BIS, “FAQs—Crude Oil and Petroleum Products,” 30 December 2014, http://www.bis.doc.gov/index.php/policy-guidance/faqs.
45 See A. Sen, “BIS clarifies US condensate exports; no material policy change but may encourage self-certification,” Energy As-pects, 30 December 2014; E. Morse et al., “Out of America,” Citi Research, September 2014, IHS, “US Crude Oil Export Decision: Assessing the impact of the export ban and free trade on the US economy,” May 2014, p. III-22; Turner Mason analysis at: http://energypolicy.columbia.edu/turnermasonanalysis.
46 The International Energy Agency, for example, defines condensate as having an API gravity above 50. International En-ergy Agency, “Glossary;” A. Sider, “What is Condensate? Intro-ducing America’s New Oil Export,” Wall Street Journal, 25 June 2014, http://blogs.wsj.com/corporate-intelligence/2014/06/25/what-is-condensate-introducing-americas-new-oil-export/.
47 15 Code of Federal Regulations 754.2(a). There is no definition of “lease condensate” in the BIS regulations. The EIA defines lease condensate as “light liquid hydrocarbons re-covered from lease separators or field facilities at associated and nonassociated natural gas wells. Mostly pentanes and heavier hy-drocarbons. Normally enters the crude oil stream after produc-tion.” EIA, “Glossary,” http://www.eia.gov/tools/glossary/index.cfm?id=Lease.
48 The EIA defines plant condensate as: “One of the natural gas liquids, mostly pentanes and heavier hydrocarbons, recov-ered and separated as liquids at gas inlet separators or scrubbers

NAVIGATING THE U.S. OIL EXPORT DEBATE
energypolicy.columbia.edu | JANUARY 2015 | 65
in processing plants,” EIA, “EIA’s Proposed Definitions for Nat-ural Gas Liquids,” http://www.eia.gov/petroleum/workshop/ngl/pdf/definitions061413.pdf.
49 Classification rulings are a tool used to seek guidance from BIS on what commodity a product would be classified under. Thus, if a company has any uncertainty about whether the liquid hydro-carbon at question is a petroleum product (rather than crude oil) they can obtain formal guidance from BIS in a private letter ruling.
50 Stabilization is the process of heating the oil to remove the volatile light gases, like propane and butane, which is often done to make the liquid safe for transport. A distillation tower requires the use of heat—as well as cycles of evaporation and conden-sation—to fractionate the feedstock. While stabilization is one effect of processing in a distillation tower, stabilization alone in other equipment would not be adequate to create an exportable product, even when heat is used. J. Dweck, “US Crude Oil Ex-ports: Developments in the Regulatory Trenches,” presentation at EIA 2014 Energy Conference, 14 July 2014, http://www.eia.gov/conference/2014/pdf/presentations/jacobdweck.pdf.
51 P. Brown, et al., “US Crude Oil Export Policy: Background and Considerations,” Congressional Research Service, 26 March 2014 (R432442), p. 12.
52 15 Code of Federal Regulations 754.2(a).
53 Includes crude, condensates and natural gas liquids (NGLs).
54 For details on US crude oil demand, see EIA’s “Products Supplied” data: http://www.eia.gov/dnav/pet/pet_cons_psup_dc_nus_mbblpd_m.htm.
For details on US petroleum imports, see EIA: “Petroleum and Other Liquids: US Imports by Country of Origin,” http://www.eia.gov/dnav/pet/pet_move_impcus_a2_nus_ep00_im0_mb-blpd_m.htm.
55 EIA, “Petroleum and Other Liquids: Crude Oil Produc-tion,” http://www.eia.gov/dnav/pet/pet_crd_crpdn_adc_mb-blpd_m.htm. Preliminary weekly data from the EIA, which is subject to revision, indicates that crude oil output topped 9 mil-lion b/d in early November: http://www.eia.gov/dnav/pet/hist/LeafHandler.ashx?n=PET&s=WCRFPUS2&f=W.
56 EIA, “Petroleum and Other Liquids: US Gas Plant Pro-duction of Natural Gas Liquids and Liquid Refinery Gas-es,” http://www.eia.gov/dnav/pet/hist/LeafHandler.ashx?n=-PET&s=MNGFPUS1&f=A.
57 During the first nine months of 2014, the United States consumed 18.9 million b/d of refined products, compared to 20.7 million b/d on average in 2006, according to the EIA’s US Product Supplied data, http://www.eia.gov/dnav/pet/hist/Leaf-Handler.ashx?n=pet&s=mttupus2&f=a.
58 US Department of Transportation, Bureau of Transpor-tation Statistics, “Average Fuel Efficiency for US Light Duty Vehicles,” http://www.rita.dot.gov/bts/sites/rita.dot.gov.bts/files/publications/national_transportation_statistics/html/ta-ble_04_23.html. For more details on US fuel efficiency standards, see the US En-vironmental Protection Agency’s “Fuel Economy: Regulations and Standards,” http://www.epa.gov/fueleconomy/regulations.htm.
59 Data on US driving trends can be found at Office of High-way Policy Information’s “Traffic Volume Trends,” http://www.fhwa.dot.gov/policyinformation/travel_monitoring/tvt.cfm.
60 See the EIA’s “Weekly Ethanol Plant Production,” http://www.eia.gov/dnav/pet/pet_pnp_wprode_s1_w.htm. For further information on ethanol and biofuels requirements, see US EPA, “Fuel and Fuel Additives, Renewable Fuels Standard,” http://www.epa.gov/otaq/fuels/renewablefuels/.
61 IEA, “Medium-Term Oil Market Report, Executive Sum-mary,” p. 14, http://www.iea.org/Textbase/npsum/MTOMR-2014sum.pdf; OPEC, “Annual Statistical Bulletin 2014,” ta-bles 3.20 (World Exports of Petroleum Products by Country) and 3.24 (World Imports of Petroleum Products by Country), http://www.opec.org/library/Annual%20Statistical%20Bulle-tin/interactive/current/FileZ/Main.htm.
62 For more details, see EIA, “Today in Energy: Bakken Crude Oil Differential to WTI Narrows over Last 14 Months,” 19 March 2013, http://www.eia.gov/todayinenergy/detail.cfm?id=10431.
63 “The Nelson Complexity Index is a pure cost-based index. It provides a relative measure of refinery construction costs based upon the distillation and upgrading capacity a refinery has. The index was developed by Wilbur L. Nelson in the 1960s to quantify the relative cost of the components that make up a refinery. The Nelson index compares the costs of various upgrading units such as a catalytic cracker, or a reformer to the cost of a crude distilla-tion unit.” See Oil & Gas Journal, “Worldwide Revinery Survey and Complexity Analysis,” http://ogjresearch.stores.yahoo.net/worldwide-refinery-survey-and-complexity-analysis.html.
64 The Oil & Gas Journal ’s Bottom of the Barrel index “pro-vides a means of quantifying and characterizing a refinery’s
NAVIGATING THE U.S. OIL EXPORT DEBATE
66 | CENTER ON GLObAL ENERGY POLICY | COLUMbIA SIPA
ability to process heavy crudes and produce premium refined products. It represents the combined capacity of a refinery’s Coking, Catalytic Cracking and Hydrocracking units relative to Distillation Capacity (expressed as a percentage).” See Oil & Gas Journal, “Worldwide Revinery Survey and Complexity Analy-sis,” http://ogjresearch.stores.yahoo.net/worldwide-refinery-sur-vey-and-complexity-analysis.html.
65 PADD 3 imports of crude and unfinished oils for the first nine months of 2014 averaged 3.85 million b/d, down from 4.27 million b/d on average in 2013, according to monthly data from the EIA (PADD Imports by Country of Origin). See EIA, “Petroleum and Other Liquids: PADD Imports by Country of Origin,” http://www.eia.gov/dnav/pet/pet_move_impcp_a2_r30_epc0_ip0_mbblpd_m.htm.
66 EIA, “US Crude Oil Production Forecast—Analysis of Crude Types,” 29 May 2014, http://www.eia.gov/analysis/petro-leum/crudetypes/pdf/crudetypes.pdf.
67 B. Clayton and M. Levi, “The Surprising Sources of Oil’s Influence,” Survival: Global Politics and Strategy, 30 November 2012, http://dx.doi.org/10.1080/00396338.2012.749637.
68 Canada National Energy Board, “Disposition of Domestic Crude Oil and Imports,” https://www.neb-one.gc.ca/nrg/sttstc/crdlndptrlmprdct/stt/dspstnfdmstccrdlndmprtseng.html, 12 November 2014.
69 See A. Sen, “BIS clarifies US condensate exports; no mate-rial policy change but may encourage self-certification,” Energy Aspects, 30 December 2014; E. Morse et al., “Out of America,” Citi Research, September 2014, IHS, “US Crude Oil Export De-cision: Assessing the impact of the export ban and free trade on the US economy,” May 2014, p. III-22; Turner Mason study at: http://energypolicy.columbia.edu/turnermasonanalysis.
70 The analysis from Turner Mason can be found at http://energypolicy.columbia.edu/turnermasonanalysis.
71 ICF International, “The Impacts of US Crude Oil Exports on Domestic Crude Production, GDP, Employment, Trade, and Consumer Costs,” submitted to American Petroleum In-stitute, 31 March 2014, http://www.api.org/~/media/Files/Pol-icy/LNG-Exports/LNG-primer/API-Crude-Exports-Study-by-ICF-3-31-2014.pdf.
72 C. Ebinger and H. L. Greenley, “Changing Markets: Eco-nomic Opportunities from Lifting the US Ban on Crude Oil Exports” Brookings Institution, September 2014, http://www.brookings.edu/research/reports/2014/09/09-8-facts-about-us-crude-oil-production.
73 EIA, “Monthly Energy Review,” December 2014, http://www.eia.gov/totalenergy/data/monthly/#petroleum.
74 EIA, “Annual Energy Outlook 2014,” 7 May 2013, p. IF-10, http://www.eia.gov/forecasts/aeo/index.cfm.
75 EIA, “US Tight Oil Production: Alternative Supply Projec-tions and an Overview of EIA’s Analysis of Well-Level Data Ag-gregated to the County Level,” “Annual Energy Outlook 2014,” 4 April 2014, http://www.eia.gov/forecasts/aeo/section_issues.cfm#tight_oil.
76 IHS Energy, “US Crude Oil Export Decision: Assessingthe Impact of the Export Ban and Free Trade on the US Econo-my,” https://www.ihs.com/info/0514/crude-oil.html.
77 The Baker study can be accessed at: http://bakerinstitute.org/research/impact-analysis-us-crude-exports/
78 C. Isidore, “Cheap Gas Could Kill US Oil Export Ban,” CNN Money, 12 December 2014, http://money.cnn.com/2014/12/12/news/economy/oil-export-ban/.
79 See EIA, “What Drives U.S. Gasoline Prices?” October 2014, Brown et.al., “Crude Behavior: How Lifting the Export Ban Reduces Gasoline Prices in the United States,” Resources for the Future, 2014, and GAO, “Changing Crude Oil Markets: Allow-ing Exports Could Reduce Consumer Fuel Prices, and the Size of the Strategic Reserves Should Be Reexamined,” September 2014.
80 T. Houser and S. Mohan, Fueling Up: The Economic Impli-cations of America’s Oil and Gas Boom (Washington, DC: Peter-son Institute for International Economics, January 2014).
81 ICF International, “The Impacts of US Crude Oil Exports.”
82 IHS Energy, “US Crude Oil Export Decision: Assessing the Impact of the Export Ban and Free Trade on the US Econo-my,” https://www.ihs.com/info/0514/crude-oil.html.
83 Ebinger and Greenley, “Changing Markets.”
84 T. J. Duesterberg, D. A. Norman, and J. F. Werling, “Lift-ing the Crude Oil Export Ban: The Impact on US Manufactur-ing” Washington, DC: Aspen Institute, October 2014, http://www.aspeninstitute.org/sites/default/files/content/upload/FI-NAL_Lifting_Crude_Oil_Export_Ban_0.pdf.
85 Baker & O’Brien Inc., “An Analysis of US Light Tight Oil Absorption Capacity,” September 2014, http://www.bakero-brien.com/bakerobrien2/assets/File/B&OB%20LTO%20Ca-pacity%20Study.pdf.

NAVIGATING THE U.S. OIL EXPORT DEBATE
energypolicy.columbia.edu | JANUARY 2015 | 67
86 D. Courvalin, et al., “The economic tradeoffs of the US crude oil export ban,” Goldman Sachs, 10 June 2014.
87 The contrary finding from Goldman Sachs reflects a view that the point of saturation in the US refining sector will not be reached for several years and that, until then, the export ban will not affect US production levels but will force higher utilization of the US refining sector than would otherwise be the case. Thus, in Goldman’s view, keeping the ban in place until the point of refin-ing saturation is reached would yield the greatest GDP gains.
88 Taken from the September 2014 version of Rystad’s UCube database, available online at http://www.rystadenergy.com/Da-tabases/UCube.
89 JP Morgan projects $82 to $88 through 2016; see JP Morgan 2015 Commodities Outlook, 25 November 2014, https://markets.jpmorgan.com/research/email/-f7dhc0n/GPS-1558603-0.pdf. Citi projects WTI will average $55 a barrel in 2015 and $62 in 2016, and $63 for Brent in 2015 and $70 in 2016; see “Oil and Trouble Ahead in 2015,” 4 January 2014. The EIA’s most recent “Short Term Energy Outlook” (9 December 2014) projected av-erage WTI prices of $63 a barrel in 2015, down from $95 per barrel in their July 2014 report.
90 ICF International, “Impacts of US Crude Oil Exports.”
91 NERA’s piecewise linear function is created by interpolat-ing between discreet estimated point relationships between oil price and production.
92 International Monetary Fund, “Oil Scarcity, Growth, and Global Imbalances,” World Economic Outlook, April 2011, http://www.imf.org/external/pubs/ft/weo/2011/01/pdf/c3.pdf; N. Krichene, “World crude oil and natural gas: a de-mand and supply model,” Energy Economics 24.6 (2002): pp. 557-576.
93 Conventional oil projects require considerable up-front investment and multi-year development time horizons. Tight oil projects, by contrast, are relatively capital-light and quick to bring online. That should theoretically make tight oil invest-ment more responsive to short-term changes in oil price.
94 K. Hays, “Exclusive: New US Oil and Gas Well November Permits Tumble Nearly 40 Percent,” Reuters, 2 December 2014, http://www.reuters.com/article/2014/12/03/us-usa-oil-permits-idUSKCN0JG2C120141203.
95 D. Courvalin, “The New Oil Order: Finding a New Equa-librium,” Goldman Sachs, 15 December 2014.
96 J. Bordoff and J. Stock, “The Implications of Lower Oil Prices for the US Economy Amid the Shale Boom,” Center on Global Energy Policy, 4 December 2014, http://energypolicy.columbia.edu/sites/default/files/energy/CGEP_economic%20impacts%20of%20oil%20price%20drop.pdf.
97 CME Group, “Crude Oil Futures Quotes,” http://www.cmegroup.com/trading/energy/crude-oil/light-sweet-crude.html, accessed 19 December 2014.
98 A new IHS analysis based on individual well data finds that 80% of new tight-oil production in 2015 would be eco-nomic between $50 and $69 per barrel. See J. Burkhard, “Tight Oil Test: US Oil Output at Lower Prices,” IHS, 20 November 2014, http://unconventionalenergy.blogs.ihs.com/2014/11/20/tight-oil-test-us-output-at-lower-oil-prices/. See also E. G. Lee et al., “The Abyss Stares Back,” Citi Research, 16 October 2014; Morse et al., “Out of America”; D. Martin, and U. Kabra, “Oil Market Monthly: Opec Stasis Creates Further Downside Price Risks,” JP Morgan Gobal Commodities Research, 7 November 2014; IEA, “Oil Market Report,” October 2014, https://www.iea.org/media/omrreports/fullissues/2014-10-14.pdf.
99 Topping plants are basic refineries that boil off light prod-ucts from crude oil, while hydroskimmers are slightly more complex, using a reformer unit to make high-octane gasoline blendstock. See Poten & Partners, “Industry Glossary,” http://www.poten.com/glossary.aspx?id=18136.
100 In 2006, the Environmental Protection Agency began re-quiring that cars and trucks equipped with advanced emission control devices use Ultra Low Sulfur Diesel (ULSD) fuel. For the first couple of years of the program, ULSD traded at an aver-age $6/bbl premium to high sulfur diesel until refiners had made the investments necessary to increase production of ULSD, at which point the premium fell to less than $3/bbl on average.
101 The analysis from Turner Mason can be found at http://energypolicy.columbia.edu/turnermasonanalysis.
102 S. Brown, et al., Crude Behavior: How Lifting the Export Ban Reduces Gasoline Prices in the United States, Resources for the Future, March 2014, http://www.rff.org/RFF/Documents/RFF-IB-14-03-REV.pdf.
103 Lee et al., “Abyss Stares Back”; Morse et al., “Out of Amer-ica”; Martin and Kabra, “Oil Market Monthly”; IEA, “Oil Mar-ket Report,” October 2014, https://www.iea.org/media/omrre-ports/fullissues/2014-10-14.pdf; EIA, “Despite Lower Crude Oil Prices, US Crude Oil Production Expected to Grow in 2015,” 12 December 2014, http://www.eia.gov/todayinenergy/detail.cfm?id=19171.
NAVIGATING THE U.S. OIL EXPORT DEBATE
68 | CENTER ON GLObAL ENERGY POLICY | COLUMbIA SIPA
104 J. Bordoff and C. Pascual, “OPEC Hibernates,” Re-uters op-ed, 28 November 2014, http://www.reuters.com/article/2014/11/28/us-column-bordoff-pascual-idUSKCN-0JC20B20141128.
105 Lee et al., “Abyss Stares Back.”.
106 Citi, “Energy Weekly: OPEC Facing a New Shale-Tinged Reality,” 24 November 2014.
107 IEA, World Energy Outlook 2014, 12 November 2014, p.114-115.
108 See note 98.
109 Houser and Mohan, Fueling Up.
110 Ibid.
111 For more details on the history of oil pricing, see B. Fattouh, “An Anatomy of the Crude Oil Pricing System,” Oxford Institute for Energy Studies, 2011, http://www.oxfordenergy.org/wpcms/wp-content/uploads/2011/03/WPM40-AnAnatomyoftheCrudeOilPricingSystem-Bassam-Fattouh-2011.pdf.
112 G. Metcalf, “The Economics of Energy Security,” Annu-al Review of Resource Economics 6, October 2014, pp. 155–74, http://www.annualreviews.org/doi/pdf/10.1146/annurev-re-source-100913-012333.
113 S. Brown and H. Huntington, “Assessing the US Oil Secu-rity Premium,” Energy Economics, 29 March 2013, http://www.sciencedirect.com/science/article/pii/S0140988313000595.
114 M. Bazilian, B. Sovacool, and M. Miller, “Linking Energy Independence to Energy Security,” IAEE Energy Forum, Third Quarter 2013, p. 17.
115 J. Elkind, “Energy Security: Call for a Broader Agenda,” C. Pascual, and J. Elkind, (eds.), Energy Security, (Washington, DC: Brookings Institution Press, 2010).
116 L. Maugeri, “The Shale Oil Boom: A US Phenomenon,” Harvard Kennedy School, June 2013, p. 11, http://belfercen-ter.ksg.harvard.edu/files/The%20US%20Shale%20Oil%20Boom%20Web.pdf.
117 P. Beccue and H. Huntington, “An Assessment of Oil Mar-ket Disruption Risks,” Stanford Modeling Forum for the US Department of Energy, 3 October 2005, https://web.stanford.edu/group/emfresearch/docs/special_reports/EMFSR8.pdf.
118 Ibid.
119 Council of Economic Advisers (CEA), “The All-of-the-Above Energy Strategy as a Path to Sustainable Economic Growth,” May 2014, p. 3, http://www.whitehouse.gov/sites/default/files/docs/aota_energy_strategy_as_a_path_to_sustain-able_economic_growth.pdf.
120 Ibid, p. 28.
121 Y. Selivanova, “Regulation of Energy in International Trade Law: WTO, NAFTA, and Energy Charter,” The Netherlands: Kluwer Law International, 2011.
122 World Trade Organization, Canada—Measures Affect-ing Exports of Unprocessed Herring and Salmon, adopted on 22 March 1988, BISD 35S/98, http://www.wto.org/english/tra-top_e/dispu_e/87hersal.pdf.
123 Office of the United States Trade Representative, “Unit-ed States Files WTO Case against China over Export Restraints on Raw Materials,” June 2009, http://www.ustr.gov/about-us/press-office/press-releases/2009/june/united-states-files-wto-case-against-china-over-expor.
124 Office of the United States Trade Representative, “WTO Panel Finds against China’s Export Restraints on Raw Mate-rials,” July 2011, http://www.ustr.gov/about-us/press-office/press-releases/2011/july/wto-panel-finds-against-chinas-export-restraints-raw.
125 World Trade Organization, China—Measures Related to the Exportation of Various Raw Materials (WT/DS394/R), http://www.wto.org/english/tratop_e/dispu_e/cases_e/ds394_e.htm.
126 Ibid.
127 Office of the United States Trade Representative, “Unit-ed States Challenges China’s Export Restrictions on Rare Earths,” March 2012, http://www.ustr.gov/about-us/press-of-fice/press-releases/2012/march/united-states-challenges-chi-na%E2%80%99s-export-restraints-r.
128 World Trade Organization, China —Measures Related to the Exportation of Rare Earths, Tungsten and Molybdenum (WT/DS432/R), http://www.wto.org/english/tratop_e/dispu_e/cas-es_e/ds431_e.htm.129 The General Agreement on Tariffs and Trade, Article XXI, “Security Exemptions,” http://www.wto.org/english/res_e/booksp_e/gatt_ai_e/art21_e.pdf.

NAVIGATING THE U.S. OIL EXPORT DEBATE
energypolicy.columbia.edu | JANUARY 2015 | 69
130 G. C. Hufbauer, A. E. Bagnall, and J. Muir, “Liquefied Natural Gas Exports: An Opportunity for America” (Washington, DC: Peterson Institute for International Economics, February 2013), p. 8, http://www.piie.com/publications/pb/pb13-6.pdf.
131 European Commission, “Raw Materials and Energy: Ini-tial EU Position Paper,” July 2013, http://trade.ec.europa.eu/doclib/docs/2013/july/tradoc_151624.pdf.
132 L. DePillis. “A Leaked Document Shows Just How Much the EU Wants a Piece of America’s Fracking Boom,” Washington Post, 8 July 2014, http://www.washingtonpost.com/blogs/wonk-blog/wp/2014/07/08/could-a-trade-deal-lift-the-u-s-longstand-ing-ban-on-crude-oil-exports-europe-thinks-so/. A copy of the non-paper can be found at L. DePillis, “EU Energy Non-Paper,” 8 July 2014, https://www.scribd.com/doc/233022558/EU-En-ergy-Non-paper.
133 Office of the United States Trade Representative, “US Trade Representative Michael Froman Announces US Victory in Challenge to China’s Rare Earth Export Restraints,” August 2014, http://www.ustr.gov/about-us/press-office/press-releas-es/2014/August/USTR-Froman-US-Victory-in-Challenge-to-China-Rare-Earth-Export-Restraints.
134 For an excellent review of the literature, see M. Levi, “En-ergy Security: An Agenda for Research,” Council on Foreign Relations, June 2010, http://www.cfr.org/content/publications/attachments/Energy_Security_Workshop_Paper.pdf and K. Crane, et al., Imported oil and US national security, Rand Cor-poration, 2009, http://www.rand.org/content/dam/rand/pubs/monographs/2009/RAND_MG838.pdf.
135 See Morse et al., “Out of America,” pp. 78–81.
136 Bordoff and Pascual, “OPEC Hibernates.”
137 IEA, World Energy Outlook 2014, 12 November 2014, p. 53.
138 EIA, “Energy and Finance, What Drives Crude Oil Pric-es, Supply: OPEC,” http://www.eia.gov/finance/markets/sup-ply-opec.cfm.
139 R. McNally and M. Levi, “Vindicating Volatility: Why Fluctuating Oil Prices Are Here to Stay,” Foreign Affairs, 4 No-vember 2014, http://www.foreignaffairs.com/articles/142333/robert-mcnally-and-michael-levi/vindicating-volatility.
140 B. Clayton and M. Levi. “The Surprising Sources of Oil’s Influence.” Survival: Global Politics and Strategy, 30 November 2012, http://dx.doi.org/10.1080/00396338.2012.749637.
141 H. Hegre, J. R. Oneal, and B. Russett, “Trade Does Pro-mote Peace: New Simultaneous Estimates of the Reciprocal Effects of Trade and Conflict,” Journal of Peace Research 47(6), 2010, pp. 763–74, http://jpr.sagepub.com/content/47/6/763.full.pdf+html.
142 J. Zarate. Treasury’s War: The Unleashing of a New Era of Financial Warfare. (New York: Public Affairs, 2013).
143 J. Bordoff and E. Rosenberg, “The New ‘Micro-target-ing’ of Russia,” Reuters op-ed, 4 August 2014, http://www.reuters.com/article/2014/08/04/us-column-bordoff-rosenberg-idUSKBN0G411520140804.
144 US Department of State, “Iran Sanctions,” http://www.state.gov/e/eb/tfs/spi/iran/index.htm.
145 US Department of the Treasury, “CISADA: The New US Sanctions against Iran,” http://www.treasury.gov/resource-cen-ter/sanctions/Programs/Documents/CISADA_english.pdf.
146 “National Defense Authorization Act for Fiscal Year 2012” (PL 112-81, Dec. 31, 2011) United States Statute at Large, http://www.gpo.gov/fdsys/pkg/PLAW-112publ81/html/PLAW-112publ81.htm.
147 See, e.g., “Remarks by Tom Donilon, National Security Advisor to the President at the Launch of Columbia University’s Center on Global Energy Policy,” http://www.whitehouse.gov/the-press-office/2013/04/24/remarks-tom-donilon-national-se-curity-advisor-president-launch-columbia-.
148 For a comprehensive survey, see National Research Coun-cil, Risks and Risk Governance in Shale Gas Development: Sum-mary of Two Workshops, (Washington, DC: National Academies Press, 2014).
149 See, e.g., Allen et al., “Measurements of methane emis-sions at natural gas production sites in the United States,” PNAS (2013), http://www.pnas.org/content/110/44/17768.full; Jack-son et al., “The Environmental Costs and Benefits of Fracking,” Annual Review of Environment and Resources Vol. 39: 3 pp. 27-362 (2014), http://www.annualreviews.org/doi/pdf/10.1146/annurev-environ-031113-144051; Jackson et al., “Increased stray gas abundance in a subset of drinking water wells near Mar-cellus shale gas extraction,” PNAS(2013), http://sites.nicholas.duke.edu/avnervengosh/files/2012/12/PNAS_Jacksonetal2013.pdf, A. Krupnick; “Managing the Risks of Shale Gas: Key Find-ings and Further Research,” Resources for the Future (2014), http://www.rff.org/rff/documents/rff-rpt-managingrisksofshale-gas-keyfindings.pdf.

NAVIGATING THE U.S. OIL EXPORT DEBATE
70 | CENTER ON GLObAL ENERGY POLICY | COLUMbIA SIPA
150 Secretary of Energy Advisory Board, “Shale Gas Produc-tion Subcommittee 90-Day Report,” submitted to US Depart-ment of Energy, 18 August 2011, http://www.shalegas.energy.gov/resources/081811_90_day_report_final.pdf.
151 See, e.g., MIT Energy Initiative, “The Future of Natural Gas: An Interdisciplinary MIT Study,” 2011, http://mitei.mit.edu/system/files/NaturalGas_Report.pdf; A. Brandt, et al. “Meth-ane Leakage from North American Natural Gas Systems,” Science 343, February 2014, pp. 733-735, http://www.sciencemag.org/content/343/6172/733.summary; G. Petron, et al., “A new look at methane and non methane hydrocarbon emissions from oil and natural gas operations in the Colorado Denver-Julesburg Basin,” Journal of Geophysical Research 119(11) June 2014, pp. 6836–52, http://onlinelibrary.wiley.com/doi/10.1002/2013JD021272/abstract; F. O’Sullivan and S. Paltsev, “Shale gas production: po-tential versus actual greenhouse gas emissions,” Environmental Research Letters, November 2012, http://iopscience.iop.org/1748-9326/7/4/044030/pdf/1748-9326_7_4_044030.pdf; R.A. Alva-rez, et al., “Greater focus needed on methane leakage from natu-ral gas infrastructure,” Proceedings of the National Academy of the Sciences of the United States of America 109:6435–40, April 2012, http://www.pnas.org/content/109/17/6435/; R.B. Jackson, et al. “Increased stray gas abundance in a subset of drinking water wells near Marcellus shale gas extraction,” Proceedings of the National Academy of the Sciences of the United States of America 110, June 2013, pp. 11250–55; N.R. Warner, et al. “Geochemical evidence for possible natural migration of Marcellus formation brine to shal-low aquifers in Pennsylvania,” Proceedings of the National Academy of the Sciences of the United States of America 109, July 2012, pp. 11961–66, http://www.pnas.org/content/109/30/11961.abstract; S.G. Osborn, et al., “Methane contamination of drinking water accompanying gas-well drilling and hydraulic fracturing,” Proceed-ings of the National Academy of the Sciences of the United States of America 108, May 2011, pp. 8172–76, http://www.pnas.org/con-tent/108/20/8172.abstract; W.L. Ellsworth, “Injection-induced earthquakes,” Science 341, July 2013, http://www.sciencemag.org/content/341/6142/1225942; A.A. Holland, “Earthquakes triggered by hydraulic fracturing in south-central Oklahoma,” Bulletin of the Seismological Society of America 103, June 2013, pp. 1784–92, http://www.bssaonline.org/content/103/3/1784.short.
152 IEA, “Golden Rules for a Golden Age of Gas: World En-ergy Outlook Special Report on Unconventional Gas”, 2012, pp. 53-56, http://www.worldenergyoutlook.org/media/weoweb-site/2012/goldenrules/WEO2012_GoldenRulesReport.pdf.
153 US Environmental Protection Agency, “Inventory of US Greenhouse Gas Emissions and Sinks, 1990–2012,” 15 April 2014, http://www.epa.gov/climatechange/Downloads/ghgemis-sions/US-GHG-Inventory-2014-Main-Text.pdf.
154 IEA, CO2 Emissions from Fuel Combustion, 2012, p. 157 and p. 523, based on 2010 data, http://www.iea.org/publica-tions/freepublications/publication/co2emissionfromfuelcom-bustionhighlights.pdf.
155 Complete Rhodium Group GHG analysis is available at http://www.rhg.com/crudeexports.
156 International Monetary Fund, “Oil Scarcity, Growth, and Global Markets,” World Economic Outlook, April 2011, http://www.imf.org/external/pubs/ft/weo/2011/01/pdf/c3.pdf.
157 D. Gately, “World oil demand’s shift toward faster growing and less price-responsive products and regions,” presentation at 29th USAEE/IAEE North American Conference, 2010, http://www.usaee.org/usaee2010/submissions/Presentations/Der-mot%20Gately.pdf.
158 See Rhodium Group GHG analysis at http://www.rhg.com/crudeexports.
159 Ibid.
160 EIA, “Petroleum and Other Liquids: US Exports of Crude Oil,” http://www.eia.gov/dnav/pet/hist/LeafHandler.ashx?n=-PET&s=MCREXUS2&f=M.
161 Preliminary weekly data from the EIA shows US crude oil ex-ports reached 400,000 b/d in November 2014, see “Petroleum & Other Liquids, Weekly Imports & Exports,” http://www.eia.gov/dnav/pet/pet_move_wkly_dc_NUS-Z00_mbblpd_4.htm), while OPEC lists Ecuador’s exports at 388,000 b/d, “Ecuador Facts and Figures,” http://www.opec.org/opec_web/en/about_us/148.htm.
162 ConocoPhillips exported a cargo of Alaskan crude to South Korea in September 2014, the first export from the state since 2004. C. Berthelsen, “Alaska’s First Crude Oil Export in a De-cade Heads to South Korea,” Wall Street Journal, 30 September 2014, http://www.wsj.com/articles/alaskas-first-crude-oil-ex-port-in-a-decade-heads-to-south-korea-1412094817.
163 C. Ngai, “UPDATE 1-Pioneer Says Owned Most of Condensate Exported by Enterprise,” Reuters, 5 August 2014, http://www.reuters.com/article/2014/08/05/oil-condensate-pi-oneer-natl-rsc-idUSL2N0QB1B920140805.
164 See note 44.
165 M. Leger, and J. Mayes, “Are BIS Rulings for Pioneer and Enterprise a Gamechanger?” Turner, Mason & Company 8 (2), July 2014, http://www.turnermason.com/wpcontent/uploads/ 2014/07/Perspectives.pdf.
NAVIGATING THE U.S. OIL EXPORT DEBATE
energypolicy.columbia.edu | JANUARY 2015 | 71
166 “Export Administration Regulations, Short Supply Con-trols, Crude Oil,” 15 Code of Federal Regulations 754.2(b)(2)(i)(C), https://www.bis.doc.gov/index.php/forms-documents/doc_download/968-754.
167 Several government agencies make distinctions between crude oil and condensate currently, including the Bureau of Safe-ty and Environmental Enforcement, the Bureau of Ocean Ener-gy Management, the Department of the Interior, the Bureau of Land Management, the US Geological Survey, and the Office of Natural Resource Revenue. See “Terms of Trade: Condensate as an Exportable Commodity,” prepared by Senate Minority Staff on the US Senate Committee on Energy and Natural Resources for Senator Lisa Murkowski, July 2014, http://www.energy.sen-ate.gov/public/index.cfm/files/serve?File_id=e34b882e-d26e-456f-aa27-6b96c0b13a04.
168 C. Krauss, “With Natural Gas Byproduct, Iran Sidesteps Sanctions”, New York Times, 12 August 2014, http://www.ny-times.com/2014/08/13/business/energy-environment/with-a-natural-gas-byproduct-iran-sidesteps-oil-sanctions.html.
169 EIA, “US Crude Oil Production Forecast—Analysis of Crude Types,” http://www.eia.gov/analysis/petroleum/crude-types/pdf/crudetypes.pdf.
170 See note 69.
171 In December 2014, Representative Joe Barton of Texas introduced legislation to remove restrictions on exports. J. Gilmour, “Oil Prices Continue Slide, Fueling Calls for US Crude Exports,” Christian Science Monitor, 11 December 2014, http://www.csmonitor.com/Environment/Energy-Voic-es/2014/1211/Oil-prices-continue-slide-fueling-calls-for-US-crude-exports.
172 J. Leff, “Poll: Unmoved by Oil Export Proponents, Ameri-cans Fear Gasoline Spike,” Reuters, 9 October 2014, http://www.reuters.com/article/2014/10/09/us-usa-oil-exports-idUSKCN-0HY15220141009?feedType=RSS&feedName=everything&-virtualBrandChannel=11563.
A BRIEF HISTORY OF OIL PRICE REGULATION
1. Kalt, Economics and Politics of Oil Price Regulation, pp. 9–16.
2. Ibid.
3. Ibid. p. 10.
4. Ibid. p. 8.
5. E. Erickson, et al., “The Political Economy of Crude Oil Price Controls, Natural Resources Journal” 18 October 1978: p. 788, http://lawschool.unm.edu/nrj/volumes/18/4/07_erickson_ political.pdf.
6. Kalt, Economics and Politics of Oil Price Regulation, pp. 9–16.
BIS ADMINISTRATION EXPORT LICENSES FOR SHORT SUPPLY CONTROLS
1. See G. Bush, “Executive Order 13222: Continuation of Export Control Regulations,” 17 August 2001, and B. Obama, “Continuation of the National Emergency with Respect to Ex-port Control Regulations,” 79 Federal Register 46957, 11 Au-gust 2014.
THE PADD SYSTEM
1. Energy Information Administration, “Today in Energy: PADD Regions Enable Regional Analysis of Petroleum Product Supply and Movements,” 7 February 2012, http://www.eia.gov/todayinenergy/detail.cfm?id=4890.
SUPPLY ELASTICITY
1. For further details on supply elasticity, see R. G. Hubbard and A. P. O’Brien, Economics, 5th ed. (New York: Pearson Edu-cation, 2014).
LESSONS FROM TRADE IN REFINED PETROLEUM
1. S. Fielden, “Rising Production, Exports to Boost Margins for US Refiners,” Oil & Gas Journal, 2 December 2013, http://www.ogj.com/articles/print/volume-111/issue-12/processing/rising-production-exports-to-boost-margins-for-us-refiners.html.
2. Section 27 of the Merchant Marine Act of 1920, generally referred to as the Jones Act, requires goods being transported between US ports to be carried by US-flagged, US-built ships that are owned and crewed by Americans. Jones Act ships are generally more expensive than non-Jones Act vessels, with costs for East Coast companies importing crude or refined products up to three times higher using Jones Act ships versus foreign ves-sels. See R. Couture and J. Auers, “‘Me and Mrs. Jones’ – How the Jones Act Might Not Be Such A Bad Thing For East Coast Refiners After All,” Turner, Mason & Company, 10 February

NAVIGATING THE U.S. OIL EXPORT DEBATE
72 | CENTER ON GLObAL ENERGY POLICY | COLUMbIA SIPA
2014, http://www.turnermason.com/blog/2014/02/10/me-and-mrs-jones-how-the-jones-act-might-not-be-such-a-bad-thing-for-east-coast-refiners-after-all/.
3 See EIA, “Net Exports of Gasoline Blending Components and Finished Motor Gasoline, “http://www.eiagov/dnav/pet/pet_move_neti_a_ep00_IMN_mbblpd_m.htm.
US RESPONSE TO SUPPLY DISRUPTIONS
1. US Department of Energy, Office of Electricity and De-livery and Energy Reliability, “Comparing the Impacts of the 2005 and 2008 Hurricanes on US Energy Infrastructure,” Feb-ruary 2009, http://www.oe.netl.doe.gov/docs/HurricaneCom-p0508r2.pdf.
2. Ibid.
3. Ibid.
4. Both the US government and industry officials were fo-cused on the impending conflict in Iraq and potential supply disruptions in the Middle East. See M. Billig, “The Venezuelan Oil Crisis,” Foreign Affairs, September/October 2004, http://www.foreignaffairs.com/articles/60090/michelle-billig/the-ven-ezuelan-oil-crisis.
5. US imports of Venezuelan crude returned to pre-disruption levels by April 2003. EIA, “Petroleum and Other Liquids: US Imports by Country of Origin,” http://www.eia.gov/dnav/pet/pet_move_impcus_a2_nus_ep00_im0_mbblpd_m.htm.
6. J. Shore, and J. Hackworth, “Impacts of the Venezuelan Crude Oil Production Loss,” EIA, 15 March 2007, http://www.eia.gov/pub/oil_gas/petroleum/feature_articles/2003/venezue-lan/vzimpacts.htm.

NAVIGATING THE U.S. OIL EXPORT DEBATE
energypolicy.columbia.edu | JANUARY 2015 | 73
Allen, D. et al., “Measurements of methane emissions at natural gas production sites in the United States,” Proceedings of the Na-tional Academy of Sciences, Vol. 110 No. 44, 17768–17773, Oc-tober 2013, http://www.pnas.org/content/110/44/17768.full.
Baker & O’Brien Inc. “An Analysis of US Light Tight Oil Ab-sorption Capacity,” September 2014. http://www.bakerobrien.com/bakerobrien2/assets/File/B&OB%20LTO%20Capaci-ty%20Study.pdf.
Bazilian, M., B. Sovacool, and M. Miller. “Linking Energy Inde-pendence to Energy Security.” IAEE Energy Forum, 3rd quarter 2013.
Beccue, P., and H. Huntington. “An Assessment of Oil Market Disruption Risks.” Stanford Modeling Forum for the US De-partment of Energy, 3 October 2005. https://web.stanford.edu/group/emfresearch/docs/special_reports/EMFSR8.pdf.
Berthelsen, C. “Alaska’s First Crude Oil Export in a Decade Heads to South Korea.” Wall Street Journal, 30 September 2014. http://www.wsj.com/articles/alaskas-first-crude-oil-export-in-a-decade-heads-to-south-korea-1412094817.
Billig, M. “The Venezuelan Oil Crisis.” Foreign Affairs, Sep-tember/October 2004. http://www.foreignaffairs.com/arti-cles/60090/michelle-billig/the-venezuelan-oil-crisis.
Bohi, D., and R. Milton. Limiting Oil Imports: An Econom-ic History and Analysis. Baltimore: Johns Hopkins University Press, 1978.
Bordoff, J., and C. Pascual. “OPEC Hibernates.” Reu-ters op-ed, 28 November 2014. http://www.reuters.com/article/2014/11/28/us-column-bordoff-pascual-idUSKCN-0JC20B20141128.
Bordoff, J., and E. Rosenberg. “The new ‘micro-targeting’ of Russia.” Reuters, 4 August 2014. http://www.reuters.com/article/2014/08/04/us-column-bordoff-rosenberg-idUSKB-N0G411520140804.
BP Statistical Review. “Oil Consumption,” 2014. http://www.bp.com/en/global/corporate/aboutbp/energy-economics/statis-tical-review-of-world-energy/statistical-reviewdownloads.html.
Bradley, R., Jr. Oil, Gas and Government: The US Experience, vol. 1, p. 748. Lanham, MD: Rowman and Littlefield, 1996.
Brown, P., et al. “US Crude Oil Export Policy: Background and Considerations,” p. 12. Congressional Research Service, 26 March 2014 (R432442).
Brown, S., C. Mason, A. Krupnick, and J. Mares. “Crude Be-havior: How Lifting the Export Ban Reduces Gasoline Prices in the United States.” Resources for the Future, March 2014. http://www.rff.org/RFF/Documents/RFF-IB-14-03-REV.pdf.
Brown, S., and H. Huntington. “Assessing the US Oil Security Premium.” Energy Economics, 29 March 2013. http://www.sci-encedirect.com/science/article/pii/S0140988313000595.
Bureau of Labor Statistics. “Consumer Price Index-All Urban Consumers; US All Items, 1967=100.” http://data.bls.gov/cgi-bin/surveymost?cu.
Bush, G. “Executive Order 13222: Continuation of Export Control Regulations,” 17 August 2001.
Bush, G. H. W. Presidential Memorandum for Secretary of Commerce [and] Secretary of Energy, “Exports of Domestically Produced Heavy Crude Oil,” 22 October 1993 Reproduced in US Senate Energy and Natural Resources Committee, Minority Staff Report, “Past is Precedent: Executive Power to Authorize Crude Oil Exports,” 3 March 2014. http://www.energy.senate.gov/public/index.cfm/files/serve?File_id=c78fdaf5-04ae-4586-b4d1-6562bb9cdae0.
Canada National Energy Board. “Disposition of Domestic Crude Oil and Imports,” 12 November 2014. https://www. neb-one.gc.ca/nrg/sttstc/crdlndptrlmprdct/stt/dspstnfdmstc-crdlndmprtseng.html.
Citi. “Energy Weekly: OPEC Facing a New Shale-Tinged Reali-ty.” 24 November 2014.
Clayton, B., and M. Levi. “The Surprising Sources of Oil’s Influ-ence.” Survival: Global Politics and Strategy, 30 November 2012. http://dx.doi.org/10.1080/00396338.2012.749637.
“Clean Air Act of 1963” (PL 88-206, 17 December 1963). Unit-ed States Statute at Large. http://www.gpo.gov/fdsys/pkg/STAT-UTE-77/pdf/STATUTE-77-Pg392.pdf.
Clinton, W. J. “Memorandum on Exports of Alaskan North Slope Crude Oil,” 28 April 1996. In G. Peters and J. T. Woolley, The American Presidency Project. http://www.presidency.ucsb.edu/ws/?pid=52737.
BIBLIOGRAPHY

NAVIGATING THE U.S. OIL EXPORT DEBATE
74 | CENTER ON GLObAL ENERGY POLICY | COLUMbIA SIPA
CME Group. “Crude Oil Futures Quotes.” http://www.cme-group.com/trading/energy/crude-oil/light-sweet-crude.html.
“Coffman Demands Action on China’s Illegal Trade Practices,” 3 March 2011. http://coffman.house.gov/sites/coffman.house.gov/files/Release%20on%20rare%20earth%20letter%20to%20amb%20kirk%203%203%202011.pdf.
Colgan, J. “The Emperor Has No Clothes: The Limits of OPEC in the Global Oil Market.” International Organization 68 (June 2014): pp. 599–632. http://journals.cambridge.org/abstract_S0020818313000489.
Cook, L., and Berthelsen, C. “Two Senators Seek Details of Oil Export Rulings.” Wall Street Journal, 2 July 2014. http://www.wsj.com/articles/two-senators-seek-details-of-oil-export-rulings-1404331013?mobile=y.
Council on Economic Advisers. “The All-of-the-Above Energy Strategy as a Path to Sustainable Economic Growth,” May 2014. http://www.whitehouse.gov/sites/default/files/docs/aota_ener-gy_strategy_as_a_path_to_sustainable_economic_growth.pdf.
Courvalin, D. et al., “The economic tradeoffs of the US crude oil export ban”, Goldman Sachs, 10 June 2014.
Crane, K, et al. “Imported oil and US national security.” Rand Cor-poration, 2009. http://www.rand.org/content/dam/rand/pubs/ monographs/2009/RAND_MG838.pdf.
“Crude Pro Quo: The Use of Oil Exchanges to Increase Effi-ciency.” Prepared by Senate Minority Staff on the US Senate Committee on Energy and Natural Resources for Senator Lisa Murkowski, 22 May 2014, p. 2. http://www.energy.senate.gov/public/index.cfm/files/serve?File_id=22ab820b-5a47-4bc8-a025-a8507817a790.
DePillis, L. “A Leaked Document Shows Just How Much the EU Wants a Piece of America’s Fracking Boom.” Washington Post, 8 July 2014. http://www.washingtonpost.com/blogs/wonkblog/wp/2014/07/08/could-a-trade-deal-lift-the-u-s-longstanding-ban-on-crude-oil-exports-europe-thinks-so/.
———. “EU Energy Non-Paper.” 8 July 2014. https://www.scribd.com/doc/233022558/EUEnergy-Nonpaper.
Deutch, J. and J. R. Schlesinger. “National Security Conse-quences of Oil Dependency.” Council on Foreign Relations, Independent Task Force Report No. 58, October 2006. http://www.cfr.org/oil/national-security-consequences-us-oil-depen-dency/p11683.
Deutsche Bank. “Industry Update: Oil and Gas for Begin-ners,” 25 January 2013. http://www.wallstreetoasis.com/files/DEUTSCHEBANKAGUIDETOTHEOIL%EF%BC%-86GASINDUSTRY-130125.pdf.
Duesterberg, T. J., D. A. Norman, and J. F. Werling. “Lifting the Crude Oil Export Ban: The Impact on US Manufacturing.” Washington, DC: Aspen Institute, October 2014. http://www.aspeninstitute.org/sites/default/files/content/upload/FINAL_Lifting_Crude_Oil_Export_Ban_0.pdf.
Dweck, J. “US Crude Oil Exports: Developments in the Regu-latory Trenches.” Presentation at EIA 2014 Energy Conference, 14 July 2014. http://www.eia.gov/conference/2014/pdf/presen-tations/jacobdweck.pdf.
Ebinger, C., and H. L. Greenley. “Changing Markets: Economic Opportunities from Lifting the US Ban on Crude Oil Exports.” Brookings Institution, September 2014. http://www.brookings.edu/research/reports/2014/09/09-8-facts-about-us-crude-oil-production.
Eisenhower, D. D. “Statement by the President Upon Signing Proclamation Governing Petroleum Imports,” 10 March 1959. In G. Peters and J. T. Woolley, The American Presidency Project. http://www.presidency.ucsb.edu/ws/?pid=11676.
“Emergency Petroleum Allocation Act of 1973” (PL 93-159, 27 November 1973). United States Statute at Large. http://uscode.house.gov/statutes/pl/93/159.pdf.
Elkind, J. “Energy Security: Call for a Broader Agenda.” In C. Pascual and J. Elkind, eds., Energy Security. Washington, DC: Brookings Institution Press, 2010.
Energy Information Administration. “Analysis and Projections: US Crude Oil Production Forecast—Analysis of Crude Types,” 29 May 2014. http://www.eia.gov/analysis/petroleum/crudetypes/.
———. “Annual Energy Outlook 2014,” 7 May 2014. http://www.eia.gov/forecasts/aeo/index.cfm.
———. “Despite Lower Crude Oil Prices, US Crude Oil Pro-duction Expected to Grow in 2015,” 12 December 2014. http://www.eia.gov/todayinenergy/detail.cfm?id=19171.
———. “Energy and Finance, What Drives Crude Oil Pric-es, Supply: OPEC.” http://www.eia.gov/finance/markets/sup-ply-opec.cfm.
———. “Glossary.” http://www.eia.gov/tools/glossary/.
———. “Monthly Energy Review,” 23 December 2014, http://www.eia.gov/totalenergy/data/monthly.
———.“Net Exports of Gasoline Blending Components and Finished Motor Gasoline.” http://www.eiagov/dnav/pet/pet_move_neti_a_ep00_IMN_mbblpd_m.htm.
———. “Petroleum and Other Liquids: Crude Oil Produc-tion.” http://www.eia.gov/dnav/pet/pet_crd_crpdn_adc_mb-blpd_m.htm.
NAVIGATING THE U.S. OIL EXPORT DEBATE
energypolicy.columbia.edu | JANUARY 2015 | 75
———. “Petroleum and Other Liquids: Data,” 2014, http://eia.gov/petroleum/data.cfm.
———. “Petroleum and Other Liquids: Drilling Productivity Report,” 10 November 2014. http://www.eia.gov/petroleum/drilling/.
———. “Petroleum and Other Liquids: Exports.” http://www.eia.gov/dnav/pet/pet_move_exp_dc_nus-z00_mbblpd_m.htm.
———. “Petroleum and Other Liquids: Exports by Destina-tion.” http://www.eia.gov/dnav/pet/pet_move_expc_a_EPC0_EEX_mbblpd_m.htm.
———. “Petroleum and Other Liquids: Imports by Area of En-try.” http://www.eia.gov/dnav/pet/pet_move_imp_dc_nus-z00_mbblpd_m.htm.
———. “Petroleum and Other Liquids: PAD District Imports by Country of Origin.” http://www.eia.gov/dnav/pet/pet_move_impcp_a2_r30_epc0_ip0_mbblpd_m.htm.
———. “Petroleum and Other Liquids: Product Supplied.” http://www.eia.gov/dnav/pet/pet_cons_psup_dc_nus_mbblp-d_m.htm.
———. “Petroleum and Other Liquids: US Exports of Crude Oil.” http://www.eia.gov/dnav/pet/hist/LeafHandler.ashx?n=-PET&s=MCREXUS2&f=M.
———. “Petroleum and Other Liquids: US Exports of Fuel Ethanol.” http://www.eia.gov/dnav/pet/hist/LeafHandler.ashx-?n=PET&s=M_EPOOXE_EEX_NUS-Z00_MBBL&f=M.
———. “Petroleum and Other Liquids: US Exports of Nat-ural Gas Liquids and Liquid Refinery Gases.” http://www.eia.gov/dnav/pet/hist/LeafHandler.ashx?n=PET&s=MNGEXUS-1&f=M.
———. “Petroleum and Other Liquids: US Exports of Crude Oil and Petroleum Products.” http://www.eia.gov/dnav/pet/hist/LeafHandler.ashx?n=PET&s=MTTEXUS2&f=M.
———. “Petroleum and Other Liquids: US Gas Plant Production of Natural Gas Liquids and Liquid Refinery Gases.” http://www.eia.gov/dnav/pet/hist/LeafHandler.ashx?n=PET&s=MNGFPUS1&f=A.
———. “Petroleum and Other Liquids: US Imports by Coun-try of Origin,” http://www.eia.gov/dnav/pet/pet_move_imp-cus_a2_nus_ep00_im0_mbblpd_m.htm.
———. “Petroleum and Other Liquids: Weekly Ethanol Plant Production.” http://www.eia.gov/dnav/pet/pet_pnp_wprode_s1_w.htm.
———. “Petroleum and Other Liquids: Weekly Supply Esti-mates.” http://www.eia.gov/dnav/pet/pet_sum_sndw_dcus_nus_4.htm.
———. “Petroleum and Other Liquids: Weekly US Field Pro-duction of Crude Oil.” http://www.eia.gov/dnav/pet/hist/Leaf-Handler.ashx?n=PET&s=WCRFPUS2&f=W.
———. “Petroleum Chronology of Events 1970 to 2000.” http://www.eia.gov/pub/oil_gas/petroleum/analysis_publica-tions/chronology/petroleumchronology2000.htm#T_8_.
———. “Refiner Acquisition Cost of Crude Oil.” http://eia.gov/dnav/pet/pet_pri_rac2_dcu_r10_m.htm.
———. “Refiner Gasoline Prices by Grade and Sales Type.” http://www.eia.gov/dnav/pet/pet_pri_refmg_dcu_R10_m.htm.
———. “This Week in Petroleum,” 22 October 2014. http://www.eia.gov/petroleum/weekly/archive/2014/141022/includes/analysis_print.cfm.
———. “Today in Energy: Bakken Crude Oil Differential to WTI Narrows over Last 14 Months,” 19 March 2013. http://www.eia.gov/todayinenergy/detail.cfm?id=10431.
———. “Today in Energy: PADD Regions Enable Regional Analysis of Petroleum Product Supply and Movements,” 7 Febru-ary 2012. http://www.eia.gov/todayinenergy/detail.cfm?id=4890.
———. “Total Energy.” http://www.eia.gov/totalenergy/data/annual/showtext.cfm?t=ptb0521.
———. “US Crude Oil Production Forecast—Analysis of Crude Types,” 29 May 2014. http://www.eia.gov/analysis/petro-leum/crudetypes/pdf/crudetypes.pdf.
Environmental Defense Fund. “Extensive Research Efforts Tack-les Methane Leaks.” http://www.edf.org/climate/methane-studies.
———. “Model Regulatory Framework for Hydraulically Fractured Hydrocarbon Production Wells,” 2014. http://www.edf.org/sites/default/files/content/Model_Regulatory_Frame-work_For_Hydraulically_Fractured_Hydrocarbon_Produc-tion_Wells_2014.pdf.
Erickson, E., P. William, R. Spann, and P. Tese. “The Politi-cal Economy of Crude Oil Price Controls.” Natural Resources Journal 18, October 1978.http://lawschool.unm.edu/nrj/vol-umes/18/4/07_erickson_political.pdf.
Executive Office of the President of the United States. “The All-of-the-Above Energy Strategy as a Path to Sustainable Economic Growth,” May 2014, p. 28. http://www.whitehouse.gov/sites/default/files/docs/aota_energy_strategy_as_a_path_to_sustain-able_economic_growth.pdf. ———. “US Trade Representative Michael Froman Annouces US Victory in Challenge to China’s Rare Earth Export Restraints,” 9 May 2014. http://www.ustr.gov/about-us/press-office/press-releases/2014/August/USTR-Froman-US-Victory-in-Challenge-to-China-Rare-Earth-Ex-port-Restraints.

NAVIGATING THE U.S. OIL EXPORT DEBATE
76 | CENTER ON GLObAL ENERGY POLICY | COLUMbIA SIPA
European Commission. “Raw Materials and Energy: Initial EU Position Paper,” July 2013. http://trade.ec.europa.eu/doclib/docs/2013/july/tradoc_151624.pdf.
Fattouh, B. “An Anatomy of the Crude Oil Pricing System.” Ox-ford Institute for Energy Studies, 2011. http://www.oxfordener-gy.org/wpcms/wp-content/uploads/2011/03/WPM40-AnAnat-omyoftheCrudeOilPricingSystem-BassamFattouh-2011.pdf.
Fielden, S. “Rising Production, Exports to Boost Margins for US Refiners.” Oil & Gas Journal, 2 December 2013. http://www.ogj.com/articles/print/volume-111/issue-12/processing/rising-production-exports-to-boost-margins-for-us-refiners.html.
Frankel, J. “National Security and Domestic Oil Depletion.” Discussion Paper 2014-58. Cambridge, MA: Harvard Environ-mental Economics Program, September 2014.
Fritelli, J. “The Jones Act: An Overview.” Washington, DC: Congressional Research Service, 8 July 2003. http://congres-sionalresearch.com/RS21566/document.php?study=The+-Jones+Act+An+Overview.
Gately, D. “World oil demand’s shift toward faster growing and less price-responsive products and regions.” Presentation at 29th USAEE/IAEE North American Conference, 2010. http://www.usaee.org/usaee2010/.
The General Agreement on Tariffs and Trade, Article XXI, “Se-curity Exemptions.” http://www.wto.org/english/res_e/book-sp_e/gatt_ai_e/art21_e.pdf.
Gilmour, J. “Oil prices Continue Slide, Fueling Calls for US Crude Exports.” Christian Science Monitor 11, December 2014. http://www.csmonitor.com/Environment/Energy-Voices/ 2014/1211/Oil-prices-continue-slide-fueling-calls-for-US-crude-exports.
Hays, K “Exclusive: New US Oil and Gas Well November Per-mits Tumble Nearly 40 Percent,” Reuters, 2 December 2014, http://www.reuters.com/article/2014/12/03/us-usa-oil-permits-idUSKCN0JG2C120141203.
Hegre, H., J. R. Oneal, and B. Russett. “Trade Does Promote Peace: New Simultaneous Estimates of the Reciprocal Effects of Trade and Conflict.” Journal of Peace Research 47(6), 2010: pp. 763–74. http://jpr.sagepub.com/content/47/6/763.full.pdf+html.
Houser, T., and S. Mohan. Fueling Up: The Economic Implica-tions of America’s Oil and Gas Boom. Washington, DC: Peterson Institute for International Economics, January 2014.
Hubbard, R. G., and A. P. O’Brien. Economics, 5th ed. New York: Pearson Education, 2014.
Hufbauer, G. C., A. E. Bagnall, and J. Muir. “Liquefied Natural Gas Exports: An Opportunity for America.” Washington, DC:
Peterson Institute for International Economics, February 2013. http://www.piie.com/publications/pb/pb13-6.pdf. ICF Inter-national. “The Impacts of US Crude Oil Exports on Domestic Crude Production, GDP, Employment, Trade, and Consumer Costs,” submitted to American Petroleum Institute, 31 March 2014 http://www.api.org/~/media/Files/Policy/LNG-Exports/LNG-primer/API-Crude-Exports-Study-by-ICF-3-31-2014.pdf.
IHS CERA. “Oil Sands, Greenhouse Gases, and US Oil Supply: Getting the Numbers Right – 2012 Update,” 2012.
IHS CERA, “Special Report: Comparing GHG Intensity of the Oil Sands and the Average US Crude Oil,” May 2014.
IHS Energy. “US Crude Oil Export Decision: Assessing the Im-pact of the Export Ban and Free Trade on the US Economy.” https://www.ihs.com/info/0514/crude-oil.html.
International Energy Agency. “Glossary.” http://www.iea.org/aboutus/glossary/.
———. Golden Rules for a Golden Age of Gas: World Energy Out-look Special Report on Unconventional Gas, 12 November 2012. http://www.worldenergyoutlook.org/media/weowebsite/2012/goldenrules/WEO2012_GoldenRulesReport.pdf.
———. “Medium-Term Oil Market Report: Executive Sum-mary,” 2014, p. 14. http://www.iea.org/Textbase/npsum/MTOMR2014sum.pdf.
———. “Oil Market Report,” October 2014. https://www.iea.org/media/omrreports/fullissues/2014-10-14.pdf.
———. “Oil Market Report,” December 2014. https://www.iea.org/oilmarketreport/reports/2014/.
———. World Energy Outlook, 2013, 12 November 2013.
———. World Energy Outlook 2014, 12 November 2014.
International Monetary Fund. “Oil Scarcity, Growth, and Glob-al Imbalances.” World Economic Outlook, April 2011. http://www.imf.org/external/pubs/ft/weo/2011/01/pdf/c3.pdf.
“Iran’s Condensate Exports Up 85 Percent, Oil Ministry Website Says.” Reuters via Al-Arabia News, 1 October 2014. http://en-glish.alarabiya.net/en/business/energy/2014/10/01/Iran-s-con-densate-exports-up-85-percent-oil-ministry-website-says.html.
Isidore, C. “Cheap Gas Could Kill US Oil Export Ban.” CNN Money, 12 December 2014. http://money.cnn.com/2014/12/12/news/economy/oil-export-ban/.
Jackson, R. et al. “Increased stray gas abundance in a subset of drinking water wells near Marcellus shale gas extraction,” Pro-ceedings of the National Academy of Sciences, Vol. 110 No. 28, 11250–11255, July 2013, http://sites.nicholas.duke.edu/avner-vengosh/files/2012/12/PNAS_Jacksonetal2013.pdf.

NAVIGATING THE U.S. OIL EXPORT DEBATE
energypolicy.columbia.edu | JANUARY 2015 | 77
Jackson, R. et al. “The Environmental Costs and Benefits of Fracking,” Annual Review of Environment and Resources Vol. 39: 327-362, 2014, http://www.annualreviews.org/doi/pdf/10.1146/annurev-environ-031113-144051.
Kalt, J. The Economics and Politics of Oil Price Regulation. Cam-bridge, MA: MIT Press, 1981.
Killian, L. “A Primer on Oil Shocks Past and Present.” Resourc-es for the Future, May 2010. http://www.rff.org/Publications/WPC/Pages/A-Primer-on-Oil-Price-Shocks-Past-and-Present.aspx.
Krichene, N. “World crude oil and natural gas: a demand and supply model.” Energy Economics 24.6, 2002: pp. 557-576.
Krupnick, A. “Managing the Risks of Shale Gas: Key Findings and Further Research,” Resources for the Future, 2014, http://www.rff.org/rff/documents/rff-rpt-managingrisksofshale-gas-keyfindings.pdf.
Krupp, F. “Don’t Just Drill, Baby—Drill Carefully: How to Make Fracking Safer for the Environment.” Foreign Affairs, May/June 2014. http://www.foreignaffairs.com/articles/141204/fred-krupp/dont-just-drill-baby-drill-carefully.
Lawler, A. “OPEC Oil Output Drops in November as Liby-an Recovery Falters.” Reuters, 2 December 2013. http://www.reuters.com/article/2014/12/03/us-opec-oil-idUSKCN0JG-1JI20141203.
Lee, E. G., et al. “The Abyss Stares Back.” Citi Research, 16 Oc-tober 2014.
Leff, J. “Poll: Unmoved by Oil Export Proponents, Americans Fear Gasoline Spike.” Reuters, 9 October 2014. http://www.reuters.com/article/2014/10/09/us-usa-oil-exports-idUSKCN-0HY15220141009?feedType=RSS&feedName=everything&-virtualBrandChannel=11563.
Leger, M. and J. Mayes. “Are BIS Rulings for Pioneer and Enterprise a Gamechanger?” Tuner, Mason & Company 8 (2), July 2014 http://www.turnermason.com/wpcontent/up-loads/2014/07/Perspectives.pdf.
Leiby, P. “Estimating the Energy Security Benefits of Reduced US Oil Imports,” p. 49. Oak Ridge, TN: Oak Ridge Labora-tory, February 2007. http://www.epa.gov/otaq/renewablefuels/ornl-tm-2007-028.pdf.
Levi, M. “A New Keystone XL Paper Is Probably Wrong.” Wash-ington, DC: Council on Foreign Relations, 13 August 2014 http://blogs.cfr.org/levi/2014/08/13/a-new-keystone-xl-paper-is-probably-wrong/.
———. “Energy Security: An Agenda for Research”, Coun-cil on Foreign Relations, June 2010, http://www.cfr.org/
content/publications/attachments/Energy_Security_Work-shop_Paper.pdf.
———. “Is OPEC a Paper Tiger? A New Study Says Yes.” http://blogs.cfr.org/levi/2013/05/23/is-opec-a-paper-tiger-a-new-study-says-yes/.
———. The Power Surge: Energy, Opportunity, and the Battle for America’s Future, pp. 45–46. New York: Oxford University Press, 2013.
McNally, R., and M. Levi. “Vindicating Volatility: Why Fluc-tuating Oil Prices Are Here to Stay.” Foreign Affairs 4, Novem-ber 2014. http://www.foreignaffairs.com/articles/142333/rob-ert-mcnally-and-michael-levi/vindicating-volatility.
McQuaile, M. “IEA’s Birol says could see ‘upward pressure’ on oil price in a couple of years,” Platts, 12 November 2014, http://www.platts.com/latest-news/oil/london/iea-sees-world-oil-de-mand-rising-to-104-million-27823622.
Malins, C., et al. “Upstream Emissions of Fossil Fuel Feed-stocks for Transport Fuels Consumed in the European Union. International Council on Clean Transportation Report to the European Commission Directorate-General for Climate Action, 2014. https://circabc.europa.eu/sd/a/6215286e-eb5f-4870-b92f-26acff386156/ICCT_Upstream-emissions-of-EU-crude_May2014.pdf.
“Man-Made Fuel Crisis.” New York Times op-ed, 2 October 1970.
Martin, D. and U. Kabra. “Oil Market Monthly: Opec Stasis Creates Further Downside Price Risks.” J. P. Morgan Gobal Commodities Research, 7 November 2014.
Metcalf, G. “The Economics of Energy Security,” Annu-al Review of Resource Economics 6 (October 2014): 155–74. http://www.annualreviews.org/doi/pdf/10.1146/annurev-re-source-100913-012333.
Morse, E., et al. “Out of America.” Citi Research, September 2014.
Ngai, C. “UPDATE 1—Pioneer Says Owned Most of Conden-sate Exported by Enterprise.” Reuters, 5 August 2014. http://www.reuters.com/article/2014/08/05/oil-condensate-pio-neer-natl-rsc-idUSL2N0QB1B920140805.
“National Defense Authorization Act for Fiscal Year 2012” (PL 112-81, Dec. 31, 2011). United States Statute at Large. http://www.gpo.gov/fdsys/pkg/PLAW-112publ81/html/PLAW-112publ81.htm.
National Research Council. Risks and Risk Governance in Shale Gas Development: Summary of Two Workshops. Washington, DC: National Academies Press, 2014.

NAVIGATING THE U.S. OIL EXPORT DEBATE
78 | CENTER ON GLObAL ENERGY POLICY | COLUMbIA SIPA
“Naval Petroleum Reserve Production Act of 1976” (PL 94-258, Apr. 5, 1976). United States Statute at Large. http://www.gpo.gov/fdsys/pkg/STATUTE-90/pdf/STATUTE-90Pg303.pdf.
Nixon, R. “Special Message to Congress on Energy Resources,” 4 June 1971. In G. Peters and J. T. Woolley, The American Pres-idency Project. http://www.presidency.ucsb.edu/ws/?pid=3038.
———. “Special Message to the Congress on Energy Policy,” 18 April 1973. In G. Peters and J. T. Woolley, The American Pres-idency Project. http://www.presidency.ucsb.edu/ws/?pid=3817.
Obama, B. “Continuation of the National Emergency with Respect to Export Control Regulations.” 79 Federal Regis-ter 46957, 11 August 2014. http://www.gpo.gov/fdsys/pkg/FR-2014-08-11/pdf/2014-19107.pdf#page=1.
Office of the United States Trade Representative. “US Trade Representative Michael Froman Announces US Victory in Chal-lenge to China’s Rare Earth Export Restraints,” August 2014. http://www.ustr.gov/about-us/press-office/press-releases/2014/August/USTR-Froman-US-Victory-in-Challenge-to-China-Ra-re-Earth-Export-Restraints.
———. “United States Challenges China’s Export Restrictions on Rare Earths,” March 2012. http://www.ustr.gov/about-us/press-office/press-releases/2012/march/united-states-challeng-es-china%E2%80%99s-export-restraints-r.
———. “United States Files WTO Case against China over Export Restraints on Raw Materials,” June 2009. http://www.ustr.gov/about-us/press-office/press-releases/2009/june/united-states-files-wto-case-against-china-over-expor.
———. “WTO Panel Finds against China’s Export Restraints on Raw Materials,” July 2011. http://www.ustr.gov/about-us/press-office/press-releases/2011/july/wto-panel-finds-against-chinas-export-restraints-raw.
Organization of Petroleum Exporting Countries. “Ecuador Facts and Figures.” http://www.opec.org/opec_web/en/about_us/148.htm.
“Outer Continental Shelf Lands Act of 1978” (PL 95-372, 18 September 1978). United States Statute at Large. http://www.gpo.gov/fdsys/pkg/STATUTE-92/pdf/STATUTE-92-Pg629.pdf.
“Past Is Precedent: Executive Power to Authorize Crude Oil Exports,” Prepared by Senate Minority Staff on the US Senate Committee on Energy and Natural Resources for Senator Lisa Murkowski, 3 March 2014 http://www.energy.senate.gov/pub-lic/index.cfm/files/serve?File_id=c78fdaf5-04ae-4586-b4d1-6562bb9cdae0.
Poten & Partners. “Industry Glossary.” http://www.poten.com/glossary.aspx?id=18136.
Reagan, R. “Executive Order 12287—Decontrol of Crude Oil and Refined Petroleum Products,” 28 January 1981. In G. Peters and J. T. Woolley, The American Presidency Project. http://www.presidency.ucsb.edu/ws/?pid=43901.
———. “Presidential Findings on the United States-Canadian Crude Oil Transfers,” 14 June 1985. In G. Peters and J. T. Wool-ley, The American Presidency Project. http://www.presidency.ucsb.edu/ws/?pid=38774.
———. “Presidential Findings Regarding the Export of Alaskan Crude Oil to Canada.” Washington, DC: The White House. 31 December 1988. http://www.reagan.utexas.edu/archives/speeches/1988/123188e.htm.
“Remarks by Tom Donilon, National Security Advisor to the President at the Launch of Columbia University’s Center on Global Energy Policy.” http://www.whitehouse.gov/the-press-office/2013/04/24/remarks-tom-donilon-national-security-ad-visor-president-launch-columbia-.
Rights-of-Way for Pipelines through Federal Lands, 30 U.S.C. §185(u).
Secretary of Energy Advisory Board. “Shale Gas Subcommit-tee 90-Day Report.” Submitted to US Department of Ener-gy, 18 August 2011. http://www.shalegas.energy.gov/resourc-es/081811_90_day_report_final.pdf.
Selivanova, Y. Regulation of Energy in International Trade Law: WTO, NAFTA, and Energy Charter. The Netherlands: Kluwer Law International. 2011.
Sen, A. “BIS clarifies US condensate exports; no material policy change but may encourage self-certification,” Energy Aspects, 30 December 2014.
“Sen. Brown and Portman Applaud World Trade Organiza-tion Decision to Defend American Manufacturers against Il-legal Chinese Hoarding of Rare Earth Materials.” http://www.brown.senate.gov/newsroom/press/release/sen-brown-and-port-man-applaud-world-trade-organization-decision-to-de-fend-american-manufacturers-against-illegal-chinese-hoard-ing-of-rare-earth-materials.
Shore, J., and J. Hackworth. “Impacts of the Venezuelan Crude Oil Production Loss.” EIA, 15 March 2007. http://www.eia.gov/pub/oil_gas/petroleum/feature_articles/2003/venezuelan/vzimpacts.htm.
Sider, A. “What is Condensate? Introducing America’s New Oil Export.” Wall Street Journal, 25 June 2014. http://blogs.wsj.com/corporate-intelligence/2014/06/25/what-is-condensate-in-troducing-americas-new-oil-export/.
Sovacool, B. The Routledge Handbook of Energy Security. Abing-don, UK: Routledge, 2011.

NAVIGATING THE U.S. OIL EXPORT DEBATE
energypolicy.columbia.edu | JANUARY 2015 | 79
Stern, R. “Oil Market Power and United States National Se-curity.” Proceedings of the National Academy of Sciences 103 (5):1650–55, 31 January 2006. http://www.pnas.org/con-tent/103/5/1650.full.pdf+html.
Su, S., and S. Cho. “Iraq Follows Saudis Discounting Oil for Asia to 11-Year Low,” 9 December 2014. http://www.bloomberg.com/news/2014-12-09/iraq-follows-saudi-arabia-with-deeper-crude-discounts-for-asia.html.
Tang, F., and S. L. Peng, “Asia Cndensate Demand to Double by 2016, Opening Market to New Supplies.” Reuters, 24 Au-gust 2014. http://www.reuters.com/article/2012/08/24/conden-sate-asia-idUSL4E8J81HT20120824.
“Terms of Trade: Condensate as an Exportable Commodity.” Prepared by Senate Minority Staff on the US Senate Committee on Energy and Natural Resources for Senator Lisa Murkowski, July 2014. http://www.energy.senate.gov/public/index.cfm/files/serve?File_id=e34b882e-d26e-456f-aa27-6b96c0b13a04.
US Department of Commerce. “Export Administration Report, Fourth Quarter,” 1973.https://archive.org/stream/exportadmin-ist00unit/exportadminist00unit_djvu.txt.
———, Bureau of Industry and Security. “Advisory Opinions.” http://www.bis.doc.gov/index.php/policy-guidance/adviso-ry-opinions.
———, Bureau of Industry and Security. “Export Administra-tion Regulations, Short Supply Controls, Crude Oil.” 15 Code of Federal Regulations 754.2.
———, International Trade Administration. “Elimination of Quantitative Limitations on Export of Refined Petroleum Prod-ucts.” 46 Federal Register 49108, 6 October 1981.
———, International Trade Administration. “Exports of Crude Oil Derived from Alaska’s Cook Inlet.” 50 Federal Register 52798, 26 December 1985.
“US Department of Commerce Grants First Export License of Surplus California Heavy Crude Oil.” Free Library. 1991 PR Newswire Association LLC, 1 December 2014. http://www.thefreelibrary.com/U.S.+DEPARTMENT+OF+COM-MERCE+GRATS+FIRST+EXPORT+LICENSE+OF+SUR-PLUS...-a011589178.
US Department of Energy, Office of Electricity and Delivery and Energy Reliability. “Comparing the Impacts of the 2005 and 2008 Hurricanes on US Energy Infrastructure,” February 2009. http://www.oe.netl.doe.gov/docs/HurricaneComp0508r2.pdf.
US Department of the Interior, Office of Economic Analy-sis. “An Analysis of the Economic and Security Aspects of the Trans-Alaska Pipeline,” vol. 1, p. F-20, December 1971.
US Department of State. “Iran Santions.” http://www.state.gov-/e/eb/tfs/spi/iran/index.htm.
———. “Final Supplemental Environmental Impact State-ment for the Keystone XL Project,” Section 4.14, January 2014. http://keystonepipeline-xl.state.gov/finalseis/index.htm.
US Department of Transportation, Bureau of Transportation Statistics. “Average Fuel Efficiency of US Light Duty Vehicle.” http://www.rita.dot.gov/bts/sites/rita.dot.gov.bts/files/publi-cations/national_transportation_statistics/html/table_04_23.html.
———, Federal Highway Administration, Office of Highway Policy Information. “Travel Monitoring.” http://www.fhwa.dot.gov/policyinformation/travel_monitoring/tvt.cfm.
US Department of the Treasury, “CISADA: The New US Sanc-tions against Iran.” http://www.treasury.gov/resource-center/sanctions/Programs/Documents/CISADA_english.pdf.
US Environmental Protection Agency. “EPA’s Study of Hy-draulic Fracturing for Oil and Gas and Its Potential Impact on Drinking Water Resources.” http://www2.epa.gov/hfstudy.
———. “Fuel and Fuel Additives, Renewable Fuel Standard.” http://www.epa.gov/otaq/fuels/renewablefuels/.
———. “Fuel Economy, Regulations and Standards.” http://www.epa.gov/fueleconomy/regulations.htm.
———. “Inventory of US Greenhouse Gas Emissions and Sinks: 1990–2012,” 15 April 2014. http://www.epa.gov/climat-echange/Downloads/ghgemissions/US-GHG-Inventory-2014-Main-Text.pdf.
———. “Oil and Natural Gas Sector: New Source Performance Standards and National Emissions Standards for Hazardous Air Pollutants Reviews; Final Rule.” 77 Fed. Reg. 49490, 16 Au-gust 2012. http://www.gpo.gov/fdsys/pkg/FR-2012-08-16/pdf/2012-16806.pdf.
———. Office of Air Quality Standards and Planning. “Oil and Natural Gas Sector Hydraulically Fractured Oil Well Comple-tions and Associated Gas during Ongoing Production.” EPA Pre-dissemination Peer Review Draft, April 2014. http://www.epa.gov/airquality/oilandgas/2014papers/20140415comple-tions.pdf.
US General Accounting Office. “Alaskan North Slope Oil: Lim-ited Effects of Lifting Export Ban on Oil and Shipping Indus-tries and Consumers.” Report to Congressional Committees, 1 July 1999. http://www.gao.gov/assets/160/156640.pdf.
US Geological Survey. “Earthquake Hazards Program: Induced Earthquakes.” http://earthquake.usgs.gov/research/induced/.

NAVIGATING THE U.S. OIL EXPORT DEBATE
80 | CENTER ON GLObAL ENERGY POLICY | COLUMbIA SIPA
———. “Summary of Selected Studies Related to Possible Ef-fects of Energy Development on Water Quantity, Water Quality and Ecosystems Conducted by USGS Water Science Centers.” http://water.usgs.gov/coop/products/energy/shale.cwp.summa-ry.pdf.
Volcovici, V., and M. Taj. “Saudi Oil Minister Naimi: ‘Why should we cut production?’” Reuters, 10 December 2014. http://www.reuters.com/article/2014/12/11/us-oil-naimi-idUSKBN-0JP04720141211.
Weisberg, R. The Politics of Crude Oil Pricing in the Middle East, 1970–1975, p. 49. Berkeley, CA: Institute of International Stud-ies. 1977.
World Trade Organization. Canada—Measures Affecting Ex-ports of Unprocessed Herring and Salmon. Adopted on 22 March 1988, BISD 35S/98. http://www.wto.org/english/tratop_e/dis-pu_e/87hersal.pdf.
———. China—Measures Related to the Exportation of Rare Earths, Tungsten and Molybdenum. WT/DS432/R. http://www.wto.org/english/tratop_e/dispu_e/cases_e/ds431_e.htm.
———. China—Measures Related to the Exportation of Various Raw Materials. WT/DS394/R. http://www.wto.org/english/tra-top_e/dispu_e/cases_e/ds394_e.htm.
“Worldwide Refinery Survey and Complexity Analysis.” Oil & Gas Journal. http://ogjresearch.stores.yahoo.net/worldwide-re-finery-survey-and-complexity-analysis.html.
Yergin, D. The Prize: The Epic Quest for Oil, Money and Power. New York, Simon and Schuster, 1992.
Yergin, D., and J. Stanislaw. The Commanding Heights: The Bat-tle for the World Economy, chap. 2. New York: Simon & Schus-ter, 1998. Yukhananov, A., and T. Brown. “EU Pushes for Ur-gent Energy Deal in US Trade Pact,” 9 September 2014. http://uk.reuters.com/article/2014/09/09/uk-usa-eu-tradeidUKKBN-0H428Q20140909.
Zarate, J. Treasury’s War: The Unleashing of a New Era of Finan-cial Warfare. New York: PublicAffairs, 2013.
Zarocostas, J. “US Wins Trade Dispute with China Over Duties on Cars, SUVs; 2nd Win Since March,” 23 May 2014. http://www.mcclatchydc.com/2014/05/23/228320_us-wins-tradedis-pute-with-china.html?rh=1.