Embed Size (px)
Citation preview
1
Classification | CG-926 RDC | author | audience | month year
Navigational Telex (NAVTEX) Modeling
Distribution Statement A: Approved for public release; distribution is unlimited. April 2017
Report No. CG-D-04-18
NAXTEX Modeling
ii UNCLAS//Public | CG-926 RDC | LCDR A. Dahlen
Public | April 2017
N O T I C E This document is disseminated under the sponsorship of the Department of Homeland Security in the interest of information exchange. The United States Government assumes no liability for its contents or use thereof. The United States Government does not endorse products or manufacturers. Trade or manufacturers’ names appear herein solely because they are considered essential to the object of this report.
Mr. Jim Fletcher E&W Branch Chief United States Coast Guard Research & Development Center 1 Chelsea Street New London, CT 06320
NAXTEX Modeling
iii UNCLAS//Public | CG-926 RDC | LCDR A. Dahlen
Public | April 2017
Technical Report Documentation Page 1. Report No.
CG-D-04-18 2. Government Accession Number
3. Recipient’s Catalog No.
4. Title and Subtitle
Navigation Telex (NAVTEX) Modeling 5. Report Date
April 2017 6. Performing Organization Code
Project No. 9993 7. Author(s)
LCDR Aaron P. Dahlen 8. Performing Report No.
R&DC UDI # 1715 9. Performing Organization Name and Address
U.S. Coast Guard Research and Development Center 1 Chelsea Street New London, CT 06320
10. Work Unit No. (TRAIS)
11. Contract or Grant No.
12. Sponsoring Organization Name and Address
Commanding Officer C3CEN CAMS Product Line 4000 COAST GUARD BLVD Portsmouth, VA 23703
13. Type of Report & Period Covered
Final
14. Sponsoring Agency Code
Commanding Officer C3CEN 4000 COAST GUARD BLVD Portsmouth, VA 23703
15. Supplementary Notes
The R&D Center’s technical point of contact is LCDR Aaron P. Dahlen, 860-271-2882, email: [email protected] 16. Abstract (MAXIMUM 200 WORDS)
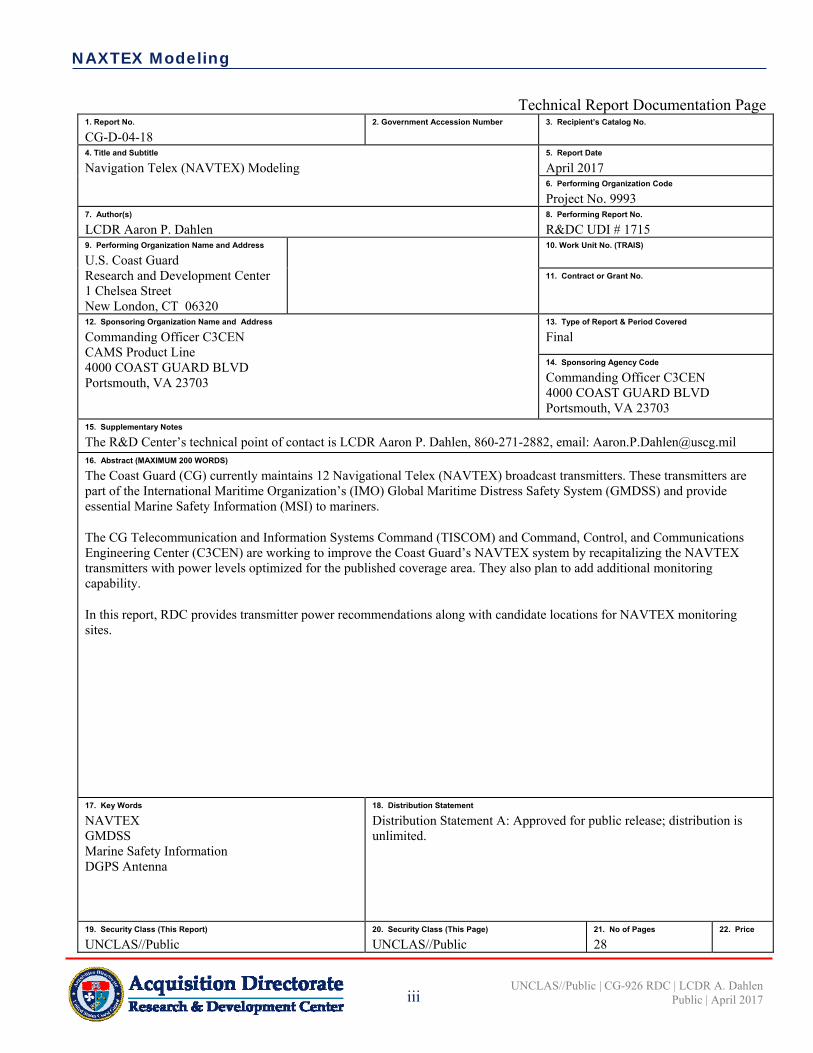
The Coast Guard (CG) currently maintains 12 Navigational Telex (NAVTEX) broadcast transmitters. These transmitters are part of the International Maritime Organization’s (IMO) Global Maritime Distress Safety System (GMDSS) and provide essential Marine Safety Information (MSI) to mariners.
The CG Telecommunication and Information Systems Command (TISCOM) and Command, Control, and Communications Engineering Center (C3CEN) are working to improve the Coast Guard’s NAVTEX system by recapitalizing the NAVTEX transmitters with power levels optimized for the published coverage area. They also plan to add additional monitoring capability.
In this report, RDC provides transmitter power recommendations along with candidate locations for NAVTEX monitoring sites.
17. Key Words
NAVTEX GMDSS Marine Safety Information DGPS Antenna
18. Distribution Statement
Distribution Statement A: Approved for public release; distribution is unlimited.
19. Security Class (This Report)
UNCLAS//Public 20. Security Class (This Page)
UNCLAS//Public 21. No of Pages
28 22. Price
NAXTEX Modeling
iv UNCLAS//Public | CG-926 RDC | LCDR A. Dahlen
Public | April 2017
(This page intentionally left blank.)
NAXTEX Modeling
v UNCLAS//Public | CG-926 RDC | LCDR A. Dahlen
Public | April 2017
EXECUTIVE SUMMARY
The U.S. Coast Guard (CG) currently maintains 12 Navigational Telex (NAVTEX) broadcast transmitters. These transmitters are part of the International Maritime Organization’s (IMO) Global Maritime Distress Safety System (GMDSS) and provide essential Marine Safety Information (MSI) to mariners. The USCG’s NAVTEX stations provide coverage on the east and west coast of CONUS, Hawaii, and Alaska.
The CG Telecommunication and Information Systems Command (TISCOM) and Command, Control, and Communications Engineering Center (C3CEN) are working to improve the Coast Guard’s NAVTEX system by recapitalizing the NAVTEX transmitters with power levels optimized for the published coverage area. They also plan to add additional monitoring capability.
This report uses modeling to show that a reduction of transmitter power is appropriate for most CG NAVTEX transmitters. The report also provides recommendations for candidate NAVTEX monitoring sites.
Additional work is required prior to moving forward with the transmit power reduction. Actual measurements in the user area, preferably open-ocean, are recommended. This should be done with current transmit power levels and also by decreasing the transmit power of the current transmitters to the power levels calculated by the model. This is necessary as each transmitter/antenna pair will have different numbers as the antennas can vary at each site.

NAXTEX Modeling
vi UNCLAS//Public | CG-926 RDC | LCDR A. Dahlen
Public | April 2017
(This page intentionally left blank.)
NAXTEX Modeling
vii UNCLAS//Public | CG-926 RDC | LCDR A. Dahlen
Public | April 2017
TABLE OF CONTENTS
EXECUTIVE SUMMARY ............................................................................................................................ v
LIST OF FIGURES ..................................................................................................................................... viii
LIST OF TABLES ....................................................................................................................................... viii
LIST OF ACRONYMS, ABBREVIATIONS, AND SYMBOLS............................................................... ix
1 INTRODUCTION................................................................................................................................... 1
2 NAVTEX GROUND WAVE MODELING .......................................................................................... 1
3 NAVTEX REDUCED POWER COVERAGE ..................................................................................... 3
4 TRANSMITTER RECAP ...................................................................................................................... 7
5 MONITORING PLACEMENT ............................................................................................................ 7
APPENDIX A. ANTENNA EFFICIENCY BASED ON DGPS OPERATIONAL ASSESSMENTS ............................................................................................................. A-1
NAXTEX Modeling
viii UNCLAS//Public | CG-926 RDC | LCDR A. Dahlen
Public | April 2017
LIST OF FIGURES
Figure 1. Half of the CG NAVTEX broadcast towers are similar to this CG DGPS tower. ........................... 2 Figure 2. Reduced power forecast for the east coast CG maintained NAVTEX stations. .............................. 4 Figure 3. Reduced power forecast for the west coast and Hawaii NAVTEX stations. ................................... 5 Figure 4. Reduced power forecast for the Guam and Kodiak NAVTEX stations. .......................................... 6 Figure A-1. Excerpt from the July 2014 Kodiak, AK GPS (DGPS) site operations assessment. ............... A-2 Figure A-2. Kodiak, AK DGPS coverage forecast assuming a 7 dB antenn loss. ....................................... A-3 Figure A-3. Excerpt from the March 2015 Annapolis, MD DGPS site operations assessment. ................. A-4 Figure A-4. Annapolis, MD DGPS coverage forecast assuming a 7 dB antenna loss. ............................... A-5 Figure A-5. Excerpt from the July 2013 Driver, VA DGPS site operations assessment. ............................ A-6 Figure A-6. Driver, VA DGPS coverage forecast assuming a 7 dB loss. .................................................... A-7 Figure A-7. Excerpt from the July 2014 Level Island, AK DGPS site operations assessment. .................. A-8 Figure A-8. Level Island , AK DGPS coverage forecast assuming a 7 dB loss. ......................................... A-9
LIST OF TABLES
Table 1. Location of the USCG maintained NAVTEX broadcast facilities. ................................................... 3 Table 2. Comparison of published NAVTEX to modeled coverage area. The yellow highlights identify
stations with a forecast below the published specification. ............................................................... 7 Table 3. Candidate NAVTEX field monitor locations. ................................................................................... 8 Table A-1. Representative DGPS station featuring 300 foot towers. .......................................................... A-1
NAXTEX Modeling
ix UNCLAS//Public | CG-926 RDC | LCDR A. Dahlen
Public | April 2017
LIST OF ACRONYMS, ABBREVIATIONS, AND SYMBOLS
dB decibel dBuV/m field strength in dB with the signal referenced to a microvolt C3CEN Command, Control, and Communications Engineering Center COTS Commercial off-the-shelf DGPS Differential Global Positioning System ET2 Coast Guard Electronics Technician - second class GMDSS Global Maritime Distress and Safety System IMO International Maritime Organization ITU International Telecommunication Union kHz frequency expressed in thousands of Hertz NAVTEX Navigational Telex MF Medium Frequency MSI Marine Safety Information RDC Coast Guard Research and Development Center SOLAS Safety of Life at Sea Telex Teleprinter network TISCOM USCG Telecommunications and Information Systems Command USCG United States Coast Guard uV/m field strength expressed in microvolts per meter
NAXTEX Modeling
x UNCLAS//Public | CG-926 RDC | LCDR A. Dahlen
Public | April 2017
(This page intentionally left blank.)
NAXTEX Modeling
1 UNCLAS//Public | CG-926 RDC | LCDR A. Dahlen
Public | April 2017
1 INTRODUCTION
On the 1st of October 2015 the EL FARO, a United States flagged cargo ship, sank about 40 miles north of Acklins & Crooked Island, Bahamas. A causative factor was lack of situational awareness. EL FARO had unknowingly steered directly into Hurricane Joaquin. The ship was battered by this category 3 hurricane, lost propulsion, and ultimately sank with the loss of all hands.
The United States Coast Guard (USCG) maintains a network of Navigational Telex (NAVTEX) transmitters for the automated dissemination of Maritime Safety Information (MSI). These transmitters serve as an early warning system for mariners, identifying the location of storms such as Hurricane Joaquin and other navigational and safety items for the mariner. NAVTEX is part of a larger international system and an important component of the Global Maritime Distress Safety System (GMDSS).
Currently, the USCG maintains 12 shore-side transmitting stations. All operate at a low frequency of 518 kHz with a broadcast power of 2500 W. Transmissions are rotated on a 4 hour schedule to prevent interference between CG and international NAVTEX stations. The data are sent using binary frequency-shift keying at a rate of 100 bits per second. This relatively slow system, by modern standards, is still viable with several manufacturers offering products for the mariner. These range from small self contained units for the recreational boater to computer-based units for integration into the electronic charting systems of SOLAS class vessels.
The Coast Guard Telecommunications and Information Systems Command (TISCOM) and Command, Control, and Communications Engineering Center (C3CEN) are currently working to improve the NAVTEX system by recapitalizing the NAVTEX transmitters and adding additional monitoring capability. In this report, RDC provides an independent recommendation supporting the change in transmitter power. A list of candidate NAVTEX monitoring sites is also included.
2 NAVTEX GROUND WAVE MODELING
To develop a NAVTEX forecast, RDC used the latest ITU-RP368-9 ground wave path loss tool as implemented in ATDI’s commercially available Spectrum-E tool. To use this forecasting tool, the operator must enter the NAVTEX station location, transmitter power, antenna efficiency, and desired field strength for a user at the edge of the published coverage boundary.
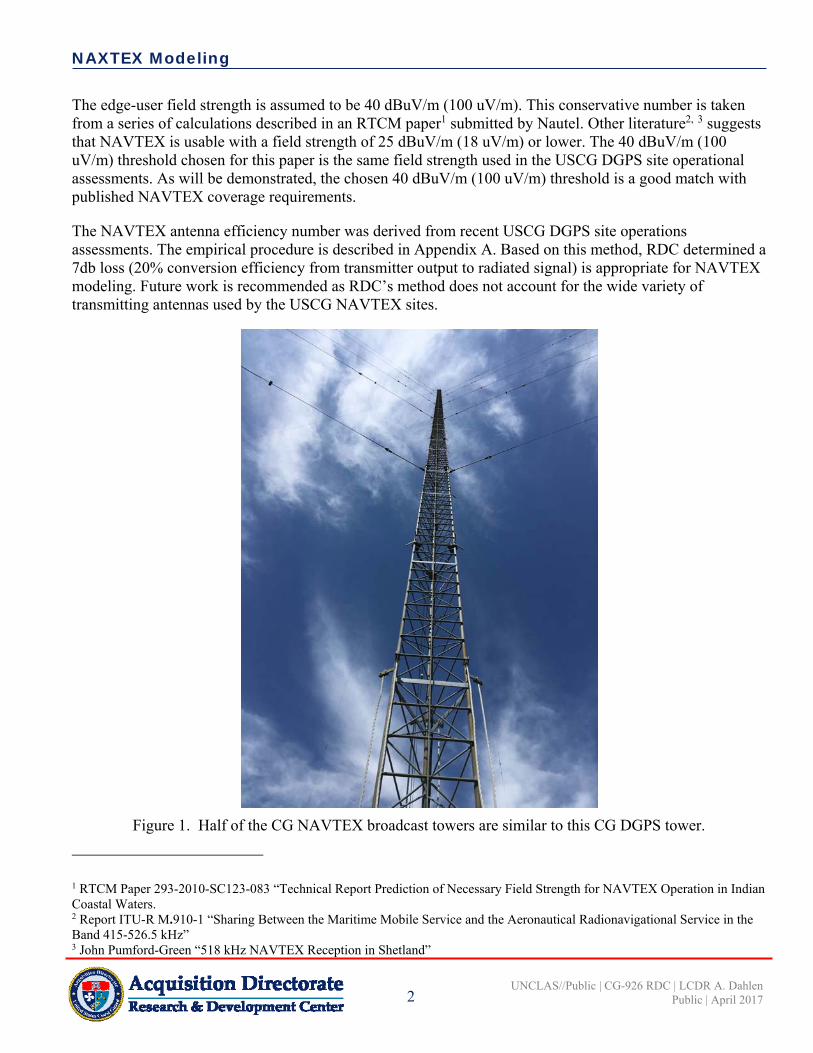
Station locations and coverage boundaries are identified in the (International Marine Organization) IMO GMDSS.1/Circ.16 Master Plan of Shore-Based Facilities for the Global Maritime Distress and Safety System (GMDSS Master Plan). TISCOM provided the desired reduced transmitter power for each station and tower types. Together, this information is captured in Table 1. Half of the stations broadcast from 300 feet towers as shown in Photo 1. The remainder use either long wire or shorter towers.
NAXTEX Modeling
2 UNCLAS//Public | CG-926 RDC | LCDR A. Dahlen
Public | April 2017
The edge-user field strength is assumed to be 40 dBuV/m (100 uV/m). This conservative number is taken from a series of calculations described in an RTCM paper1 submitted by Nautel. Other literature2, 3 suggests that NAVTEX is usable with a field strength of 25 dBuV/m (18 uV/m) or lower. The 40 dBuV/m (100 uV/m) threshold chosen for this paper is the same field strength used in the USCG DGPS site operational assessments. As will be demonstrated, the chosen 40 dBuV/m (100 uV/m) threshold is a good match with published NAVTEX coverage requirements.
The NAVTEX antenna efficiency number was derived from recent USCG DGPS site operations assessments. The empirical procedure is described in Appendix A. Based on this method, RDC determined a 7db loss (20% conversion efficiency from transmitter output to radiated signal) is appropriate for NAVTEX modeling. Future work is recommended as RDC’s method does not account for the wide variety of transmitting antennas used by the USCG NAVTEX sites.
Figure 1. Half of the CG NAVTEX broadcast towers are similar to this CG DGPS tower.
1 RTCM Paper 293-2010-SC123-083 “Technical Report Prediction of Necessary Field Strength for NAVTEX Operation in Indian Coastal Waters. 2 Report ITU-R M.910-1 “Sharing Between the Maritime Mobile Service and the Aeronautical Radionavigational Service in the Band 415-526.5 kHz” 3 John Pumford-Green “518 kHz NAVTEX Reception in Shetland”
NAXTEX Modeling
3 UNCLAS//Public | CG-926 RDC | LCDR A. Dahlen
Public | April 2017
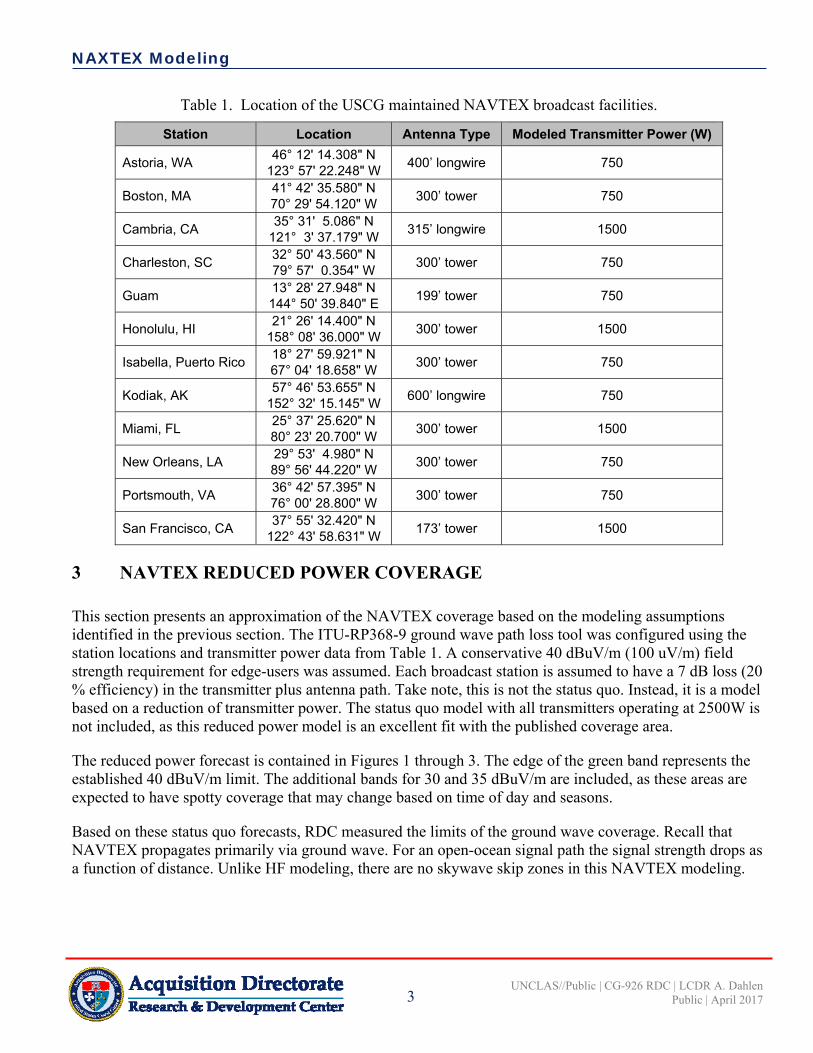
Table 1. Location of the USCG maintained NAVTEX broadcast facilities.
Station Location Antenna Type Modeled Transmitter Power (W)
Astoria, WA 46° 12' 14.308" N
123° 57' 22.248" W 400’ longwire 750
Boston, MA 41° 42' 35.580" N 70° 29' 54.120" W
300’ tower 750
Cambria, CA 35° 31' 5.086" N
121° 3' 37.179" W 315’ longwire 1500
Charleston, SC 32° 50' 43.560" N 79° 57' 0.354" W
300’ tower 750
Guam 13° 28' 27.948" N 144° 50' 39.840" E
199’ tower 750
Honolulu, HI 21° 26' 14.400" N
158° 08' 36.000" W 300’ tower 1500
Isabella, Puerto Rico 18° 27' 59.921" N 67° 04' 18.658" W
300’ tower 750
Kodiak, AK 57° 46' 53.655" N
152° 32' 15.145" W 600’ longwire 750
Miami, FL 25° 37' 25.620" N 80° 23' 20.700" W
300’ tower 1500
New Orleans, LA 29° 53' 4.980" N 89° 56' 44.220" W
300’ tower 750
Portsmouth, VA 36° 42' 57.395" N 76° 00' 28.800" W
300’ tower 750
San Francisco, CA 37° 55' 32.420" N
122° 43' 58.631" W 173’ tower 1500
3 NAVTEX REDUCED POWER COVERAGE
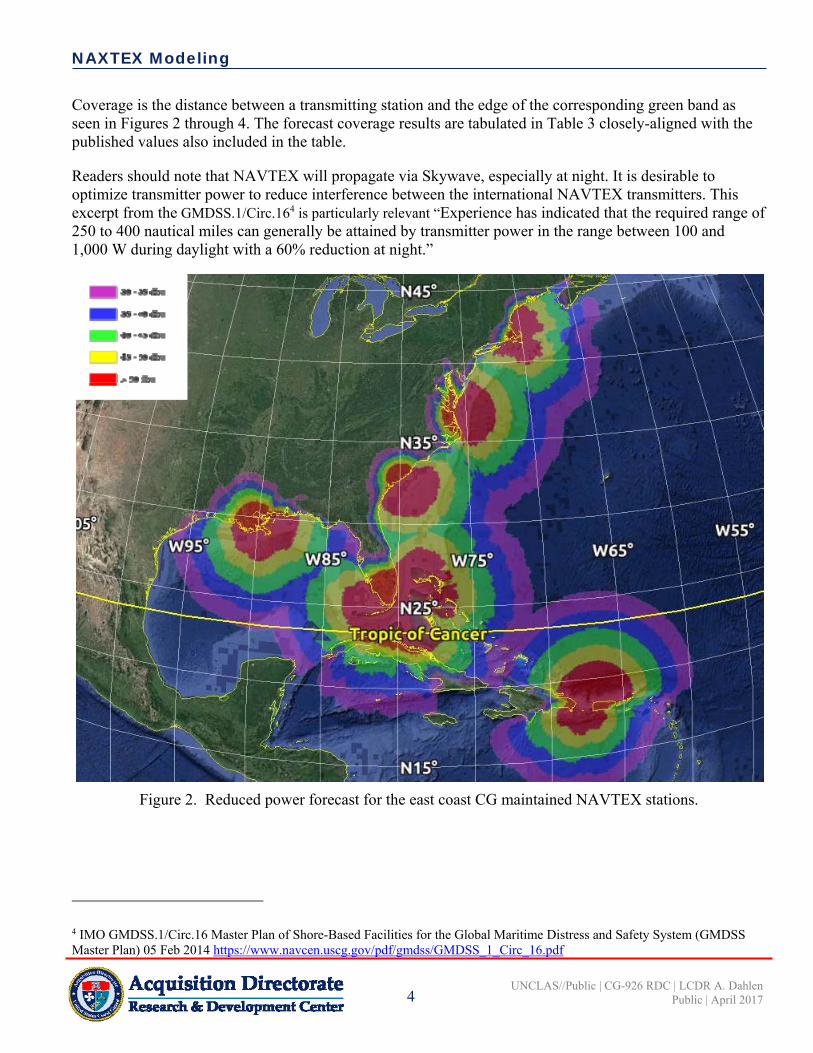
This section presents an approximation of the NAVTEX coverage based on the modeling assumptions identified in the previous section. The ITU-RP368-9 ground wave path loss tool was configured using the station locations and transmitter power data from Table 1. A conservative 40 dBuV/m (100 uV/m) field strength requirement for edge-users was assumed. Each broadcast station is assumed to have a 7 dB loss (20 % efficiency) in the transmitter plus antenna path. Take note, this is not the status quo. Instead, it is a model based on a reduction of transmitter power. The status quo model with all transmitters operating at 2500W is not included, as this reduced power model is an excellent fit with the published coverage area.
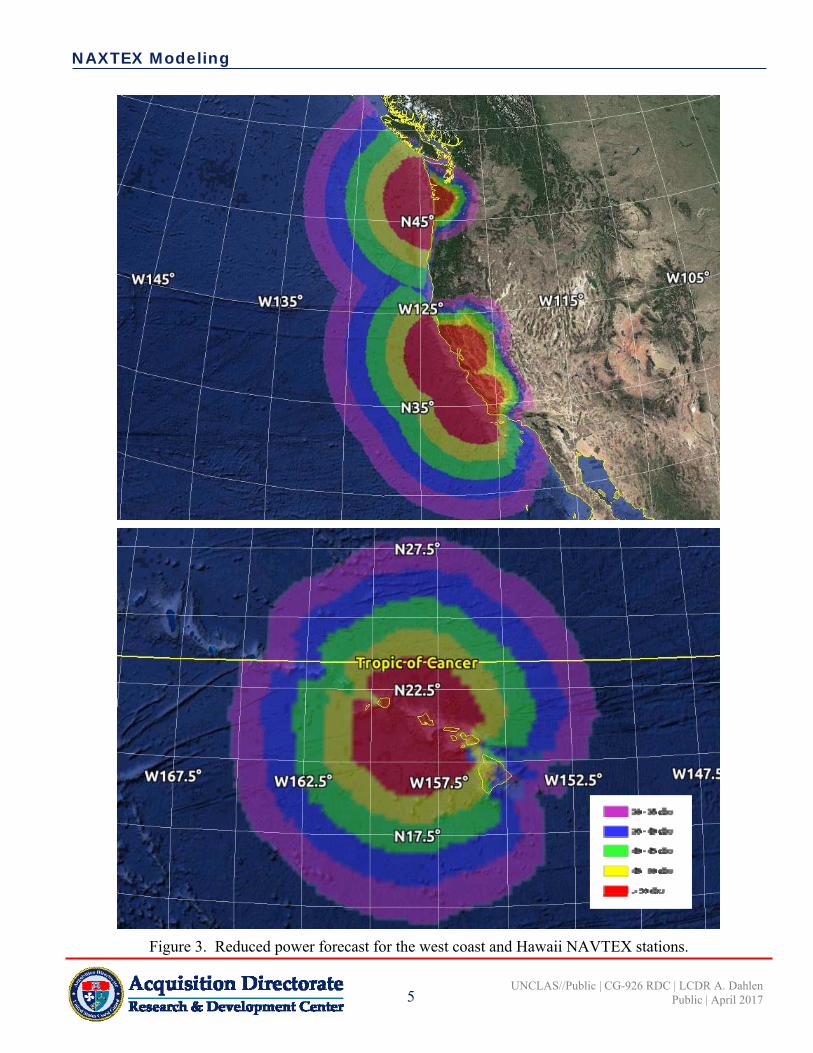
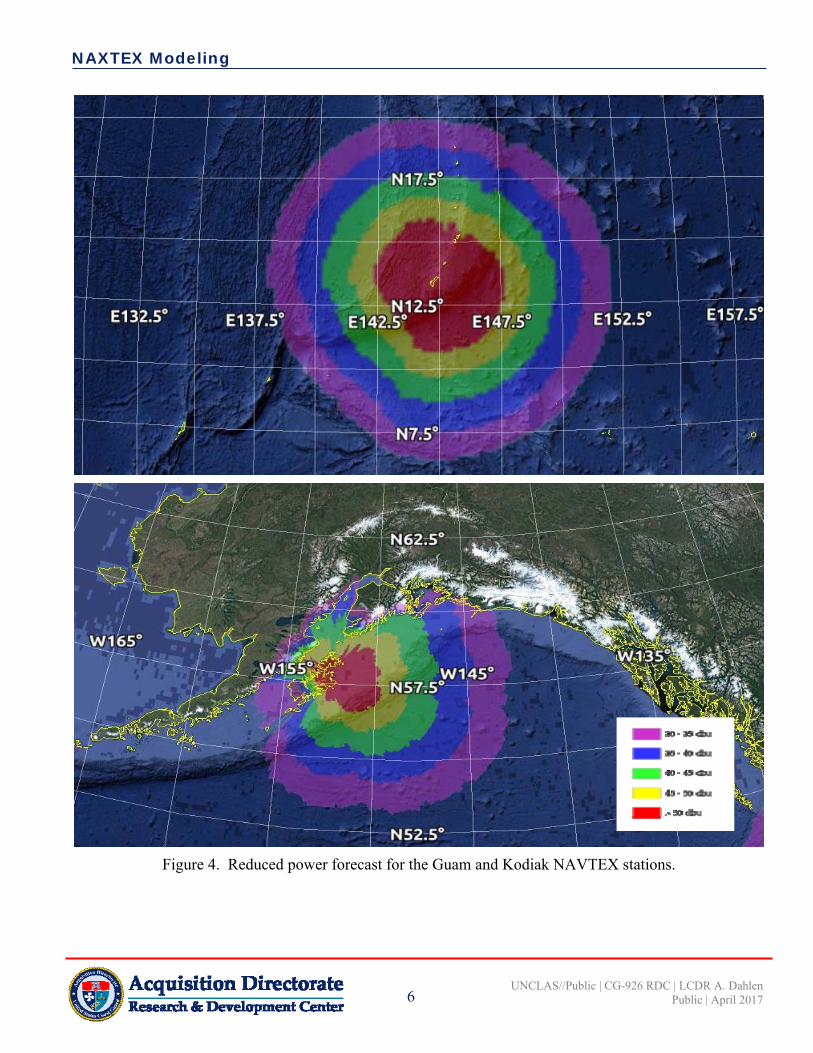
The reduced power forecast is contained in Figures 1 through 3. The edge of the green band represents the established 40 dBuV/m limit. The additional bands for 30 and 35 dBuV/m are included, as these areas are expected to have spotty coverage that may change based on time of day and seasons.
Based on these status quo forecasts, RDC measured the limits of the ground wave coverage. Recall that NAVTEX propagates primarily via ground wave. For an open-ocean signal path the signal strength drops as a function of distance. Unlike HF modeling, there are no skywave skip zones in this NAVTEX modeling.
NAXTEX Modeling
4 UNCLAS//Public | CG-926 RDC | LCDR A. Dahlen
Public | April 2017
Coverage is the distance between a transmitting station and the edge of the corresponding green band as seen in Figures 2 through 4. The forecast coverage results are tabulated in Table 3 closely-aligned with the published values also included in the table.
Readers should note that NAVTEX will propagate via Skywave, especially at night. It is desirable to optimize transmitter power to reduce interference between the international NAVTEX transmitters. This excerpt from the GMDSS.1/Circ.164 is particularly relevant “Experience has indicated that the required range of 250 to 400 nautical miles can generally be attained by transmitter power in the range between 100 and 1,000 W during daylight with a 60% reduction at night.”
Figure 2. Reduced power forecast for the east coast CG maintained NAVTEX stations.
4 IMO GMDSS.1/Circ.16 Master Plan of Shore-Based Facilities for the Global Maritime Distress and Safety System (GMDSS Master Plan) 05 Feb 2014 https://www.navcen.uscg.gov/pdf/gmdss/GMDSS_1_Circ_16.pdf
NAXTEX Modeling
5 UNCLAS//Public | CG-926 RDC | LCDR A. Dahlen
Public | April 2017
Figure 3. Reduced power forecast for the west coast and Hawaii NAVTEX stations.
NAXTEX Modeling
6 UNCLAS//Public | CG-926 RDC | LCDR A. Dahlen
Public | April 2017
Figure 4. Reduced power forecast for the Guam and Kodiak NAVTEX stations.
NAXTEX Modeling
7 UNCLAS//Public | CG-926 RDC | LCDR A. Dahlen
Public | April 2017
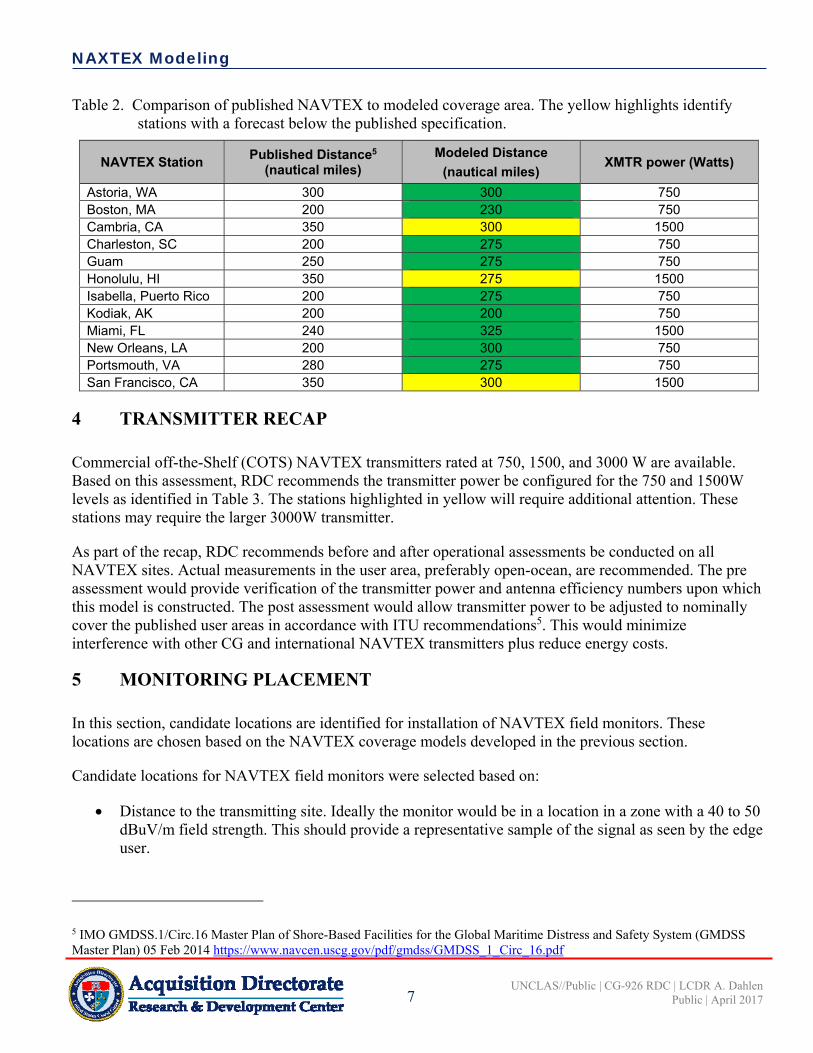
Table 2. Comparison of published NAVTEX to modeled coverage area. The yellow highlights identify stations with a forecast below the published specification.
NAVTEX Station Published Distance5
(nautical miles) Modeled Distance
(nautical miles) XMTR power (Watts)
Astoria, WA 300 300 750 Boston, MA 200 230 750 Cambria, CA 350 300 1500 Charleston, SC 200 275 750 Guam 250 275 750 Honolulu, HI 350 275 1500 Isabella, Puerto Rico 200 275 750 Kodiak, AK 200 200 750 Miami, FL 240 325 1500 New Orleans, LA 200 300 750 Portsmouth, VA 280 275 750 San Francisco, CA 350 300 1500
4 TRANSMITTER RECAP
Commercial off-the-Shelf (COTS) NAVTEX transmitters rated at 750, 1500, and 3000 W are available. Based on this assessment, RDC recommends the transmitter power be configured for the 750 and 1500W levels as identified in Table 3. The stations highlighted in yellow will require additional attention. These stations may require the larger 3000W transmitter.
As part of the recap, RDC recommends before and after operational assessments be conducted on all NAVTEX sites. Actual measurements in the user area, preferably open-ocean, are recommended. The pre assessment would provide verification of the transmitter power and antenna efficiency numbers upon which this model is constructed. The post assessment would allow transmitter power to be adjusted to nominally cover the published user areas in accordance with ITU recommendations5. This would minimize interference with other CG and international NAVTEX transmitters plus reduce energy costs.
5 MONITORING PLACEMENT
In this section, candidate locations are identified for installation of NAVTEX field monitors. These locations are chosen based on the NAVTEX coverage models developed in the previous section.
Candidate locations for NAVTEX field monitors were selected based on:
Distance to the transmitting site. Ideally the monitor would be in a location in a zone with a 40 to 50 dBuV/m field strength. This should provide a representative sample of the signal as seen by the edge user.
5 IMO GMDSS.1/Circ.16 Master Plan of Shore-Based Facilities for the Global Maritime Distress and Safety System (GMDSS Master Plan) 05 Feb 2014 https://www.navcen.uscg.gov/pdf/gmdss/GMDSS_1_Circ_16.pdf
NAXTEX Modeling
8 UNCLAS//Public | CG-926 RDC | LCDR A. Dahlen
Public | April 2017
Collocation with existing CG units or other military bases when possible. This will leverage existing CG land and infrastructure, such as power and computer networks. Collocation with other CG units is also desirable for maintenance. This repair and maintenance of the NAVTEX field equipment is expected to be an easy task for an independent Coast Guard Electronics Technician (ET2).
The expected space requirement for a NAVTEX field monitor is minimal. The antenna may take the form of a loop, H-field, or possibly a whip. The loop and H-field antenna may be mounted nearly anywhere as they are relatively small. A location on the roof of a main building or outbuilding would likely be acceptable. A whip, depending on size, could require additional space. In all cases, the antenna locations should be as far as possible from electrical and office equipment.
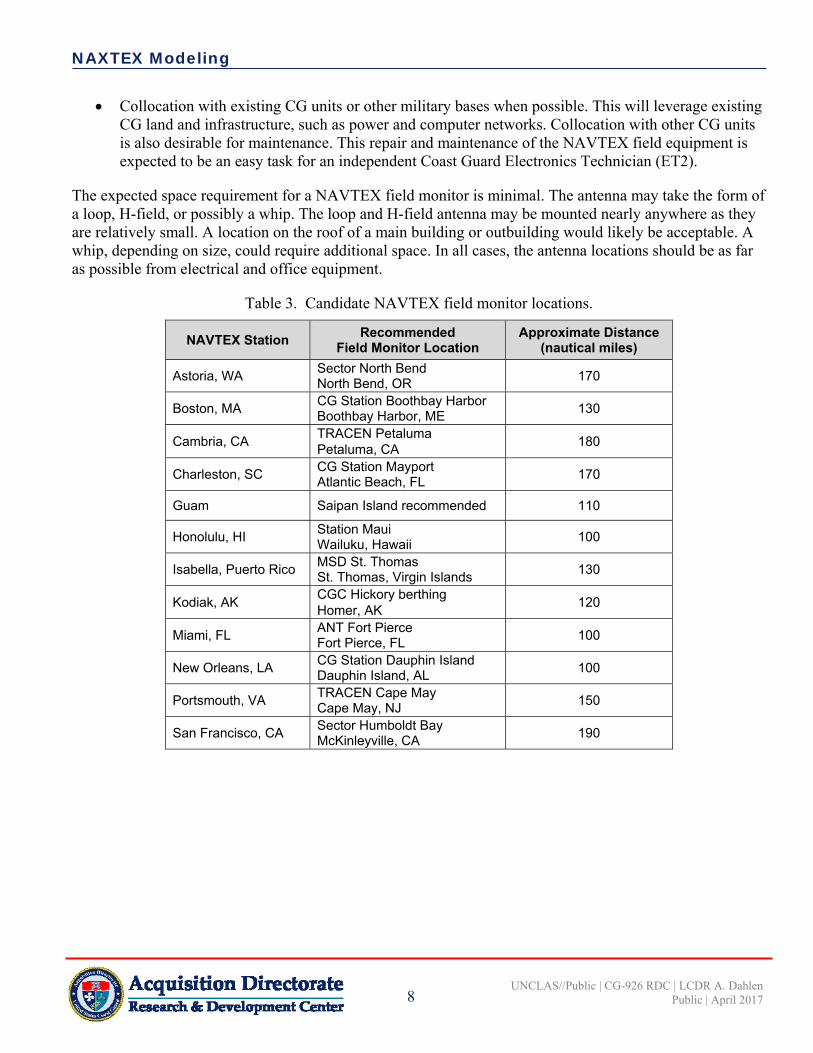
Table 3. Candidate NAVTEX field monitor locations.
NAVTEX Station Recommended
Field Monitor Location Approximate Distance
(nautical miles)
Astoria, WA Sector North Bend North Bend, OR
170
Boston, MA CG Station Boothbay Harbor Boothbay Harbor, ME
130
Cambria, CA TRACEN Petaluma Petaluma, CA
180
Charleston, SC CG Station Mayport Atlantic Beach, FL
170
Guam Saipan Island recommended 110
Honolulu, HI Station Maui Wailuku, Hawaii
100
Isabella, Puerto Rico MSD St. Thomas St. Thomas, Virgin Islands
130
Kodiak, AK CGC Hickory berthing Homer, AK
120
Miami, FL ANT Fort Pierce Fort Pierce, FL
100
New Orleans, LA CG Station Dauphin Island Dauphin Island, AL
100
Portsmouth, VA TRACEN Cape May Cape May, NJ
150
San Francisco, CA Sector Humboldt Bay McKinleyville, CA
190
NAXTEX Modeling
A-1 UNCLAS//Public | CG-926 RDC | LCDR A. Dahlen
Public | April 2017
APPENDIX A. ANTENNA EFFICIENCY BASED ON DGPS OPERATIONAL
ASSESSMENTS
The United States Coast Guard (USCG) maintains a network of Differential Global Positioning System (DGPS) Medium Frequency (MF) transmitting sites. These MF sites are similar to the MF NAVTEX sites in power, broadcast frequency, and edge-user field signal strength requirements. Most importantly, many of the DGPS sites use the same transmitting towers as the NAVTEX sites. Consequently, lessons learned from the DGPS systems may be applied to the NAVTEX system.
The critical NAVTEX antenna efficiency number, as used in this report, was derived from the DGPS system. Specifically, it was derived from the readily available and detailed DGPS site operational assessments. These DGPS reports include actual signal strength readings taken over large geographical areas. For this analysis, RDC chose four stations as identified in Table A-1. These particular DGPS stations share the same 300 foot antenna as the majority of the NAVTEX stations.
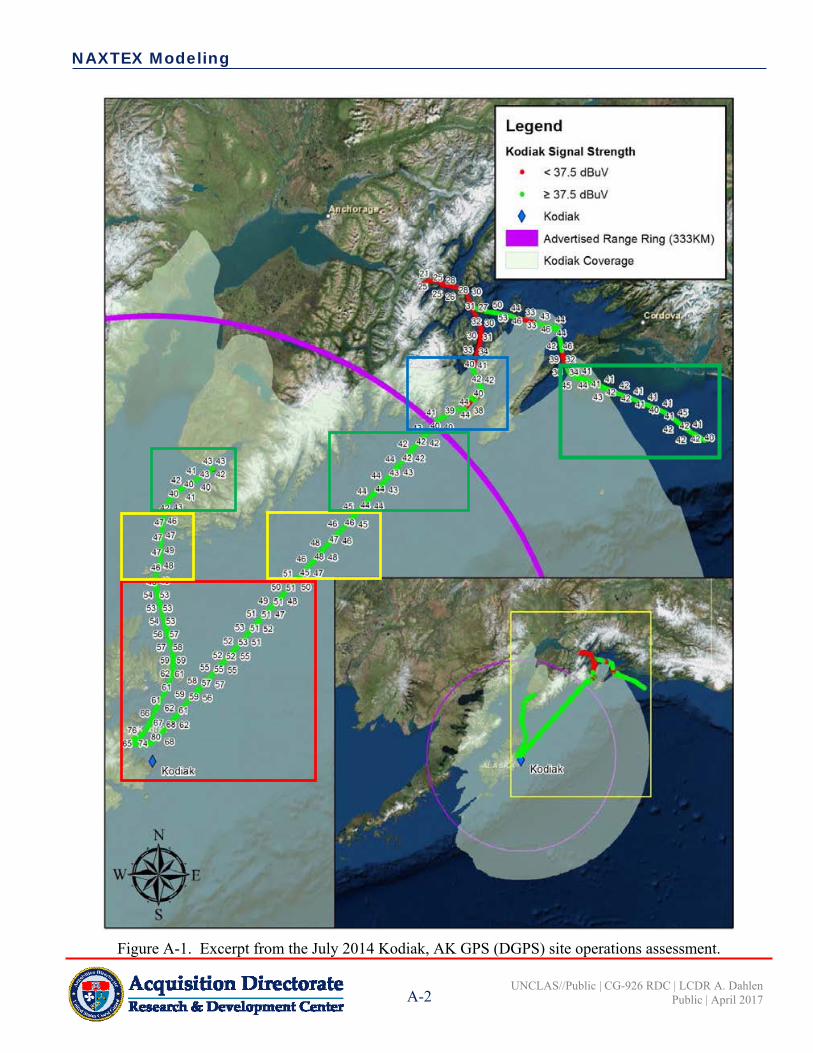
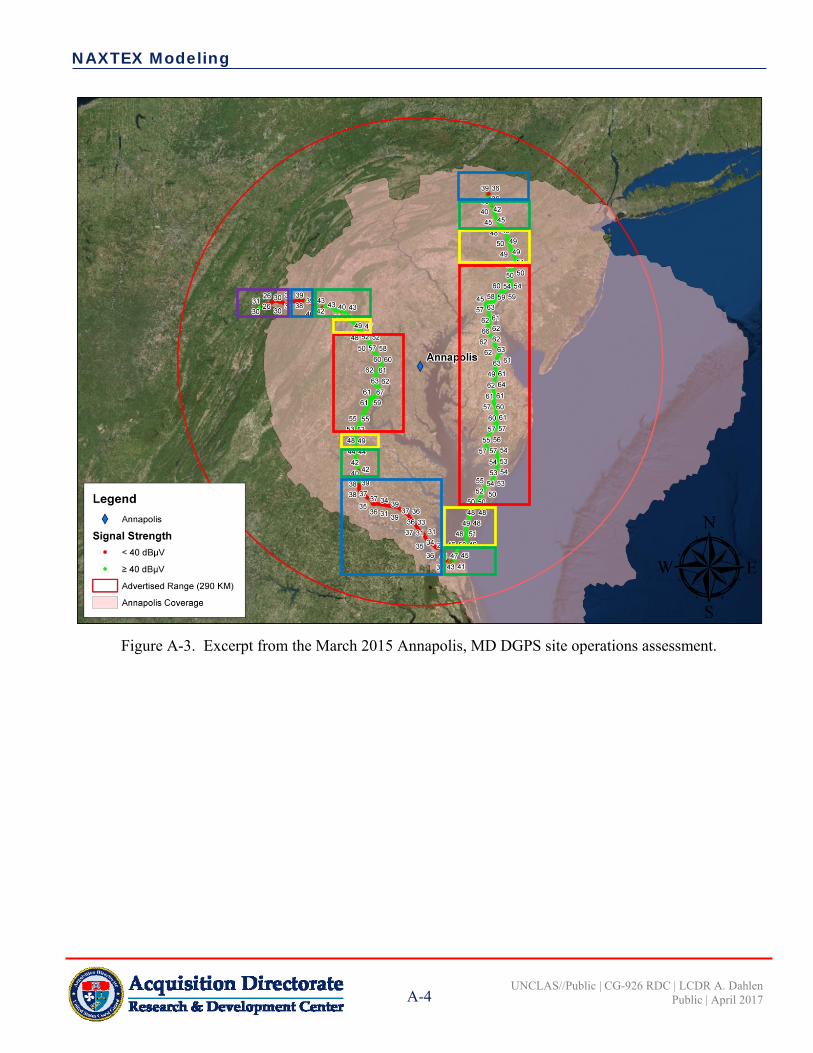
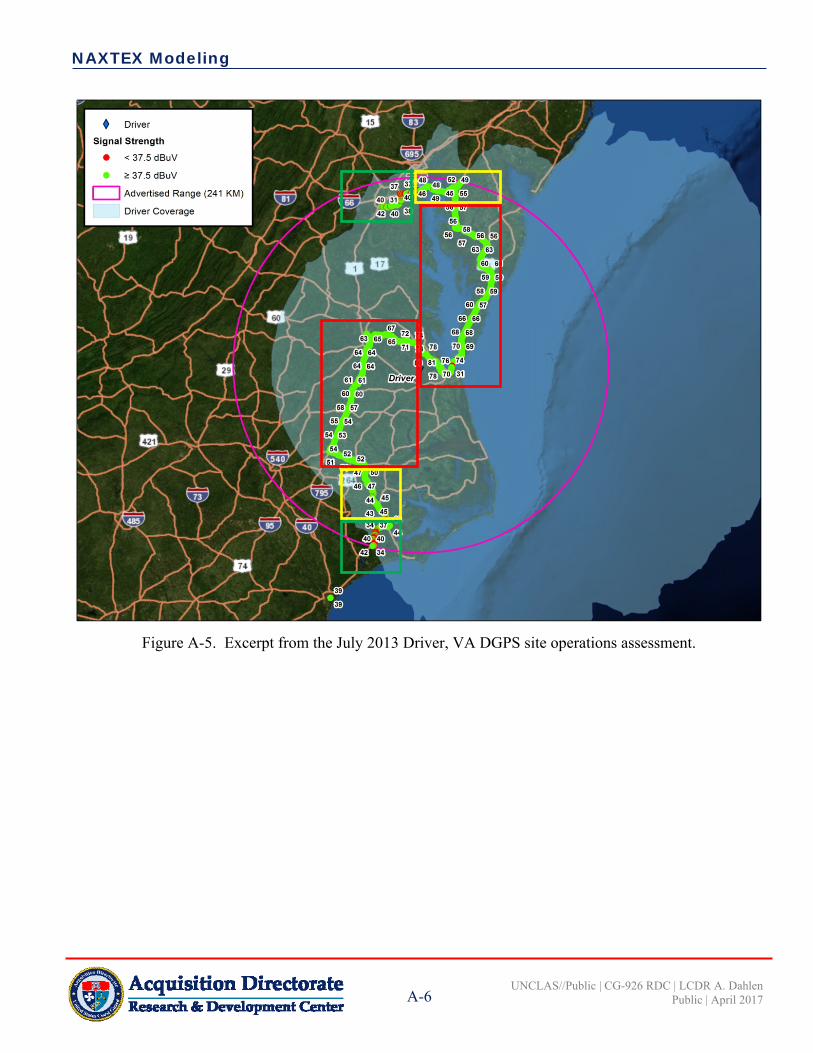
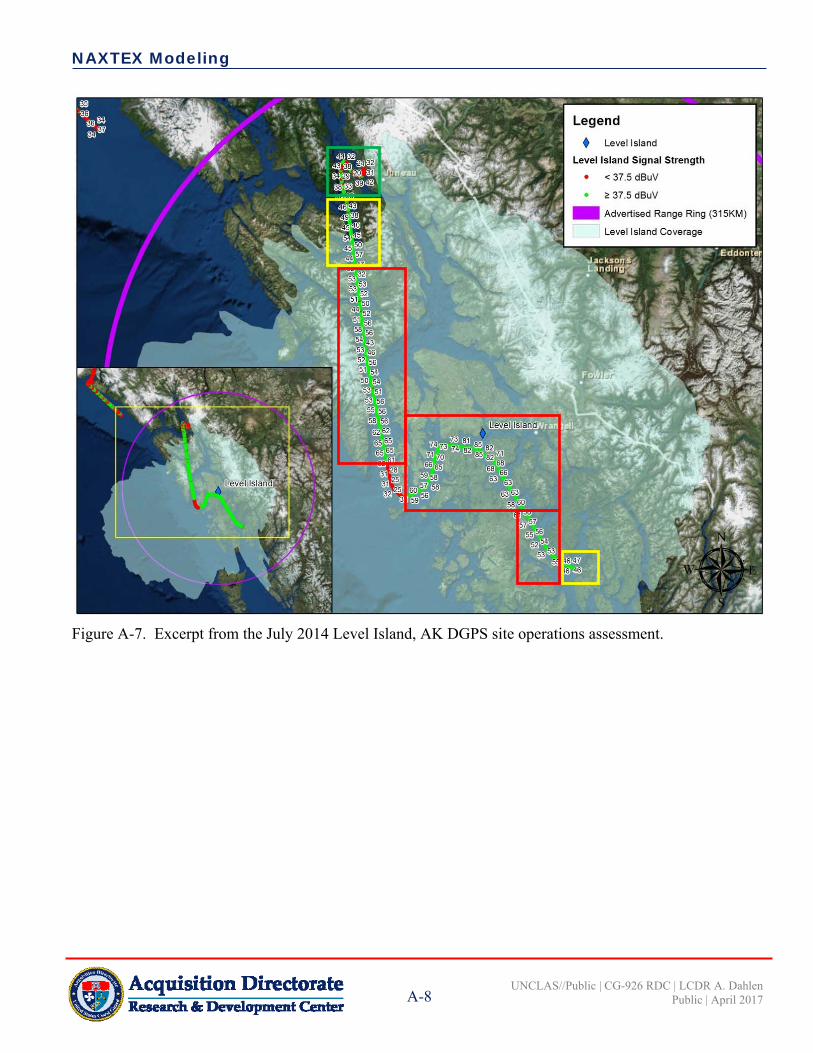
The pertinent DGPS information from the operational assessments is shown graphically in Figures A-1, A-3, A-5, and A-7. Here, the measured signal strength is shown in units of dBuV/m. Colored boxes were added to group the measured field strength using the same colors previously used in the main document’s Figures 1 through 3.
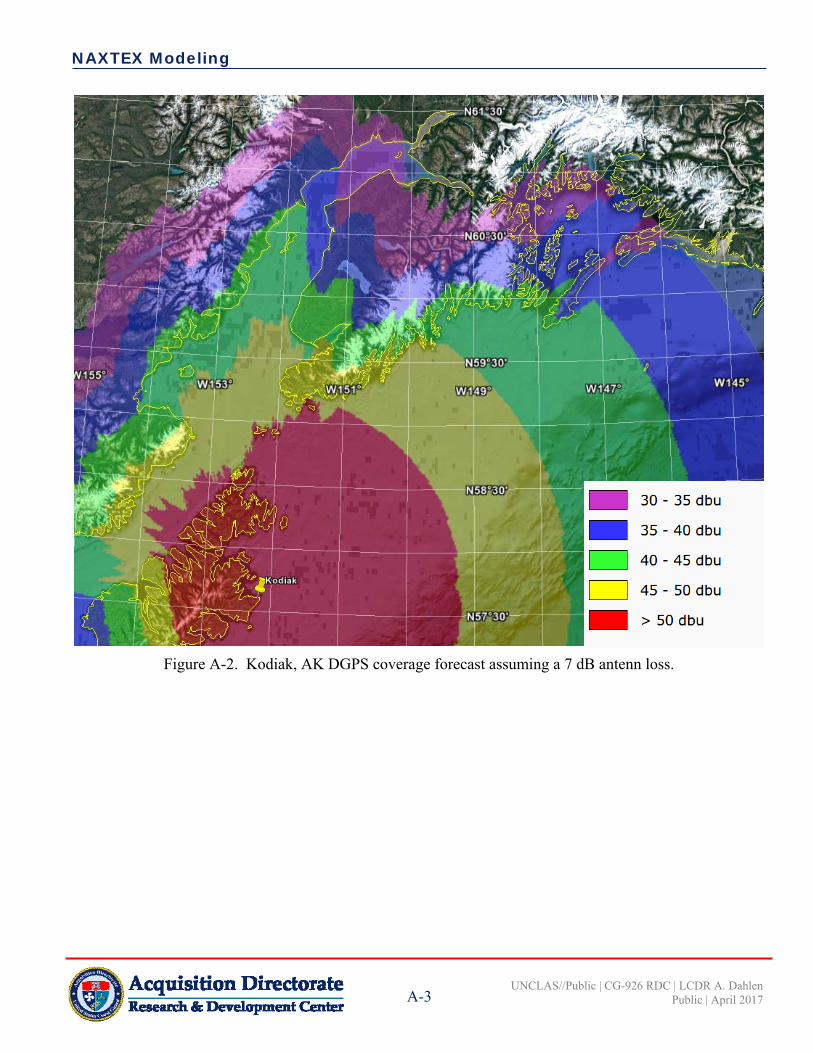
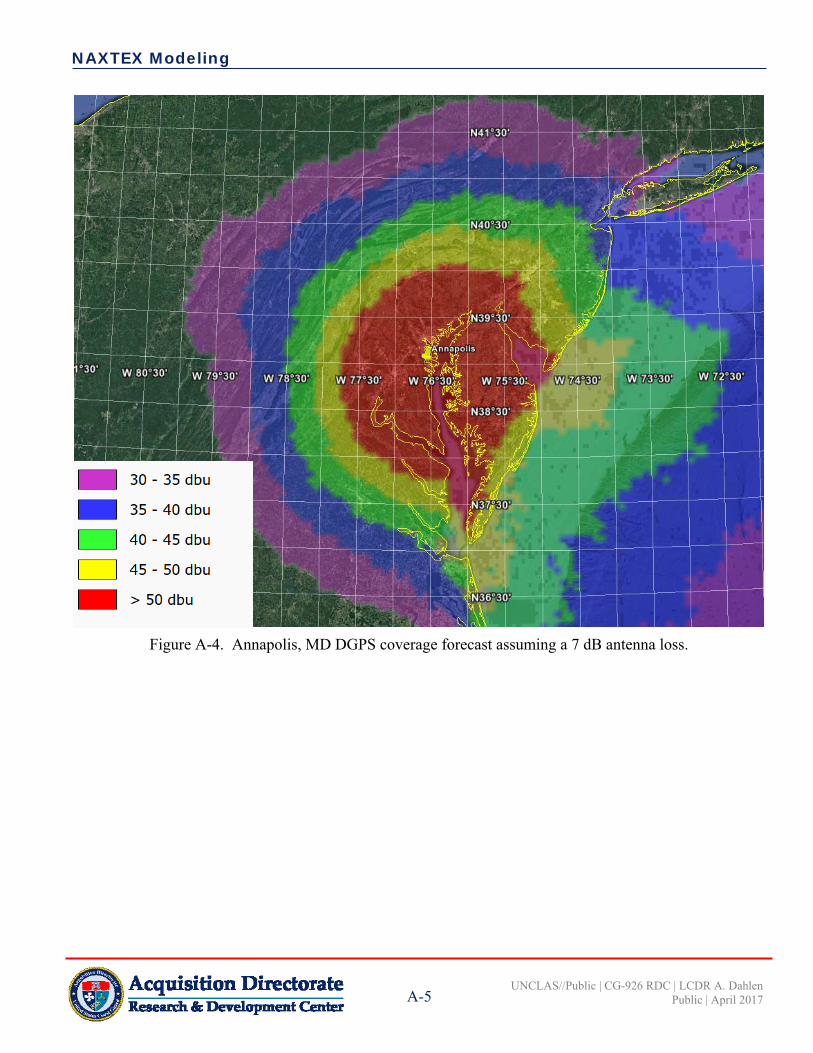
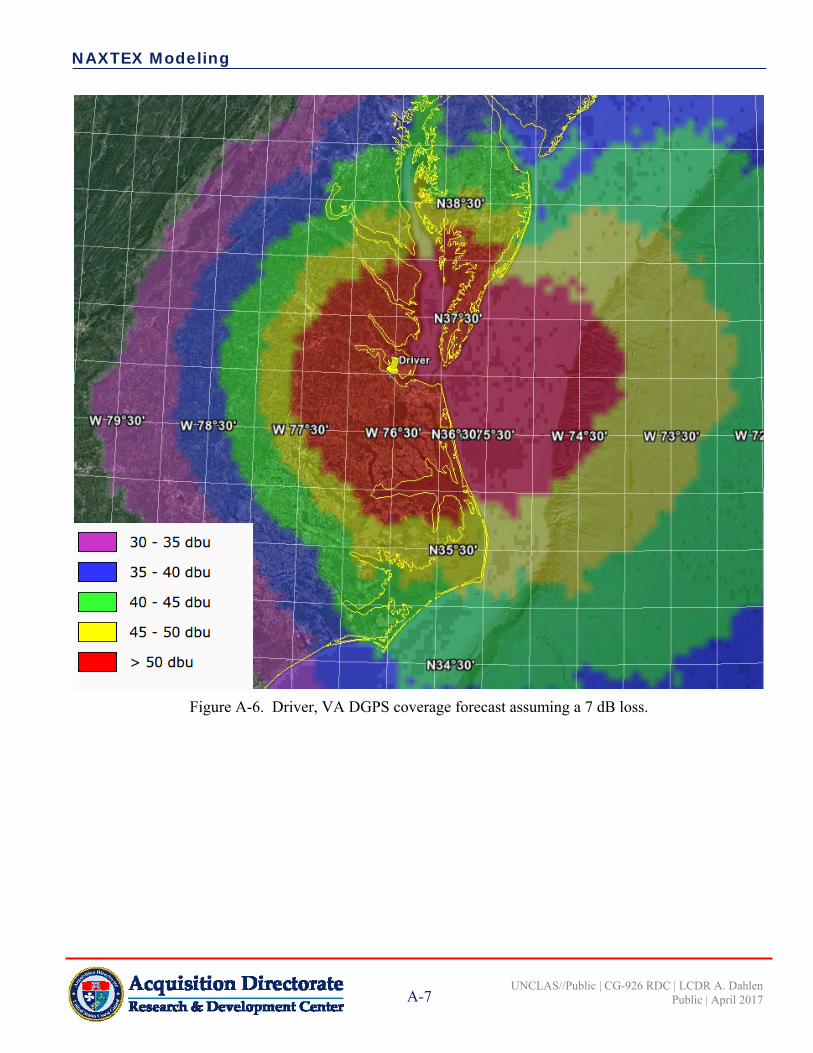
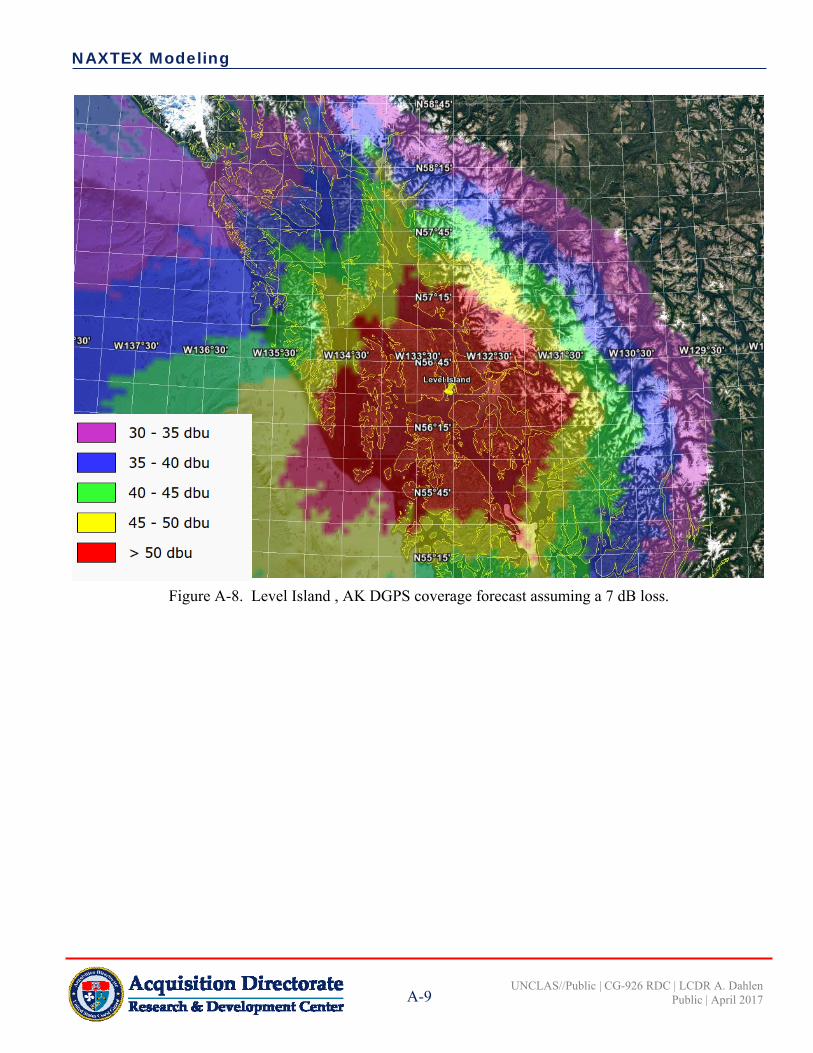
On the facing pages (Figure A-2, A-4, A-6, and A-8), the DGPS signal is modeled using a 7 dB loss. Here, the field strength is graduated in 5 dBuV/m increments with rainbow-colored bands for easy viewing. This allows the forecast to be compared with the actual DGPS measurements.
It took several iterations for RDC to select 7 dB to represent the antenna loss. Overall, this is a good fit for the four chosen stations. Unfortunately, it did not fit all stations. For example, the Appleton, WA DGPS site appears to have significantly less power than the 2000 W stated in the 13 Jul 2015 operational assessment.
Additional work is recommended to refine this 7 db loss estimation. Calibrated equipment designed for NAVTEX reception should be used. Also, measurements should be performed on the different types of NAVTEX antennas, preferably in the end user area (open-ocean).
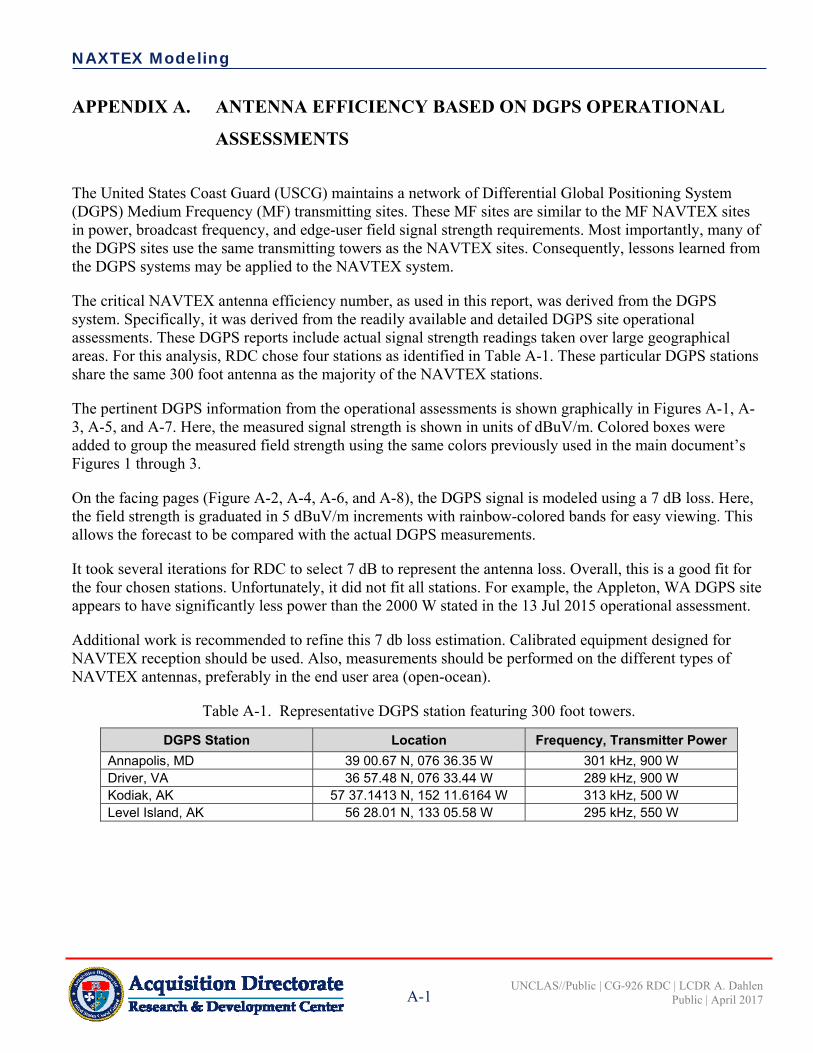
Table A-1. Representative DGPS station featuring 300 foot towers.
DGPS Station Location Frequency, Transmitter Power
Annapolis, MD 39 00.67 N, 076 36.35 W 301 kHz, 900 W Driver, VA 36 57.48 N, 076 33.44 W 289 kHz, 900 W Kodiak, AK 57 37.1413 N, 152 11.6164 W 313 kHz, 500 W Level Island, AK 56 28.01 N, 133 05.58 W 295 kHz, 550 W
NAXTEX Modeling
A-2 UNCLAS//Public | CG-926 RDC | LCDR A. Dahlen
Public | April 2017
Figure A-1. Excerpt from the July 2014 Kodiak, AK GPS (DGPS) site operations assessment.
NAXTEX Modeling
A-3 UNCLAS//Public | CG-926 RDC | LCDR A. Dahlen
Public | April 2017
Figure A-2. Kodiak, AK DGPS coverage forecast assuming a 7 dB antenn loss.
NAXTEX Modeling
A-4 UNCLAS//Public | CG-926 RDC | LCDR A. Dahlen
Public | April 2017
Figure A-3. Excerpt from the March 2015 Annapolis, MD DGPS site operations assessment.
NAXTEX Modeling
A-5 UNCLAS//Public | CG-926 RDC | LCDR A. Dahlen
Public | April 2017
Figure A-4. Annapolis, MD DGPS coverage forecast assuming a 7 dB antenna loss.
NAXTEX Modeling
A-6 UNCLAS//Public | CG-926 RDC | LCDR A. Dahlen
Public | April 2017
Figure A-5. Excerpt from the July 2013 Driver, VA DGPS site operations assessment.
NAXTEX Modeling
A-7 UNCLAS//Public | CG-926 RDC | LCDR A. Dahlen
Public | April 2017
Figure A-6. Driver, VA DGPS coverage forecast assuming a 7 dB loss.
NAXTEX Modeling
A-8 UNCLAS//Public | CG-926 RDC | LCDR A. Dahlen
Public | April 2017
Figure A-7. Excerpt from the July 2014 Level Island, AK DGPS site operations assessment.
NAXTEX Modeling
A-9 UNCLAS//Public | CG-926 RDC | LCDR A. Dahlen
Public | April 2017
Figure A-8. Level Island , AK DGPS coverage forecast assuming a 7 dB loss.
NAXTEX Modeling
A-10 UNCLAS//Public | CG-926 RDC | LCDR A. Dahlen
Public | April 2017
(This page intentionally left blank.)