Embed Size (px)
Citation preview
NBER WORKING PAPER SERIES
BUSINESS CYCLES AND GROWTH:SOME REFLECTIONS AND MEASURES
Victor Zarnowitz
Working Paper No. 665
NATIONAL BUREAU OF ECONOMIC RESEARCH1050 Massachusetts Avenue
Cambridge MA 02138
April 1981
This paper is part of the NBER's research program in EconomicFluctuations. Financial support from the National ScienceFoundation and aid of the Graduate School of Business of theUniversity of Chicago and NBER are gratefully acknowledged. Anyopinions expressed are those of the author and not those of theNational Bureau of Economic Research.
NBER Working Paper II 665April 1981
Business eycles and Growth: Some Reflections and Measures
ABSTRACT
No simple and stable relationship can be expected to exist between long
term economic growth and cyclical variability; they interact and depend on
various factors, partly common and partly different. However, measures re
lating to the annual growth rates in real GNP since 1882 suggest that growth
was generally higher during those multi-cycle periods when stability was
greater.
The mildness of economic fluctuations in the 1950's and 1960's led to an
international revival of interest in growth cycles, i.e., cyclical movements
in trend-adjusted indicators. Measures of several important aspects of growth
cycles, such as duration of phases and timing of the indicators, show much
greater symmetry and more uniformity than their counterparts for business cycles.
For several of the recent growth cycles, the degree of international diffusion
is high.
The expansions and contractions of the early business cycles in the NBER
chronology tend to be of nearly equal length, much like the phases of growth
cycles and very unlike those of the more recent business cycles. However, the
identification of these movements relied to a considerable extent on business
annals and trend-adjusted indexes of business conditions, which information
is not capable of efficient ftiscrimination between mild declines and pronounced
retardations in economic activity. A re-examination of the evidence and lit
erature indicates that some of the episodes in the 150 years of U.S. economic
history may represent phases of below-average growth rather than genuine con
tractions. If this were the case, even only in the few most doubtful instances
which are limited to the 19th century, it would imply an underestimation of
"expansions relative to contractions in the cycles of the first half of the
chronology. The contrast between the early and the recent cycle, however,
would only be reduced, not eliminated.
Victor ZarnowitzGraduate School of BusinessThe University of ChicagoChicago, Illinois 60637
(312) 753-3615
BUSINESS CYCLES AND GROWTH:
Some Reflections and Measures
I
Is the long-term trend of the economy -- growth ~- substantially in-.
fluenced by the short-term movements -- business cycles and, if so, how?
Are business cycles subject to major secular changes? Are these fluctua-
tions the natural way growth takes in private enterprise economies or are
they mainly due to some outside shocks that could be avoided or reduced?
Should their analysis be based on trend-unadjusted or on trend-adjusted
time series data?
These are major questions that have received considerable attention in
economic literature, but they are difficult and still debated. I cannot
hope to resolve any of them in this paper, of course, but I shall attempt
to contr~bute to the discussion of some aspects of how business cycles and
growth are related.
The subject seems highly suitable for a volume commemorating my esteemed
teacher, Erich Preiser, who throughout his life devoted much fruitful effort
to the study of business cycles and economic growth. ,Preiser stressed the
activities of saving and investment or, to use one overall concept, the
p~cess of capital accumulation, as central to the understanding of both the
1lcmg trend and the short fluctuations of the economy. However, while thus
1 . , '.. " ..••Preiser's fi.rst book, Grundzuge der Konjunkturtheorie, Tiibingen, 1933,
contains a characteristically concise and lucid analysis of that process. Seealso "Zur nichtmonetaren Uberinvestitionstheorie," Kyklos 5 (1951), pp. 96-98.For other essays by Preiser dealing with growth, business cycles, and theirinterface, see NationalSkonomie Heute, Munchen, 1959, and Bildung und Verteilungdes VolkseinkODDnens, 2, Aufl., GOttingen, 1961.
-2-
perceiving an important linkage between the two sets of phenomena, he viewed
them as at least empirically separable. This can be seen in the following
quotation, which accepts the measurement of business cycles as fluctuations
around the long-term trend; For "the trade cycle policy maker of the old
school there were upswings and downswings, peaks and troughs, and the sta-
tistician measured the amplitude of fluctuations as the distance from a hor-
izontal datum line. Nowadays the very terminology makes it clear that the
trade cycle is regarded as the motion pattern of a growing economy.,,2
It is generally agreed that the process of long-term economic growth is
"real" in nature; driven by increases in the quantity and productivity of
human and physical resources (capital in the most· general sense) and measured
by the advances in output and wealth per capita. Business cycle theories,
on the other hand, disagree on the relative roles of real and monetary fac-
tors. Those who emphasize the latter (changes in money supply, bank reserves
and credits, the price level and interest rates) have logically good reasons
to assert that secular growth is not much affected by short-run fluctuations
in nominal demand. Hence, they raise no objections in principle to the idea
that trends and cycles are separable.
In practice, this conception leads to the measurement and analysis of
"growth cycles" - movements in aggregate economic activity defined by the
consensus of fluctuations in comprehensive indicators adjusted for their
~ODg-term trends. As Preiser's statement, cited above, reminds us, this
~ew of business cycles as movements in the deviations from trend has a long
2 Erich Preiser, "Economic Growth as a Fetish and a Necessity," GermanEconomic Review, 1967, no. 4. This is a translation .of his last public lecturegiven in Pforzheim on April 24, 1967 and published in WirtschaftspolitikHeute, MUnchen, 1967.
-3-
history. However, the approach did not escape considerable difficulties and
criticism in the past. Recently, growth cycles have come to enjoy a new
popularity. This paper looks at this development from a historical perspec-
tive and examines its sources and chances to endure.
II
The trend-cycle interactions are varied and in part subtle. Measures
of secular growth are most meaningful for the longest periods over which
some reasonable, stable trend fits the data well, and they must be calculated
to avoid cyclical bias. For example, measuring the trend from a business
cycle trough year to a peak year results in overestimation of the average
growth rate; from a peak to a trough year, in underestimation. The selected
initial and terminal years should therefore be in the same cyclical phase
or have similar cyclical characteristics, e.g., about the same unemployment
or capacity utilization rates. This severely restricts the range of appro
3priate comparisons.
Over long intervals measured in decades, t:rends dominate the business
cycle, so here the cyclical bias, though often nonnegligible, matters less.
3 .See u.S. Department of COIIIIIlerce, Bureau of the Census, Long Term Econom.ic
Growth 1860-1965, Washington, D.C., October 1966. This publication (part V)presents real GNP growth rates for all possible combinations of initial andterminal years between 1890 and 1964 (the unemployment-rate estimates are notavailable before 1890). This amounts to 2,850 calculated growth rates forU.S. output. Out of these, only 360 (13%) refer to periods for which theunemployment rates (u) differ by less than 0.025 percentage point~ per year(i.e., lUI - uTI/n < 0.025, where the subscripts denote the initial and ter-
minal years and n is the number of years covered). For a more relaxed definition of "similar" u rates (difference of less than 0.1 point/year), thenumber of periods is 993 (34%). The number of all periods bound by businesscycle peak years between 1890 and 1964 is 190, out of which 36 (19%) wouldrefer to similar unemployment rates on the first definition and 101 (53%)on the second.
-4-
Growth has been historically pervasive and persistent in the modern era, as
illustrated by the following facts: Nearly every business expansion in the
United States has carried total output and employment beyond the levels reached
at the peak of the preceding cycle. 4 The recoveries in these variables have
usually been faster after severe depressions than after mild declines (des-
pite this, however, the recovery to the previous peak level has as a rule
5taken longer when the preceding contraction had been severe).
Over short intervals measured in years, the business. cycle effects are
typically preponderant. Therefore serious errors are likely to result from the
(unfortunately frequent) practice of evaluating and projecting growth rates
on the basis of comparisons between arbitrary short unit periods that are
relatively close to each other in time. 6
The cyclical movements vary greatly in amplitude and duration. Severe
depressions such as those of 1873-79, 1893-97 (interrupted only by a brief
and incomplete recovery in 1894-95), 1907-08, 1920-21, 1929-33, and 1937-38
4 .The one conspicuous exception is the expansion of 1933-37, which fol-
lowed the Great Contraction of 1929-33. Although among the longest and largest on record, it started from an unprecedentedly low level and was incompletein the sense that even at its end unemployment was very high and per capitaoutput lower than at the preceding peak.
5 For an interpretation of these findings and evidence, see Geoffrey H.Hoore, "Leading and Confirming Indicators of General Business Changes," inG.B. MOore, editor, Business Cycle Indicators, National Bureau-of EconomicResearch (NBER), New York,1961, volume I, Chapter 3, esp. pp. 86-109.
6 ... .. The minimum distance should logically be at least one complete business
cycle (measured from peak to peak, trough to trough, or between centered cycle.eraaea). ht bU8ineaa cycles .aryareatly in duration and -.ny are relativelyabort .C.eetext below).
-5-
reduced growth strongly for some considerable time. Vigorous expansions
such as those of 1879-82, 1897-99, 1908-10, 1921-23, 1938-45, 1949-53, and
1961-69 (the last three in wartime periods) raised the growth rates corres-
ponding1y. However, no less than thirty-three complete business cycles
occurred in the United States between 1834 and 1975, and most of them have
been mild. Short cycles make up a larger majority yet. Only nine of the
expansions have lasted longer than three years, and five of these were asso-
ciated with major wars; about half (17) lasted two years or less. Contrac-
tions have been typically shorter than expansions: twenty-five (85%) did not
exceed two years and eleven (33%) did not exceed one year. It is a histor-
ica1 fact that few peacetime cycles resulted in major disruptions of the
secular growth trend of U.S. economy.
This does not mean at all, however, that growth has been uniform or that
no connection exists between cyclical variability and growth. In a century
of U.S. progress, it is possible to identify several periods characterized
by relatively high economic stability and several others during which sta-
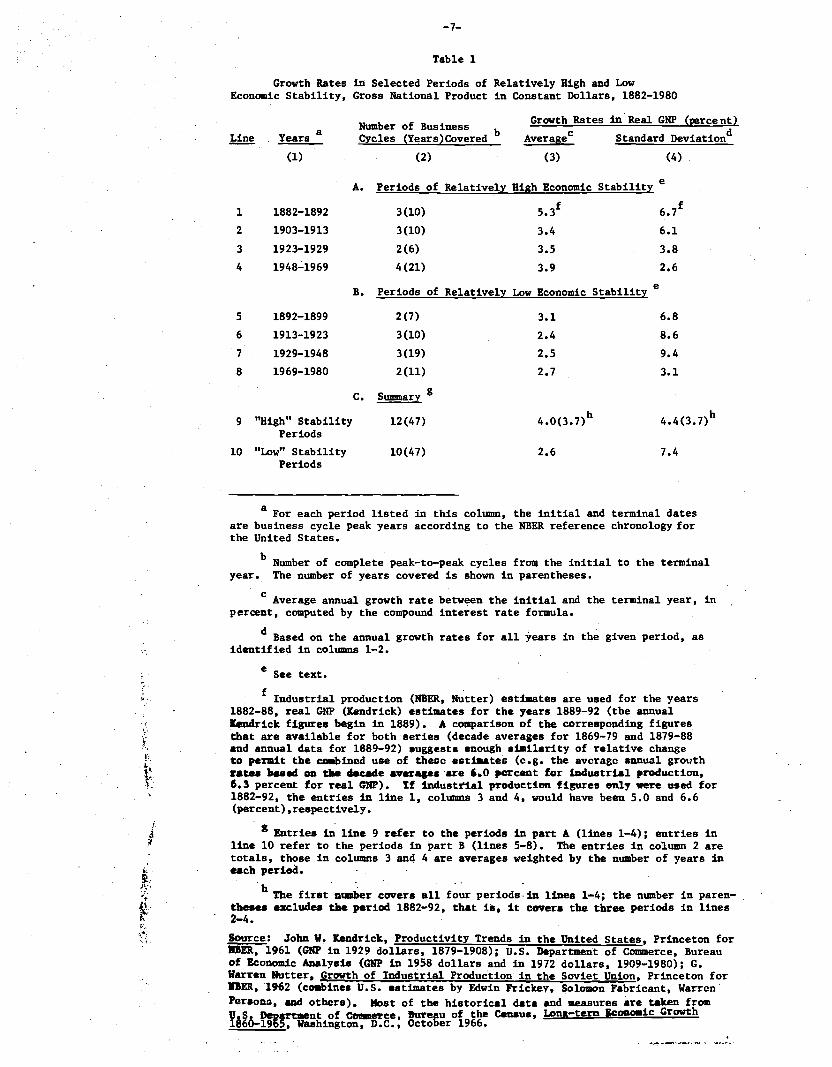
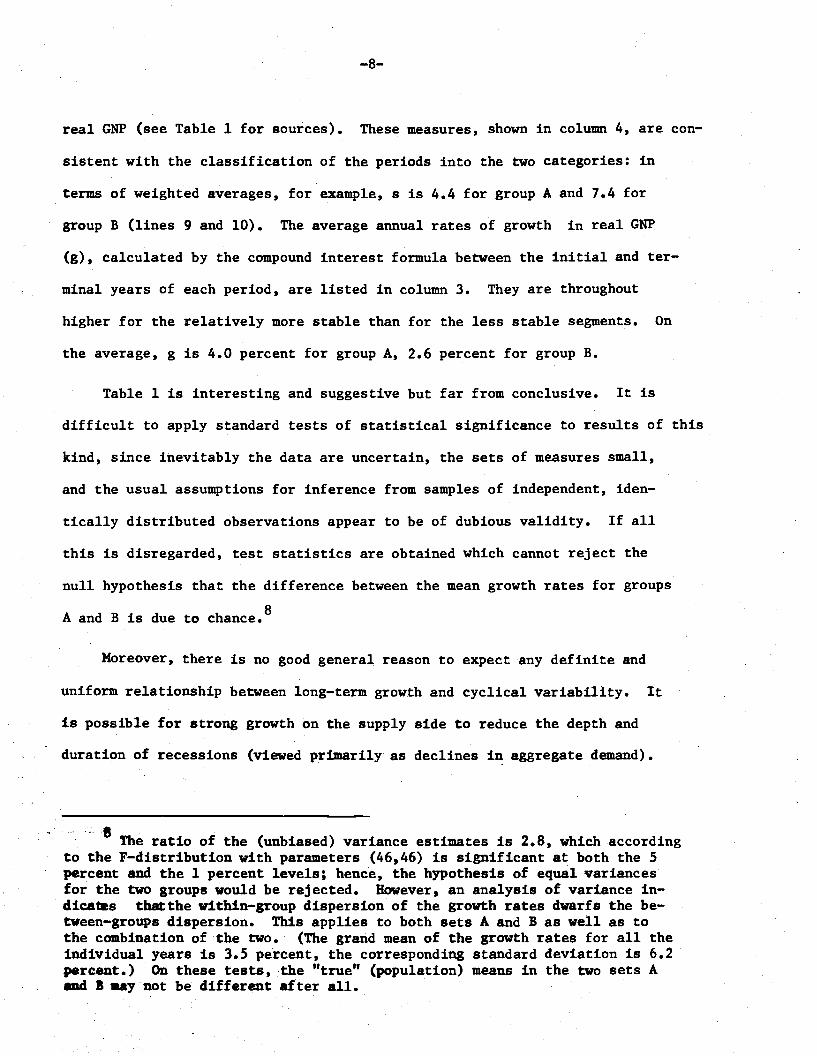
bi1ity was comparatively low. Table 1 shows that the average annual rates
of growth in the economy's output (or real income) were generally higher
in the former than in the latter segments.
The selection of the periods in both categories was guided by close
inspection of charts for the available long time series on aggregate economic
activity as well as by accounts in the literature on economic trends and
fluctuations. 7 Each of the chosen segments comprises a number of complete
7 Milton Friedman and Anna J. Schwartz, A Monetary History of the UnitedStates, 1867-1960, Princeton for NBER, 1963, p. 677, write: '~e have characterized four segments of the 93 years as displaying a relatively high degreeof economic stability: 1882-92, 1903-13, 1923-2~ 1948-60. Each has also
-6-
business cycles measured from peak to peak (three contain 2 cycles each, four
3 cycles, and one 4 cycles). The four periods of "high" stability add up to
47 years, and so do the four periods of "low" stability (Table 1, column 2).
Taken together, the comparisons refer to 94 years out of the total of 98
. years covered (1882-1980). The data are most trustworthy for the 35 years
after World War II, least trustworthy for the 32 years before World War I.
It is noteworthy that the effects of large business contractions out-
weigh those of major wartime expansions in two periods, 1913-23 and 1929-48.
These segments belong to the low stability, low-growth group B (lines 6 and
7). The 1948-69 period, which includes the Korean War and most of the Vietnam
War, is classified in the high stability, high growth group A (line 4). The
years 1969-80 witnessed the winding up of the Vietnam War and inherited little
of its expansionary but most of its delayed inflationary effects. This period
belongs in group B (line 8). Contemporaries have little doubt about the
. much discussed contrast between the turbulent 1970's, dominated by seemingly
uncontrollable inflation, recessions, and energy·problems, and the economically
much more placid and prosperous decades of the 1950's and 1960's.
After the selection of the periods, standard deviations (s) of the annual
growth rates within each of them were computed from historical statistics on
displayed a high degree of stability of the year-to-year change in the stock. of money; the remaining periods have shown appreciably greater instabilityof theyear-to-year change in both money and income." Table 1 uses the firstthree periods unchanged but eXtends the last one to 1948-69, to include thelong expansion of the 1960's. My choice of the relatively unstable periodsalso agrees broadly with several characterizations by Friedman and Schwartzwho refer to "the disturbed years from 1891 to 1897" (p. 104) and "the yearsof economic· turmoil" 1914-21 (p. 189). The 1930's, of course, witnessed themost severe contraction of modern times in 1929-33,· then" an "erratic anduneven"revival and another "unusually deep" contraction 1937-38, which "proceeded at anextr~ely rapid rate" (p. 493). The large changes in the yearsof World War II and its immediate aftermath were due to the preparation forand conduct of wartime activities, inflation, and finally demobilizationaccompanied by a recession.
-7-
Table 1
Number of Business bCycles (Years)CoveredYears a
Growth Rates in Selected Periods of Relatively High and LowEconomic Stability, Gross National Product in Constant Dollars, 1882-1980
Growth Rates in'Real GNP (Eercent)
AverageC Standard Deviationd
(1) (2) (3) (4)
A. Periods of Relatively High Economic Stability e
1 1882-1892 3(10) 5.3f 6.7f
2 1903-1913 3(10) 3.4 6.1
3 1923-1929 2(6) 3.5 3.8
4 1948-1969 4(21) 3.9 2.6
B. Periods of Relatively Low Economic Stability e
5 1892-1899 2(7) 3.1 6.8
6 1913-1923 3(10) 2.4 8.6
7 1929-1948 3(19) 2.5 9.4
8 1969-1980 2(11) 2.7 3.1
C. Summary g
"High" Stability 12(47) h h9 4.0(3.7) 4.4(3.7)
Periods
10 "Low" Stability 10(47) 2.6 7.4Periods
a For each period listed in this column, the initial and terminal datesare business cycle peak years according to the NBER reference Chronology forthe United States.
b Number of complete peak-to-peak cycles fro~ the initial to the terminalyear. The number of years covered is shown in parentheses.
c Average annual growth rate between the initial and the terminal year, inpercent, computed by the compound interest rate formula.
d Based on the annual growth rates for all years in the given period, asidentified in columns 1-2.
J
e See text.
f Industrial production (RBER, Nutter) estimates are used for the years1882-88, real GNP (Kendrick) estimates for the years 1889-92 (the annualKeDdrick figures begin in 1889). It cOllParison of the corresponding figuresthat are available for both'series (decade averages for 1869-79 and 1879-88and annual data for 1889-92) suggests enough st.ilarity of relative changeto permit the coabincd use of theoc e.tiaates (e.g. the averagc annual grouth~.tea J.ued OIl tile dacUe ••erqa.are '.0 perceot for 1Dclustrial prodl&Ction,6.3 percent for real CNI'). If industrial pTodueden fisures mtl, were used for1882-92, the entries in line I, columns 3 and 4, would have been 5.0 and 6.6(percent) ,respectively.
gEntries h line 9 refer to the periods in part A (lines 1-4); entries inline 10 refer to the periods in part B (lines 5-8). The entries in column 2 aretotals, those in columns 3 and 4 are averages weighted by the number of years ineach period.
h .The first nUlllber covers all four periods, in lines 1-4; the number in paren
tbee_ excludes the period 1882-92, that iii. it covers the three periods in lines2-4.
!2!!!:5!.: John W. Kendrick. Productivity Trends in the United States. Princeton forBIER, 1961 (GNP in 1929 dollars, 1879-1908); U.S. Department of Commerce, Bureauof Economic Analysis (GNP in 1958 dollars and in 1972 dollars, 1909-1980); G.Warren Hutter. Growth of Industrial Production in the Soviet Union, Princeton forHER. '1962 (cc.bines U.S. estimates by Edwin Frickev, Solomon Fabricant, Warrcn'PersolUl. ADd others). Most of the historical data and aeaoures are taken fromUJ,S. o."lI1"t1IIent of CCII!IIIIftce, Burellu of the C-U8, Long-tern Be_Ollie Growthle6o-l965, Washington, D.C., October 1966.
-8-
real GNP (see Table 1 for sources). These measures, shown in column 4, are con-
sistent with the classification of the periods into the two categories: in
terms of weighted averages, for example, s is 4.4 for group A and 7.4 for
group B (lines 9 and 10). The average annual rates of growth in real GNP
(g), calculated by the compound interest formula between the initial and ter-
mina1 years of each period, are listed in column 3. They are throughout
higher for the relatively more stable than for the less stable segments. On
the average, g is 4.0 percent for group A, 2.6 percent for group B.
Table 1 is interesting and suggestive but far from conclusive. It is
difficult to apply standard tests of statistical significance to results of this
kind, since inevitably the data are uncertain, the sets of measures small,
and the usual assumptions for inference from samples of independent, iden-
tica11y distributed observations appear to be of dubious validity. If all
this is disregarded, test statistics are obtained which cannot reject the
null hypothesis that the difference between the mean growth rates for groups
A and B is due to chance. 8
Moreover, there is no good general reason to expect any definite and
uniform relationship between long-term growth and cyclical variability. It
is possible for strong growth on the supply side to reduce the depth and
duration of recessions (viewed primarily as declines i~ aggregate demand).
····8 .. The ratio of the (unbiased) variance estimates is 2.8, which according
to the F-distribution with parameters (46,46) is significant at both the 5percent and the 1 percent levels; hence, the hypothesis of equal variancesfor the two groups would be rejected. However, an analysis of variance indicatas that the within-group dispersion of the growth rates dwarfs the between-groups dispersion. This applies to both sets A and B as well as tothe combination of the two. (The grand mean of the growth rates for all theindividual years is 3.5 percent, the corresponding standard deviation is 6.2percent.) On these tests, the "true" (population) means in the two sets AaDd B ..ynot be different after all.
-9-
But the opposite causal chain is no less plausible, that is, a more stable
expansion of demand may generate more rapid growth. Strong recur~ent spurts
in demand (caused, e.g., by monetary accelerations) or in supply (caused,
e.g., by uneven flows of technological innovation and business investment)
can result in both more instability and more growth. Pronounced business
cycles have certainly been a feature of many nations in the stage of rapid
industrialization, while backward countries stagnated with relatively little
economic instability but also little economic growth. In sum, one cannot
help being agnostic here: different arguments and models can be made readily
but there are few solid generalizations.
Still, one important proposition finds considerable support in experience
as well as theory, namely that both protracted high unemployment and pro
tracted high inflation impede growth. Underutilization of productive capac
ities tends to reduce investment and tilt downward the potential (full employ
ment) output curve. Uneven and largely unanticipated inflation (the usual
type) impairs the signaling function of relative prices and acts as a bad
tax, distorting resource al~ocation, hindering saving and productive invest
ment, and fostering speculative activities.
III
In periods of substantial stability and satisfactory growth, the always
attractive idea that the business cycle may have been conquered or rendered
obsolete gains considerable publicity and acceptance. This often reflects
a high confidence in government institutions and actions. In the 1920's,
it was the Federal Reserve monetary policies that many hoped would maintain
prosperity. In the 1960's, it was the tax cuts and fiscal fine tuning generally.
-10-
Unfortunately, the "return" of the business cycle has repeatedly proved such
ideas to be pipe dreams or at least quite premature.
In the quarter-century after World War II, however, business cycles
have indeed been mild by historical standards. In Western Europe and Japan,
sustained declines in the levels of output, employment, and real income and
spending occurred only sporadically. Instead, alternations of above-average
and below-average growth in these indicators of aggregate economic activity
were,observed recurrently, and the involved slowdowns soon came to be treated
much as the mild recessions, partly because they had similar adverse effects
on business and labor-market conditions and partly because of heightened
public sensitivity to any lapse from the high-growth path that lasted iong
enough to be widely recognized and decried.
The ~in reason for the apparent temporary suspension in these countries
of the "classical" business cycle was clearly the extraordinary outburst of
rapid growth from the nadir of the enormous destruction and deprivation of
the mid-1940's. The economic legacy of World War II was here not only de
vastation of industry but also huge backlogs of unuti1ized, highly skilled
resources and unsatisfied demand. Once reasonably sound currencies and free
markets were restored, and international trade and capital flows revitalized,
an era of great reconstruction, new investment and technological progress
set in to last a generation. As long as this favorable climate lasted, employ
~nt and output had steep upward trends and cyclical setbacks assumed the form
of retardations of growth rather than absolute declines. Thus it was not
until 1966-67 that ~st Germany experienced its first post-war recession
with an actual decline (which was still quite moderate) in real GNP, indus
trial production, and related measures of overall economic activity.
-11-
In the United States and Canada, there was no wartime destruction, hence
no stimulus of domestic reconstruction, but the backlog of demand after the
war shortages was massive and the incentives and resources for rapid growth
were on hand, too. The widely expected postwar depression never material-
ized. The worldwide expansion of industry and trade obviously benefitted
the North American countries greatly. It is generally recognized that four
business contractions as defined traditionally by the National Bureau (i.e.,
cumulative and widely diffused declines in activity) have occurred in the
United States between 1948 and 1961, but all of them were mild. Then came
the long economic expansion in the 1960's, which persisted beyond the expec-
tations of most economists, although not without being modified by two mild
slowdowns and presumably prolonged, first by a major tax reduction and later
by the intensification of the war in Vietnam. At this point, the substantial
moderation of the U.S. business cycle when compared with the pre-World War II
patterns became quite apparent, and the important question was what accounts
9for that change and how lasting it would be.
Of the domestic factors, one that is well documented and most probably
important is the shift in the industrial composition of employment from cycli-
cally highly sensitive sectors such as manufacturing, mining, and construction
9 To some, the events suggested that the business cycle in its traditional sense was, if not dead, too mild and sporadic to merit much interest. There was also rising interest in the "political cycle" -- theoriesof how errors in macroeconomic stabilization policies or election-year polities ean generate eyelieal instability. But these interpretations did nott~rn out to have much long-term significance. See Eric L11Ddberg, Instability
"and Economic Growth, Yale, New Haven and London, 1968; Martin Bronfenbrenner,ed., Is the Business Cycle Obsolete?, Wiley-Interscience, New York, 1969;Victor Zarnowitz, "The Business Cycle Today: An Introduction" in Zarnowitz,ed., The Business Cycle Today, lIBER, Hew York, 1972.
/
-12-
to relatively recession-proof sectors such as trade, services, and finance. lO
Before the onset of the Great Inflation of the 1970's, most of the explana-
tions of the relative shortness and mildness of recent recessions have also
given much credit to institutional changes, notably the "built-in stabilizers"
and bank 'deposit insurance. Discretionary fiscal and monetary policies had a
11mixed record but not without some relative successes.
The loose term "stagflation" often used to describe the developments since
about 1969 evokes the image of a slow-~oving economy with sharply rising prices
but this is not exactly accurate. The cyclical fluctuations in this decade
were relatively frequent and sharp, not only in real activity, but also in
the rate of inflation. The recessions became international in scope and more
severe, but they were still short, even including the one in 1974-1975, by
historical comparisons. However, the average growth rates did decline con-
siderably and tendencies developed for both inflation and unemployment to
drift upward (apart from their shorter cyclical movements). It was increas-
ingly recognized that the expansion of the government's share and role in
the economy has destabiliz~ng and growth-inhibiting effects. Macroeconomic
policies in this period oscillated between attempts to combat inflation and
attempts to combat unemployment, with poor Uming and for the most part indif-
ferent or perverse results.
The decrease in the frequency, duration, and amplitude of business reces-
sions has been accompanied by other changes such as a reduction in the sensi-
10 Geoffrey H. Moore, 'tsome Secular Changes in Business Cycles,'" chapter 4in Business Cycles, Inflation, and For~sting, Ballinger for NBER, Cambridge,Massachusetts, 1980; Victor zarnowitz and Geoffrey H. Moore, '7he Recessionand Recovery of 1973-1976," Explorations in Economic Research, Vol. 4, no. 4(Fall 1977).
11 For further discussion and references, see Zarnowitz in The BusinessCycle Today, as cited.
-13-
tivity of industrial prices to declines in final demand and an increase in
12the cyclical responsiveness of interest rates. That business cycles have
changed significantly in various respects since the cataclysms of 1929-45 is
hardly surprising when one considers the nature and scope of the concurrent
changes in the economies, societies, and political systems involved. The
changes in the cyclical behavior have been labeled "secular", but here caution
is indicated if the term is meant to convey irreversible alterations or trends
that can be projected. There is much evidence of, and good economic reasons
for, the long-term shift in the composition of employment, from goods-producing
to service-producing industries, but it is not impossible to envisage technolog-
ical change and organized efforts that would halt and even reverse that shift.
Drastically different economic policies could alter the cyclical sensitivity
of prices and interest rates.
In this respect, it is interesting to note that studies of business cycles
in the pre-World War II era have not been able to document any strong secular
or discontinuous changes in cyclical behavior. 13 Many industries undergo sim~
ilar "life cycles" -- phases of initially slow, then rapid, and finally again
slow growth or possibly decay -- as they introduce new products and techniques
which flourish for some time but eventually· encounter increasingly effective
competition from newer and still better endowed industries. However, the
12 Phillip Cagan, "Changes in the Recession Behavior of Wholesale Pricesin the 1920's and Post-World War II," Explorations in Economic Research, vol. 2,no. l(Winter 1975); and Phillip Cagan, Changes in the Cyclical Behavior of Interest Rates, NBER, New York, 1966.
13 .See Arthur F. Bt.rns and Wesley C. Mitchell, Measuring Business Cycles,
DER, New York, 1946, Chapter 10, where several tests are reported to haveshown that the effects of secular changes on the following have been absent orslight: (1) the duration and amplitude of specific and business cycles; (2)business cycles and economic stages (Mills'hypothesis that the cycles tend toget shorter in the stage of rapid growth receives little support from the data);(3) business cycles before and after 1914.
-14-
economy comprises at any time all industries, at all their various life-cycle
stages, so the industry growth patterns "wash out" in the aggregation and the
14overall growth rates show no particular long-term evolution.
With regard to cyclical changes in cyclical behavior, that is, the exis-
tence and nature of any patterns of long fluctuations, the results are mixed and
in large part inconclusive. The Kondratieff swings of 50-60 years are hardly
general as posited, for they show up mainly in prices, not production, and con-
sist of too few episodes to be testable. Favorable evidence is cited for the
notion that business cycle expansions have tended to be longer and contractions
shorter during the upward phases of the long waves in prices than during the
15downward phases. However, history also shows that growth and deflation have
not been incompatible, e.g., over the decade 1869-79 as a whole, the price level
16declined strongly and almost continuously, wh~le real income rose greatly.
There is much more evidence in support of the "Kuznets cycles," usually of some
15 to 25 years' duration, which have been traced back at least to the first
half of the 19th century and are associated mainly with fluctuations in the
growth of population, labor-force, net immigration, building construction, and
14Indeed, none of the onee popular theories of unidirectional trends in
economic growth and instability such as Marx's projections of increasing pauperization and crises or Hansen's secular stagnation have been validated bytests of historical data.
15 See Burns and Mitchell, op.cit., pp. 431 - 440; also, Geoffrey H. Moore,"A Long-run Look at the Business,. Cycle, " in The Business Cycle and Public Policy,1929-80: A Compendium of Papers 'ubmitted to the Joint Economic Committee, Congressof the United States, Joint Committee Print, 96th Cong., 2nd Session, November28, 1980, Washington, U.S. Govt. Printing Office, 1980, pp. 31-32.
16 See rriedaan and Schwartz, op.cit., pp. 29-44.
-15-
17business formation. But these movements, too, are much less general than the
shorter business cycles, and much less is known about them.
In sum, the only types of movement that can be counted on to persist and
matter for the economy as a whole are still only the two that are plainly visi-
ble in the comprehensive measures of economic activity and performance -- the
long-term growth and the business cycle. Both vary over time but retain their
essential characteristics so that one can say about either that "plus eta change, plus
c'est la m~me chose." Some of the changes in trends and cycles are signifi-
cant and (at least partly and ex post) explainable but all elude any strict
categorization and prediction. All of this applies to any of the developed
economies with large private enterprise sectors, despite the many differences
among them.
IV
The period of post-World War II reconstruction and international expansion
of industry and trade may have been unique for the length of time during which
growth in so many countries persisted at rates so .high as to make business
recessions rare and mild. Under more ordinary circumstances, such periods
seem unlikely to last very long; and surely one lesson of recent history is
that attempts to perpetuate them by inflationary policies are both ill-advised
and ill-fated.
17 See A. F. Burns, Production Trends :en the United States aince 1870,NBER, New York, 1934; Simon Kuznets, Capital in the American Economy: Its Formation and Financing, Princeton for NBER, 1961; Moses Abramovitz, Evidences ofLong Swings in Aggregate ,Construction since the Civil War, NBER, New York, 1964;Richard A. Easterlin, Population. Labor Force, and Long Swings in Economic Growth,NBER, New York, 1968. .
-16-
It was not accidental that the interest in growth cycles increased greatly
on a world-wide scale as the good times with few recessions seemed to have no
end. The many resulting studies, covering several countries, started appearing
during the 1960's and continued into the next decade.18
However, the idea of growth cycles, far from being new, has a rather long
and interesting history. Methods of adjusting time series for seasonal varia-
tions and secular trends were applied early and frequently in statistical
studies of business cycles. They resulted in several widely used indexes of
general business conditions and trade for .the United States, Germany, and Great
Britain, all published between 1919 and 1925 in the form of seasonally adjusted
series of percentage deviations from estimated trend (sometimes called "normal")
19curves.
In his 1927 volume, Wesley Mitchell reviewed at length without basic dis-
agreement the contemporary statistical techniques of time series analysis and
d d " 20tren a Justment. He did raise several "particularly insistent" questions
18 .lIse Mintz, Dating Postwar Business Cycles: Methods and Their Application
to Western Germany, 1950-67, NBER, New York, 1969; Miyohei Shinohara, "PostwarBusiness Cycles in Japan," in Bronfenbrenner, ed., ·op.cit. (1969), p.76; R.C.O.Matthe"1s~ "Postwar Business Cycles in the United Kingdom, ibid., p.lOl; A.M.C.Waterman, "The Timing of Economic Fluctuations in Australia, January 1948 to.December 1964," Australian Economic Papers, June 1967; Sachverstandigenrat zurBegutachtung dergesamtwirtschaft1ichenEntwicklung, Alternativen aussenwirtschaftlicher Anpassung, Jahresgutachten 1968/69, p.lOO ff., Stuttgart -Mainz, 1968;Gunther J. Tichy, Indikatoren der osterreichischen Konjunktur 1950-1970, Osterreichisches Institut fur Wirtschaftsforschung, Wien, 1972, p.37 ff.; lIse Mintz,"~ating U.S. Growth Cycles," Explorations in Economic Research, vol.I, no.l, SUDDIler 1974.
U .. .The U.S. indexes include those constructed by Warren Persons of Harvard
University in 1919 and 1923; the statistical division of theAmerican Telephone and Telegraph Company in 1922; Carl Snyder of ~he FederalReserve Bank in New York in 1923 and 1924; and Edwin Fr~ey of Harvard in 1925.The work of Persons was particularly influential. Similar indexes were alsoprepared for Germany by E.W. Axe and H.M.Flinn in 1925, and for Great Britainby Dorothy Thomas in 1926.
20 Wesley C. Mitchell, Business Cycles: The Problem and Its Setting, NBER,New York, 1927, Chapter III, Section III,pp. 202-261; see also Section VI, pp.290-357, for ac~reheoaive ii.cua.ion of the indexes identified in the preceding footnote.
-17-
about the existence and direction of any causal relation between the trends
and the cyclical fluctuations, but only to note that they await answers which
will require much further investigation (p. 233). In 1946, however, Burns and
Mitchell argued against the sole reliance on trend-adjusted data in business
cycle analysis on the ground that "Cyclical fluctuations are so closely inter-
woven with ••• secular changes in economic life that important clues to the
understanding of the former may be lost by mechanically eliminating the latter.,,2l
They favored conversion of the data into "cycle relatives," that is, percentages
of the average value of the series during each completed cycle. This method
eliminates in a stepwise manner the "intercycle" trends but retains the "intra-
cycle" trends.
Full trend adjustment does suppress some part of the change that occurs
during business cycles, which is a disadvantage insofar as the growth effects
that are thus missed are of interest to the analyst. 22 On the other hand,
working with deviations from trend should result in greater uniformities of the
cyclical measures because the variance due to the secular change is eliminated
or reduced. Isolating such, uniformities can be instructive, and they turn out
23to be indeed much stronger after than before trend adjustments. Thus a case
can be made for a dual analysis addressed to both the classical business cycle
21. aurna aDd Mitchell, op.cit., p. 270.
22 Consider, e.g., the industry life-cycles noted earlier in the text.As Mitchell put it: "The inclusion of intracycle trends in cycle relativeshelps to reveal and to explain what happens during business cycles. Rapidly&rowing industties affect business cycles otherwise than do industries barelyholding their own or shrinking." See his What Happens During Business Cycles:A Progress Report, NBER, New York, 1951, p. 13•
. 23 For an early account on how cyclical measures tend to be more alikefor trend-adjusted then for unadjusted data, both among and within series, seeBurns and Mitchell, op.cit., Chapter 7. On some confirming evidence from recent Irowth cycle studies, see text below.
-18-
and the growth cycle: useful lessons, which moreover should be largely comple-
mentary, can be drawn from cyclical measures based on both trend-Unadjusted and
trend-adjusted time series. 24
An old and difficult practical problem in growth cycle analysis is that
its results depend significantly on how and over what period the trend is fitted
and whether and how it is extrapolated. Trends vary greatly and can be mea-
sured in many different ways each of which has its particular strengths and
limitations. Mathematical formulas (e.g., linear, quadratic, exponential,
and logistic functions of time) often produce good approximations over limited
historical periods only and lack the flexibility required to reflect the vari-,
ations over time displayed by long-term movements in many economic time series.
If moving averages are used to estimate such movements, they must be based
on periods longer than the average duration of the cycles so as to yield
smooth curves that cut through, and contain no significant elements of, the
short-term fluctuations in the series. But when the moving-average period is
too long, the advantage of greater flexibility is lost again; and even a
reasonable choice of the period may not insure that the trend is free of all
traces of the cycle. Furthermore, the moving average must be centered, which
implies the need for extrapolation at the beginning and end of the series
over periods equal to half the number of months incorporated in the moving
average.
In the DEB. approach, which has been gradually improved over the pas t
decade and is now widely applied in international studies, a flexible, smooth,
24 Mitchell, op.cit., p.14, recognizes that such double analyses would"add to our knowledge," but notes that they "would be so expensive as to reduce greatly the number of series we could cover." Present computational techniquesremove this problem.
-19-
nonlinear and not necessarily monotonic trend is estimated by interpolation
between segments of the series determined with the aid of long-term (75-month
or 25-quarter) moving averages. Although no single ideal method of trend esti-
mation exists, this procedure has been tested on many series and shown to
have considerable merit for the purpose on hand. Its great advantage, moreover,
is that it has been consistently applied to the main cyclical indicators for
all large and many small industrialized, market-oriented economies. This work,
a-part of a large collaborative effort supported by several international and
25national organizations, was initiated in 1973 by Geoffrey Moore.
The more technical detail on the adopted technique, and a graphic illus
tration of how it works, can be found in the literature. 25a It should be
noted that the specific cycles in the resulting deviation-from-trend series
are identified in the same way as those in the trend-unadjusted series.
The reference chronology of growth cycles is established by a close ex-
amination of the so processed data for a country's main comprehensive indicators
of economic activity (such as the series on total output, yeal income and sales,
industrial production, employment). The criteria and procedures are practically
26the same as those employed in the NBER reference chronology of business cycles.
The difference is that growth cycle dates are derived from the observed con-
sensus of the corresponding turning points in the deviations from trend, whereas
business cycle dates are derived from the consensus of the turning points in
the levels of the same indicators.
-25 See his "The Current State of the International Business Cycle: A NewMeasurement System," Chapter 5 in Business Cycles. Inflation. and Forecasting,as cited.
25a ./See Charlotte Boscham and Walter W. Ebanks, "The Phase-Average Trend:A New Way of Measuring Growth," 1978 Proceedings of the Business and EconomicStatistics Section, American Statistical Association, Washington, D.C., pp.332-335.
26 On the identification of peaks and troughs of business cycles and growthcycles, see the brief statement and references in G.H. Moore, '~at is a Recession?", op.cit., Chapter 1.
-20-
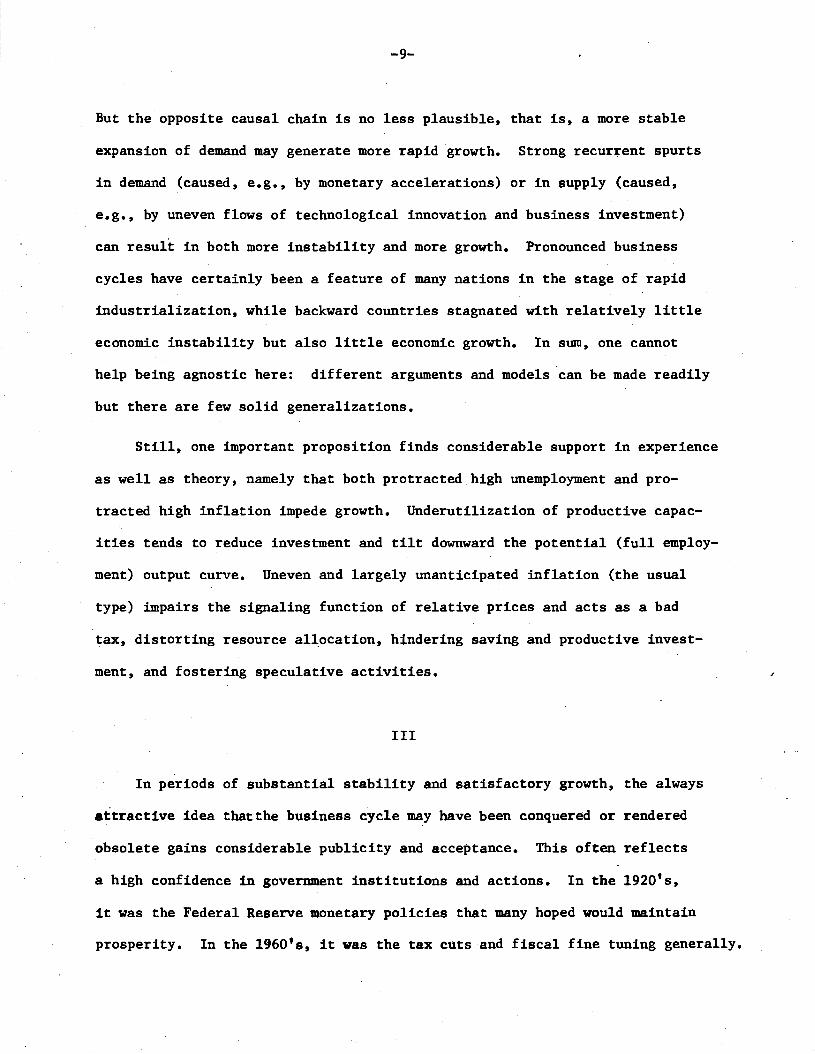
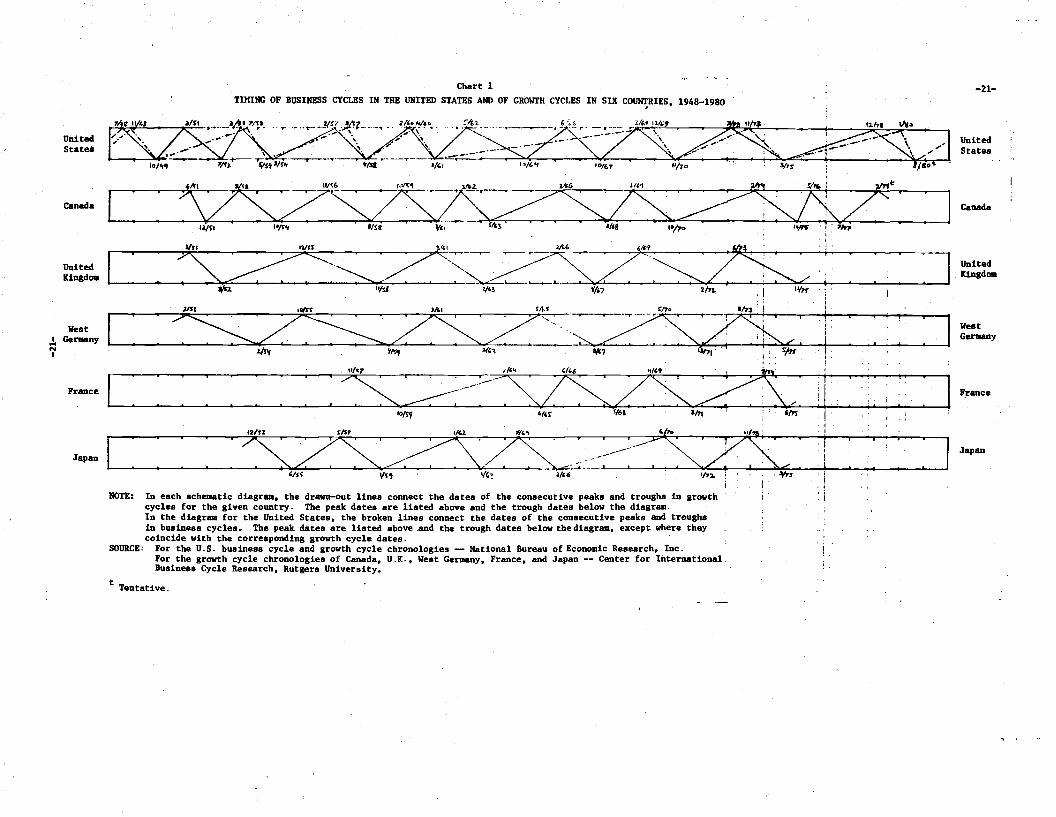
The schematic diagram for the United States in Chart 1 (first panel)
shows that a growth-cycle downturn preceded each of the seven business-cycle
peaks of the 1948-80 period. In the last three cycles (since 1969), the low-
growth phases lasted as long as 8 to 13 months before deteriorating into ab-
solute declines. Thus here retardations gave early and repeated (though ad-
mittedly still uncertain) signals of recession. On the four earlier occasions,
in 1948-60, the leads of the decline in growth at peaks were much shorter,
from 2 to 6 months. This shift may in part be attributable to the increased
role of services: the rise in their output helped to offset the decline in out-
put of goods and structures, and did so more efficiently in recent times.
Also, the economy may have been propped up temporarily in the late stages of
the recent expansions by buying and speculative activities associated with
inflationary expectations and low real interest rates, which discouraged saving.
In sharp contrast to the early timing of the peaks, the troughs of the
growth cycles coincided with those of the business cycles in each case except
one (there was a short lag in 1954). On three occasions -- .in 1951-52, 1962-
64, and 1966-67 -- low-grow~h phases interrupted business expansions but did
not terminate them (that is, here the slowdowns ended in a resumed high growth,
not in a decline). Thus, as would be expected, growth cycles are more frequent
than business cycles, e.g., there were ten growth cycle downturns in the 1948
80 period for the United States but seven recessions. 27
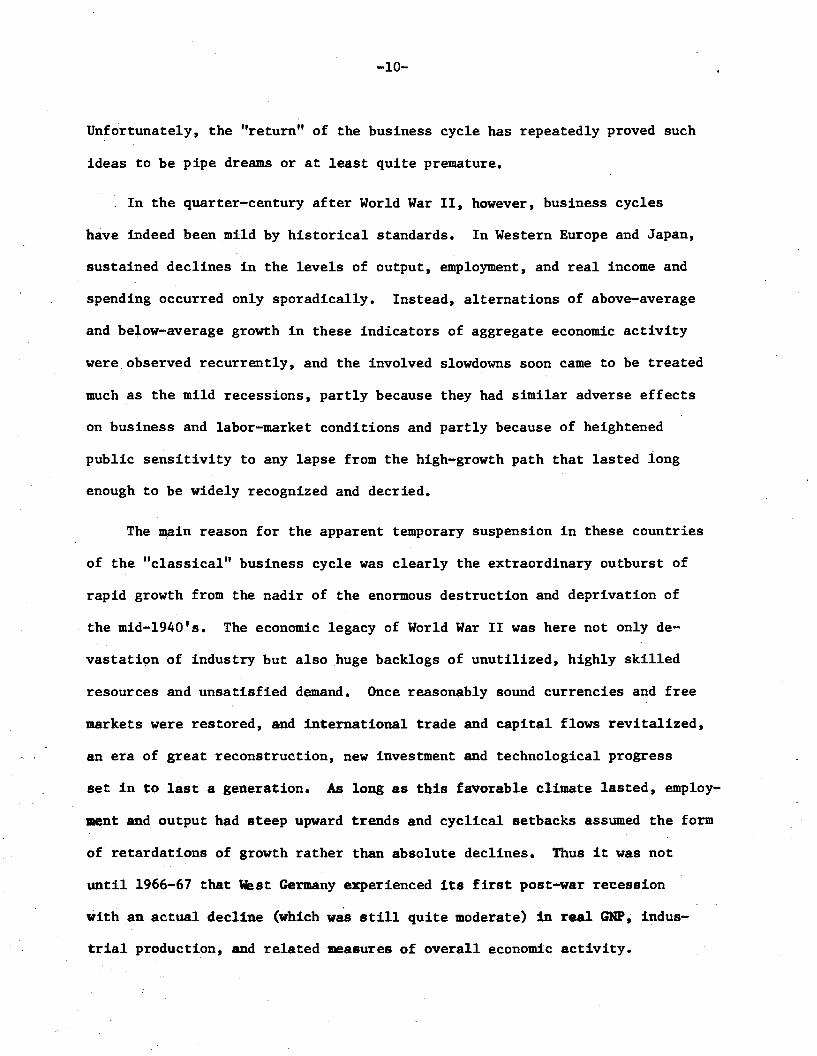
.Growthcycles, then, tend to be relatively symmetrical: the. U.S. record
.iDce 1948 yields average durations of 22 and 18 months for the high-growth and
27 In Chart 1, .the latest U.S. 'recession is assumed to have ended inAugust, 1980, which is also taken to mark the end of the latest low-growthphase. This date is tentative and still uncertain, although it accords with theevldenceavailable at the time of this writing, February, 1981. See V. Zarnowitzand G.B. Moore, "The Timing and Severity of the Recession of 1980," NBER Reporter,Spring 1981.
United. Kingdom
UnitedState.
Canada
UnitedK1nadoa
West,.!, Gel'lDllnyNI
France
Japan
Chart 1
TIMING OF BUSINESS CYCLES IN THE UNITED STATES AND OF GROWTH CYCLES IN SIX CO~IES, 1948-1980
aI',,
I: .~~~6~ZS~ltz':: I
I: :3z~;:=~sLs=T: :.: ]It's!. 'V,, "'~ ~Ih 2"'1., I 1I/lt", i ' . I
I : : ~:Z:SZ~~~:=3-n<:I::': :·1~'f ~"" 2{,~ ~1 ~~In·:· .... ,!.. I ,
I " '
I : : : : : : : : :~~/>:sts:.ZS.=q~: I::: [': II .,
I : : : : ::S:ZS~.~.:·~S:<:I ::: : I'1<> VS' ,/,~ .", 'I.~ :. .¥r. ' i
I . I
NOTE: In each schematic diagram. the drawn-out lines connect the dates of the consecutive peaks and troughs in growth i ' icycles for the given country. The peak dates are listed above and the trough dates below the diagram.In the diagram for the United States, the broken lines connect the dates of the consecutive peaks and troughsin busineas cycles. The peak dates are listed above .and the trough dates below the diagram, except where theycoincide with the corresponding growth cycle dates. .
SOURCE: For the U.S. business cycle and growth cycle chronologies -- Nstiona1 Buresu of Economic Research, Inc.For the growth cycle chronologies of Cansda, U.K., West Germany, France, and Japan -- Center for International:Business Cycle Research, Rutgers University.
t Tentative.
-21-
UnitedStatea
Caaada
WestGerasny
France
Japan
-22-
low-growth phases, respectively. In contrast, business cycles in the same period
show a strong asymmetry: the expansions lasted on the average 49 months, the
contractions 10 months. The expansions have varied in duration much more than
the high-growth phases did (the respective standard deviations are 27 and 11
months). Other important measures for growth cycles also show greater uni-
formity than their counterparts for business cycles. In particular, leading
indicators, which are sensitive to all kinds of disturbances, tend to turn
down in anticipation of business slowdowns as well as contractions. Hence,
they have a better record of forecasting growth cycles than of forecasting
business cycles (the slowdown predictions are treated as "extra turns" when
attention is focused exclusively on the recessions).
The U.S. chronologies are more complete and better documented than those
for most other countries, and the latter are in recent times predominantly
limited to growth cycles. However, I have little doubt that many of the U.S.
results (e.g., those concerning the greater frequency, symmetry, and relative
predictability of growth cycles compared with business cycles) apply about
equally to other developed ~rket-oriented economies. Studies by Mintz,and
Moore and his associates, as well as others abroad, indicate that "Leading,
coincident, and lagging indicators behave in.much the same way in relation to
. 28growth cycles in other industrial countries as they do in the United States."
28. Moore, op.cit., p.24.
-23-
Chart 1 suggests that most of the recent growth cycles have been inter-
national in scope, including those slowdowns that did not become recessions
in the United States. That is, the low-growth phases of 1951-52, 1962-64, and
1966-67 had counterparts in Europe (indeed, as noted earlier, the first German
recession after World War II occurred in 1966-67, overlapping the last of
these episodes). The 1953-54 recession in the U.S. had but weak and spotty
repercussions abroad (virtually limited to Canada and Japan). The recessions
of 1957-58 and 1969-70 had more visible counterparts, although most of these
29took the form of growth retardations rather than absolute declines. It is
clear that the most serious recessions in the post-World War II period occurred
in 1974-75 in all the countries covered and elsewhere in the trading world;
most of these declines were preceded by slowdowns in 1973. The expansions
that followed were soon, in 1976-77, interrupted by another cluster of low-
growth phases, but not in the United States,where the next slowdown occurred
only in 1979, followed by a brief but substantial decline in 1980. This last
recession, too, spread internationally.
Chart 1 confirms what has long been observed and understood: business
fluctuations tend to spread among countries linked by trade and financial trans-
actions which reflect the international movements of goods, services, and capi-
tal. Expansions stimulate foreign trade and investments, slowdowns and re~
cessions discourage them. The cyclical pattern of the United States economy
~resses itself strongly upon a close partner of a relatively small size such as
·1:imada. The diagrams for West Germany and the United Kingdom exemplify another
191n particular, in West Germany these were just mild slowdowns. Franceseems to have had more of a decline in 1958 only. The United Kingdom had lengthyretardations of a more pronounced variety and much less growth generally, buthere too outright declines were rare and short. Japan, with the highest growthrates, also' had the most frequent recessions outside of U.S. and Canada, notablya sizable one in 1957-58.
-24-
close timing relationship. To be sure, there are also deviations, but the
common rhythm is unmistakable for all the countries covered (and it extends
to many others). It is often suspected that the chain of influence runs mainly
from the biggest country to the others (with the United States exporting its
prosperity and its recessions), but this need not always be so: the propermodel
is one of multilateral interactions. In any event, the leads an~ lags disclosed
by the chronologies vary greatly and cannot tell us much about the direction of
the forces involved in the international transmission of cyclical movements.
v
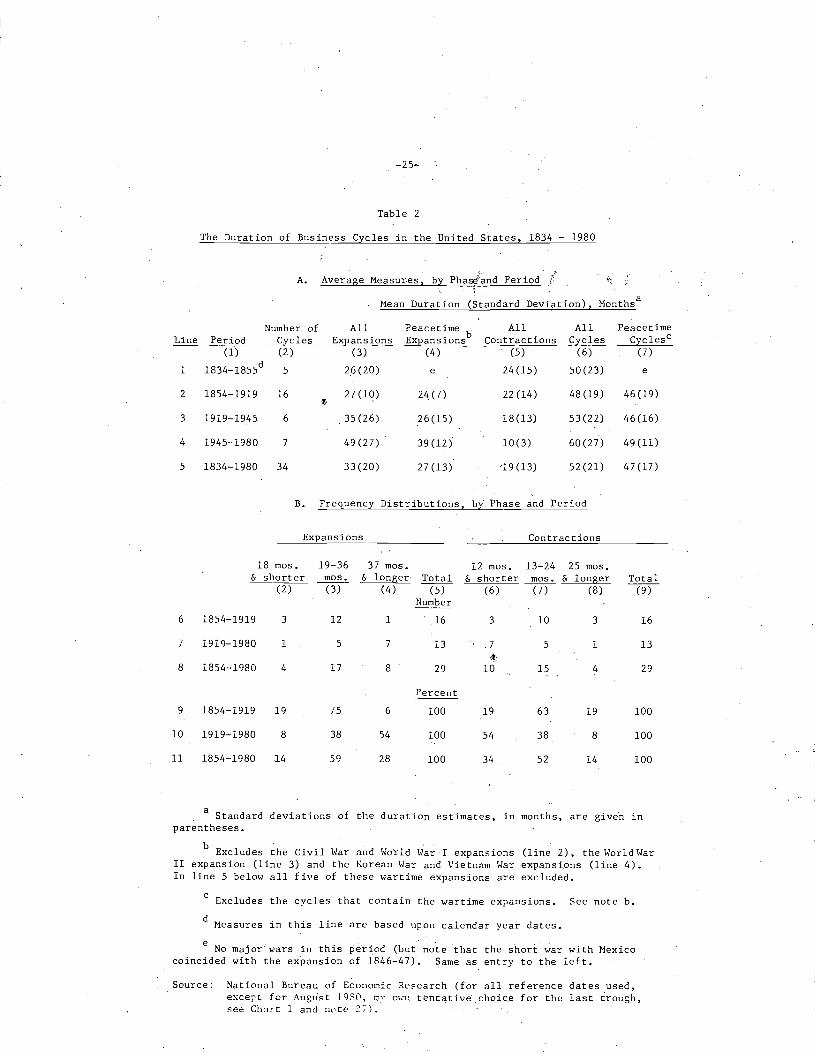
According to the NBER chronology of U.S. business cycles, which reaches
back almost 150 years, expansions have grown longer and contractions shorter.
Table 2 demonstrates these tendencies by comparing the summary statistics on
the durations of cycle phases for several periods, before and after such di-
viding years as 1855, 1919, and 1945. Wartime expansions have lasted longer
than most of the others, but their exclusion does not alter the above finding
(cf. part A, columns 3 and ·4). Before 1919, the peacetime expansions were
on the average little longer than the contractions in business activity (the·
figures are 24 and 22 months, respectively). Afterwards, they were more than
twice as long .(the corresponding averages are 32 and 15 months), and this des-
pite the fact that the comparison includes the long depression of the 1930's
aDd excludes three long wartime expansions. The vivid shift indicated by the
average measures is somewhat further elaborated by the frequency distributions
of .hort, intermediate, and long expansions and contractions (part B of the,table) •
Of course, the data available to the NBER analysts for their ~ork on iden-
tifying and dating the business cycles of history increased hugely in quant;ity
-25-
Table 2
The Duration of Business Cycles in the United States, 1834 - 1980
A. Average Measures, by Pha9iand Period! "I
Mean Duration (Standard Deviation), Monthsa
Line
1
Period-----rrr-
1834-1855d
Number ofCycles(2)
5
All Peacetime b All All PeacetimeExpansions Expansions Contractions Cycles CyclesC
(3) (4) (5) (6) (7)
26(20) e 24(15) 50(23) e
2
3
4
5
1854-1919
1919-1945
1945-1980
1834-1980
16
6
7
34
27(10)
,35(26)
49 (27)
33 (20) .
24(7)
26(15)
39(12)
27(13)
22(14)
18 (13)
10(3)
'19(13)
48(19)
53 (22)
60(27)
52(21)
46 (19)
46(16)
49(11)
47(17)
B. Frequency Distributions, by Phase and Period
Expansions Contractions
18 mos. 19-36 37 mos. 12 mos. 13-24 25 mos.& shorter mos. & longer Total & shorter mos. & longer Total
(2) (3) (4) (5) (6) (7) (8) (9)Number
6 1854-1919 3 12 1 16 3 10 3 16
7 1919-1980 1 5 7 13 ,7 5 1 13·,t
8 1854-1980 4 17 8 29 10 15 4 29
Percent
9 1854-1919 19 75 6 100 19 63 19 100
10 1919-1980 8 38 54 100 54 38 8 100
11 1854-1980 14 59 28 100 34 52 14 100
a Standard deviations of the duration estimates, in months, are give'n inparentheses.
b Excludes the Civil Har and Horld Har I expansions (line 2), the World WarII expansion (line 3) and the Korean War and Vietnam War expansions (line 4).In line 5 below all five of these wartime expansions are excluded.
c Excludes the cycles that contain the wartime expansions. See note b.
d Measures in this line are based upon calendar year dates.
e No major wars in this period (but note that the short war with Mexicocoincided ,dth the expansion of 1846-47). Same as entry to the left.
Source: National Bureau of Economic Research (for all reference dates used,except for August 19S0. I:1\' 0"": tentative',choice for the last trough,see Chart 1 and n0te ~;).
-26-
30and improved substantially in quality over time. For the early decades, very
few adequate time series exist, least of all in the most desirable form, which
is comprehensive monthly or quarterly data on income, production, and employ-
mente Here it was necessary to rely in the main on three sources, beginning
with the descriptive evidence from "business annals" of contemporary opinion
b h d d f fl i i i · i 31a out t e stage an sprea 0 uctuat on n econom c act1v ty. The annals
were next checked against indexes of business conditions and other series of
broad coverage. Finally, arrays of cyclical turns in the more important monthly
and quarterly series on individual processes were ascertained and closely ex
amined so as to sharpen the choice of the reference dates. 32
These studies of business cycle history replaced the concentration on
financial crises, panics, and deep depressions, which was characteristic of
the earlier work in this area, with efforts to examine all business contractions,
the mild ones as well as the severe ones. Mitchell noted that "The same de-
velopments which make it wise to substitute the concept of recession for the
concept of crisis make it wise to recognize the shorter segments into which
the long swings are frequen~ly divisible. This change reduces the typical
duration of American cycles to roughly one-half of the estimate commonest
among theoretical writers.,,33 By the same token, the approach nearly doubles
the number of basic observations (cycles) to be analyzed, acknowledging the
30 For example, U.S. industrial censuses ate decennial from 1810 to 1899,qoiquennial from 1899 to 1919, and annual thereafter. The data problems forthe study of business cycles in other countries are on the whole greater yet.(The NBER chronologies extend over long stretches of time: for Great Britain,back to 1792; for France, to 1840; and for Geraany, to 1866.)
. ",.,.,' - ....II . .
Willard L. Thorp, lusu~e~s ~s, ~iona1 Bureau of Economic Research,New York, 1926.
32 For more on this procedure, see Burns and Mitchel1~ op.cit., p. 76 ff.
33Business Cycles: The Problem and Its Setting, as cited, pp. 386-387.
-27-
great diversity of these fluctuations in length and size, but emphasizing their
continuity. It presumes that the most severe and the mildest contractions
are not of an entirely different species, even though they are certainly of
a very different order of magnitude.
However, where consistent, comprehensive time series on the main aspects
of aggregate economic activity are not available, the severity of business
contractions and the vigor or expansions cannot be estimated with adequate
confidence. 34 The evidence from business annals is deficient and susceptible
of bias. Allowing for the lags of recognition, the consensus of contempor-
aries can determine rather well that business conditions have deteriorated
or improved on a large scale and approximately when such shifts happened; it
cannot tell us nearly as well just how much they deteriorated or improved.
In a growing economy, downturns will attract more attention than upturns. 35
After a strong expansion, a mild decline (or even only a slowdown, if suffi-
ciently long and diffused) may cause as much discomfort and alarm as a larger
36decline coming after a weaker expansion. Hence it is possible that observers
would tend to overstate the dimension of some of the movements in the former
category, perhaps even mistaking at times a major retardation for a business
contraction.
34 This has been fully recognized by those who have done most to helpremedy this situation. Thus Burns and Mitchell, op.cit., p. 402, state flatly'~nfortunately, we lack at present reliable measures of the amplitude of successive business cycles." This conclusion still holds at least for the firsthalf of ' the period covered by the NBER chronology.
35 Referring to the duration estimates derived from business annals,Mitchell, op.cit., pp. 421-422, states: "Our measurements are based solelyupon the intervals between recessions. It would be desirable to check theresults by a second set, based on the intervals between revivals." We haveDot attemptf:d such a check, because business commentators have paid less attent ion to the upward than to the downward turning points of business cycles."(Note: In this discussion, business cycles are treated as having four phases-prosperity, recession, depression, and revival. The terms "recession" and"reVival," then, refer to the turning zones.)
36 .This is certainly consistent with the recent experience in fast growing
econoaies auch as 3apan.
-28-
Time series data permit some verification of the lessons from business
annals. Moreover, they add valuable, though severely limited, quantitative
information even for the earliest times covered. There are annual quantity
series for individual but important items and monthly data for wholesale
commodity prices, stock prices, bond prices, short-term interest rates, and
(later) bank clearings. As noted before, indexes of business activity, which
represent weighted combinations of such series, have been popular in the early
statistical studies of business cycles. It is unfortunate, however, that
for the period before 1975 these indexes exist exclusively in trend-adjusted
form. Clearly, it is difficult to distinguish business cycles from growth
cycles in series that show deviations from trend only.
In this context, it is important to recall that the expansions and contrac
tions of the early business cycles in the NBER chronology tend to be of nearly
equal length -- much like the phases of growth cycles and very unlike those
of the later business cycles in which the expansions are much longer than
the contractions (compare lines 1-2 with lines 3-4 in Table 2). Given this
observation, and the limitations of the materials available for the identi
fication of the early cycles, it is natural to ask whether some of these
fluctuations may not be in the nature of growth cycles rather than business
cycles. The reliance on business annals and trend-ad~usted indexes, in partic
ular,might well have produced a certain amount of bias in that direction.
The question, far from being purely academic or pedantic, is important
in a basic sense, since i.t involves the reading of contemporary as well as
historical trends•. Thus it is well worth knowing whether business expansions
have in fact grown longer and contractions shorter - or whether the evidence
in Table 2, which confirms that they have, is seriously flawed by a lack of
-29-
consistency in the measurement of the fluctuations over time.
VI
Do all the "contractions" dated in the NBER reference chronology represent
actual declines in economic activity or do some of them represent phases of
below-average growth? It is much easier to raise this question than to answer
it with sufficient confidence, for the already familiar reason that the data
are so limited. A thorough review of the NBER chronology and the underlying
materials is beyond the scope of this paper. Still, even a partial re-exam
ination of the evidence could be of some help here, at least in determining
the dimensions of the problem.
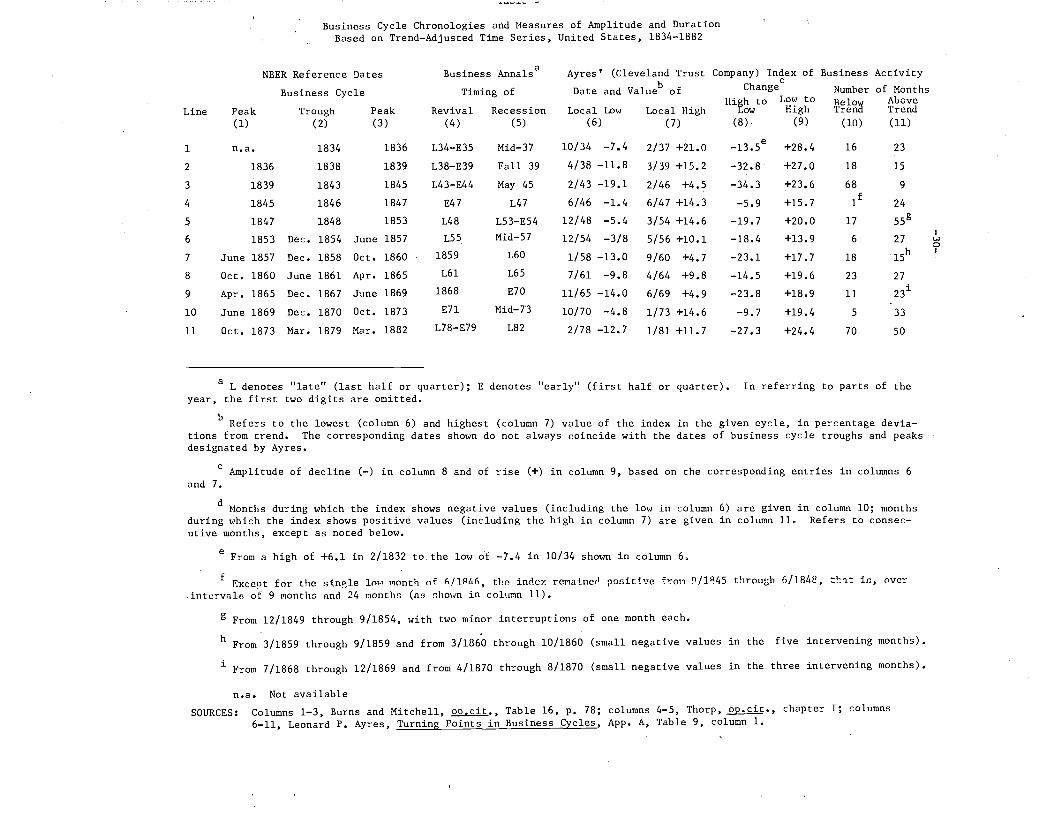
Table 3 reviews the period 1834-82, i.e., that segment of the NBER ref
erence cycle chronology for which there are no comprehensive measures or
indexes of economic activity without trend adjustments. A comparison of
columns 2 and 4, and of columns 3 and 5, shows that each of the NBER cycles
corresponds to a cycle recognized in the U.S. business annals. It is this
broad parallelism that interests us here, not the timing discrepancies which
seem considerable but are mainly due to the inevitable vagueness of the annals
in this respect.
The measures in columns 6-11 are based on the only index of business
activity in the U.S. available for these early decades, the Cleveland Trust
. Company index compiled in 1931 and intensively used by Ayres (1939). This is
a weighted combination of trend-adjusted series on prices, physical quantities,
and pecuniary volumes of transactions or trade. As such, it contains con
8iderabl~ information but in a form that lends itself to much popular use
Business Cycle Chronologies and Measures of Amplitude and DurationBased on Trend-Adjusted Time Series, United States, 1834-1882
NBER Reference Dates Business Annalsa Ayres' (Cleveland Trust Company) Index of Business Activity
b cBusiness Cycle Timing of Date and Value of Change Number of Months
HiEh to Low to~~~~~
AboveLine Peak Trough Peak Revival Recession Local Low Local High ow High Trend
(1) (2) (3) (4) (5) (6) (7) (8) (9) (10) (11)
1 n.a. 1834 1836 L34-E35 Mid-37 10/34 -7.4 2/37 +21.0 _l3.5e+28.4 16 23
2 1836 1838 1839 L38-E39 Fall 39 4/38 -11.8 3/39 +15.2 -32.8 +27.0 18 15
3 1839 1843 1845 L43-E44 May 45 2/43 -19.1 2/46 +4.5 -34.3 +23.6 68 9
4 1845 1846 1847 E47 L47 6/46 -1.4 6/47 +14.3 -5.9 +15.7 If 24
5 1847 1848 1853 L48 L53-E54 12/48 -5.4 3/54 +14.6 -19.7 +20.0 17 55g
6 1853 Dec. 1854 June 1857 L55 Mid-57 12/54 -3/8 5/56 +10.1 -18.4 +13.9 6I
27 w0
7 June 1857 Dec. 1858 Oct. 1860 1859 L60 1/58 -13.0 9/60 -23.1 +17.7 15h I
+4.7 18
8 Oct. 1860 June 1861 Apr. 1865 L61 L65 7/61 -9.8 4/64 +9.8 -14.5 +19.6 23 27
9 Apr. 1865 Dec. 1867 June 1869 1868 E70 11/65 -14.0 6/69 +4.9 -23.8 +18.9 11 23i
10 June 1869 Dec. 1870 Oct. 1873 E7l Mid-73 10/70 -4.8 1/73 +14.6 -9.7 +19.4 5 33
11 Oct. 1873 Har. 1879 Mar. 1882 L78-E79 L82 2/78 -12.7 1/81 +11. 7 -27.3 +24.4 70 50
a L denotes "late" (last half or quarter); E denotes "early" (first half or quarter). In referring to parts of theyear, the first two digits are omitted.
b Refers to the lowest (column 6) and highest (column 7) value of the index in the given cycle, in percentage deviations from trend. The corresponding dates shown do not always c.oincide with the dates of business cycle troughs and peaksdesignated by Ayres.
c Amplitude of decline (-) in column 8 and of rise (+) in column 9, based on the corresponding entries in columns 6and 7.
d ~Ionths during which the index shows negative values (including the low in column 6) are given in column 10; monthsduring which the index shows positive values (including the high in column 7) are given in column 11. Refers to consecutive months, except as noted below.
e From a high of +6.1 in 2/1832 to the low of -7.4 in 10/34 shown in column 6.
f Exce!)t for the si.np.le 101.' "lonth of f,!lR/d.. , the indey. rcnainc,l poniti'!e h:0n o/lR45 throu[;h G/18 ffe, t~:l::intervaln of 9 1'l0nthn and 24 nontlw (as r.hm.,n in colur.m 11).
in, ovcr
g From 12/1849 through 9/1854, with two minor interruptions of one month each.
h From 3/1859 through 9/1859 and from 3/1860 through 10/1860 (small negative values in the five intervening months).
i From 7/1868 through 12/1869 and from 4/1870 through 8/1870 (small negative values in the three intervening months).
n.a. Not available
SOURCES: Columns 1-3, Burns and Mitchell, op.cit., Table 16, p. 78; columns 4-5, Thorp, op.cit., chapter I; columns6-11, Leonard P. Ayres, Turning Points in Business Cycles, App. A, Table 9, column 1.
-31-
and misuse; it ought to be handled with great care and caution. In particular,
it is important to recognize that the annual movements in the index have a
different meaning from the monthly movements, since the former reflect mainly
changes in production and trade, the latter changes in commodity and security
prices (the monthly series used as interpolators). Also, like other early
indexes, this composite refers'in large measure to durable goods whose cyclical
sensitivity tends to be high, which means that it may overstate the fluctua
37tions of the economy at large.
Contemporary testimonies and data broadly agree on the earliest develop-
ments covered, including a moderate decline in 1833-34, an expansion accompanied
by much speculation in land through 1836, a financial panic followed by an
incomplete recovery in 1837-38, and finally one of the longest and deepest
depressions in U.S. history, marked by sharp deflation and repudiation of,
or postponement of payments on, large amounts of private and state debts.
In sharp contrast to that depression, which ended in 1843, the NBER-designated
contraction of 1845-46 was a mild affair, which indeed is open to serious
doubt: the episode may well have been one of a mere growth-cycle retardation.
37 In the period under review, the index comprised detrended series oncommodity and security prices, imports and exports, ship construction, coalproduction, tons of registered shipping, and government finance (before 1855);later, pig iron consumption, railroad freight ton miles, blast furnace activity,rail production, locomotive production, miles of new railroads, canal freight,and cotton consumption. For detail, see Leonard p. Ayres, Turning Points inBusiness cycles, Macmillan, New York, 1939, Appendix C, pp. 204-205. Althoughthe composition of the index is different for the years before and after 1855,tests for an overlap period are reported to indicate a very substantial similarity of the results from the two sets of series.
The Ayres index, now published by Ameri Trust Co. (Cleveland) is reproducedin graphical form in many widely used economic textbooks, as a rule withoutany explanation. While its historical use can be justified, its current useappears highly questionable (e.g., its entire course since 1961 is shown assomehow persisting well above its zero "long-term trend" line).
-32-
Ayres speaks of "a minor dip in business in 1846;" his index stays positive,
i.e., above "normal", in all months but one from September 1845 through June
1848 (Table 3, line 4).38 The business annals describe a suspiciously short
cycle in terms that are inconclusive but, compared to those used elsewhere,
39quite mild. Moreover, several independent studies using mainly annual data
on the volume of domestic and foreign trade fail to confirm the ocurrence of
a business contraction in these years. They suggest a single business cycle
40between 1843 and 1848, with only a mild setback in 1845-46.
The years 1853-54 saw rising interest rates and strongly declining security
prices, and these financial developments dominate the accounts of the recession
38 Ayres, op. cit. ,. p. 11, stresses that in 1846 there was "no real depression. It may well be that conditions were then developing which may haveinitiated a real depression, but that renewed business activity was temporarilystimulated by the government expenditures of the Mexican War."
39 As summarized by Thorp, op.cit., p. 124, there was in 1845 a "slumpascribed to political difficulties, May; return to activity, October;" in 1846,there was a "slackening of activity to dullness" and, since May, war withMexico and "severe pressure in money market." Mitchell notes in his Introduction to Thorp's volume, pp. 42-43, that the annals imply for 1845-46 a cycleof about one year's duration when measured between successive recessions (i.e.,downturns). This would have been a very short cycle indeed, and one difficultto reconcile with the Burns-Mitchell 1946 definition, which has business cyclesexceed one year in length.
40 C. J. Bullock and H. L. Micoleau state that "the movement of foreigntrade and that of commodity prices do not point to a depression or even aserious recession in business in 1846" (see their "Foreign Trade and theBusiness Cycle," The Review of Economic Statistics, November 1931, p. 153).Detrended indexes of the volume of domestic and foreign trade constructed byArthur H. Cole from series on tonnage carried on canals and railroads, ofvessels built, total merchandise shipped to and from abroad, etc., show declines in all NBER recession years during the period 1830-1862, except in 1846and 1854. See Cole, "Statistical Background of the Crisis of 1857," Review ofEconomic Statistics, November 1930, p. 172; also, W. B. Smith and .A. H. Cole,Fluctuations in American Business, 1790-1860, Harvard University Press, 1935,chaps. XII and XX. Donald W. Gilbert, "Busin~ss Cycles and Municipal Expenditures," Review of Economic Statistics, August 1933, p. 141, concludes thatafter 1843 " ••• a level high enough to be characterized as prosperity was notachieved before 1846 and that the years 1844 and 1845 cannot be called prosperous years but rather years of broken and halting revival."
-33-
in Thorp's annals as well as in the statistical studies by Ayres and Cole.
But the evidence of a contraction in real termS is weak, except with respect
to business fixed investment. The construction of new railroad mileage
dropped sharply, but Cole's index representing mainly the physical volume
of domestic trade increased about 5 percent in 1854. Wholesale commodity
prices show very little softness in this episode. Thus here too, despite
the general agreement in the literature, there is some room for doubt about
the genuineness of the contraction (as distinct from an undoubted financial
trouble and business slowdown).
Data are still scanty for the next fifteen years which includes the Civil
War, but they provide general support for the business contractions with the
NBER-dated troughs in 1858, 1861, and 1867 (Table 3, lines 7-9). It is fairly
clear, however, that the last two of these were relatively mild, and the
designation of 1865-67 as a contraction finds no support in annual production
41data which show increases. The latter observation applies a fortiori to
the 1869-70 episode, which was much milder and shorter yet. Indeed, it is
puzzling how to explain eve~ a mild contraction at a time of the greatest
acceleration in railroad investment. A careful study, which notes this fact,
suggests that short-lived financial difficulties may have discouraged inven
42tory accumulation, which played a relatively large role at the time.
See Rendigs Fels, American Business Cycles, 1865-1897, The Universityof North Carolina Press, Chapel Hill, 1959, pp. 96-97.
41 Frickey's index of industrial and commercial production (1899=100)has the following values: 13 in each of the three years 1860-62, 15 in 1863,17 in both 1864 and 1865, 19 in both 1866 and 1867, and 20, 22, and 23 in1868, 1869, and 1870, respectively. After adjustment for secular trend, theindex fluctuates in broad conformity with the NBER chronology, declining in1860-62, 1864~65, 1866-67, ar,d 1869-70. See Edwin Frickey, Production inthe United States, 1860-1914, Harvard University Press, 1947, pp. 125-129.
42
-34-
Again, it is possible that in terms of production all that happened was
a phase of below-average growth rather than an actual decline of cyclical
proportions. In the absence of reliable, comprehensive data on intra-year
output changes, no firm conclusion can be reached. But there is another
important factor here, namely the decidedly downward trend in prices, which
prevailed for about thirty years after the Civil War. In such deflationary
times, cyclical movements show up much more strongly in nominal (current
dollar) aggregates of income and spending than in their real (constant dollar)
aggregates. (In inflationary times, the opposite is the case, as shown by
recent experience.) Presumably, the high degree of price flexibility existing
at the time has mitigated the output fluctuations. But a perceived deflationary
trend generates expectations of further price declines, which are to some
extent self-fulfilling (just as inflation generates partly self-validating
expectations of further price rises). Such expectations are worrisome and
can be seriously destabilizing, particularly since they are always clouded
by uncertainty. The changes over time in the price level are generally quite
uneven -- e.g., the deflation of 1865-96 was interrupted by several relatively
short and weak upward price movements, mainly during business expansions.
Thus price expectations are as a rule only roughly verified by ·the overall
trend and often falsified by the shorter movements. Moreover, the dispersion
of the changes in individual prices is high. The uneven declines in prices,
values, and spending during the period under review were undoubtedly hurting
many people. Business cycles are not, and cannot be, isolated from these
developments. They cannot, therefore, be judged by their "real" elements alone.
Thf; 1873-79 contraction was exceptionally long and by most accounts an~
measures very severe (see Table 3, line 11, and Table 4, line 1, which contains
-35-
some additional informationo) However, the available evidence is heavily
weighted with nominal series-prices, bank clearings, railroad revenues, im-
ports -- which fell sharply; the physical-volume series show shorter and
smaller declines, mostly between 1873 and 1876. 43
Beginning in the late 1870's, more comprehensive statistics are avail-
able monthly, and not only in trend-adjusted form. Table 4 lists the ampli-
tudes of cyclical movements -- percentage declines and rises -- in deflated
bank clearings, three indexes of business activity without trend adjustments,
and an average of three indexes with such adjustments. This is useful infor-
mation, but it must be interpreted with care, since each of these aggregates
has considerable limitations and there is a considerable amount of duplication
44among them.
43 Friedman and Schwartz, op.cit., pp. 43-44, note that "the steadydecline in prices from 1873 to 1879 probably led contemporary observers andcertainly led later observers to overstate the severity of the contraction interms of real output ••• The contraction was severe. Yet an analyst whoassessed the contraction on the basis of physical volume series alone wouldregard it as shorter in length and far less severe than it has generally beenjudged." Similarly, Fels, opocit., p. 107, states that the "depression ofthe 1870's", though second only to that of 1929-33 in monetary statistics,was "nevertheless, in terms of output ••• singularly mild." This is stronglysupported by Frickey's data (see ref. in note 41). .
44 Bank clearings outside New York City (the exclusion is designed tolessen the impact of financial transactions, largely in the stock and bondmarkets) have been widely used in the literature as a measure of aggregateeconomic activity. Since 1919, the better series of bank debits (also outside N.Y.C. and deflated) is used. See F. R. Macaulay, as cited in Table 4;E. Frickey, Economic Fluctuations in the United States, Harvard UniversityPress, 1942, pp. 338, 360-361; and George Garvy, Debits and Clearings Statistics and Their Use, Federal Reserve Board, 1959.
The Axe-Houghton index, which starts in 1879, is based on pig iron production, imports, bank clearings outside N.Y.C., and revenue per mile ofselected railroads. The Babson index is a base-year weighted aggregate ofseasonally adjusted physical volume or constant dollar series, with coverageexpanding from 11 to 33 components. It includes manufactures, minerals,agricultural marketings (but not farm production proper), construction, railway freight ton-miles, electric power, and foreign-trade volume. The weights
-36-
The series used in Table 4 show expansions and contractions corresponding
to the NBER business cycle reference dates in all instances but two: the
Babson index of physical volume of business activity did not decline in 1890-
91 and the deflated bank debits paused but did not fall in 1926-27. Howeve~
a few of these movements have been questioned, viz. Ayres whose index does
show a mild decline in 1926-27 disregards it in his chronology, and the same
45applies in the case of Axe and Houghton.
Despite the shor~mingsof the underlying data, the amplitude measures in
Table 4 rank the cyclical episodes sensibly, that is, in broad agreement with
the judgments expressed in the most informed and careful studies of American
46business cycles. However, the rankings differ depending on whether trend-
are value-added data. See G. H. Moore, ed., Business Cycle Indicators, NBER,New York, 1961, volume II, pp. 39-40, for more detail. The A.T.&T. index isdescribed as "primarily a measure of manufacturing activity and the physicalmovement of commodities" (see Rorty, as cited in Table 4). In 1922, it co~
prised 12 items (identified with weights in Mitchell, Business Cycles: TheProblem and Its Setting, as cited, p. 295), but in earlier years its coveragewas much slimmer. These three indexes (Axe-Houghton, Babson, and A.T.&.T.)are available without trend adjustments.
The trend-adjusted indexes used to compute the average cyclical amplitudesin columns 4 and 5 of the table are those by Ayres and A.T.&T., plus the indexpresented and described in W. M. Persons, op.cit., pp. 8-9, 91, Ill, 131, and152-156.
45 See Ayres, op.cit., p. 45, and E. W. Axe and R. Houghton, "Financialand Business Cycles, Manufacturing Growth, and Analysis of Individual Industries,1883-1930," The Annalist, Jan. 1931. Ayres speaks of "a minor business downturnin 1927 which was not sufficiently important to be considered as marking the endof a cycle." But Burns and Mitchell, op.cit., p. 109, observe that "this decline[in the Ayres' index] is a trifle longer and at least as large as the 1887-88decline, and definitely larger though a little shorter than the 1869-70 decline,~oth of which Ayres considers as marking the end of a business cycle. A similar'remark applies to Axe and Houghton ••• ". See also ibid., Table 27, p. 108 andtext, for more on the comparison of NBER and other chronologies.
46 Burns and Mitchell, op.cit., Table 156, p. 403, use the ~rend-adjusted
indexes of Ayres, Persons, and A.T.&T. to rank the amplitudes of U.S. expansionsand contractiousin 1879-1933. G. H. Hoore, Business Cycle Indicators, Table 3.6,pp. 104-105, extends bhese measures to cover the period 1854-1958. It should benoted that our review ends in 1929 and so excludes the "great contraction" of1929-33 and the much shorter but deep contraction of 1937-38. The 1926-27 episodeis believed to be the last one for which the data leave some uncertainty as to theDature of the cyclical developments involved. Hence, given my present objective,tbere was DO point in aoina beyond the cycles of the 1920' s.
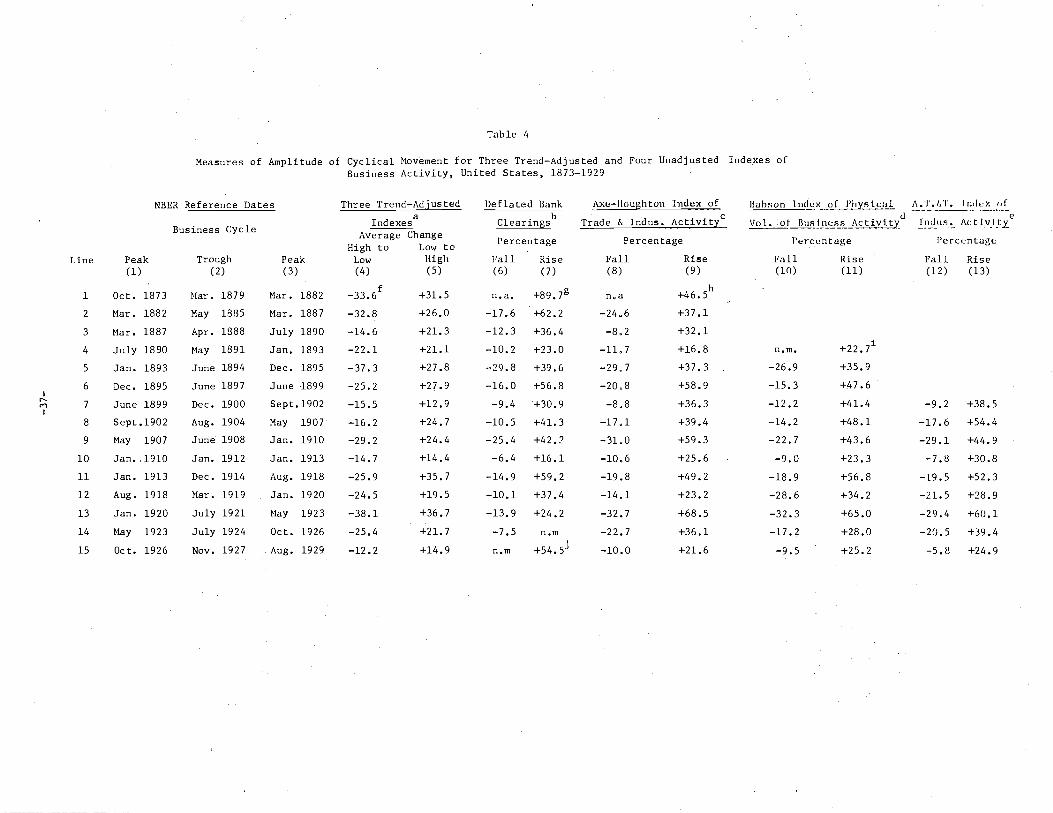
Table 4
Measures of Amplitude of Cyclical Movement for Three Trend-Adjusted and Four Unadjusted Indexes ofBusiness Activity, United States, 1873-1929
NBER Reference Dates Three Trend-Adjusted Deflated Bank Axe-Houghton Index of BabR () n 1nd eX-e.'!.LJ'.!!Yo'!..i t;;!l. A.'I'./,'I'. I"ckx or---_.__._~- .._-a b Trade & Indus. ActivityC d
I!~~lIR~. Act IvJ.t.Ye
Business CycleIndexes Clearings Vol. of 1l11~!~l!:':~'!...3ctivLsY.
Average Change Percentage Percentage Percentage PercentageHigh to Low to
Line Peak Trough Peak Low High Fall Rise Fall Rise Fall Rise Fall Rise(1) (2) (3) (4) (5) (6) (7) (8) (9) (10) (11) (12) (13)
1 Oct. 1873 Mar. 1879 Mar. 1882 -33.6f
+31.5 n.a. +89.7 g noa +46.5h
2 Mar. 1882 May 1885 Mar. 1887 -32.8 +26.0 -17.6 +62.2 -2406 +37.1
3 Mar. 1887 Apr. 1888 July 1890 -14.6 +21.3 -12.3 +36.4 -8,2 +32.1
4 July 1890 May 1391 Jan. 1893 -22.1 +21.1 -10.2 +23.0 -11, 7 +16.8 n.m. +22.7i
5 Jan. 1893 June 1894 Dec. 1895 -37.3 +27.8 -29.8 +39.6 -29_7 +37.3 -26.9 +35.9
6 Dec. 1895 June 1897 June 1899 -25.2 +27.9 -16.0 +56.8 -20,8 +58.9 -15.3 +47.6I......
7 June 1899 Dec. 1900 Sept.1902 -15.5 +12.9 -9.4 +30.9 -8.8 +36.3 -12.2 +41.4 -9.2 +38.5C"lI
8 Sept.1902 Aug. 1904 May 1907- -16.2 +24.7 -10.5 +41. 3 -17.1 +39.4 -14.2 +48.1 -17.6 +54.4
9 May 1907 June 1908 Jan. 1910 -29.2 +24.4 -25.4 +42.2 -31,0 +59.3 -22.7 +43.6 -29.1 +44.9
10 Jan •. 1910 Jan. 1912 Jan. 1913 -14.7 +14.4 -6.4 +16.1 -10,6 +25.6 -9.0 +23.3 -7.8 +30.8
11 Jan. 1913 Dec. 1914 Aug. 1918 -25.9 +35.7 -14.9 +59.2 -19,8 +49.2 -18.9 +56.8 -19.5 +52.3
12 Aug. 1918 Mar. 1919 Jan. 1920 -24.5 +19.5 -10.1 +37.4 -14.1 +23.2 -28.6 +34.2 -21. 5 +28.9
13 Jan. 1920 July 1921 May 1923 -38.1 +36.7 -13.9 +24.2 -32.7 +68.5 -32.3 +65.0 -29.4 +60.1
14 May 1923 July 1924 Oct. 1926 -25.4 +21.7 -7.5 n.m -22.7 +36.1 -17.2 +28.0 -20.5 +39.4
15 Oct. 1926 Nov. 1927 Aug. 1929 -12.2 +14.9 n.m +54.5j
-10.0 +21.6 -9.5 +25.2 -5.8 +24.9
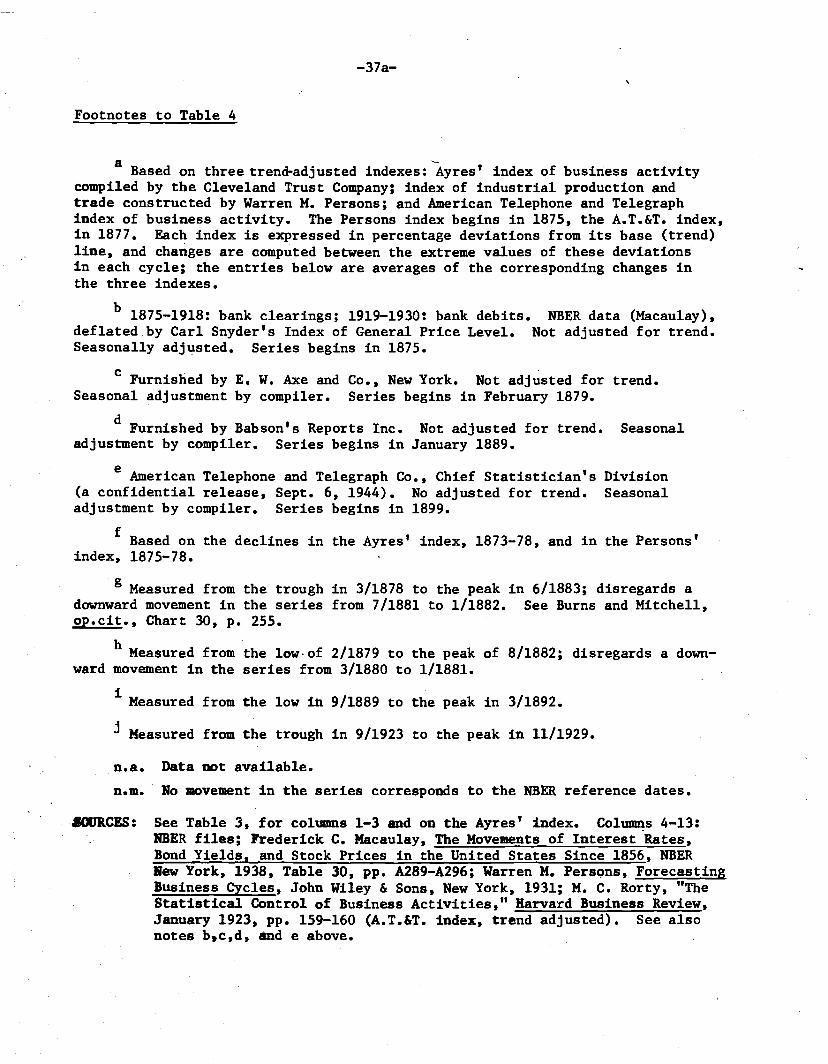
DivisionSeasonal
-37a-
Footnotes to Table 4
a Based on three tren~adjusted indexes: ~yres' index of business activitycompiled by the Cleveland Trust Company; index of industrial production andtrade constructed by Warren M. Persons; and American Telephone and Telegraphindex of business activity. The Persons index begins in 1875, the A.T.&T. index,in 1877. Each index is expressed in percentage deviations from its base (trend)line, and changes are computed between the extreme values of these deviationsin each cycle; the entries below are averages of the corresponding changes inthe three indexes.
b 1875-1918: bank clearings; 1919-1930: bank debits. NBER data (Macaulay),deflated by Carl Snyder's Index of General Price Level. Not adjusted for trend.Seasonally adjusted. Series begins in 1875.
c Furnished by E. W. Axe and Co., New York. Not adjusted for trend.Seasonal adjustment by compiler. Series begins in February 1879.
d Furnished by Babson's Reports Inc. Not adjusted for trend. Seasonaladjustment by compiler. Series begins in January 1889.
e American Telephone and Telegraph Co., Chief Statistician's(a confidential release, Sept. 6, 1944). No adjusted for trend.adjustment by compiler. Series begins in 1899.
f Based on the declines in the Ayres' index, 1873-78, and in the Persons'index, 1875-78.
g Measured from the trough in 3/1878 to the peak in 6/1883; disregards adownward movement in the series from 7/1881 to 1/1882. See Burns and Mitchell,op.cit., Chart 30, p. 255.
h Measured from the low·of 2/1879 to the peak of 8/1882; disregards a downward movement in the series from 3/1880 to 1/1881.
i Measured from the low itl 9/1889 to the peak in 3/1892.
j Measured from the trough in 9/1923 to the peak in 11/1929.
n.a. Data not available.
n.m. No movement in the series corresponds to the NBER reference dates •
.tClJRCES: See Table 3, for columns 1-3 and on the Ayres' index. Columns 4-13:NBER files; Frederick C. Macaulay, The Movements of Interest 'Rates,Bond Yields, and Stock Prices in the United States Since 1856, NBERHew York, 1938, Table 30, pp. A289-A296; Warren M. PersQns, ForecastingBusiness Cycles, John Wiley & Sons, New York, 1931; M. C. Rorty, "TheStatistical Control of Business Activities," Harvard Business Review,January 1923, pp. 159-160 (A.T.&T. index, trend adjusted). See alsonotes b,c,d, and e above.
-38-
adjusted or unadjusted indexes are used. As would be expected, the declines
are generally much larger and the rises much smaller in the former than in the
latter series (cf. columns 4 and 5 with the corresponding entries in columns
6-13).
The fact that not only the trend-adjusted but also the unadjusted series
match all but a few of the turning points in the NBER chronology can be said
to confirm the latter in a broad and conditional sense. This means that it is
primarily the occurrence of these cyclical movements approximately in the indi-
cated periods which is supported by the data, rather than the precise dates of
the peaks and troughs. It also means that the quality of the evidence depends
on the degree to ~hich the indexes used reflect the true cyclical movements
in the economy at large. These movements cannot be observed well without more
comprehensive, nonduplicative measures of aggregate economic activity. The
available series, used as proxies for such measures, could either underestimate
or overestimate the true movements, but the greater risk would seem to be that
of overestimation because the data appear to represent the cyclically sensitive
sectors of the economy such as manufacturing better than they do the other
sectors.
Of course, the serious nature of several contractions listed in Table 4 is
not in doubt. The decline in 1882-85 was among the longest and rather severe,
47although again more so in prices and money transactions than in production.
Ge~erally poor business conditions and a protracted deflation characterized the
3 ~ year period 'from the beginning of 1893 to mid-1897, which saw two major con-
.47 . ~
Frickey's annual index of industrial and commercial production (1899=100)has a peak of 48 in 1883 and a trough of 46 in 1885; in trend-adjusted form, thedecline is from 109 (percent of trend) in 1882 to 93 in 1885 (see fn. 41 forreference). See also Fe1s, op.cit.,. pp. 128-131.
-39-
tractions separated only by an abortive revival from the middle of 1894 ~hrough
1895. The debacles of 1907-08 and 1920-21 were both relatively short but very
severe. There was also a serious decline in production and real income in,the
years 1913 and 1914, which was fully reversed only in 1915 by the inflow of
orders from abroad as World War I intensified. 48
The other contractions were definitely much milder, and some of them may
well have been marked by retardations rather than absolute declines in total
output. The one in 1887-88 is described as a brief "slight recession" in the,
business annals; it does not register as a decline in a number of important
series but only as a retardation; and it is omitted from cyclical chronologies
49by some scholars. The next contraction on the NBER list, attributed tomoneta~y
disturbances originating.abroad in mid-1890, although shorter yet, is viewed
as more pronounced, but not by much. After a brief but vigorous expansion
following the depressed years 1893-97, another ~xtrem~ly mild contraction is
identified by NBER in 1899-1900, which also does not show up in annual ~easures
50of output and real income.
48 For further evidence on the above episodes, see Fels, op.cit., chapters10 and 11; Frickey, as quoted before; Friedman and Schwartz, op.cit., pp. 99-102,108-113, 156-158, 196-197, and 231-232.
49 In particUlar by Jos~ph Kitchin inhis"Cy~les and Trends in Eco~omicFactors," Review of Economic Statistics, January 1923, pp.lo-16. Fels,op.cit."p. 142, agrees "that 1887';;'88 'was about as mild as any contraction worthy of thelUIIIle. The only difference of opinion to be found in the literature is ,whetherit should be recognized as a cyclical contraction at all." He lists several.anthly series for banking, imports, rail,r()ad,traffic and earnings that show
·110' cyclical peaks in thiS 'period but also notes that 'investment in railroadsand buildings did weaken. Frickey's index;assumes,the values 54, 60, and 61,in 1886, 1887, and 1888; in trend-adjusted form, the corresponding readings
·are 103, 107, and 104.~ ,
Beginning in lB89, annual figures on the value of net national productin 1929 do1l~rs are available from John W. Kendrick, Productivity Trends in -theUnited States, Princeton forNBER, 1961. This series, due to Ktlznets and Kendrick,shows increases of 4.3 percent -and 2.7 percent in the "trough" years 1891 and 1900,respectively (in contrast to aizable declines in thedepresaedyears 1893-94 and1896). Similarly, Frickey's unadjusted index rises in both 1889-91 and 1899-1901
-40-
The first contraction of this century, in 1902-04, was rather lengthy but
certainly not severe. Still, there is no reason to question that it was a true
decline in aggregate economic activity as both real net national product and
the index of industrial and commercial production had small losses (of about
1.8% and 1.5%, respectively) in the year 1904. Similarly, the contraction of
1910-12 was mild, although it too lasted about two years. Prices fell markedly
in this period, while real net national product increased but slightly in 1910
(by 0.8 of 1 percent) and the index of industrial and commercial production
fell 3.3 percent in 1911. 51
The 1918-19 contraction as dated by the National Bureau was extremely
brief (7 months) so it is not surprising that it is not registered in annual
data. The amplitude measures of Table 4, however, show it to have been more
serious than most of the contractions discussed previously. It seems appropriate
to regard it as a sui generis end-of-the-war recession along with the similarly
short 1945 episode.
The last two cycles to be considered are those of 1923-29, a period of
calmness before the storm, ~haracterized by relatively stable economic growth
and fairly stable prices. The contraction of 1923-24 was moderately brief and
mild, but the Babson index suggests that it saw a decline in industrial pro-
duction similar to those that occurred in 1895-97 and 1913-14 (cf. lines 6, 11,
and 14 in Table 4). The nature of the extremely mild 1926-27 phase is much
(but dec1inenwhen trend-adjusted in both 1891 and 1900). The monthly Babsonindex, which has a relatively good coverage of industrial output, moves along alow plateau but shows no decline from its beginning in 1889 through early 1891(see fn. 44 and 'lab1e 4, line 4). For further information, see Friedman andSchwartz, op.cit., pp. 94 (Chart 8), 104, 136 (Chart 13), and 139; also, Fels,op.cit., pp. 166-171.
51 The Nutter index of industrial production, based in large part on Frickey'sdata, shows a very similar decline in the same year (see ref. in Table 1 above).See Friedman and Schwartz, op.cit., pp. 173-174.
-41-
more questionable, however. As already noted, some investigators excluded thisr
movement from their cyclical chronologies (see fn. 45 above). They may not
have consistently followed their own criteria in doing so, but from the present
point of view more doubt is justified. Even the sensitive industrial production
indexes (F.R.B., Babson) fell but relatively slightly -- about 8 or 9 percent --
in this period, and there is no good evidence that real income and total output
52declined, although money income probably did, a little, along with prices.
In sum, this reappraisal suggests that generally the contractions in NBER
chronology do represent cyclical declines in either real income and output, or
money income and spending, or both the real and the nominal aggregates. In my
view, it is necessary to consider both groups of variables: in the recent infla-
tionary era, the cycles are mainly in the real aggregates, btlt in the past,
when the price level fluctuated and long periods of deflation occurred, they
were often more pronounced in the nominal aggregates.
Nevertheless, there are a few doubtful episodes. All of these go back
to the 19th century, unless the recession of 1926-27 is questioned, 'which is
a difficult, marginal case•.The 1845-46 phase is most dubious, but 1869-70
is also of uncertain nature as are 1887-77 and 1899-1900. It seems impossible
to refute the hypothesis that these were periods of below-average growth rather
than actual declines. The same may apply to a few other minor contractions
aentioned before, but it seems prudent not to press the matter. While some
fa~tors point to retardations, others such as the length of some of the phases
Or -1:he behavior of prices and monetary and current-dollar series point to the
-'Possibility of mild declines •
S2 See R. A. Gordon, "Cyclical Experience in the Interwar Period: TheInvestment Boom of the Twenties," Conference on Business Cycles, NBER, New York,1951, p. 208, and references therein. Also, Friedman and Schwartz, op.cit.,pp. 197 (Chart 16) and 288.
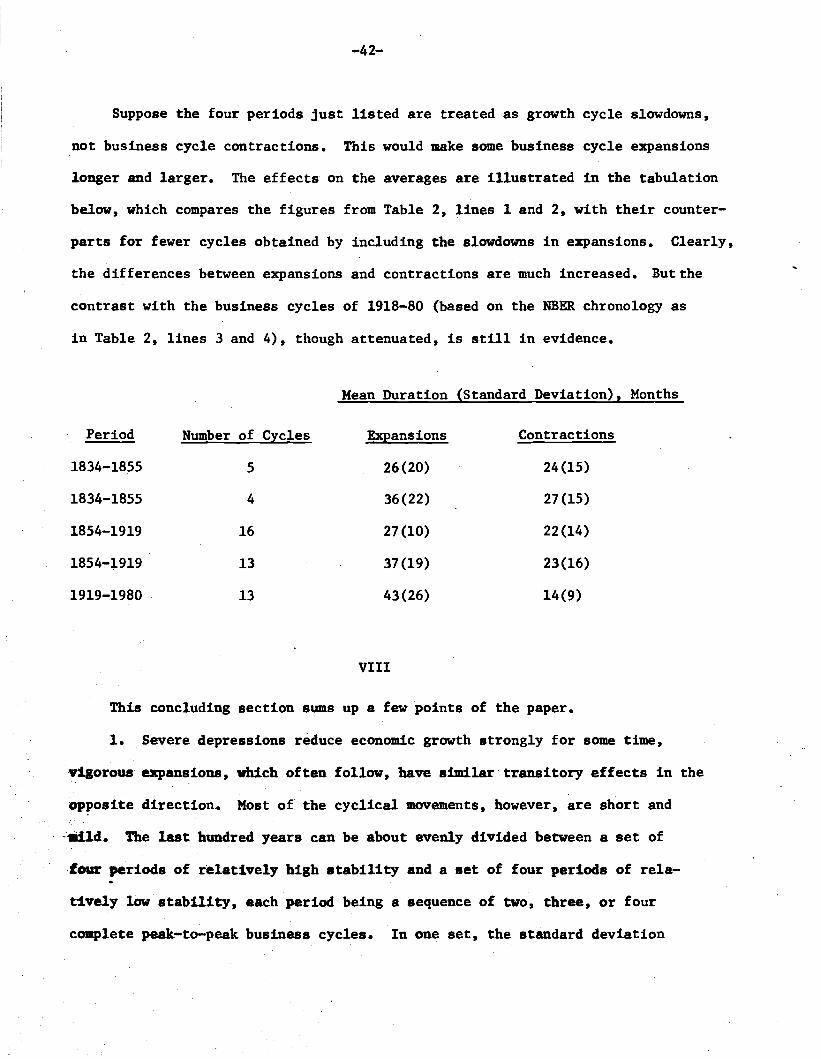
-42-
Suppose the four periods just listed are treated as growth cycle slowdowns,
not business cycle contractions. This would make some business cycle expansions
longer and larger. The effects on the averages are illustrated in the tabulation
below, which compares the figures from Table 2, lines 1 and 2, with their counter-
parts for fewer cycles obtained by including the slowdowns in expansions. Clearly,
the differences between expansions and contractions are much increased. Butthe
contrast with the business cycles of 1918-80 (based on the NBER chronology as
in Table 2, lines 3 and 4), though attenuated, is still in evidence.
Mean Duration (Standard Deviation), Months
Period Number of Cycles Expansions Contractions
1834-1855 5 26(20} 24(15}
1834-1855 4 36(22} 27(15}
1854-1919 16 27(l0} 22(14}
1854-1919 13 37(19} 23(16}
1919-1980 13 43(26} l4(9}
VIII
This concluding section S1DDS up a few points of the paper.
1. Severe depressions reduce economic growth strongly for some time,
-vigorous expansions, which often follow, have similar -transitory effects in the
opposite direction. Most of the cyclical movements, however, are short and
-mld. The last hundred years can be about evenly divided between a set of
,four periods of relatively high stability and a set of four periods of rela-.t1vely low stability, each period being a sequence of two, three, or four
complete peak-to-peak business cycles. In one set, the standard deviation
-43-
of the annual growth rates in real GNP is 4.4 percent, in the other it is 7.4
percent. The corresponding average annual growth rates are 4.0 percent and
2.6 percent. These remarkably symmetric results suggest that growth was gen-
erally higher when stability was greater. Presumably; instability of aggregate
demand and of the general price level impede growth. However, long-term growth .
and cyclical variability depend partly on common and partly on different fac-
tors, and there seems to be no good general reason to expect any simple and
stable relationship between them.
2. Business cycles have changed in several i~portant ways under the
impact of the developmentsinftiated during and after the cataclysms of the
depression and war of 1929-45. Recessions are perceived as having decreased
in frequency, duration, and amplitude; the apparent reasons for this lie in
structural, institutional, and policy changes that have been much studied.
But the process also introduced new destabilizing and growth-inhibiting ele-
ments. The recent changes in cyclical behavior are not necessarily irreversible
alterations or trends that can be extrapolated.
3. The mildness of economic fluctuations after World War II led to a
revival of the interest in grow~h cycles, that is, cyclical movements in trend-\
adjusted indicators. A great deal of valuable information for ma~y countrie~
has by now been assembled and evaluated on this basis. Growth cycles are rel-
atively symmetrical in duration, in contrast to the recent business cycles which
consist of long expansions and short contractions. Measures of several 1m-
portant aspects of growth cycles show greater uniformity than their counter-
parts for business cycles. A cODlJ>arison of the timing of recent growth cycles
in the market-oriented economies linked by trade and financial transactions
suggests a strong element of international diffusion. of these movements.