Embed Size (px)
Citation preview
NBER WORKING PAPER SERIES
CHARACTERISTICS OF FOREIGN-OWNEDFIRMS IN BRITISH MANUFACTURING
Rachel GriffithHelen Simpson
Working Paper 9573http://www.nber.org/papers/w9573
NATIONAL BUREAU OF ECONOMIC RESEARCH1050 Massachusetts Avenue
Cambridge, MA 02138March 2003
Chapter is forthcoming in “Seeking a Premier League Economy” edited by Richard Blundell, David Card andRichard Freeman. The authors would like to thank Richard Blundell, David Card, Steve Nickell, John VanReenen and Frank Windmeijer, and an anonymous referee for helpful comments, and the Gatsby CharitableFoundation and the ESRC Centre for Microeconomic Analysis of Fiscal Policy at the Institute for FiscalStudies for financial support. This report has been produced under contract to ONS. All errors and omissionsremain the responsibility of the authors. The views expressed herein are those of the authors and notnecessarily those of the National Bureau of Economic Research.
©2003 by Rachel Griffith and Helen Simpson. All rights reserved. Short sections of text not to exceed twoparagraphs, may be quoted without explicit permission provided that full credit including ©notice, is givento the source.
Characteristics of Foreign-Owned Firms in British ManufacturingRachel Griffith and Helen SimpsonNBER Working Paper No. 9573March 2003JEL No. D2, F2
ABSTRACT
This paper describes the characteristics of manufacturing establishments in Britain over the period
1980 to 1996, paying particular attention to differences between establishments of different
ownership nationalities. The findings suggest that establishments that are always foreign-owned
have significantly higher labour productivity than those that remain under domestic ownership. In
addition, labour productivity improves faster over time and faster with age in foreign-owned
establishments. The difference in labour productivity is matched by an equivalent difference in
levels of investment per employee. Establishments that change ownership nationality do not seem
to experience very large changes in labour productivity levels. The proportion of skilled workers in
the workplace, and wages for both skilled and operative workers are higher in foreign-owned
establishments than domestic-owned, in line with differences in labour productivity.
Rachel Griffith Helen SimpsonInstitute for Fiscal Studies Institute for Fiscal Studies7 Ridgmount Street 7 Ridgmount StreetLondon LondonWC1E 7AE WC1E 7AEUnited Kingdom United [email protected] [email protected]
2
1 Introduction
The 1970s and 1980s saw an increase in the international openness of the British
economy. By 1980 the British government had removed exchange controls and had
joined the European Economic Community. By the late 1980s Britain was embarking
on the EU Single Market Program, which aimed to improve the international mobility
of capital. Over the 1980s there were also a large number of privatisations and reforms
to product and factor markets. This opening up of the UK economy was expected to
bring increased growth through a number of routes, one of which was through making
the UK a more attractive location for internationally mobile investment. In this paper
we focus on the impact of inward investment. From the early literature of Vernon
(1966), Dunning (1977) and Caves (1974) it has been suggested that multinational firms
are more productive, and are concentrated in knowledge-intensive industries. The
endogenous growth1 and new trade literatures2 focus on the role multinational firms play
in transferring technology from the frontier to economies that lag behind
technologically. Empirical work, largely at the aggregate level, has identified
correlations between the openness of an economy and growth in productivity or export
performance. 3
Foreign direct investment (FDI) both into and out of the UK rose over the 1980s, but
fell off in the early 1990s, before recovering (strongly) in the middle to late 1990s.
Here, rather than consider FDI flows, we consider real economic activity by looking at
subsidiaries of foreign-owned multinationals operating in Great Britain. Like a number
of other countries, the UK uses fiscal policy to attract foreign multinationals, and hence
potentially capitalise on technological spillovers. In the 1980s Regional Selective
Assistance (RSA) grants replaced Regional Development Grants as the main form of
1 See, inter alia, Barro and Sala -i-Martin (1995), Aghion and Howitt (1998), Grossman and Helpman (1991).
2 See, inter alia, Krugman (1991a,b, 1994), Venables (1994), Smith (1994) and Edwards (1998). 3 These studies have generally used labour productivity, see, for example, Bernard and Jones (1996a,b) and Barrell and Pain (1997). Cameron, Proudman and Redding (1998) look at total factor productivity. Studies using micro-data include Blomstrom and Persson (1983), Davies and Lyons (1991) and Globerman (1979).
3
inducement. RSA grants are discretionary and are awarded to firms located in
designated Assisted Areas. Although their primary aim is to create or safeguard
employment, they are also used to attract inward investment. Over the four years from
1985 to 1988 foreign-owned firms accounted for only 8% of the total number of RSA
offers. But grants to foreign-owned firms totalled around £325 million, representing
44% of the total value of offers over this period. The average grant offer was therefore
higher for foreign-owned firms, as was the average grant per expected job created.4
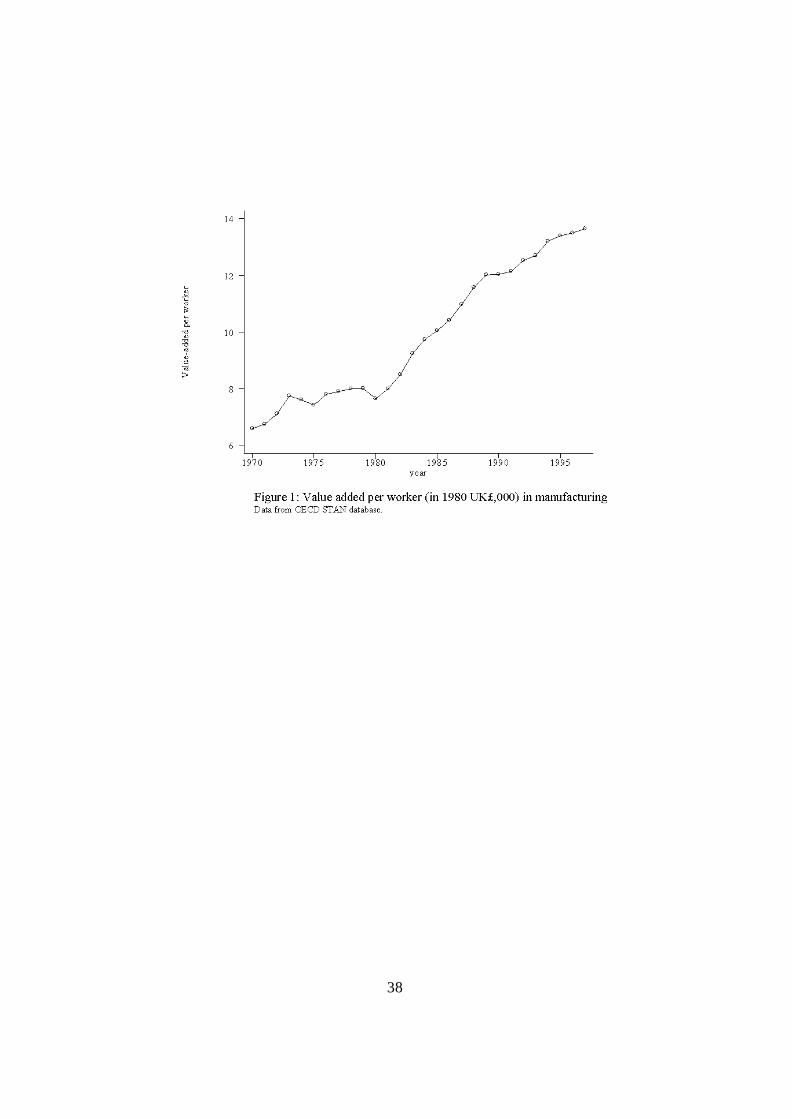
Value-added per worker in British manufacturing grew rapidly over the 1980s relative
to the 1970s, with slower but continued growth during the 1990s (see Figure 1). But
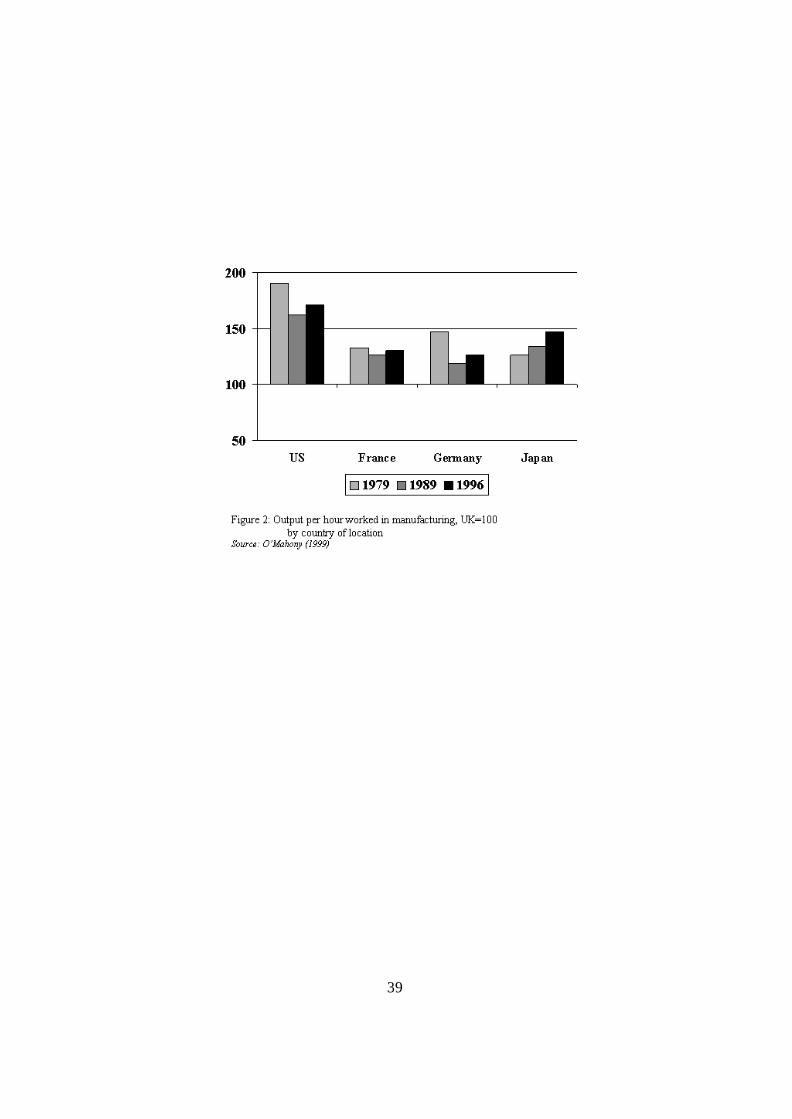
Britain remains at the bottom of the Premier League of countries. Figure 2 compares
labour productivity in the manufacturing sector within each of these countries. It shows
that, while the position of the UK relative to the US has improved somewhat, it still lags
behind the US, and to a lesser extent behind France, Germany and Japan. The figure
shows labour productivity of manufacturing activity undertaken within these countries,
both by domestic and foreign-owned firms. Studies comparing total factor productivity
show a similar picture. 5 One interesting question is whether improvements in the UK’s
relative position have been driven by the presence of foreign-owned multinational firms
in the UK.
In this paper we investigate whether similar differences arise when we look across
different nationalities of establishments operating within Britain. We examine
differences in labour productivity and factor usage between foreign-owned and
domestic-owned firms using establishment level data. In doing so we control for
industry, age, size, year of exit and establishment specific unobservable characteristics.
This will be informative in understanding the extent to which it is physical location in
Britain, as opposed to UK-ownership, that underlies the observed international
differences in labour productivity. If it is location in Britain that matters this may point
4 Source: DTI (1993), section 2.4. Value of offers to foreign-owned firms is in 1990 £.
5 See, inter alia, O’Mahony (1999), Dougherty and Jorgenson (1997), Nickell et. al. (1992), Layard and Nickell (1989), Bean and Crafts (1995), Bean and Symons (1989), Oulton and O’Mahony (1994), Mayes (1996), Cameron, Proudman and Redding (1998), van Ark (1996), Lansbury (1995) and Oulton (1998).
4
to factors such as national competition policy, employment laws or the regulatory
environment, for example planning regulations, as highlighted in a recent report by
McKinsey Global Institute. However, if we find labour productivity differences
between foreign and domestic -owned establishments both operating within Britain, this
may indicate differences in the organisation of production and input usage, or that
domestic-owned establishments differ from their foreign-owned counterparts
technologically.
There are many studies of labour productivity using establishment level data in the US
and a growing number in the UK. 6 Two studies that are particularly relevant for our
purposes are Doms and Jensen (1998) and Howensteine and Zeile (1994). Using US
data Doms and Jensen (1998) show that that there are substantial differences between
domestic and foreign-owned establishments. They find that foreign-owned
establishments have higher labour productivity than the average US-owned
establishment, but lower labour productivity than those owned by US multinationals.
This indicates that what may be important in explaining productivity differences is
ownership by a multinational rather than foreign ownership per se. They also find that
foreign-owned establishments are more capital intensive and pay higher wages than the
average US-owned establishment. Howensteine and Zeile (1994) describe the
characteristics of foreign-owned establishments in the US. They find that foreign-
owned establishments are more capital intensive and larger. They have higher average
wage rates but this is largely because they are in higher wage industries, not because
they pay workers higher wages compared to other firms in the same industry. Using
Canadian plant-level data Globerman, Ries and Vertinsky (1994) have shown that there
are significant differences between domestic and foreign-owned plants. Foreign-owned
establishments are found to have higher labour productivity, but after controlling for
size, capital intensity, share of non-production workers, and share of male workers these
differences disappear.
6 See Bartelsman and Doms (2000) for a review, also Caves (1998). For the UK see, for example, Harris and Robinson (2002), Disney et. al (2000) and Griffith (1999).
5
A further motivation for this line of research is that establishment-level studies in both
the UK and US have found that within industry variation in labour productivity is
greater than between industry variation.7 Understanding sources of within industry
variation helps explain both the determinants of productivity differentials between
establishments, such as differences in capital intensity, and the determinants of industry
level productivity growth, for example the replacement of low productivity incumbents
with high productivity entrants.
Here we look at differences in characteristics between foreign and domestic -owned
establishments located in the UK. We consider establishments that do not change
ownership nationality separately from those that experience a change in ownership
nationality, due to a takeover or merger. Both of these samples include both greenfield
entrants and incumbents. The findings suggest that establishments that are always
foreign-owned have significantly higher labour productivity than those that are always
domestic-owned. In addition, labour productivity improves faster with age in foreign-
owned establishments. This is matched by an equivalent difference in levels of
investment per employee. Both the proportion of skilled workers employed in the
workforce, and wages for both skilled and operative workers are higher in foreign-
owned establishments than domestic -owned, in line with differences in labour
productivity. Domestic establishments that are taken over by a foreign-owned firm do
not have higher labour productivity, though their labour productivity improves faster
after being taken over than that of establishments that go from being foreign to
domestic-owned.
The remainder of the paper is structured as follows. The next section describes the data,
and section 3 presents some descriptive statistics on trends in foreign-ownership in
Britain. Section 4 examines differences between domestic and foreign-owned
establishments, and a final section summarises. A more detailed description of the data
is given in an appendix.
7 See, inter alia, Disney et al (2000) and Doms and Jensen (1998).
6
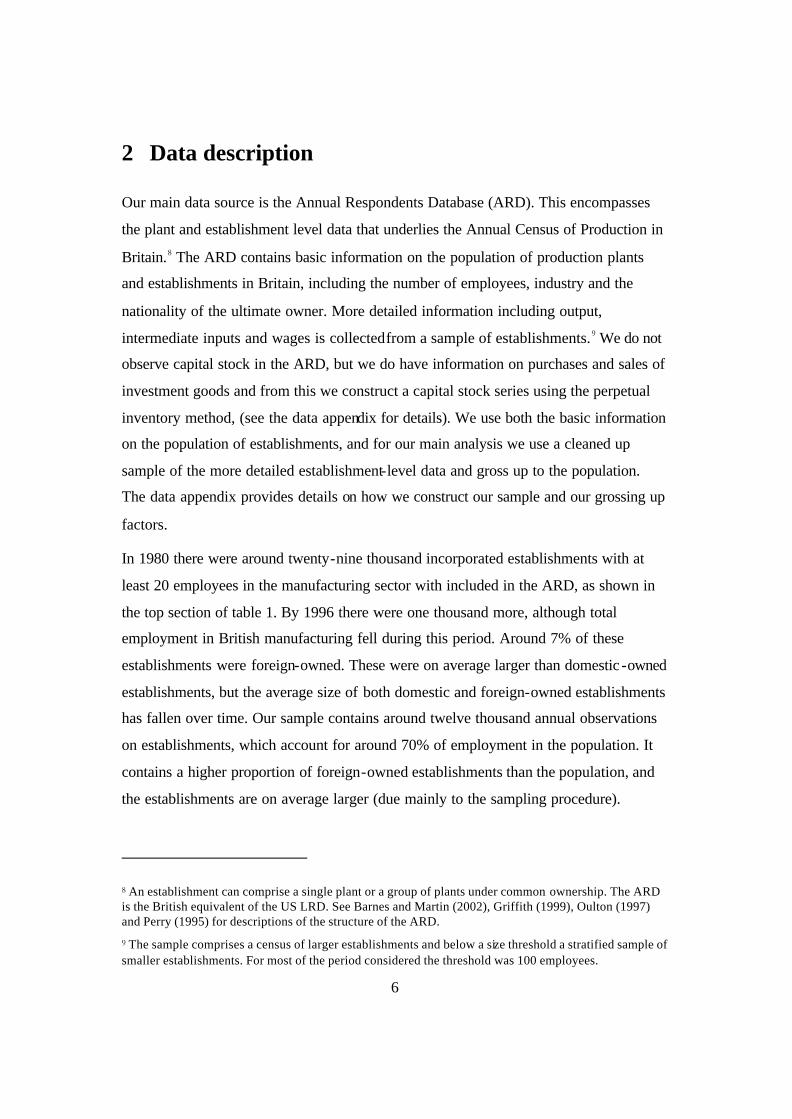
2 Data description
Our main data source is the Annual Respondents Database (ARD). This encompasses
the plant and establishment level data that underlies the Annual Census of Production in
Britain.8 The ARD contains basic information on the population of production plants
and establishments in Britain, including the number of employees, industry and the
nationality of the ultimate owner. More detailed information including output,
intermediate inputs and wages is collected from a sample of establishments.9 We do not
observe capital stock in the ARD, but we do have information on purchases and sales of
investment goods and from this we construct a capital stock series using the perpetual
inventory method, (see the data appendix for details). We use both the basic information
on the population of establishments, and for our main analysis we use a cleaned up
sample of the more detailed establishment-level data and gross up to the population.
The data appendix provides details on how we construct our sample and our grossing up
factors.
In 1980 there were around twenty-nine thousand incorporated establishments with at
least 20 employees in the manufacturing sector with included in the ARD, as shown in
the top section of table 1. By 1996 there were one thousand more, although total
employment in British manufacturing fell during this period. Around 7% of these
establishments were foreign-owned. These were on average larger than domestic -owned
establishments, but the average size of both domestic and foreign-owned establishments
has fallen over time. Our sample contains around twelve thousand annual observations
on establishments, which account for around 70% of employment in the population. It
contains a higher proportion of foreign-owned establishments than the population, and
the establishments are on average larger (due mainly to the sampling procedure).
8 An establishment can comprise a single plant or a group of plants under common ownership. The ARD is the British equivalent of the US LRD. See Barnes and Martin (2002), Griffith (1999), Oulton (1997) and Perry (1995) for descriptions of the structure of the ARD.
9 The sample comprises a census of larger establishments and below a size threshold a stratified sample of smaller establishments. For most of the period considered the threshold was 100 employees.
7
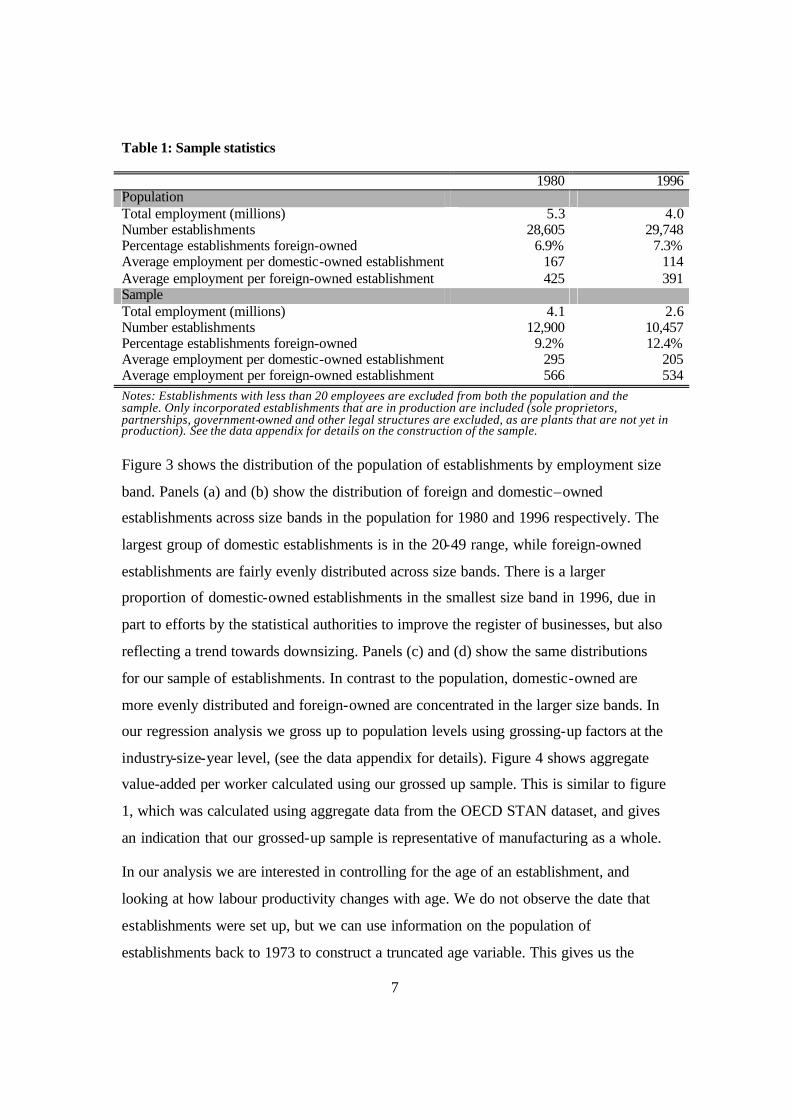
Table 1: Sample statistics
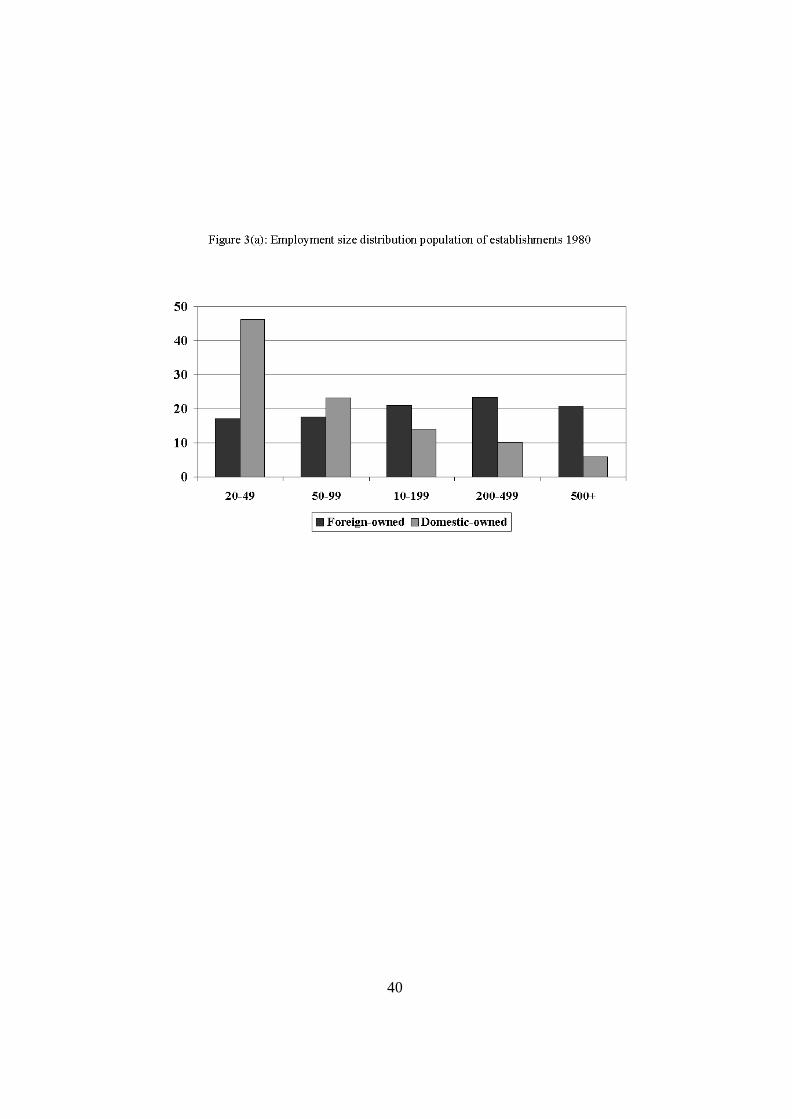
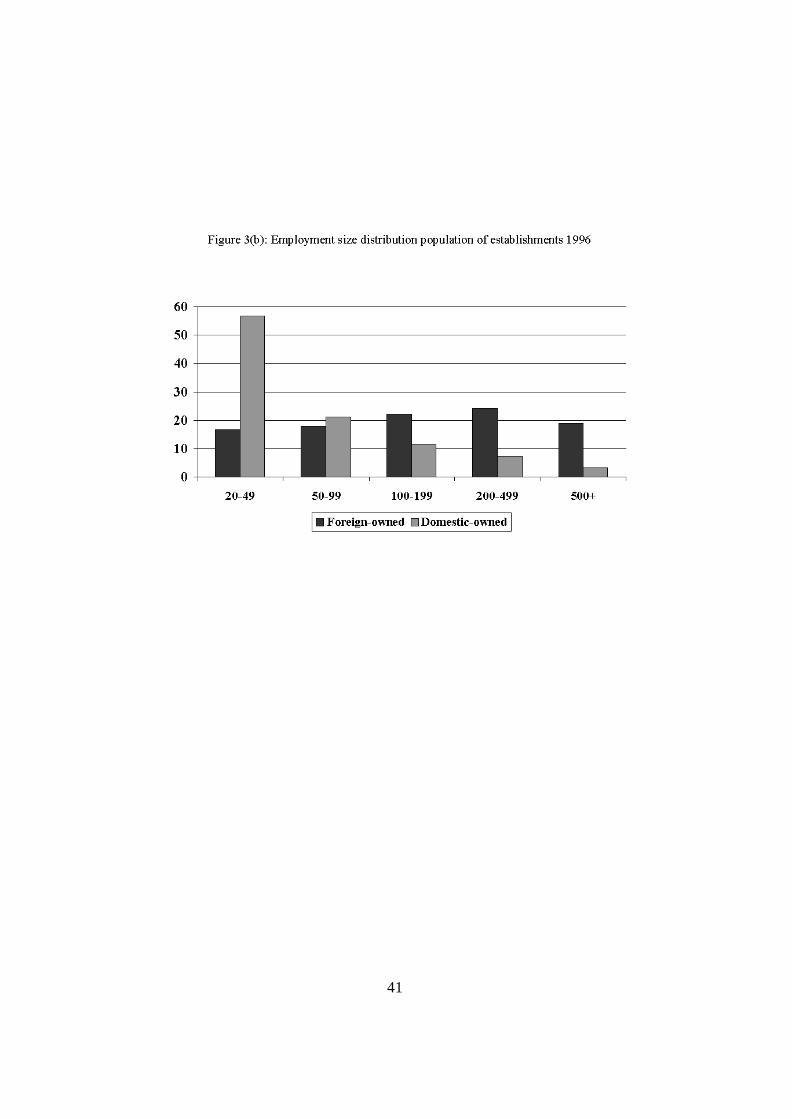
1980 1996 Population Total employment (millions) 5.3 4.0 Number establishments 28,605 29,748 Percentage establishments foreign-owned 6.9% 7.3% Average employment per domestic-owned establishment 167 114 Average employment per foreign-owned establishment 425 391 Sample Total employment (millions) 4.1 2.6 Number establishments 12,900 10,457 Percentage establishments foreign-owned 9.2% 12.4% Average employment per domestic-owned establishment 295 205 Average employment per foreign-owned establishment 566 534 Notes: Establishments with less than 20 employees are excluded from both the population and the sample. Only incorporated establishments that are in production are included (sole proprietors, partnerships, government-owned and other legal structures are excluded, as are plants that are not yet in production). See the data appendix for details on the construction of the sample. Figure 3 shows the distribution of the population of establishments by employment size
band. Panels (a) and (b) show the distribution of foreign and domestic–owned
establishments across size bands in the population for 1980 and 1996 respectively. The
largest group of domestic establishments is in the 20-49 range, while foreign-owned
establishments are fairly evenly distributed across size bands. There is a larger
proportion of domestic-owned establishments in the smallest size band in 1996, due in
part to efforts by the statistical authorities to improve the register of businesses, but also
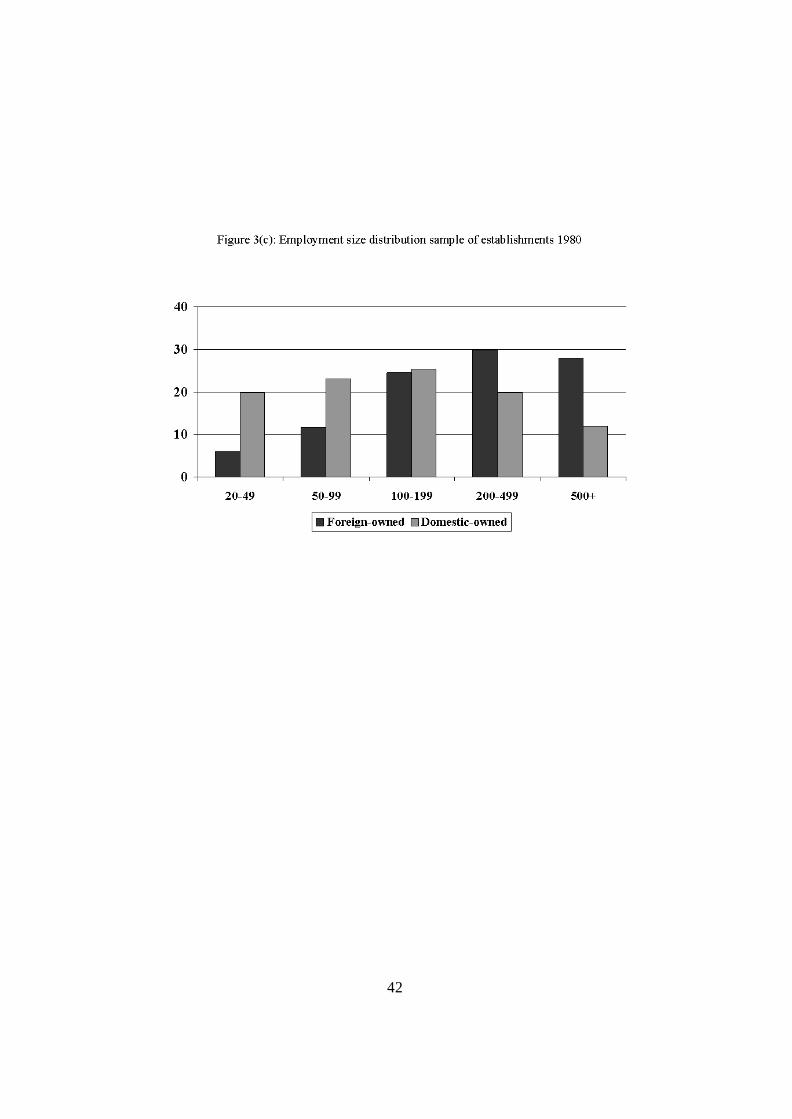
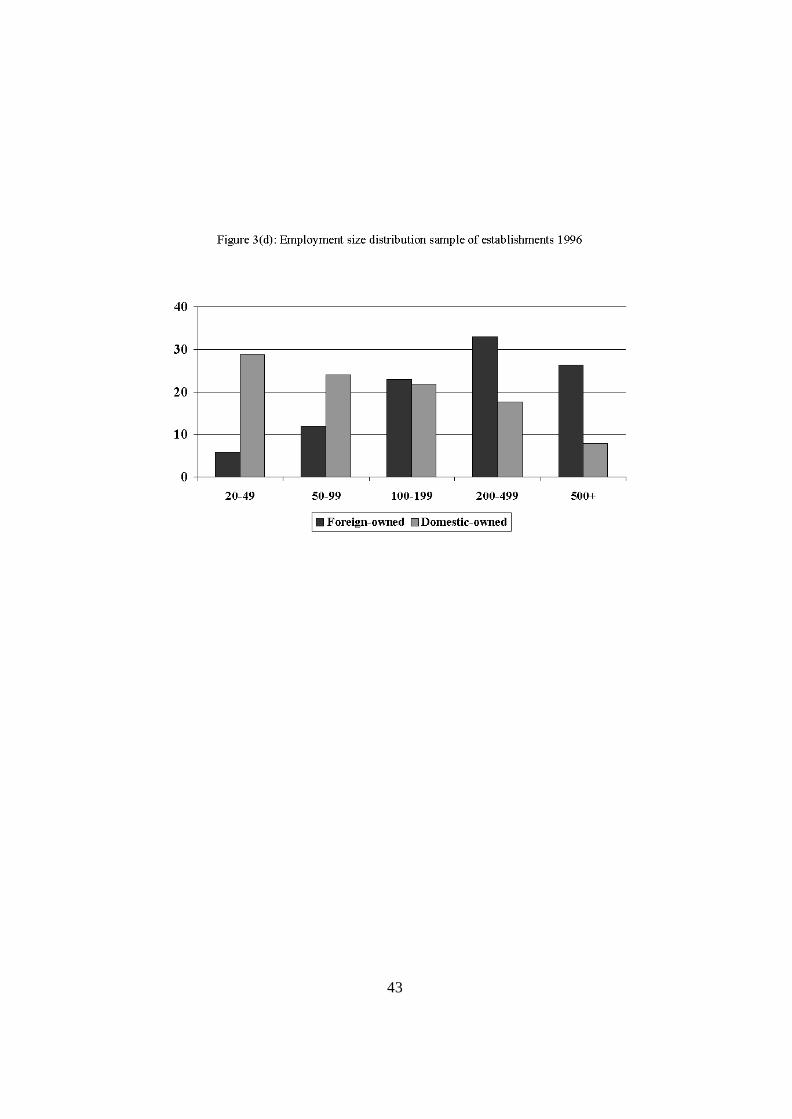
reflecting a trend towards downsizing. Panels (c) and (d) show the same distributions
for our sample of establishments. In contrast to the population, domestic-owned are
more evenly distributed and foreign-owned are concentrated in the larger size bands. In
our regression analysis we gross up to population levels using grossing-up factors at the
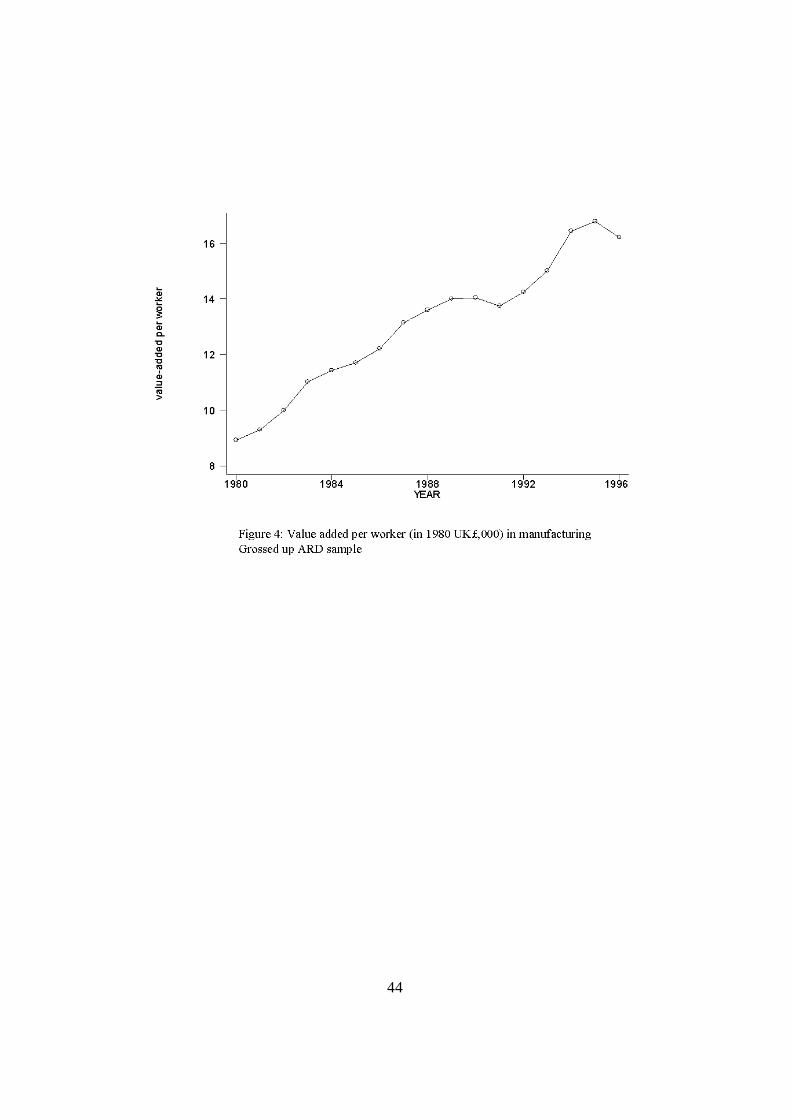
industry-size-year level, (see the data appendix for details). Figure 4 shows aggregate
value-added per worker calculated using our grossed up sample. This is similar to figure
1, which was calculated using aggregate data from the OECD STAN dataset, and gives
an indication that our grossed-up sample is representative of manufacturing as a whole.
In our analysis we are interested in controlling for the age of an establishment, and
looking at how labour productivity changes with age. We do not observe the date that
establishments were set up, but we can use information on the population of
establishments back to 1973 to construct a truncated age variable. This gives us the
8
length of time that a particular production facility has existed, that is, it is linked to the
physical existence of the plant rather than to ownership.
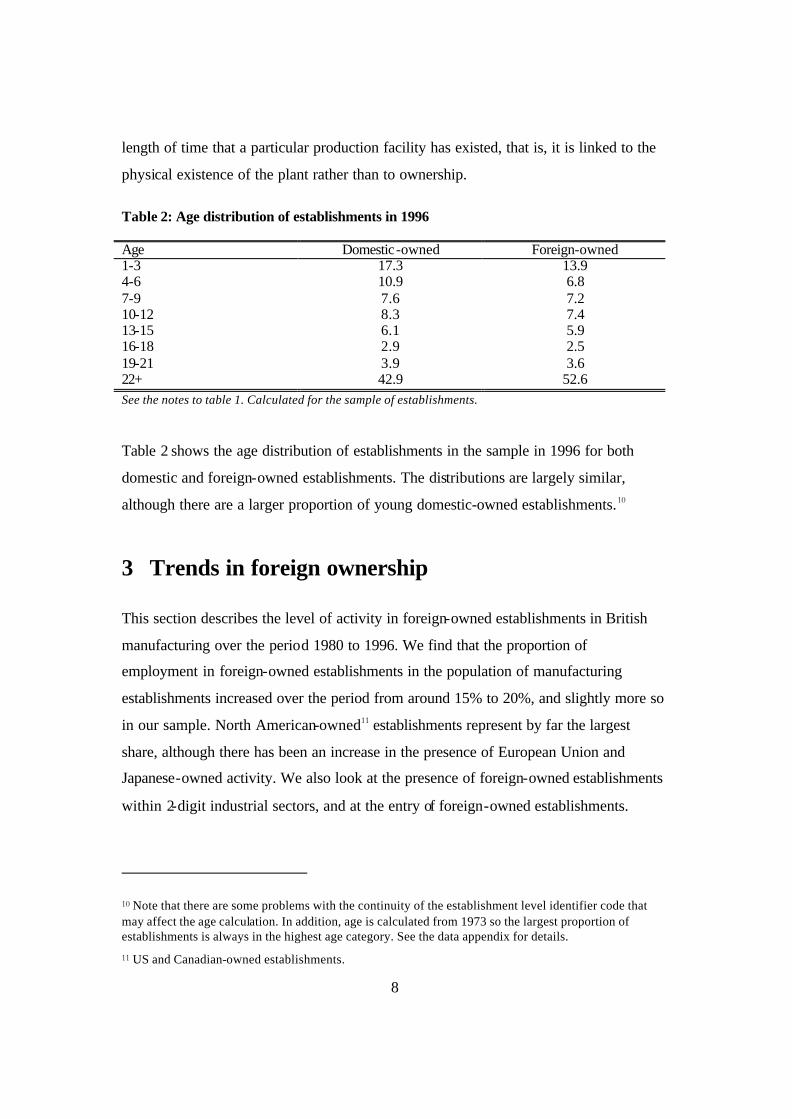
Table 2: Age distribution of establishments in 1996
Age Domestic-owned Foreign-owned 1-3 17.3 13.9 4-6 10.9 6.8 7-9 7.6 7.2 10-12 8.3 7.4 13-15 6.1 5.9 16-18 2.9 2.5 19-21 3.9 3.6 22+ 42.9 52.6 See the notes to table 1. Calculated for the sample of establishments.
Table 2 shows the age distribution of establishments in the sample in 1996 for both
domestic and foreign-owned establishments. The distributions are largely similar,
although there are a larger proportion of young domestic-owned establishments.10
3 Trends in foreign ownership
This section describes the level of activity in foreign-owned establishments in British
manufacturing over the period 1980 to 1996. We find that the proportion of
employment in foreign-owned establishments in the population of manufacturing
establishments increased over the period from around 15% to 20%, and slightly more so
in our sample. North American-owned11 establishments represent by far the largest
share, although there has been an increase in the presence of European Union and
Japanese-owned activity. We also look at the presence of foreign-owned establishments
within 2-digit industrial sectors, and at the entry of foreign-owned establishments.
10 Note that there are some problems with the continuity of the establishment level identifier code that may affect the age calculation. In addition, age is calculated from 1973 so the largest proportion of establishments is always in the highest age category. See the data appendix for details.
11 US and Canadian-owned establishments.
9
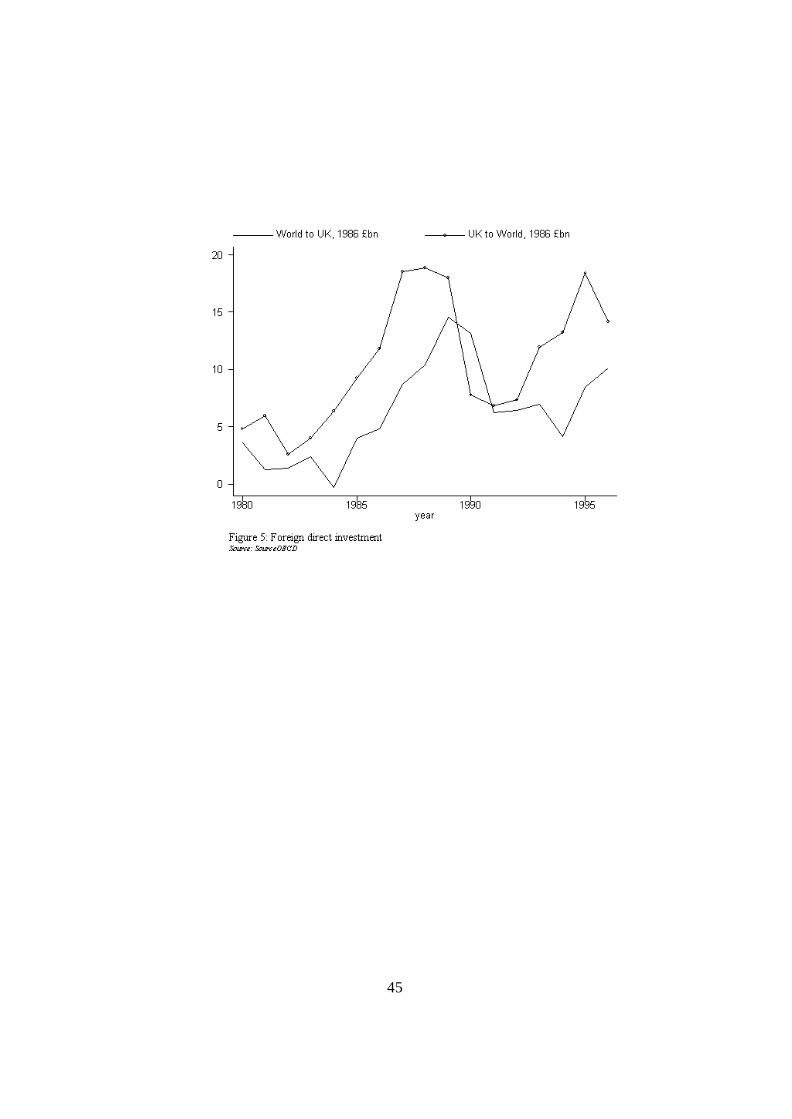
We analyse the real production activity of foreign-owned establishments located in
Britain. Much empirical research addressing the issue of how multinational investment
affects the local economy has used data on the flows or stocks of foreign direct
investment. Figure 5 shows the time trend in inward and outward foreign direct
investment12 from the UK. This rose over the 1980s, fell off during the early 1990s and
recovered up to the mid 1990s (since 1996 it has grown much more rapidly). But,
foreign production (or even investment by foreign-owned firms), and foreign direct
investment are not the same thing. The former is a measure of the amount of real
activity that is undertaken by a firm that is resident in another country, while the latter is
a measure of the flow of financial capital. They will differ to the extent that foreign-
owned firms finance expenditure from local capital markets and repatriate profits back
to the parent country. This difference is pointed out by Auerbach and Hassett (1993).
Grubert and Mutti (1991) show that the two series are unrelated using data on US firms
investment in Canada.
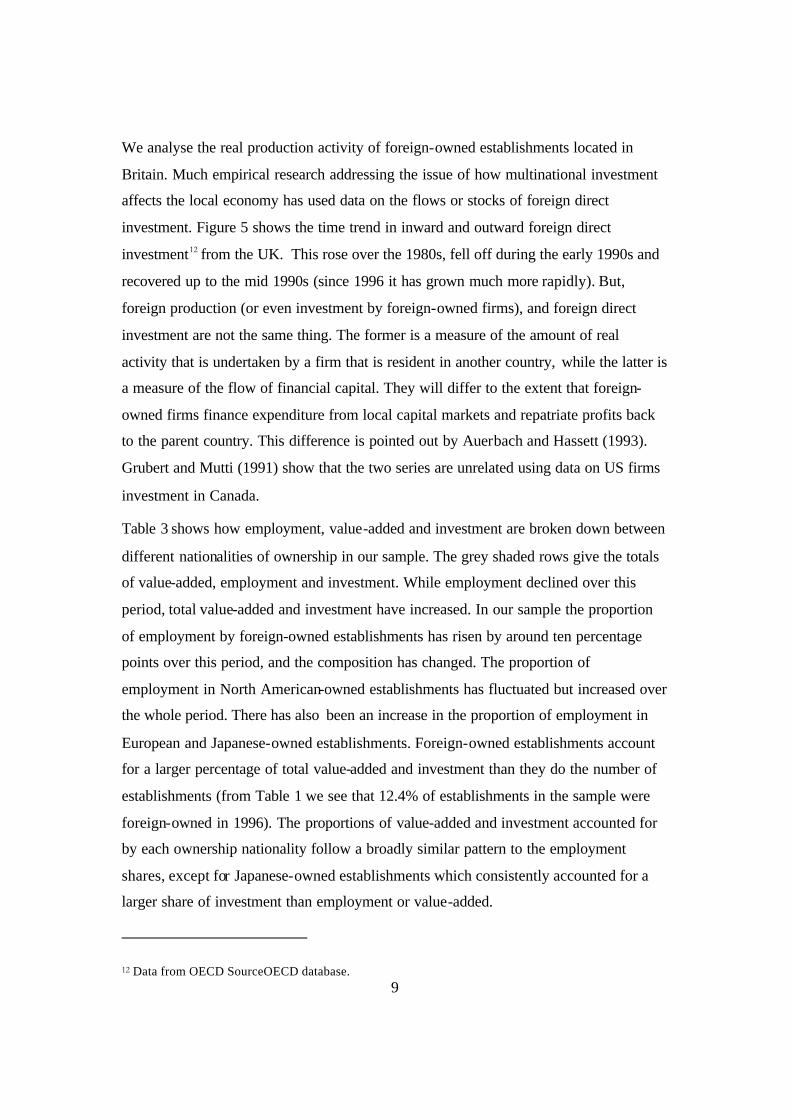
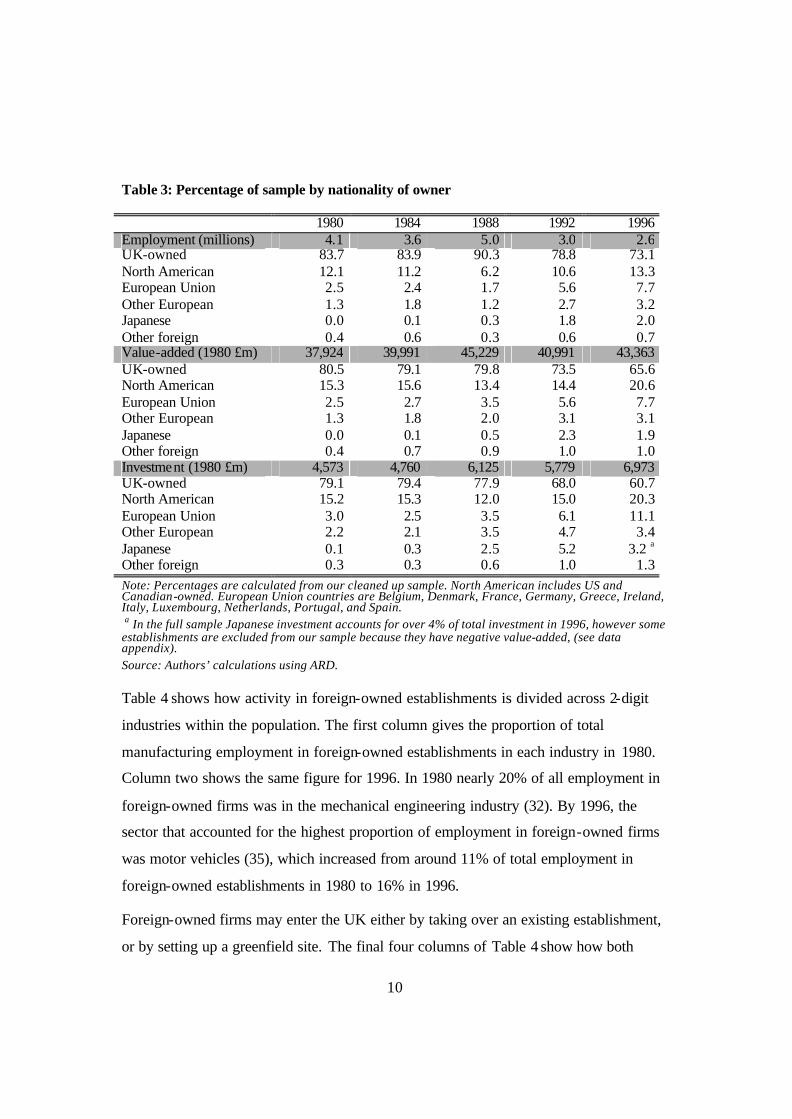
Table 3 shows how employment, value-added and investment are broken down between
different nationalities of ownership in our sample. The grey shaded rows give the totals
of value-added, employment and investment. While employment declined over this
period, total value-added and investment have increased. In our sample the proportion
of employment by foreign-owned establishments has risen by around ten percentage
points over this period, and the composition has changed. The proportion of
employment in North American-owned establishments has fluctuated but increased over
the whole period. There has also been an increase in the proportion of employment in
European and Japanese-owned establishments. Foreign-owned establishments account
for a larger percentage of total value-added and investment than they do the number of
establishments (from Table 1 we see that 12.4% of establishments in the sample were
foreign-owned in 1996). The proportions of value-added and investment accounted for
by each ownership nationality follow a broadly similar pattern to the employment
shares, except for Japanese-owned establishments which consistently accounted for a
larger share of investment than employment or value-added.
12 Data from OECD SourceOECD database.
10
Table 3: Percentage of sample by nationality of owner
1980 1984 1988 1992 1996 Employment (millions) 4.1 3.6 5.0 3.0 2.6 UK-owned 83.7 83.9 90.3 78.8 73.1 North American 12.1 11.2 6.2 10.6 13.3 European Union 2.5 2.4 1.7 5.6 7.7 Other European 1.3 1.8 1.2 2.7 3.2 Japanese 0.0 0.1 0.3 1.8 2.0 Other foreign 0.4 0.6 0.3 0.6 0.7 Value-added (1980 £m) 37,924 39,991 45,229 40,991 43,363 UK-owned 80.5 79.1 79.8 73.5 65.6 North American 15.3 15.6 13.4 14.4 20.6 European Union 2.5 2.7 3.5 5.6 7.7 Other European 1.3 1.8 2.0 3.1 3.1 Japanese 0.0 0.1 0.5 2.3 1.9 Other foreign 0.4 0.7 0.9 1.0 1.0 Investment (1980 £m) 4,573 4,760 6,125 5,779 6,973 UK-owned 79.1 79.4 77.9 68.0 60.7 North American 15.2 15.3 12.0 15.0 20.3 European Union 3.0 2.5 3.5 6.1 11.1 Other European 2.2 2.1 3.5 4.7 3.4 Japanese 0.1 0.3 2.5 5.2 3.2 a
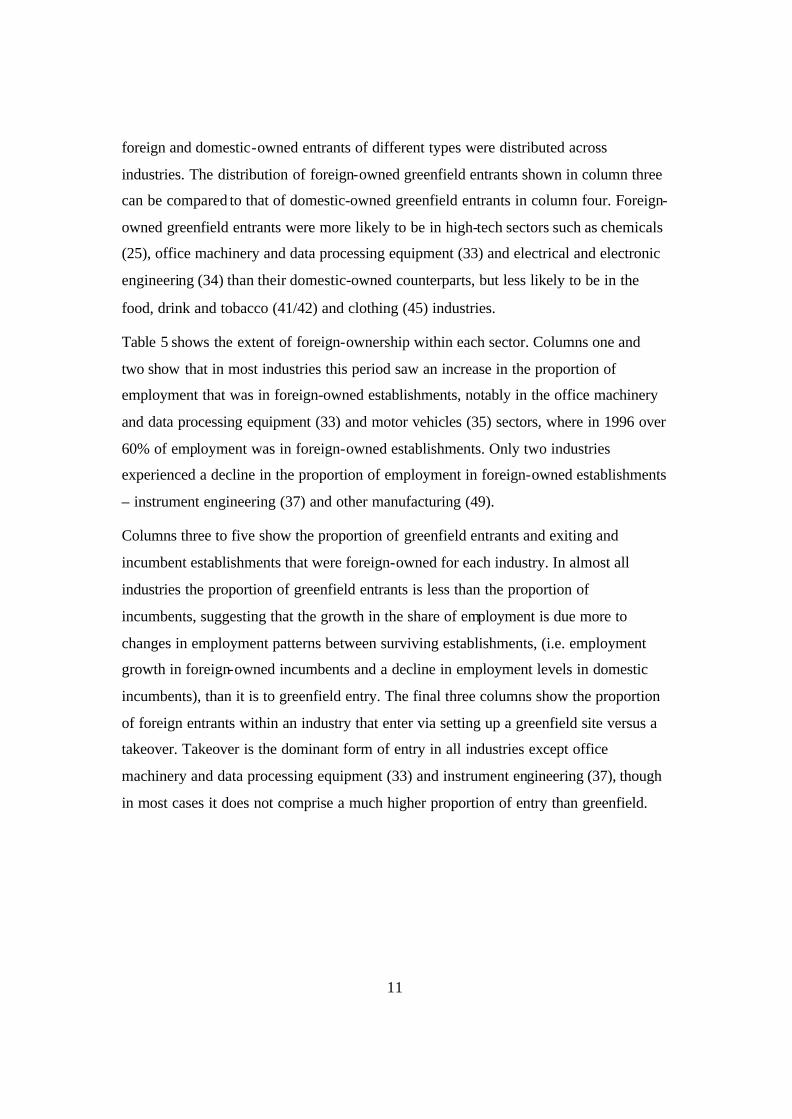
Other foreign 0.3 0.3 0.6 1.0 1.3 Note: Percentages are calculated from our cleaned up sample. North American includes US and Canadian-owned. European Union countries are Belgium, Denmark, France, Germany, Greece, Ireland, Italy, Luxembourg, Netherlands, Portugal, and Spain. a In the full sample Japanese investment accounts for over 4% of total investment in 1996, however some establishments are excluded from our sample because they have negative value-added, (see data appendix). Source: Authors’ calculations using ARD. Table 4 shows how activity in foreign-owned establishments is divided across 2-digit
industries within the population. The first column gives the proportion of total
manufacturing employment in foreign-owned establishments in each industry in 1980.
Column two shows the same figure for 1996. In 1980 nearly 20% of all employment in
foreign-owned firms was in the mechanical engineering industry (32). By 1996, the
sector that accounted for the highest proportion of employment in foreign-owned firms
was motor vehicles (35), which increased from around 11% of total employment in
foreign-owned establishments in 1980 to 16% in 1996.
Foreign-owned firms may enter the UK either by taking over an existing establishment,
or by setting up a greenfield site. The final four columns of Table 4 show how both
11
foreign and domestic-owned entrants of different types were distributed across
industries. The distribution of foreign-owned greenfield entrants shown in column three
can be compared to that of domestic-owned greenfield entrants in column four. Foreign-
owned greenfield entrants were more likely to be in high-tech sectors such as chemicals
(25), office machinery and data processing equipment (33) and electrical and electronic
engineering (34) than their domestic-owned counterparts, but less likely to be in the
food, drink and tobacco (41/42) and clothing (45) industries.
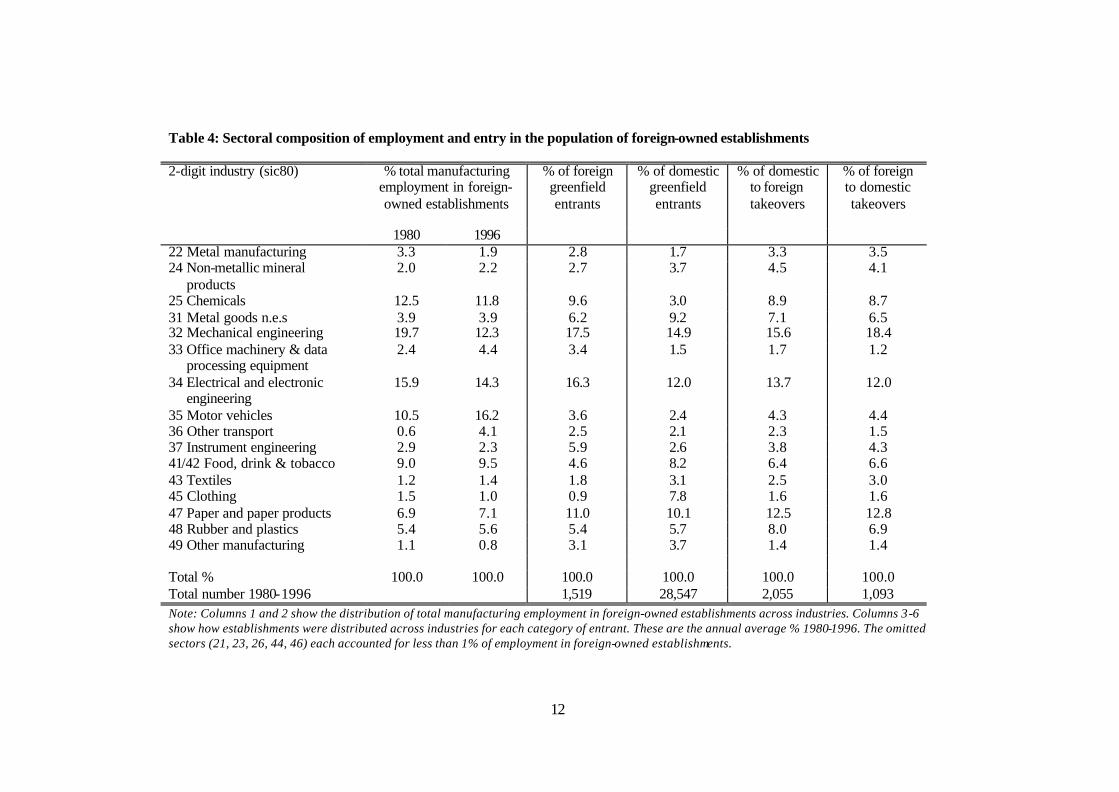
Table 5 shows the extent of foreign-ownership within each sector. Columns one and
two show that in most industries this period saw an increase in the proportion of
employment that was in foreign-owned establishments, notably in the office machinery
and data processing equipment (33) and motor vehicles (35) sectors, where in 1996 over
60% of employment was in foreign-owned establishments. Only two industries
experienced a decline in the proportion of employment in foreign-owned establishments
– instrument engineering (37) and other manufacturing (49).
Columns three to five show the proportion of greenfield entrants and exiting and
incumbent establishments that were foreign-owned for each industry. In almost all
industries the proportion of greenfield entrants is less than the proportion of
incumbents, suggesting that the growth in the share of employment is due more to
changes in employment patterns between surviving establishments, (i.e. employment
growth in foreign-owned incumbents and a decline in employment levels in domestic
incumbents), than it is to greenfield entry. The final three columns show the proportion
of foreign entrants within an industry that enter via setting up a greenfield site versus a
takeover. Takeover is the dominant form of entry in all industries except office
machinery and data processing equipment (33) and instrument engineering (37), though
in most cases it does not comprise a much higher proportion of entry than greenfield.
12
Table 4: Sectoral composition of employment and entry in the population of foreign-owned establishments
2-digit industry (sic80) % total manufacturing employment in foreign-owned establishments
% of foreign greenfield entrants
% of domestic greenfield entrants
% of domestic to foreign takeovers
% of foreign to domestic takeovers
1980 1996 22 Metal manufacturing 3.3 1.9 2.8 1.7 3.3 3.5 24 Non-metallic mineral
products 2.0 2.2 2.7 3.7 4.5 4.1
25 Chemicals 12.5 11.8 9.6 3.0 8.9 8.7 31 Metal goods n.e.s 3.9 3.9 6.2 9.2 7.1 6.5 32 Mechanical engineering 19.7 12.3 17.5 14.9 15.6 18.4 33 Office machinery & data
processing equipment 2.4 4.4 3.4 1.5 1.7 1.2
34 Electrical and electronic engineering
15.9 14.3 16.3 12.0 13.7 12.0
35 Motor vehicles 10.5 16.2 3.6 2.4 4.3 4.4 36 Other transport 0.6 4.1 2.5 2.1 2.3 1.5 37 Instrument engineering 2.9 2.3 5.9 2.6 3.8 4.3 41/42 Food, drink & tobacco 9.0 9.5 4.6 8.2 6.4 6.6 43 Textiles 1.2 1.4 1.8 3.1 2.5 3.0 45 Clothing 1.5 1.0 0.9 7.8 1.6 1.6 47 Paper and paper products 6.9 7.1 11.0 10.1 12.5 12.8 48 Rubber and plastics 5.4 5.6 5.4 5.7 8.0 6.9 49 Other manufacturing 1.1 0.8 3.1 3.7 1.4 1.4 Total % 100.0 100.0 100.0 100.0 100.0 100.0 Total number 1980-1996 1,519 28,547 2,055 1,093 Note: Columns 1 and 2 show the distribution of total manufacturing employment in foreign-owned establishments across industries. Columns 3-6 show how establishments were distributed across industries for each category of entrant. These are the annual average % 1980-1996. The omitted sectors (21, 23, 26, 44, 46) each accounted for less than 1% of employment in foreign-owned establishments.
13
Table 5: Within industry shares of foreign activity, 1980-1996
% industry employment in foreign-owned establishments
% industry foreign entrants that are:
2-digit industry (sic80)
1980 1996
% industry
greenfield entrants
% industry
exits
% industry
incumbents greenfield takeover
that are foreign D-F F-F 22 Metal manufacturing 16.2 15.7 7.8 9.4 11.5 36.8 59.75 a
24 Non-metallic mineral products
6.8 11.3 3.7 4.9 5.9 29.9 67.2 a
25 Chemicals 31.2 38.0 14.5 21.1 23.5 41.2 51.4 7.4 31 Metal goods n.e.s 8.3 14.3 3.5 3.7 3.9 37.0 57.5 5.5 32 Mechanical engineering 21.1 23.2 5.9 7.6 7.6 41.9 50.6 7.4 33 Office machinery and data
processing equipment 48.3 67.4 10.7 13.4 17.9 58.4 38.2 a
34 Electrical and electronic engineering
20.8 27.0 6.7 11.4 11.1 44.0 50.1 5.9
35 Motor vehicles 23.1 61.9 7.3 7.4 10.0 36.0 58.7 5.3 36 Other transport 3.0 18.6 6.1 6.2 6.2 41.8 51.7 6.6 37 Instrument engineering 28.0 22.6 10.8 14.7 11.2 51.2 45.4 3.5 41/42 Food, drink & tobacco 11.5 16.7 2.9 4.6 5.3 33.0 62.3 4.7 43 Textiles 3.3 7.5 3.0 2.9 2.6 32.1 60.7 7.1 45 Clothing 3.8 4.8 0.6 1.2 1.5 28.6 67.4 a
47 Paper and paper products 13.1 16.8 5.5 7.8 6.6 37.3 57.4 5.4 48 Rubber and plastics 19.2 23.2 4.8 6.3 7.6 31.7 63.7 4.6 49 Other manufacturing 14.9 12.0 4.3 6.2 4.5 58.8 36.3 a
Mean 18.7 24.7 7.8 9.4 7.9 41.3 51.3 7.4 Note: Columns 1 and 2 show the annual average percentage of employment in foreign-owned establishments within each industry, 1980-1996. Columns 3-8 show the annual average percentage of establishments within each industry for each category, 1980-1996. The omitted sectors (21, 23, 26, 44, 46) each account for less than 1% of employment in foreign-owned establishments. a Figures cannot be disclosed for data confidentiality reasons.
14
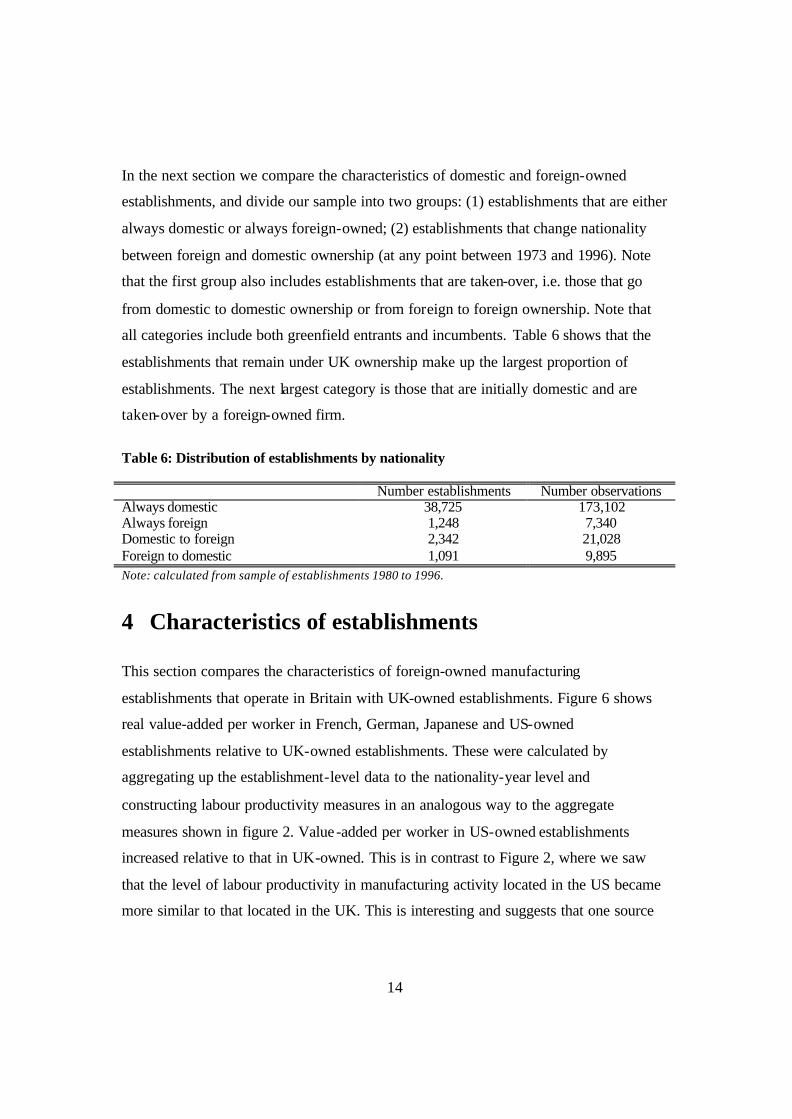
In the next section we compare the characteristics of domestic and foreign-owned
establishments, and divide our sample into two groups: (1) establishments that are either
always domestic or always foreign-owned; (2) establishments that change nationality
between foreign and domestic ownership (at any point between 1973 and 1996). Note
that the first group also includes establishments that are taken-over, i.e. those that go
from domestic to domestic ownership or from foreign to foreign ownership. Note that
all categories include both greenfield entrants and incumbents. Table 6 shows that the
establishments that remain under UK ownership make up the largest proportion of
establishments. The next largest category is those that are initially domestic and are
taken-over by a foreign-owned firm.
Table 6: Distribution of establishments by nationality
Number establishments Number observations Always domestic 38,725 173,102 Always foreign 1,248 7,340 Domestic to foreign 2,342 21,028 Foreign to domestic 1,091 9,895 Note: calculated from sample of establishments 1980 to 1996.
4 Characteristics of establishments
This section compares the characteristics of foreign-owned manufacturing
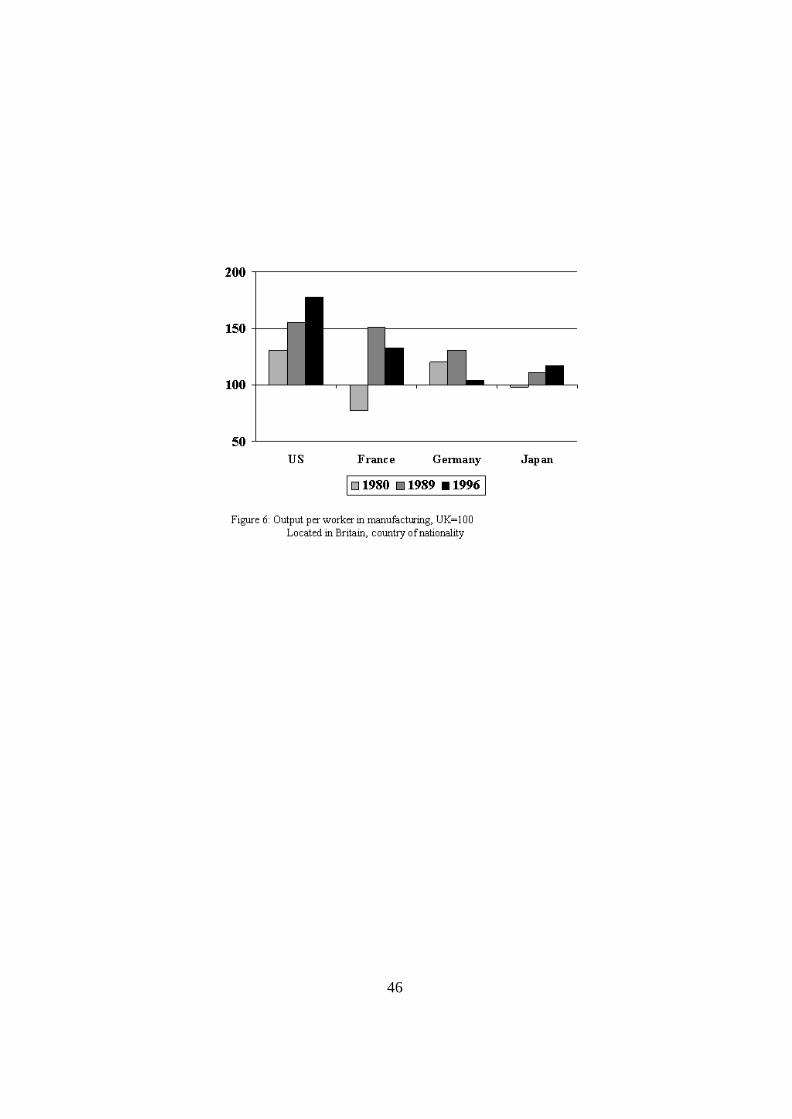
establishments that operate in Britain with UK-owned establishments. Figure 6 shows
real value-added per worker in French, German, Japanese and US-owned
establishments relative to UK-owned establishments. These were calculated by
aggregating up the establishment-level data to the nationality-year level and
constructing labour productivity measures in an analogous way to the aggregate
measures shown in figure 2. Value-added per worker in US-owned establishments
increased relative to that in UK-owned. This is in contrast to Figure 2, where we saw
that the level of labour productivity in manufacturing activity located in the US became
more similar to that located in the UK. This is interesting and suggests that one source
15
of the convergence seen in Figure 2 may be the increased productivity of US-owned
establishments located in Britain.
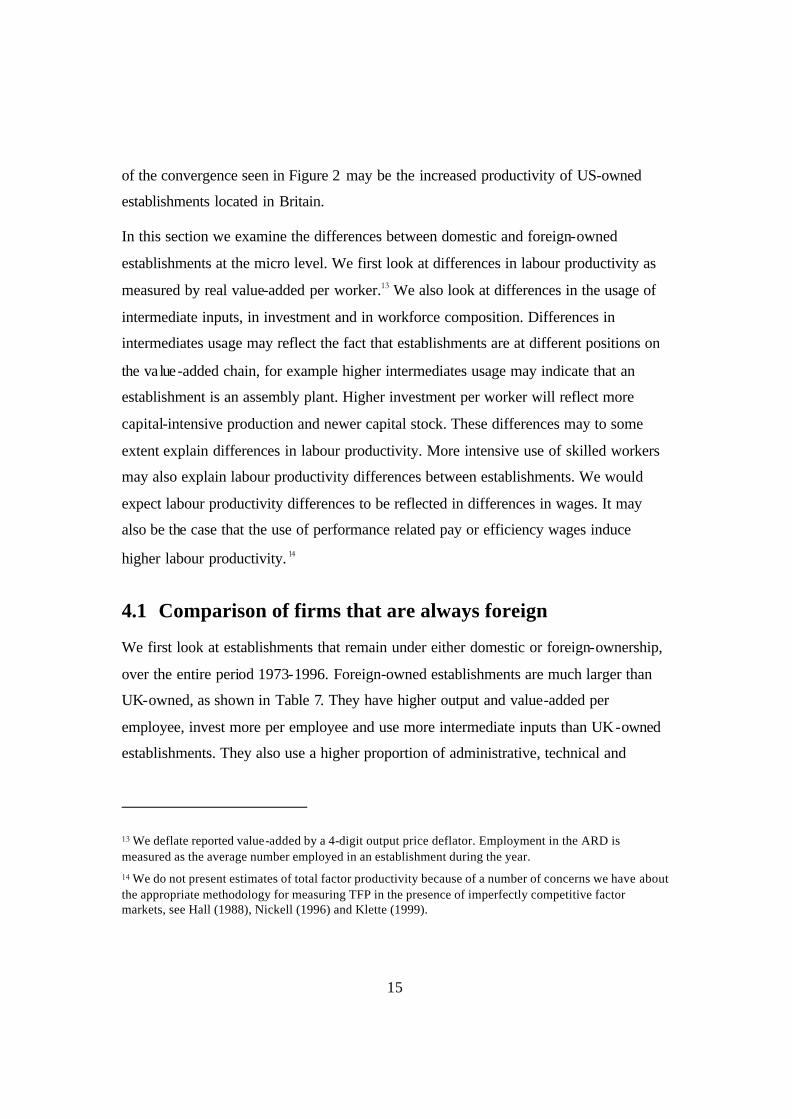
In this section we examine the differences between domestic and foreign-owned
establishments at the micro level. We first look at differences in labour productivity as
measured by real value-added per worker.13 We also look at differences in the usage of
intermediate inputs, in investment and in workforce composition. Differences in
intermediates usage may reflect the fact that establishments are at different positions on
the value-added chain, for example higher intermediates usage may indicate that an
establishment is an assembly plant. Higher investment per worker will reflect more
capital-intensive production and newer capital stock. These differences may to some
extent explain differences in labour productivity. More intensive use of skilled workers
may also explain labour productivity differences between establishments. We would
expect labour productivity differences to be reflected in differences in wages. It may
also be the case that the use of performance related pay or efficiency wages induce
higher labour productivity. 14
4.1 Comparison of firms that are always foreign
We first look at establishments that remain under either domestic or foreign-ownership,
over the entire period 1973-1996. Foreign-owned establishments are much larger than
UK-owned, as shown in Table 7. They have higher output and value-added per
employee, invest more per employee and use more intermediate inputs than UK-owned
establishments. They also use a higher proportion of administrative, technical and
13 We deflate reported value-added by a 4-digit output price deflator. Employment in the ARD is measured as the average number employed in an establishment during the year. 14 We do not present estimates of total factor productivity because of a number of concerns we have about the appropriate methodology for measuring TFP in the presence of imperfectly competitive factor markets, see Hall (1988), Nickell (1996) and Klette (1999).
16
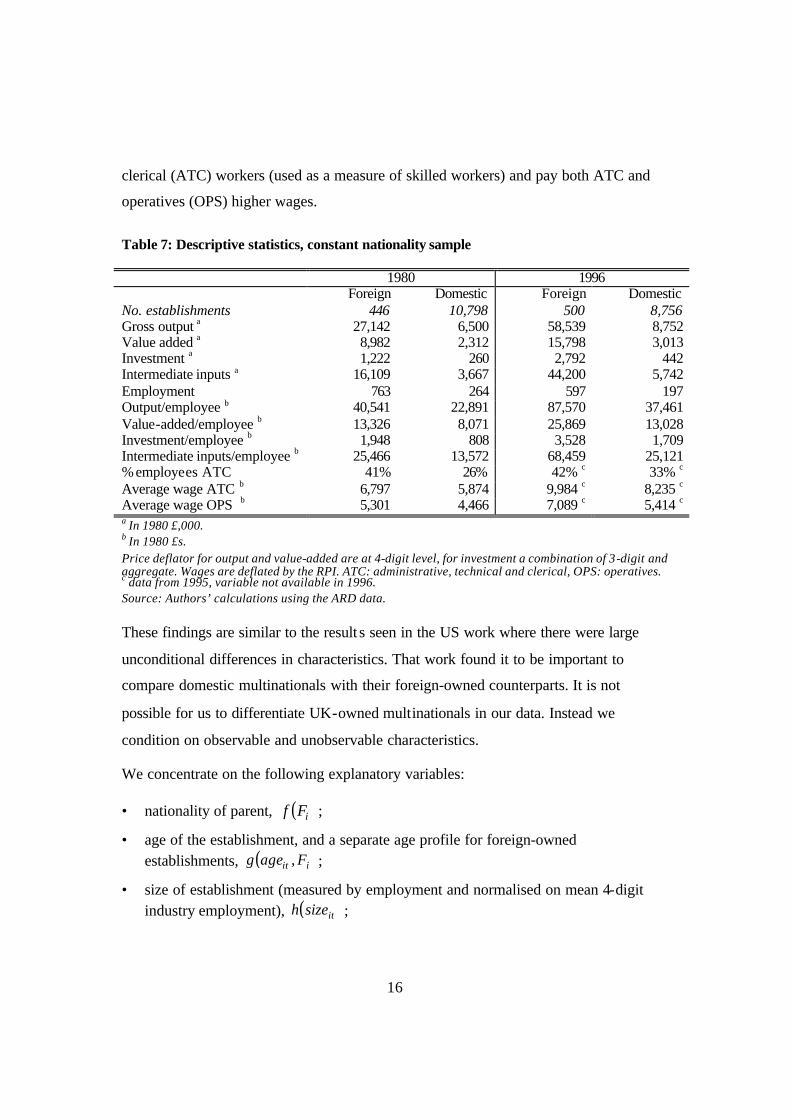
clerical (ATC) workers (used as a measure of skilled workers) and pay both ATC and
operatives (OPS) higher wages.
Table 7: Descriptive statistics, constant nationality sample
1980 1996 Foreign Domestic Foreign Domestic No. establishments 446 10,798 500 8,756 Gross output a 27,142 6,500 58,539 8,752 Value added a 8,982 2,312 15,798 3,013 Investment a 1,222 260 2,792 442 Intermediate inputs a 16,109 3,667 44,200 5,742 Employment 763 264 597 197 Output/employee b 40,541 22,891 87,570 37,461 Value-added/employee b 13,326 8,071 25,869 13,028 Investment/employee b 1,948 808 3,528 1,709 Intermediate inputs/employee b 25,466 13,572 68,459 25,121 % employees ATC 41% 26% 42% c 33% c Average wage ATC b 6,797 5,874 9,984 c 8,235 c Average wage OPS b 5,301 4,466 7,089 c 5,414 c a In 1980 £,000. b In 1980 £s. Price deflator for output and value-added are at 4-digit level, for investment a combination of 3-digit and aggregate. Wages are deflated by the RPI. ATC: administrative, technical and clerical, OPS: operatives. c data from 1995, variable not available in 1996. Source: Authors’ calculations using the ARD data. These findings are similar to the result s seen in the US work where there were large
unconditional differences in characteristics. That work found it to be important to
compare domestic multinationals with their foreign-owned counterparts. It is not
possible for us to differentiate UK-owned multinationals in our data. Instead we
condition on observable and unobservable characteristics.
We concentrate on the following explanatory variables:
• nationality of parent, ( )iFf ;
• age of the establishment, and a separate age profile for foreign-owned establishments, ( )iit Fageg , ;
• size of establishment (measured by employment and normalised on mean 4-digit industry employment), ( )itsizeh ;
17
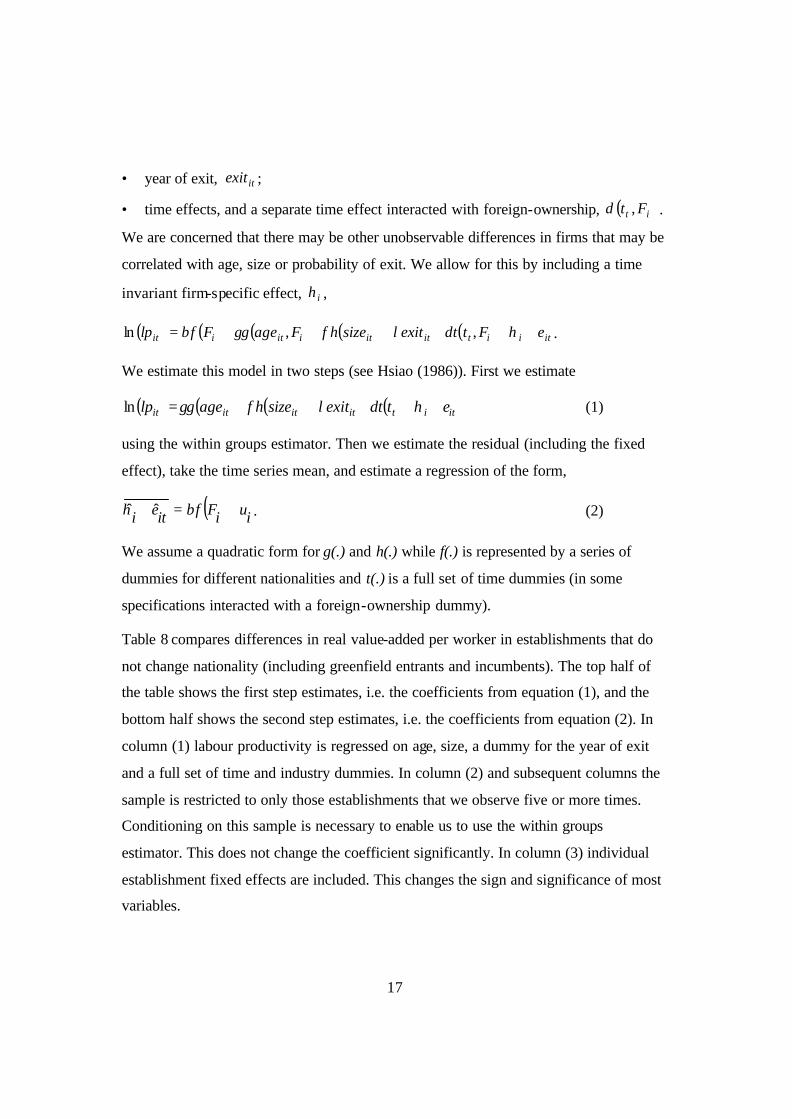
• year of exit, itexit ;
• time effects, and a separate time effect interacted with foreign-ownership, ( )it Ft ,δ .
We are concerned that there may be other unobservable differences in firms that may be
correlated with age, size or probability of exit. We allow for this by including a time
invariant firm-specific effect, iη ,
( ) ( ) ( ) ( ) ( ) itiitititiitiit eFttexitsizehFagegFflp ++++++= ηδλφγβ ,,ln .
We estimate this model in two steps (see Hsiao (1986)). First we estimate
( ) ( ) ( ) ( ) itititititit ettexitsizehageglp +++++= ηδλφγln (1)
using the within groups estimator. Then we estimate the residual (including the fixed
effect), take the time series mean, and estimate a regression of the form,
( ) iuiFfitei +=+ βη ˆˆ . (2)
We assume a quadratic form for g(.) and h(.) while f(.) is represented by a series of
dummies for different nationalities and t(.) is a full set of time dummies (in some
specifications interacted with a foreign-ownership dummy).
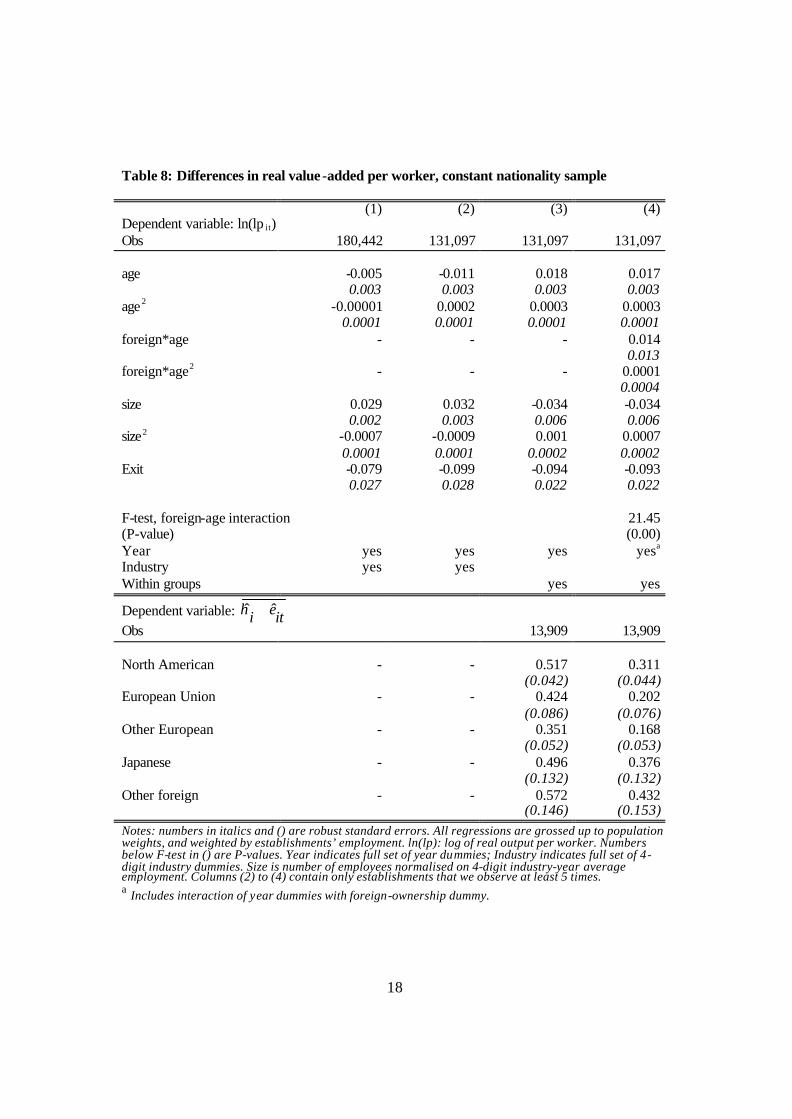
Table 8 compares differences in real value-added per worker in establishments that do
not change nationality (including greenfield entrants and incumbents). The top half of
the table shows the first step estimates, i.e. the coefficients from equation (1), and the
bottom half shows the second step estimates, i.e. the coefficients from equation (2). In
column (1) labour productivity is regressed on age, size, a dummy for the year of exit
and a full set of time and industry dummies. In column (2) and subsequent columns the
sample is restricted to only those establishments that we observe five or more times.
Conditioning on this sample is necessary to enable us to use the within groups
estimator. This does not change the coefficient significantly. In column (3) individual
establishment fixed effects are included. This changes the sign and significance of most
variables.
18
Table 8: Differences in real value -added per worker, constant nationality sample
(1) (2) (3) (4) Dependent variable: ln(lp it) Obs 180,442 131,097 131,097 131,097 age -0.005 -0.011 0.018 0.017 0.003 0.003 0.003 0.003 age2 -0.00001 0.0002 0.0003 0.0003 0.0001 0.0001 0.0001 0.0001 foreign*age - - - 0.014 0.013 foreign*age2 - - - 0.0001 0.0004 size 0.029 0.032 -0.034 -0.034 0.002 0.003 0.006 0.006 size2 -0.0007 -0.0009 0.001 0.0007 0.0001 0.0001 0.0002 0.0002 Exit -0.079 -0.099 -0.094 -0.093 0.027 0.028 0.022 0.022 F-test, foreign-age interaction (P-value)
21.45 (0.00)
Year yes yes yes yesa
Industry yes yes Within groups yes yes
Dependent variable: itei ˆˆ +η
Obs 13,909 13,909 North American - - 0.517 0.311 (0.042) (0.044) European Union - - 0.424 0.202 (0.086) (0.076) Other European - - 0.351 0.168 (0.052) (0.053) Japanese - - 0.496 0.376 (0.132) (0.132) Other foreign - - 0.572 0.432 (0.146) (0.153) Notes: numbers in italics and () are robust standard errors. All regressions are grossed up to population weights, and weighted by establishments’ employment. ln(lp): log of real output per worker. Numbers below F-test in () are P-values. Year indicates full set of year dummies; Industry indicates full set of 4-digit industry dummies. Size is number of employees normalised on 4-digit industry-year average employment. Columns (2) to (4) contain only establishments that we observe at least 5 times. a Includes interaction of year dummies with foreign-ownership dummy.
19
In column (3) we see that labour productivity is increasing in age, and at an increasing
rate, and is decreasing in size, though at a decreasing rate. This suggests that greenfield
entrants (age equals 1) have lower value-added per worker than incumbents.
Establishments have lower labour productivity in their year of exit than in previous
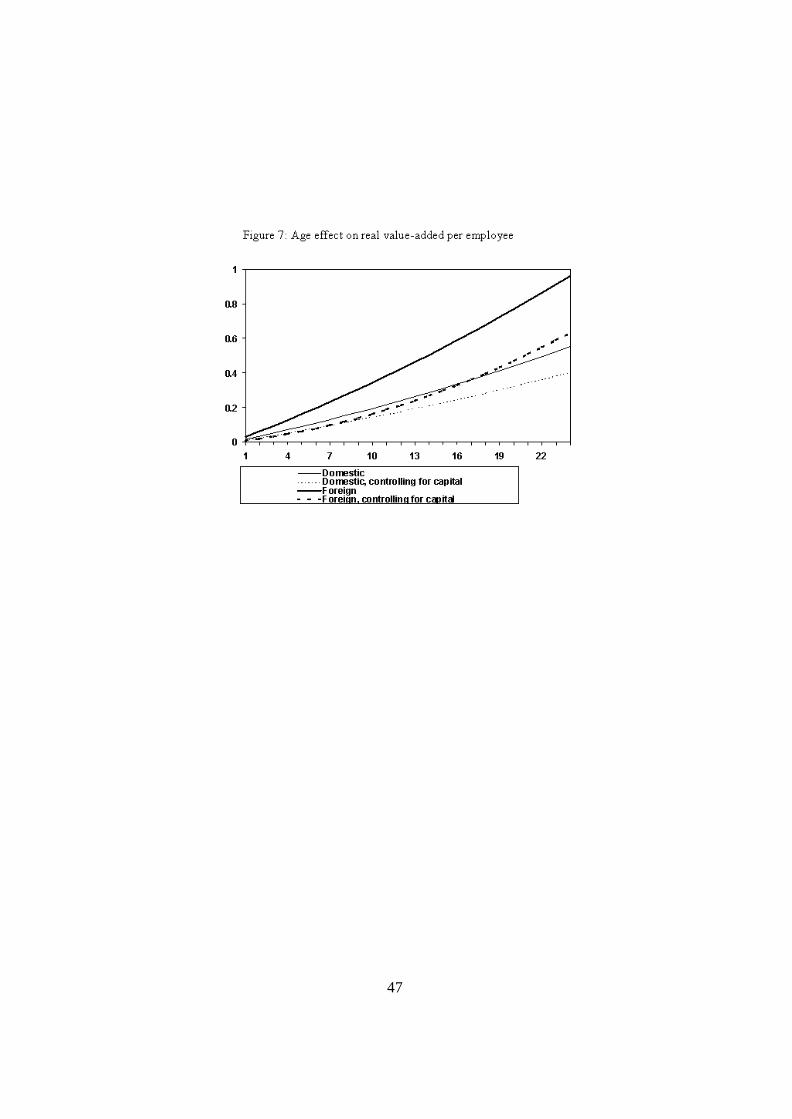
years. In column (4) we explore the idea that foreign-owned establishments may adapt
to new technologies better than UK-owned establishments. We do this by interacting a
foreign-ownership dummy with the age terms. If foreign-owned establishments improve
their productivity faster with age then this should be captured by this term. Although
these interactions are not individually significant they are jointly significant (as
indicated by the F-test). The domestic and foreign age effects are shown in figure 7 by
the solid lines, (the dashed lines are explained in the discussion after Table 9). After 24
years the contribution of the age effect is almost twice as large in foreign-owned
establishments as in domestic-owned. We also tried interacting the year dummies with
foreign-ownership. These were individually and jointly insignificant.
In the bottom half of the table we use the estimates from the top half to obtain estimates
of the unexplained part of labour productivity, itei ˆˆ +η , and regress this on dummies for
different nationalities of ownership, as described in equation (2). The results in column
(3) suggest that North American-owned establishments have around 68% higher labour
productivity than UK-owned, EU-owned around 53% higher, other European-owned
42% higher, Japanese-owned around 64% and other foreign around 77% higher.15 These
are all significant and quite large differences. In column (4) we repeat this exercise.
Conditioning on differences in the age profile explains some of the differences in labour
productivity, but large and significant differences remain. North American-owned
establishments have around 36% higher labour productivity than UK-owned, EU-owned
15 ( ) 1exp −β is approximately the proportional difference, where β is the coefficient on a dummy variable in a log-linear regression.
20
around 22% higher, other European-owned 18% higher, Japanese-owned around 46%
and other foreign around 54% higher.
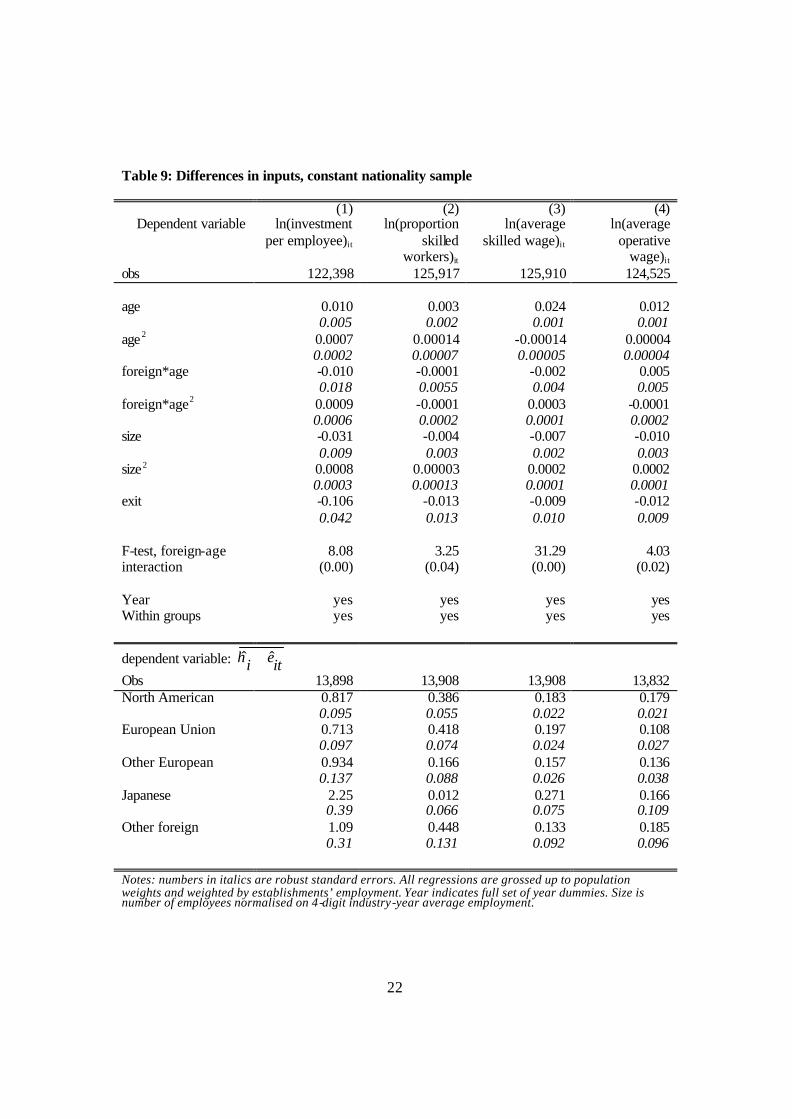
Differences in inputs are investigated in Table 9. In the first column we see that
investment per employee is increasing in age, at an increasing rate. The profile for
foreign firms is different, while the coefficients on the interaction between the foreign
dummy and age are individually insignificant they are jointly significant. Not
surprisingly, establishments invest less per employee in their final year before exit. In
the bottom half of the table the unexplained part of investment per employee is
regressed against the nationality of ownership dummies using the same procedure as
above and as described by equation (2). The coefficients are all positive and significant.
Their magnitude is larger than those for labour productivity. North American-owned
establishments invest twice as much per worker as UK-owned, EU-owned around twice
as much, other European-owned two and half times as much, Japanese-owned around
eight times as much and other foreign-owned around twice as much. This suggests that
the differences in value-added per worker seen in Table 8 are largely attributable to
differences in investment levels.
In figure 7 we investigate the extent to which the steeper age profile for labour
productivity in foreign-owned establishments is explained by differences in their capital
stocks. We run a regression of capital stock per employee similar to that shown in
column (1). We take the coefficients on the age and foreign-age profiles and subtract
them, multiplied by the average share of capital in value-added, from the age profiles
for labour productivity from column (4) in Table 8.16 These capital-adjusted age profiles
for labour productivity are shown by the dashed lines in figure 7. We see that the age
profiles are now very close for the first ten years. This is because foreign-owned firms
have both higher labour productivity and a correspondingly higher capital stock. After
22 years the adjusted profiles diverge by around 20 percentage points.
21
Finally we investigate differences in the type of workers employed and their average
wages. In column (2) we see that the proportion of skilled workers in an establishment’s
workforce is increasing in age and in size. We also see that foreign-owned
establishments employ more skilled (ATC) workers. This could also partly explain
higher levels of labour productivity. In columns (3) and (4) we see that wages are
increasing in age, decreasing in size and lower in the year before exit. We see that
foreign-owned establishments pay higher wages to both skilled workers and operatives,
which is consistent with higher levels of labour productivity.
16 The coefficients are age (0.015), age2 (0.00035), age*foreign (0.0657), age2 *foreign (0.0015). The average share of capital in value-added is 0.26.
22
Table 9: Differences in inputs, constant nationality sample
(1) (2) (3) (4) Dependent variable ln(investment
per employee)it ln(proportion
skilled workers)it
ln(average skilled wage)it
ln(average operative
wage)it obs 122,398 125,917 125,910 124,525 age 0.010 0.003 0.024 0.012 0.005 0.002 0.001 0.001 age2 0.0007 0.00014 -0.00014 0.00004 0.0002 0.00007 0.00005 0.00004 foreign*age -0.010 -0.0001 -0.002 0.005 0.018 0.0055 0.004 0.005 foreign*age2 0.0009 -0.0001 0.0003 -0.0001 0.0006 0.0002 0.0001 0.0002 size -0.031 -0.004 -0.007 -0.010 0.009 0.003 0.002 0.003 size2 0.0008 0.00003 0.0002 0.0002 0.0003 0.00013 0.0001 0.0001 exit -0.106 -0.013 -0.009 -0.012 0.042 0.013 0.010 0.009 F-test, foreign-age interaction
8.08 (0.00)
3.25 (0.04)
31.29 (0.00)
4.03 (0.02)
Year yes yes yes yes Within groups yes yes yes yes
dependent variable: itei ˆˆ +η
Obs 13,898 13,908 13,908 13,832 North American 0.817 0.386 0.183 0.179 0.095 0.055 0.022 0.021 European Union 0.713 0.418 0.197 0.108 0.097 0.074 0.024 0.027 Other European 0.934 0.166 0.157 0.136 0.137 0.088 0.026 0.038 Japanese 2.25 0.012 0.271 0.166 0.39 0.066 0.075 0.109 Other foreign 1.09 0.448 0.133 0.185 0.31 0.131 0.092 0.096 Notes: numbers in italics are robust standard errors. All regressions are grossed up to population weights and weighted by establishments’ employment. Year indicates full set of year dummies. Size is number of employees normalised on 4-digit industry-year average employment.

23
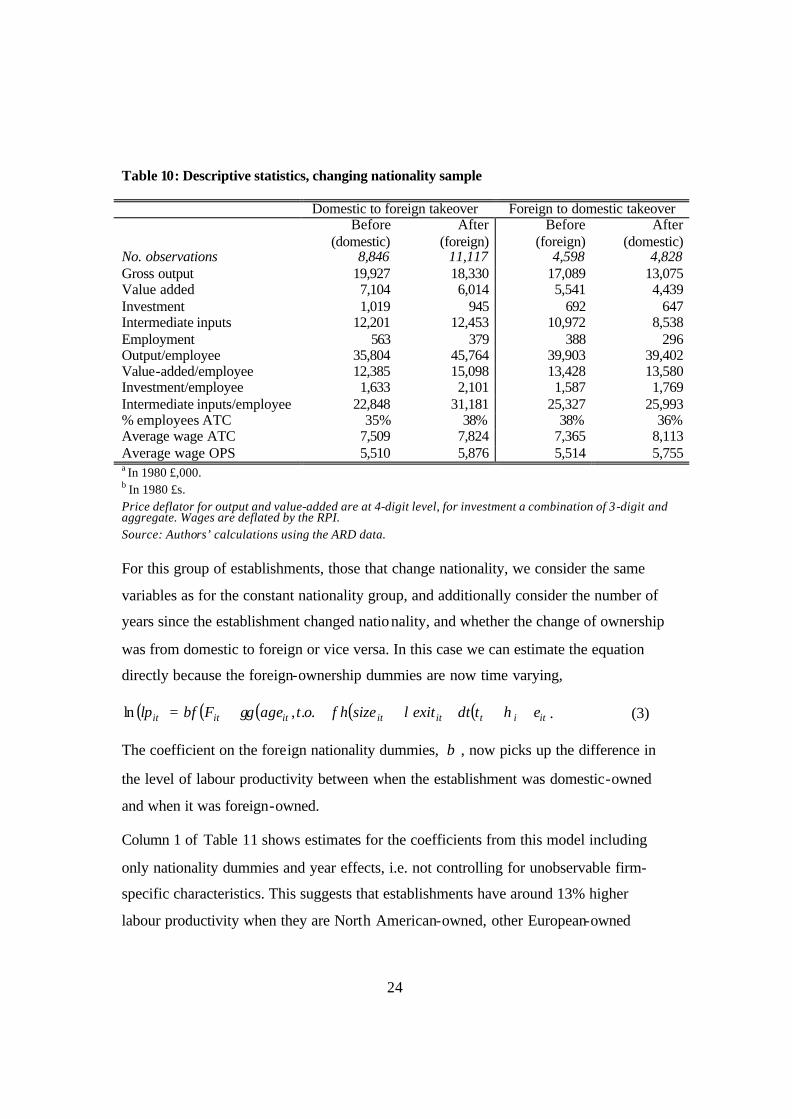
4.2 Comparison of firms that change nationality
In this section we compare establishments that change nationality and look at how the ir
characteristics compare before and after the ownership change. Table 10 describes
establishments that change nationality (at some point between 1973 and 1996).17 The
first two columns consider establishments that go from being UK to foreign-owned and
describe their characteristics before and after the takeover. The size of establishment
does not change noticeably, apart from a fall in average employment. Labour
productivity, investment per employee and wages all increase. The final two columns
describe establishments that go from being foreign to UK owned. We observe fewer of
these. Labour productivity prior to takeover is higher than for the domestic to foreign
takeovers. The size of establishment is on average less after the change of ownership,
while labour productivity remains fairly stable.
17 We do not necessarily observe input and output data on an establishment both before and after the change in ownership nationality due to the random sampling.
24
Table 10: Descriptive statistics, changing nationality sample
Domestic to foreign takeover Foreign to domestic takeover Before
(domestic) After
(foreign) Before
(foreign) After
(domestic) No. observations 8,846 11,117 4,598 4,828 Gross output 19,927 18,330 17,089 13,075 Value added 7,104 6,014 5,541 4,439 Investment 1,019 945 692 647 Intermediate inputs 12,201 12,453 10,972 8,538 Employment 563 379 388 296 Output/employee 35,804 45,764 39,903 39,402 Value-added/employee 12,385 15,098 13,428 13,580 Investment/employee 1,633 2,101 1,587 1,769 Intermediate inputs/employee 22,848 31,181 25,327 25,993 % employees ATC 35% 38% 38% 36% Average wage ATC 7,509 7,824 7,365 8,113 Average wage OPS 5,510 5,876 5,514 5,755 a In 1980 £,000. b In 1980 £s. Price deflator for output and value-added are at 4-digit level, for investment a combination of 3-digit and aggregate. Wages are deflated by the RPI. Source: Authors’ calculations using the ARD data. For this group of establishments, those that change nationality, we consider the same
variables as for the constant nationality group, and additionally consider the number of
years since the establishment changed nationality, and whether the change of ownership
was from domestic to foreign or vice versa. In this case we can estimate the equation
directly because the foreign-ownership dummies are now time varying,
( ) ( ) ( ) ( ) ( ) ititititititit ettexitsizehotagegFflp ++++++= ηδλφγβ ..,ln . (3)
The coefficient on the foreign nationality dummies, β , now picks up the difference in
the level of labour productivity between when the establishment was domestic-owned
and when it was foreign-owned.
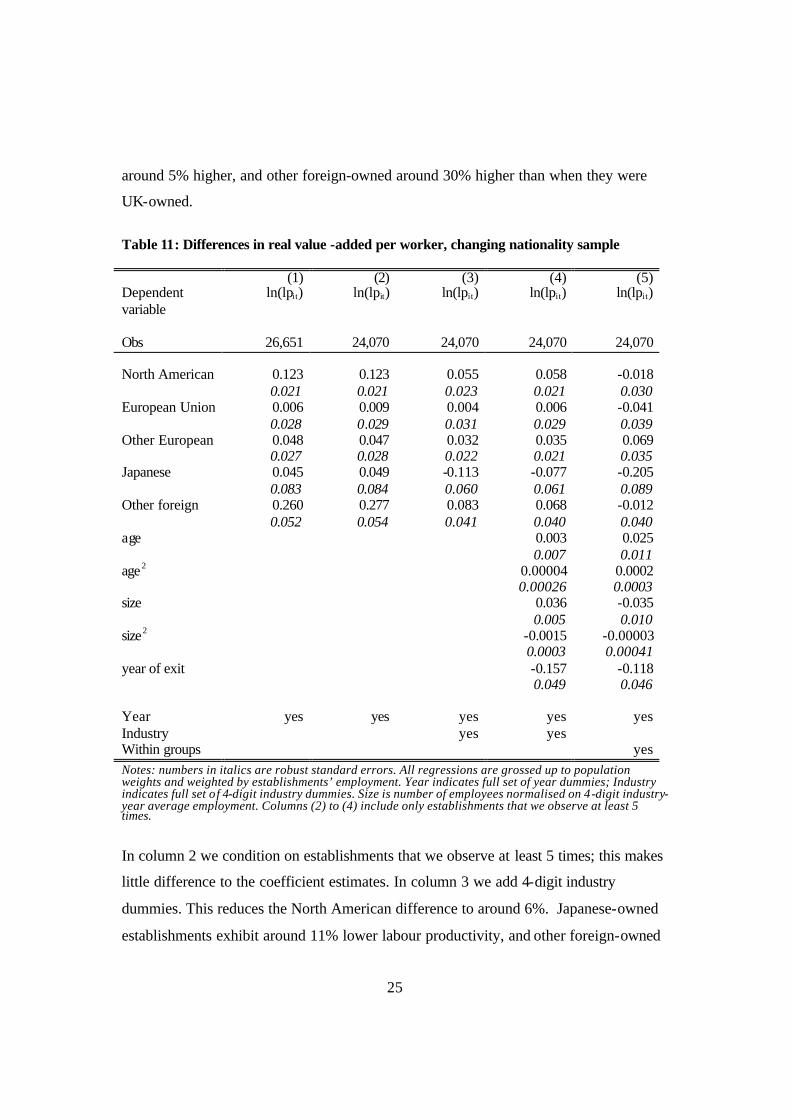
Column 1 of Table 11 shows estimates for the coefficients from this model including
only nationality dummies and year effects, i.e. not controlling for unobservable firm-
specific characteristics. This suggests that establishments have around 13% higher
labour productivity when they are North American-owned, other European-owned
25
around 5% higher, and other foreign-owned around 30% higher than when they were
UK-owned.
Table 11: Differences in real value -added per worker, changing nationality sample
(1) (2) (3) (4) (5) Dependent variable
ln(lpit) ln(lpit) ln(lpit) ln(lpit) ln(lpit)
Obs 26,651 24,070 24,070 24,070 24,070 North American 0.123 0.123 0.055 0.058 -0.018 0.021 0.021 0.023 0.021 0.030 European Union 0.006 0.009 0.004 0.006 -0.041 0.028 0.029 0.031 0.029 0.039 Other European 0.048 0.047 0.032 0.035 0.069 0.027 0.028 0.022 0.021 0.035 Japanese 0.045 0.049 -0.113 -0.077 -0.205 0.083 0.084 0.060 0.061 0.089 Other foreign 0.260 0.277 0.083 0.068 -0.012 0.052 0.054 0.041 0.040 0.040 age 0.003 0.025 0.007 0.011 age2 0.00004 0.0002 0.00026 0.0003 size 0.036 -0.035 0.005 0.010 size2 -0.0015 -0.00003 0.0003 0.00041 year of exit -0.157 -0.118 0.049 0.046 Year yes yes yes yes yes Industry yes yes Within groups yes Notes: numbers in italics are robust standard errors. All regressions are grossed up to population weights and weighted by establishments’ employment. Year indicates full set of year dummies; Industry indicates full set of 4-digit industry dummies. Size is number of employees normalised on 4-digit industry-year average employment. Columns (2) to (4) include only establishments that we observe at least 5 times.
In column 2 we condition on establishments that we observe at least 5 times; this makes
little difference to the coefficient estimates. In column 3 we add 4-digit industry
dummies. This reduces the North American difference to around 6%. Japanese-owned
establishments exhibit around 11% lower labour productivity, and other foreign-owned
26
have around 9% higher labour productivity. In column 4 we condition on age, size and
year of exit. This drives the Japanese-owned dummy into insignificance. Labour
productivity is increasing in size and is lower in the year before exit.
In column 5 we use a within groups estimator to condition on establishment-specific
unobservables. This means that the nationality coefficients are capturing the difference
in productivity that arises due to different ownership. This drives the coefficient on
North American ownership into insignificance. Establishments have around 7% higher
labour productivity when they are owned by other European firms, compared to UK-
owned. Those that are owned by Japanese firms have around 23% lower labour
productivity, compared to UK-owned firms.
We also experimented with allowing separate profiles for the number of years since the
change in the nationality of ownership and whether it was domestic to foreign or foreign
to domestic. This was intended to capture learning effects. The coefficients were not
significant. However, from Table 10 it is clear that there is an improvement in value-
added per worker when establishments go from begin domestic to foreign owned (from
12,385 to 15,098) while when they go in the other direction there is no increase.18 In all
specifications establishments have lower labour productivity in the year before they
exit.
In Table 12 we compare input usage in establishments that change nationality. In
column (1a) we regress the log of investment per worker on nationality dummies, age,
size, year of exit, year and industry dummies. In column (1b) we use a within groups
estimator to control for unobservable differences in establishments. Establishments
invest more per worker when they are North American, EU or Japanese-owned than
when UK-owned. Finally we look at whether differences in labour productivity are
reflected in the type of labour used and in wages. In column (2) we see that a higher
18 Harris and Robinson (2002) look at total factor productivity using the same data as here. They find some evidence that performance declined post acquisition. Conyon et. al. (1999) using a different UK data source do find a labour productivity increase as a result of foreign acquisition.
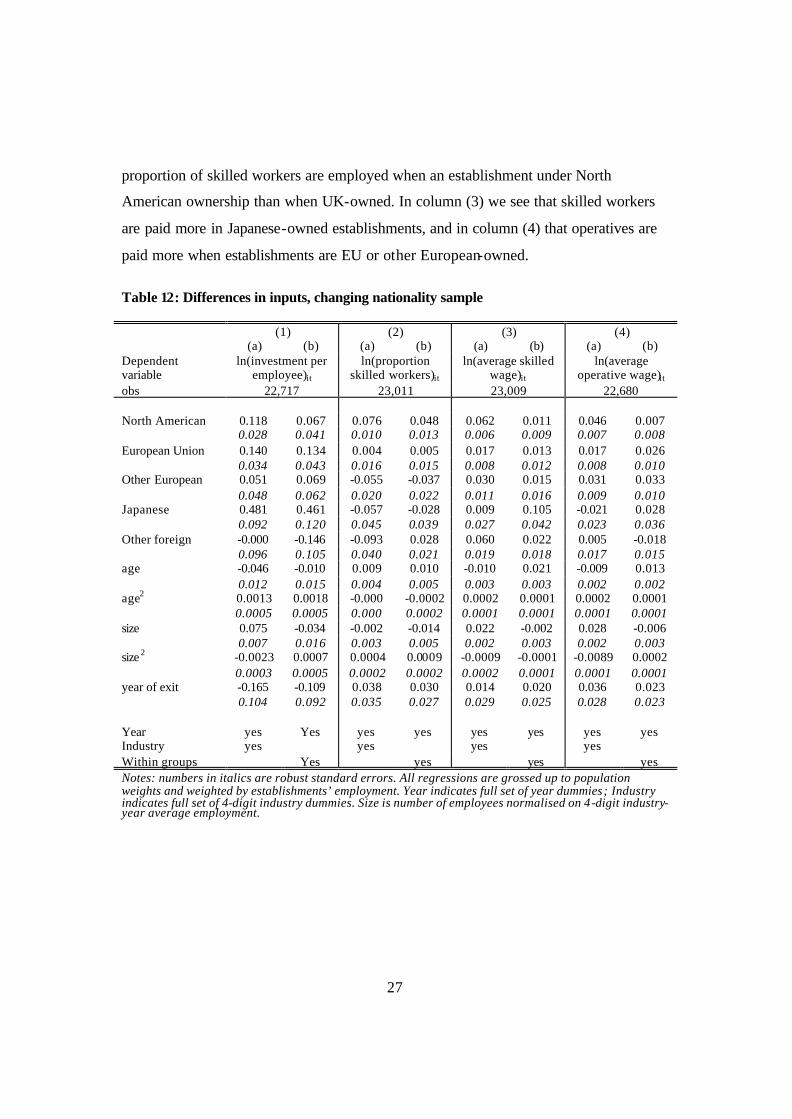
27
proportion of skilled workers are employed when an establishment under North
American ownership than when UK-owned. In column (3) we see that skilled workers
are paid more in Japanese-owned establishments, and in column (4) that operatives are
paid more when establishments are EU or other European-owned.
Table 12: Differences in inputs, changing nationality sample
(1) (2) (3) (4) (a) (b) (a) (b) (a) (b) (a) (b) Dependent variable
ln(investment per employee)it
ln(proportion skilled workers)it
ln(average skilled wage)it
ln(average operative wage)it
obs 22,717 23,011 23,009 22,680 North American 0.118 0.067 0.076 0.048 0.062 0.011 0.046 0.007 0.028 0.041 0.010 0.013 0.006 0.009 0.007 0.008 European Union 0.140 0.134 0.004 0.005 0.017 0.013 0.017 0.026 0.034 0.043 0.016 0.015 0.008 0.012 0.008 0.010 Other European 0.051 0.069 -0.055 -0.037 0.030 0.015 0.031 0.033 0.048 0.062 0.020 0.022 0.011 0.016 0.009 0.010 Japanese 0.481 0.461 -0.057 -0.028 0.009 0.105 -0.021 0.028 0.092 0.120 0.045 0.039 0.027 0.042 0.023 0.036 Other foreign -0.000 -0.146 -0.093 0.028 0.060 0.022 0.005 -0.018 0.096 0.105 0.040 0.021 0.019 0.018 0.017 0.015 age -0.046 -0.010 0.009 0.010 -0.010 0.021 -0.009 0.013 0.012 0.015 0.004 0.005 0.003 0.003 0.002 0.002 age2 0.0013 0.0018 -0.000 -0.0002 0.0002 0.0001 0.0002 0.0001 0.0005 0.0005 0.000 0.0002 0.0001 0.0001 0.0001 0.0001 size 0.075 -0.034 -0.002 -0.014 0.022 -0.002 0.028 -0.006 0.007 0.016 0.003 0.005 0.002 0.003 0.002 0.003 size 2 -0.0023 0.0007 0.0004 0.0009 -0.0009 -0.0001 -0.0089 0.0002 0.0003 0.0005 0.0002 0.0002 0.0002 0.0001 0.0001 0.0001 year of exit -0.165 -0.109 0.038 0.030 0.014 0.020 0.036 0.023 0.104 0.092 0.035 0.027 0.029 0.025 0.028 0.023 Year yes Yes yes yes yes yes yes yes Industry yes yes yes yes Within groups Yes yes yes yes Notes: numbers in italics are robust standard errors. All regressions are grossed up to population weights and weighted by establishments’ employment. Year indicates full set of year dummies; Industry indicates full set of 4-digit industry dummies. Size is number of employees normalised on 4-digit industry-year average employment.
28
5 Summary and conclusions
This paper has investigated differences in characteristics between UK and foreign-
owned manufacturing establishments in Britain over the period 1980 to 1996. At the
aggregate level we see that value-added per worker has grown rapidly in the UK since
the early 1980s. But the UK remains behind other G5 countries in the league tables. We
see a somewhat similar picture when we look within the UK. In aggregate UK-owned
firms have lower labour productivity than firms of other nationalities operating in Great
Britain. There are some differences between the international picture and that within
Britain. Comparing across countries, over the period 1980 to 1996, the UK caught up
with the US, but looking within Britain we see that North American-owned firms
widened the gap with domestic-owned firms.
When we look at the micro level we find that establishments that are always foreign-
owned have significantly higher labour productivity than those that are always
domestic-owned. In addition, labour productivity improves faster with age in foreign-
owned establishments. This is matched, however, by an almost equivalent increase in
levels of investment per employee. Once we take these differences in capital intensity
into account there is little difference between firms of different nationalities. When we
look at establishments that change nationality, differences in labour productivity
between foreign and domestic -owned establishments are smaller.
These findings suggest that investment patterns, and usage of other inputs such as
skilled workers, may go a long way towards explaining differences in value-added per
worker between establishments. This raises the question of why foreign-owned
establishments are investing more and using more skilled workers. Do UK-owned
establishments face some constraint, or is there some other explanation?
29
Data appendix
Our main data source is the Annual Respondents Database (ARD). These data are
collected annually by the Office of National Statistics (ONS).19 Two types of
information are contained in the ARD. First, information on employment, industry and
group structure is available for the population of local units and establishments involved
in production. A local unit is the smallest entity reported in ARD - effectively a plant (a
single address).20 An establishment can comprise one or more local units, (almost)
always within the same 4-digit industry (5-digit after 1992). Three main identifier codes
are given – at the local unit, establishment and enterprise group level. These indicate
which local units and establishments are linked through common ownership.
Second, additional detailed information on inputs and output is collected for a sample of
establishments. The sample comprises a census of larger establishments, and below a
size threshold a stratified sample of smaller establishments. For most of the period we
consider the threshold was 100 employees. When collecting production sector data the
ONS asks that all non-production activities undertaken within the production
establishments be excluded. There is no information on activities located in other
countries.
We use data on the population of manufacturing establishments, (we construct the
population from the raw data), and to look at labour productivity and input usage we use
a sample of manufacturing establishments. We gross up the sample in our main
analysis. Further details of how we identify entrants, exitors and ownership changes, of
the grossing up factors and of the sample we use are given below.
19 See Barnes and Martin (2002), Griffith (1999), Oulton (1997) and Perry (1995) for descriptions of the structure of the ARD. 20 There are a small number of cases where the local unit is reporting for several plants. Since 1993 the list of local units comes from the InterDepartmental Business Register.

30
The ARD categorises establishments into seven types: incorporated or company, sole
proprietor, partnership, public corporation, central government body, local authority,
and other (including non-profit making bodies). We only use those classified as
incorporated or company. 21 We exclude establishments that are not yet in production.
The entry and exit year of an establishment is calculated by identifying the first and last
years that it is present in the population of incorporated establishments that are in
production. We do this using data on the population back to 1973. The ONS has made
changes to the establishment identifier codes several times. Where possible we map
over coding changes using postcode and industry code information. If an establishment
changes from a public corporation to being incorporated it counted as an entrant, as are
establishments that go from being ‘not yet in production’ to ‘in production.’
The ARD gives the country of residence of the ultimate owner of the local unit, or
establishment. The domestic to foreign and foreign to domestic takeovers are identified
using the nationality of ownership indicator. There appear to be some mis-codings in
this variable. Where we observe the indicator changing for one year and then reverting
to its previous value we assume that this is a mis -coding. We discard establishments
that appear to be taken over more than twice during the period.
The foreign ownership data in the ARD is collected under a separate annual survey that
is also used for the foreign direct investment (FDI) statistics: thus the ownership data
for FDI is exactly the same as for ARD. This data is augmented with information from
Dun and Bradstreet. The definition of foreign direct investment into Britain used for
statistical purposes in collecting the FDI data is, “investment that adds to, deducts from
or acquires a lasting interest in an enterprise operating in an economy other than that
of the investor, the investor’s purpose being to have an effective voice in the
management of the enterprise. For the purposes of the statistical inquiry, an effective
voice is taken as equivalent to a holding of 20% or more in the foreign enterprise.
21 At the local unit level these represent 96% of local units on average over the period 1980-1996.

31
Other investments in which the investor does not have an effective voice in the
management of the enterprise are mainly portfolio investments …”.22
We allocate establishments to their mode 4-digit SIC code (so it is time invariant for
each establishment). From 1992 we map sic92 codes to sic80 codes. The mapping is
constructed using data from 1992 and 1993 when both industry codes are reported in the
ARD. For each sic92 we use the sic80 from which the largest number of local units
were recoded. We verify these mappings using Indexes to the UK Standard Industrial
Classification of Economic Activities 1992, ONS.
We create grossing up factors using employment in the population of establishments.
Two populations are used for this purpose. The first contains all establishments that are
either always under domestic or foreign-ownership, and the second contains
establishments that change ownership nationality due to a takeover. Grossing up factors
are calculated at the 4-digit sic80-size-year level. Grossing up factors are not calculated
by ownership nationality, as there are too many empty cells, where no foreign-owned
establishments in a particular industry and size category are observed in the sample, but
they are in the population.
Our sample
In the establishment sample, output, investment, employment and intermediate inputs
are reported in nominal terms. We use price deflators for output and intermediate inputs
at the 4-digit industry level obtained from the ONS directly. Price indices for
investment in plant and machinery are at the 2/3-digit level from Price Index Numbers
for Current Cost Accounting, various years. For investment in buildings and land an
annual price index from Price Index Numbers for Current Cost Accounting, various
years, is used. For vehicles an annual price index is obtained using prices series for road
motor vehicles from three series from Price Index Numbers for Current Cost
Accounting, various years. The first series ran from 1974-1983 (1980=100) and the
22 CSO (1996).
32
second from 1984-1993 (1985=100) but there was no common year to convert it. The
price index for private vehicles published in CSO Retail Prices 1914-1990, Tables 70
and 71 is used to merge the two series.). The third series runs 1994-1996 (1995=100).
The retail price index (RPI) is available at the aggregate level (CSO, various years).
Price deflator series for output and inputs are interpolated using the RPI up to 1996
where there is missing data.
Capital stock data is not available in the ARD and we construct this using the perpetual
inventory method (PIM) at the establishment-level. To do this we need to approximate
the first period capital stock. We do this by allocating each establishment with a share
of an estimated 3-digit industry-level capital stock. The industry level capital stocks are
estimated using a 1979 value from a study by Oulton and O’Mahony (1990), and then
using the PIM, with 3-digit industry level investment calculated by aggregating the
ARD and grossing it up. An initial capital stock for each establishment is then estimated
by using that establishment’s share of energy usage within its 3-digit industry in that
year. Where the capital stock is negative we set the capital stock to zero.
Around 1% of observations in the sample have negative value-added (expenditure on
intermediate goods is greater than the value of output). We drop these observations.
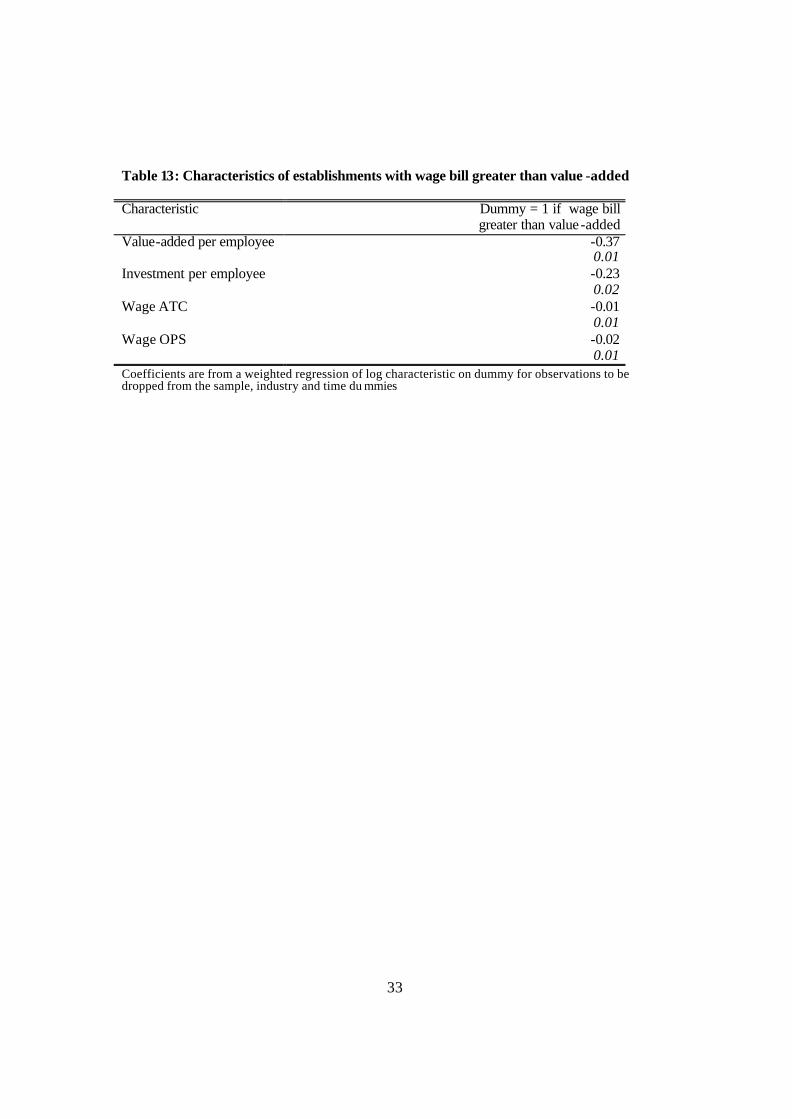
Around 20% of observations have a wage bill that is greater than value -added (that is
variable costs are greater than the value of output). This occurs more often in
recessions, but is spread fairly evenly over years, industries, ages of establishments, and
foreign and domestic establishments. These observations have lower value-added per
employee, lower investment and pay lower wages, a shown in Table 13.
33
Table 13: Characteristics of establishments with wage bill greater than value -added
Characteristic Dummy = 1 if wage bill greater than value -added
Value-added per employee -0.37 0.01 Investment per employee -0.23 0.02 Wage ATC -0.01 0.01 Wage OPS -0.02 0.01 Coefficients are from a weighted regression of log characteristic on dummy for observations to be dropped from the sample, industry and time du mmies
34
References
Aghion, P. and Howitt, P. (1998) Endogenous Growth Theory, Cambridge: MIT Press
van Ark, B. (1996) “Productivity and competitiveness in manufacturing: a comparison of Europe, Japan and the United States”, in Wagner, K and van Ark, B (eds) International productivity differences: measurement and explanations, North-Holland: Amsterdam, 23-52.
Auerbach, A..J. and Hassett, K. (1993) “Taxation and foreign direct investment in the United States: a reconsideration of the evidence” in Giovannini. A., Hubbard R.G. and Slemrod J. (eds), Studies in International Taxation, Chicago: University of Chicago Press, 119-147.
Barnes M. and Martin R. (2002) “Business data linking: an introduction” Economic Trends, 581, April, 34-41.
Barrell, R. and Pain, N. (1997) “Foreign Direct Investment, Technological Change, and Economic Growth Within Europe”, The Economic Journal, Volume 107:445
Barro, R and Sala -i-Martin, X (1995) Economic Growth, McGraw Hill: NewYork Bartelsman, E and Doms, M. (2000) “Understanding Productivity: Lessons from Longitudinal Microdata” Journal of Economic Literature, XXXVIII: No. 3
Bartelsman, E. and Doms, M. (2000) “Understanding productivity: lessons from longitudinal microdata” Journal of Economic Literature, Vol. XXXVIII, No. 3
Bean, C. and Crafts, N. (1995) “British economic growth since 1945: relative economic decline .. and renaissance?” CEPR Discussion Paper No. 1092.
Bean, C. and Symons, J. (1989) “Ten Years of Mrs. T.” NBER Macroeconomic Annual, Vol. 4, 13-61
Bernard, A. and Jones, C. (1996a) “Productivity across industries and countries: time series theory and evidence” Review of Economics and Statistics, 78:1, 135-46.
Bernard, A. and Jones, C. (1996b) “Comparing apples to oranges: productivity convergence and measurement across industries and countries”, American Economic Review, December, 216-238.
Blomstrom, M. (1989) Foreign Investment and Spillovers, Routledge: London
Blomstrom, M. and Persson H. (1983) “Foreign investment and spillover efficiency in an underdeveloped economy: evidence from the Mexican manufacturing industry” World Development, 11: 493-501.
Borensztein, E, De Gregario J. and Lee, J-W. (1998) “How does foreign direct investment affect economic growth?” Journal of International Economics, 45, 115-135.
Cameron, G., Proudman, J. and Redding, S. (1998) “Openness and its association with productivity growth in UK manufacturing industry” in Proudman, J and Redding, S. (eds) Openness and Growth, London: Bank of England.
35
Caves, R. (1974) “Multinational firms, competition and productivity in host-country markets” Economica, 41, 176-193.
Caves, R. (1998) “Industrial Organization and New Findings on the Turnover and Mobility of Firms” Journal of Economic Literature, 36:5 1947-1982
Conyon, M., Girma, S., Thompson, S. and Wright, P. (1999) “The impact of foreign acquisition on wages and productivity in the UK” Centre for Research on Globalisation and Labour Markets Research Paper 99/8, University of Nottingham.
Davies, S. and Lyons, B. (1991) “Characterising relative performance: the productivity advantage of foreign owned firms in the UK” Oxford Economic Papers, 43 (October) 584-595
Disney, R., Haskel, J. and Heden, Y. (2000) "Restructuring and Productivity Growth in UK Manufacturing", mimeo Queen Mary and Westfield.
Doms, M. and Jensen B. J. (1998) "Comparing Wages, Skills, and Productivity between Domestically and Foreign-Owned Manufacturing Establishments in the United States" in Lipsey, R.E., Baldwin, R.E. and Richardson, J. D. (eds.) Geography and ownership as bases for economic accounting , University of Chicago, 235-258.
Dougherty, C. and Jorgenson, D. (1997) “There is no silver bullet: investment and growth in the G7”, National Institute Economic Review, 57-74(CSO, 1996)
DTI (1993), “Regional Selective Assistance 1985-1988: An evaluation by PA Cambridge Economic Consultants ,” London, HMSO.
Dunning, J. (1977) “Trade, location of economic activity and MNE: a search for an eclectic approach”, in Ohlin, B., Hesselborn, P.O. and Wijkman, P.M. (eds.) The International Allocation of Economic Activity, London: McMillan, 395-418.
Edwards, S. (1998) “Openness, productivity and growth: what do we really know?”, The Economic Journal, Vol. 108, No. 447, 383-98.
Ethier, W. and Markusen, J. (1996) “Multinational Firms, Technology Diffusion and Trade”, Journal of International Economics, vol.41, 1996, pp. 1-28.
Gerschenkron, A. (1962) Economic Backwardness in Historical Perspective, Cambridge: Belknap Press.
Globerman, S. (1979) “Foreign direct investment and spillover efficiency benefits in Canadian manufacturing industries” Canadian Journal of Economics, Vol XII, No.1, 42-56.
Globerman, S. Ries, J. and Vertinsky, I. (1994) “The economic performances of foreign-owned subsidiaries in Canada”, Canadian Journal of Economics, Vol XXVII, No.1, 143-156.
Griffith, R. (1999) “Using the ARD establishment level data to look at foreign ownership and productivity in the UK” The Economic Journal, 109 (June), F416-F442.
Grossman G. and Helpman E. (1991) Innovation and Growth in the Global Economy , Cambridge: MIT Press.
Grubert, H. and Mutti J. (1991) “Financial flows versus capital spending: alternative measures of US-Canadian investment and trade in the analysis of taxes,” in Hooper P. and
36
Richardson, J.D. (eds.) International Economic Transactions, Issues in Measurement and Empirical Research, Chicago: University of Chicago Press, 293-317.
Hall R. E. (1988) “The relationship between price and marginal cost in U.S. industry” Journal of Political Economy, vol. 96, 921-47.
Hall, R. and Jones, C. (1999) “Why do some countries produce so much more output per worker than others?”, Quarterly Journal of Economics, Vol. CXIV, 83-116
Harris, R.I.D. and Robinson, C. (2002) “The impact of foreign acquisitions on total factor productivity: plant level evidence from UK manufacturing 1987-1992, Review of Economics and Statistics, vol 84 (3), 562-568.
Howenstine, N. and Zeile, W. (1994) “Characteristics of Foreign-Owned U.S. Manufacturing Establishments” Survey of Current Business, Vol. 74, No. 1, January, 34-59.
Hsiao, C. (1986) Analysis of Panel Data, Cambridge University Press: Cambridge
Klette, T.J. (1999) “Market power, scale economies and productivity: Estimates from a panel of establishment data” Journal of Industrial Economics, Vol. XLVII, No. 4 .
Krugman, P.R. (1991a) “Increasing returns and economic geography” Journal of Political Economy, 99, 483-499.
Krugman, P.R. (1991b) Geography and Trade, Cambridge, USA: MIT Press.
Krugman, P.R. (1994) Rethinking International Trade, Cambridge, USA: MIT Press.
Lansbury, M. (1995) “UK manufacturing employment since Beveridge: the chemical and motor vehicle industries”, NIESR Discussion Paper No. 83.
Layard, R. and Nickell, S. (1989) “The Thatcher Miracle?” American Economic Review (Papers and Proceedings), Vol. 79, 215-9.
Mayes, D. (ed.) (1996) Sources of productivity growth, Cambridge University Press: Cambridge.
McKinsey (1998) McKinsey report on UK Competitiveness.
Nickell, S.J. (1995b) The performance of companies, Oxford: Blackwell.
Nickell, S.J. (1996) “Competition and corporate performance” Journal of Political Economy, 104: 724-746.
Nickell, S.J. Wadhwani, S. B. and Wall, M. (1992) “Productivity Growth in UK Companies, 1975-1986” European Economic Review, 36, 1055-85.
Oulton, N. and O’Mahony, M (1994) Productivity and Growth: a study of British industry 1954-1986, NIESR: London
Oulton, N. (1997) “The ABI respondents database: a new resource for industrial economics research” Economic Trends No. 528, November.
Oulton, N. (1998) “Investment, capital and foreign ownership in UK manufacturing”, NIESR Discussion Paper 141.
O’Mahony, M. (1999) Britain’s Productivity Performance 1950-1996: An International Perspective , National Institute of Economic and Social Research: London
37
Perry, J. (1995) “The inter-departmental business register” Economic Trends No. 505 November.
Smith, A. (1994) “Strategic trade policy in the European car market” in (P. Krugman and A. Smith, eds.) Empirical Studies of Strategic Trade Policy, Chicago: Chicago University Press.
Venables, A. (1994) “Trade policy under imperfect competition: a numerical assessment” in (P. Krugman and A. Smith, eds.) Empirical Studies of Strategic Trade Policy, Chicago: Chicago University Press.
Vernon, R. (1966) “International Investment and International Trade in the product Cycle,” Quarterly Journal of Economics, LXXX, 190-207.
38
39
40
41
42
43
44
45
46
47