Embed Size (px)
Citation preview
NBER WORKING PAPER SERIES
THE WTO PROMOTES TRADE, STRONGLY BUT UNEVENLY
Arvind SubramanianShang-Jin Wei
Working Paper 10024http://www.nber.org/papers/w10024
NATIONAL BUREAU OF ECONOMIC RESEARCH1050 Massachusetts Avenue
Cambridge, MA 02138October 2003
The authors are grateful to James Anderson, Alina Carare, Peter Clark, K. Michael Finger, Carsten Fink,Hans-Peter Lankes, Gary Hufbauer, Patrick Low, Aaditya Mattoo, Hildegunn Nordas, Caglar Ozden, ArvindPanagariya, Roberta Piermartini, Dani Rodrik, Robert Teh Jr., Luke Willard, Alan Winters, seminarparticipants at the IMF, and especially Andy Rose for helpful suggestions and discussions. Ethan Ilzetzski,Azim Sadikov, and Li Zeng provided excellent research assistance. The views expressed herein are those ofthe authors and are not necessarily those of the National Bureau of Economic Research.
©2003 by Arvind Subramanian and Shang-Jin Wei. All rights reserved. Short sections of text, not to exceedtwo paragraphs, may be quoted without explicit permission provided that full credit, including © notice, isgiven to the source.
The WTO Promotes Trade, Strongly But UnevenlyArvind Subramanian and Shang-Jin WeiNBER Working Paper No. 10024October 2003JEL No. F1
ABSTRACT
Contrary to the recent literature that concludes that the GATT/WTO has been completely ineffective
in promoting world trade, this paper furnishes robust evidence that the institution has had a powerful
and positive impact on trade. The impact has, however, been uneven. GATT/WTO membership for
industrial countries has been associated with a large increase in imports estimated at about 44
percent of world trade. The same has not been true for developing country members, although those
that joined after the Uruguay Round have benefited from increased imports. Similarly, there has
been an asymmetric impact between sectors. These results are consistent with the history and design
of the institution.
Arvind SubramanianResearch Department Room 10-700NInternational Monetary Fund700 19th StreetWashington, DC [email protected]
Shang-Jin WeiResearch Department Room 10-700MInternational Monetary Fund700 19th StreetWashington, DC 20431and [email protected]
3
I. INTRODUCTION AND MOTIVATION
The General Agreement on Tariffs and Trade (GATT) and its successor, the World Trade Organization (WTO), were set up to promote world trade. That trade increased courtesy of this institution may seem self-evident. To the doubters, Bhagwati (1991) has this succinct riposte: “A common criticism is that the GATT in truth is the General Agreement to Talk and Talk: It has delivered nothing. This is nonsense.” (p. 5.) However, in one of the first and very few empirical analyses of this question, Rose (2002a and 2002b), after an impressively meticulous and comprehensive scrutiny, has argued that there is no evidence that the WTO has increased world trade. To quote Rose (2002a): “My quantitative examination indicates that there is little reason to believe that the GATT/WTO has had a dramatic effect on trade. In particular, once standard gravity effects have been taken into account, bilateral trade cannot be strongly and dependably linked to membership in the WTO or its predecessor the GATT.” (p. 23.) In this paper, we attempt to reconcile the apparent inconsistency between the well-entrenched belief in the benefits of the WTO and the conclusion of Rose’s analysis. We will furnish evidence that Rose’s analysis is incomplete and can be misread seriously. The incompleteness is on two grounds. On econometric grounds, Rose’s analysis needs to be refined methodologically in one important respect to incorporate the results of Anderson and van Wincoop (2003), who show that a gravity equation grounded in theory always needs to include country fixed effects. On economic grounds, it needs to be further elaborated to take account of the asymmetric manner in which the WTO has effected trade liberalization in the post-war period. Once these are done, we find robust evidence that the WTO (and its predecessor, the GATT) has promoted world trade. We estimate that the WTO may have increased world imports by about 44 percent or about US$3 trillion in 2000 alone. Interestingly, our results on the WTO’s trade impact are exactly in line with what they should be, given the liberalization asymmetries. We emphasize three types of asymmetries: between developed and developing countries; between developing countries that joined the WTO before and after the Uruguay Round; and between sectors where the WTO has been effective in bringing down trade barriers and those—notably agriculture, and textiles and clothing—where it has been less effective. Rose (2002a and 2002b) notes these asymmetries but does not pursue them empirically. Instead he focuses on the average behavior of WTO members, which could obscure the great unevenness in the patterns of trade liberalization across members, across time, and across products. The verdict on the ineffectiveness of the WTO is overturned once one refines the econometric specification and takes account of these asymmetries.
4
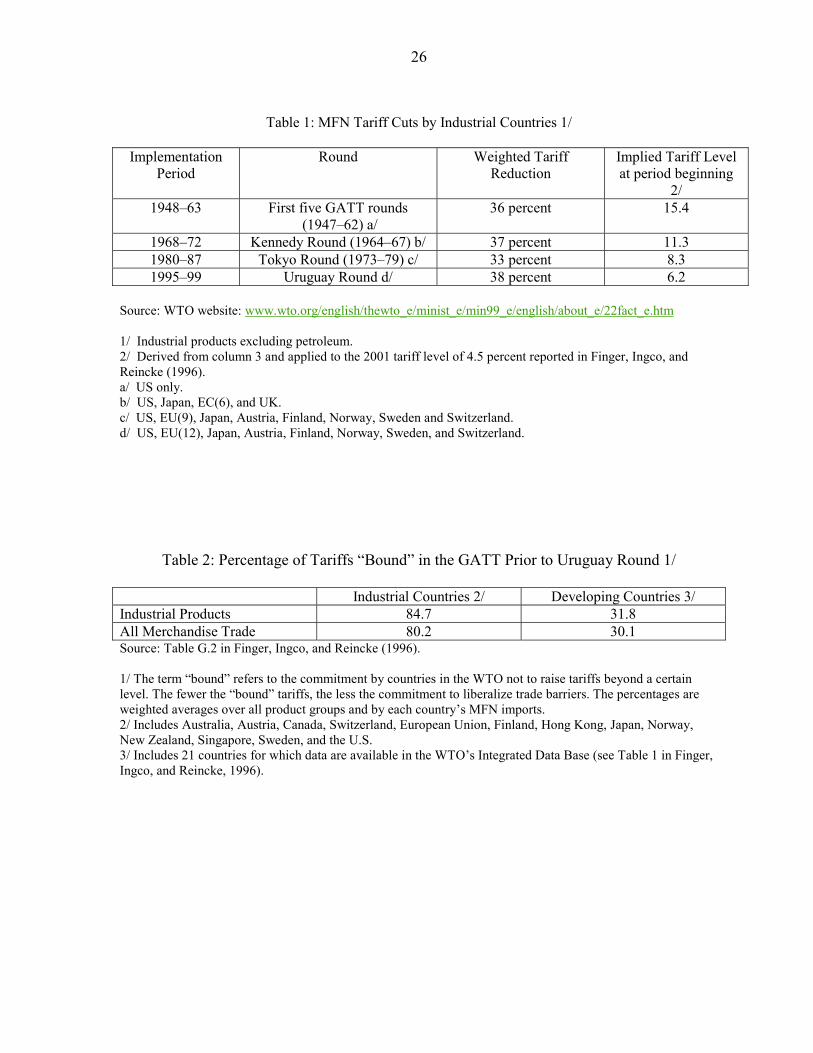
A. First Asymmetry: Developed Versus Developing Countries
It is well-recognized that the WTO, and more especially its predecessor the GATT, has been a two-tier organization, with far greater liberalization obligations imposed on its developed than its developing country members. As Table 1 shows, developed countries, under successive rounds of trade negotiations, have successfully reduced their tariff barriers. These numbers suggest that industrial countries, under the aegis of the GATT, reduced their average tariffs from over 15 percent in 1947 to about 4.5 percent today. This, combined with the fact that the rules have required that developed countries not impose nontariff barriers (especially quantitative restrictions), has meant that the WTO should have been a motor of overall trade liberalization by industrial countries. Of course, during the post-war era industrial countries did seek recourse to nontariff barriers, in violation of the spirit if not the letter of WTO rules. They included voluntary export restraints (in cars and steel), explicit quantitative restrictions (agriculture and clothing), and antidumping. Although many of these barriers were sectoral in nature, their imposition could have offset the effects of the tariff liberalization. Whether they did so is an empirical question that we allow the data to settle. In contrast, and since the early days of the GATT, developing countries have had far fewer obligations to liberalize. This reluctance of developing countries to take on obligations to liberalize under the WTO was codified under the principle of special and differential treatment (S&D), which has defined the terms of developing country participation or rather virtual non-participation. In terms of developing countries’ own liberalization, S&D consisted of two elements.1 First, developing countries have not, until the Uruguay Round, really participated in tariff liberalization in the various rounds. This is reflected in Table 2 which illustrates that until the Uruguay Round developing countries had “bound” less than a third of their tariff lines compared to nearly 85 percent for industrial countries.2 That is, developing countries had no commitments as regards their tariffs for over two-thirds of their imports. And even on the 30 percent of the bound lines, the commitments to liberalize were weak because the bound rate was well above the applied, the prenegotiation rate, typically by over 10 to 15 percentage points. 1 S&D also had another pillar, the grant of preferential market access by developed countries to their developing country trading partners, which led to the institution of GSP and similar schemes (see Wolf, 1986, for an excellent analysis of the rationale and consequences of S&D).
2 When a country “binds” its tariffs in the GATT/WTO (or undertakes tariff “bindings”), it commits not to raise its tariffs above the level at which the tariff is “bound.” Note that these numbers relate to the late 1980s; for much of the post-war period, the proportion of bindings was even smaller.
5
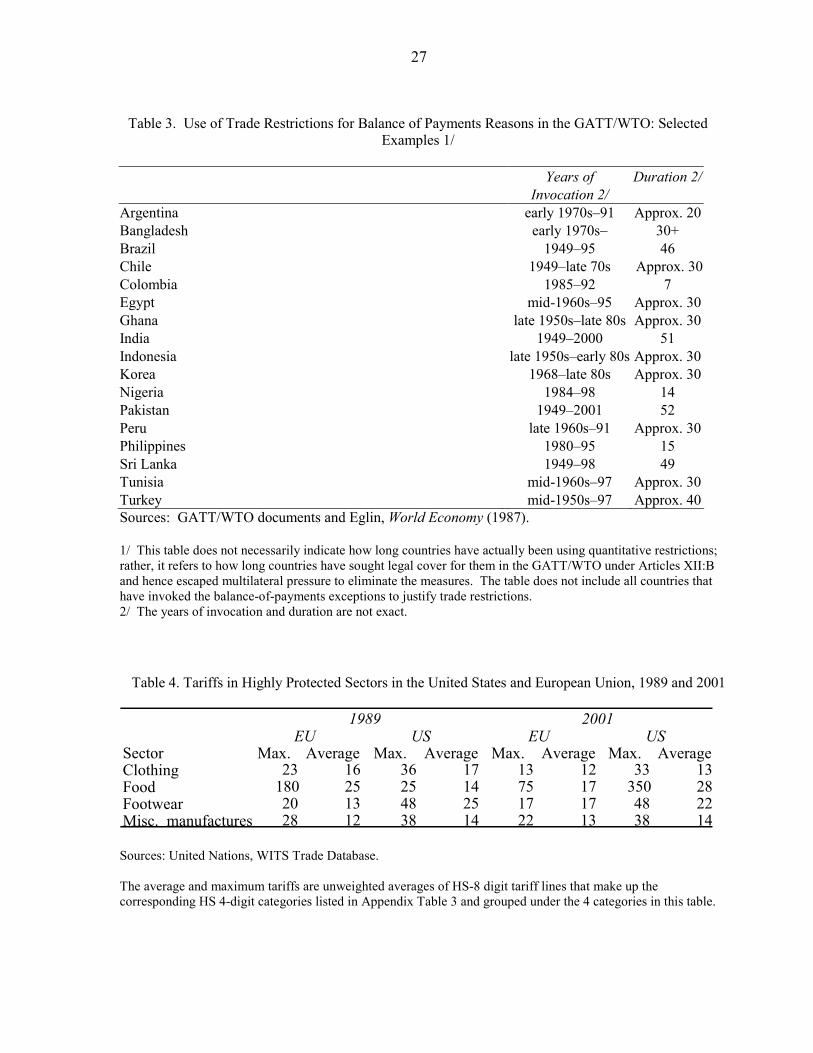
Second, the permissiveness of the GATT toward developing countries extended not just to tariff liberalization but also the basic rules on nontariff barriers, particularly their use of quantitative restrictions for balance of payments reasons that was sanctioned under Article XVIII:B of the GATT.3 Indeed, a number of the large developing countries invoked the right to use quantitative restrictions on their imports for the major part of the post-war period; in some instances this right extended to over five decades. This is illustrated in Table 3. In practice, the right to use quantitative restrictions generally coincided with their actual use. This use of quantitative restrictions was a crucial aspect of special and differential treatment.
B. Second Asymmetry: New Versus Old Developing Country Members
The second, temporal asymmetry, in the WTO derives from the above. As the Uruguay Round progressed, it became clear that one of its objectives was to narrow the gap between developed and developing countries in terms of their respective obligations to liberalize trade barriers. This objective was particularly important in defining the terms of accession of new WTO members, namely those that joined after the Uruguay Round negotiations had commenced. The Chinese accession in 2001 is a case in point. The accession came at the end of a 13-year process in which the list of liberalization obligations imposed on China grew steadily. China was given a shorter phase-in period to complete the liberalization obligations than earlier developing country members. At the end of the phase-in period, China’s trade regime will be more open than most of the existing developing country members of the WTO today. The Chinese case has its special features, but the more demanding nature of liberalization obligations could have applied to other new WTO members as well.
C. Third Asymmetry: Protected Versus Liberalized Sectors in Developed Countries
Third, there has been asymmetry in the liberalization between different sectors. While developed countries brought down their trade barriers, they exempted a number of key sectors—agriculture, textiles and clothing—from their liberalization efforts. In fact, this exemption was reflected not just in the fact that tariffs remained high in these sectors. The rules on the prohibition of quantitative restrictions were themselves bent to allow their use in these sectors. The Multi-Fiber Arrangement, which was a vast system of bilateral quantitative restrictions imposed by developed countries on their imports from developing countries, was a violation of the basic rules of the GATT. The same was true of agriculture. Table 4 confirms that the food, clothing, and footwear sectors are indeed highly protected sectors, with average tariffs well above the average for the industrial sector as a whole, and with significant peak tariffs, particularly in agriculture. These three asymmetries are well-known. The question is whether they actually show up in the data on the patterns of trade. Furthermore, once these asymmetries are taken into account, 3 For a fuller discussion of the history and consequences of Article XVIII:B, see Eglin (1987) and WTO (2003).
6
would the data reveal that the WTO has promoted trade substantially and in the way it has been designed? The objective of this paper is to examine systematically this question. It is organized as follows. Section II presents the econometric model and estimation methodology, and briefly describes the data and their sources. Section III discusses the results. Section IV offers some concluding remarks.
II. ECONOMETRIC SPECIFICATION AND DATA
A. Model and Estimation Issues
We adopt an extended gravity model that has enjoyed empirical success in terms of its ability to explain a relatively large fraction of variations in the observed volume of trade. In theory, the gravity model can be justified by a variety of theories, including monopolistic competition (Helpman and Krugman, 1995) and a Heckscher-Ohlin model with specialization (Anderson, 1979; Deardorff, 1998; and Anderson and van Wincoop, 2003). Empirically, it has been used to analyze the effects of regional trade blocs (see Frankel, 1997 and the references cited therein) and currency unions (Frankel and Rose, 2000; Glick and Rose, 2002; Rose, 2000; and Persson, 2001) among other subjects. In contrast to a majority of earlier studies (and to Rose, 2002a), we adopt the version of the gravity model suggested by Anderson and van Wincoop (2003) that includes country fixed effects in the regression. More precisely, our specification is of the following form:
LogImport(j,k,t) = Z(j,k,t) γ + ∑ αi Mi + ∑ θh Xh+ β1FTA(j,k,t) + β2GSP(j,k,t) +
β 3WTO-DVED(j,k,t) + β4WTO-DING(j,k,t) + ej,k,t where Z(j,t) is a list of variables, including log GDP, log per capita GDP, log land area of importers and exporters, greater circle distance between j and k, dummies for common language and colonial links, shared borders, and currency, and a dummy for landlocked and island countries. Essentially, the list includes all the covariates in Rose (2002a).4 Mi’s are a list of importer dummies (that take the value of one if i=j, and zero otherwise). Xi’s are a list of exporter dummies (that take the value of one if h=k, and zero otherwise). The Mi’s and Xi’s are essentially dummies that serve to proxy for “multilateral resistance” in Anderson and van Wincoop (2003).5 These dummies were not included in most of the regressions in Rose (2002a). 4 Because we include importer and exporter fixed effects (see below), we drop other country-specific and time invariant covariates.
5 Trade between two countries depends not just on the policy and physical barriers between them but also on the barriers between these countries and the rest of the world (hence the term “multilateral resistance”). Importer and exporter dummies proxy for the latter kind of barriers. One of our robustness checks involves taking the Anderson and Van Wincoop
(continued…)
7
FTA(j,k,t) is a dummy variable that takes on a value of 1 if j and k belong to a common free trade area or common market in year t.6 GSP (j,k,t) is a dummy variable that takes on a value of 1 if the importing industrial country grants preferences under the generalized scheme of preferences (GSP) to exporting country k in year t and where j and k are not members of a free trade area or common market in year t. WTO-DVED(j,k,t) is a dummy variable for importer j that is a developed country WTO member and where j and k are not in a common free trade area or customs union and where j does not grant GSP preferences to k in year t. WTO-DING(j,k,t) is a dummy variable for importer j that is a developing country WTO member and where j and k are not in a common free trade area or customs union and where j does not grant GSP preferences to k in year t. ej,k,t is a normally distributed random error term that has a zero mean and a constant variance. There are several important differences between our specification and that in Rose (2002a) that are worth making clear at the outset. First, we focus on imports by j from k as the regressand, whereas Rose focused on the average of j’s imports from k and j’s exports to k. All theories that underlie a gravity-like specification yield predictions on unidirectional trade rather than total trade. Hence, our specification is more closely grounded in theory. Moreover, the trade effects of the WTO and the GSP really relate to imports. When a country j grants GSP preferences to k, or when j liberalizes its imports under the WTO, there is reason to expect j's imports from k to increase but there is no theoretical reason why j's exports to k should also increase by the same proportion. Even if Abba Lerner symmetry were to hold—that is, removal of import barriers serves to raise exports as well as imports—it would only do so at the level of a country’s aggregate rather than bilateral trade. The argument in favor of trade (exports plus imports) rather than imports could be based on the view that the WTO also regulates export taxes and export subsidies. In practice, export taxes have rarely, if ever, been the subject of liberalization negotiations, in part because industrial countries have seldom used them. Export subsidies, on the other hand, have been the focus of WTO rules and negotiations, but elimination of these subsidies would tend to reduce exports. The impact of the WTO on a measure of trade (regressand) that included exports would even in theory be ambiguous. (2003) results to its logical conclusion and incorporating time-varying importer and exporter fixed effects.
6 The FTAs included in our analysis are those reported in Rose (2002a) and updated through 2000. Appendix Table 6 lists all the FTAs used in our study.
8
Another reason for favoring trade would be that by joining the WTO a country gets the benefit of most-favored-nation (MFN) treatment and enjoys better export access to other markets. But this benefit can only be enjoyed if the partner country is also a WTO member country. For these reasons, Rose’s (2002a) attempt at measuring the impact of the WTO when only one of the two trading countries is in the WTO seems problematic.7 Another advantage of our specification is that we can meaningfully differentiate importer and exporter characteristics and their effects (e.g. importer’s log GDP and exporter’s log GDP as separate regressors) on trade, whereas Rose had to rely on a symmetric composite of the importer and exporter characteristics (e.g., the sum of the importer’s and exporter’s log GDP’s as a single regressor). Under our approach, for example, we can measure whether import liberalization benefits all exporters or just those that are members of the WTO. Thus, we are able to identify whether there is discrimination between WTO and non-WTO members and also to measure the potential public good benefits of the WTO. Second, as Deardorff (1998), Anderson and van Wincoop (2003), and Wei (1996) emphasized, the standard gravity model might have been misspecified in ignoring a “multilateral resistance” or “remoteness” term. Anderson and van Wincoop (2003) suggest that empirically, the inclusion of country fixed effects captures “multilateral resistance” reasonably well and thus corrects this misspecification. In Rose (2002a), the benchmark regression and indeed all specifications, save one, do not include country fixed effects. In our analysis, we include country fixed effects in all the specifications. Third, our specification of the GSP and WTO dummies is different from that in Rose. We rely on the fact that FTAs, the GSP, and the WTO involve different degrees of liberalization, and hence define them mutually exclusively in order to be able to isolate the impact of each, purged of any “contamination” from the other.8 Therefore, the WTO dummies in our analysis are coded to exclude country pairs belonging to the same FTA/customs union agreement or involved in GSP relationships. Similarly, the GSP dummy is coded to exclude country pairs belonging to an FTA or customs union.
B. Data and Sources
The data that we use and their sources are explained in detail in the Appendix. Most of our data are from Rose (2002a) which are posted on his website. The main difference is our use of imports rather than trade as the dependent variable which we obtain from the IMF’s Direction of Trade Statistics. We deflate imports by the US consumer price index. Also we
7 The other dummy that Rose (2002a) uses to capture possible WTO effects, namely when both members in a country pair are WTO members, does not suffer from the deficiencies noted above.
8We also report the results when these variables are defined as in Rose (2002a). It turns out that the GSP coefficients are affected much more than the WTO coefficients.
9
update all the Rose variables for the year 2000. Our panel data set consists of observations for every 5 years beginning in 1950. The tariff and import data we use for the disaggregated estimations are obtained respectively from the TRAINS (Trade Analysis Information Systems) and COMTRADE databases of the United Nations (See the Appendix for details). Descriptive statistics for the basic data are in Appendix Table 1. The list of countries in the aggregate and disaggregate estimations is presented in Appendix Tables 2–4. Consistent with WTO practice, but unlike Rose, we exclude South Africa, Turkey, and Yugoslavia from the category of industrial countries. The list of sectors used in the disaggregate estimations is in Appendix Table 5 The list of free trade areas is described in Appendix Table 6, while Appendix Table 7 provides data on the number of observations falling into the different categories (WTO, FTAs, GSP etc.).
III. RESULTS
A. Asymmetry Between Industrial and Developing Countries
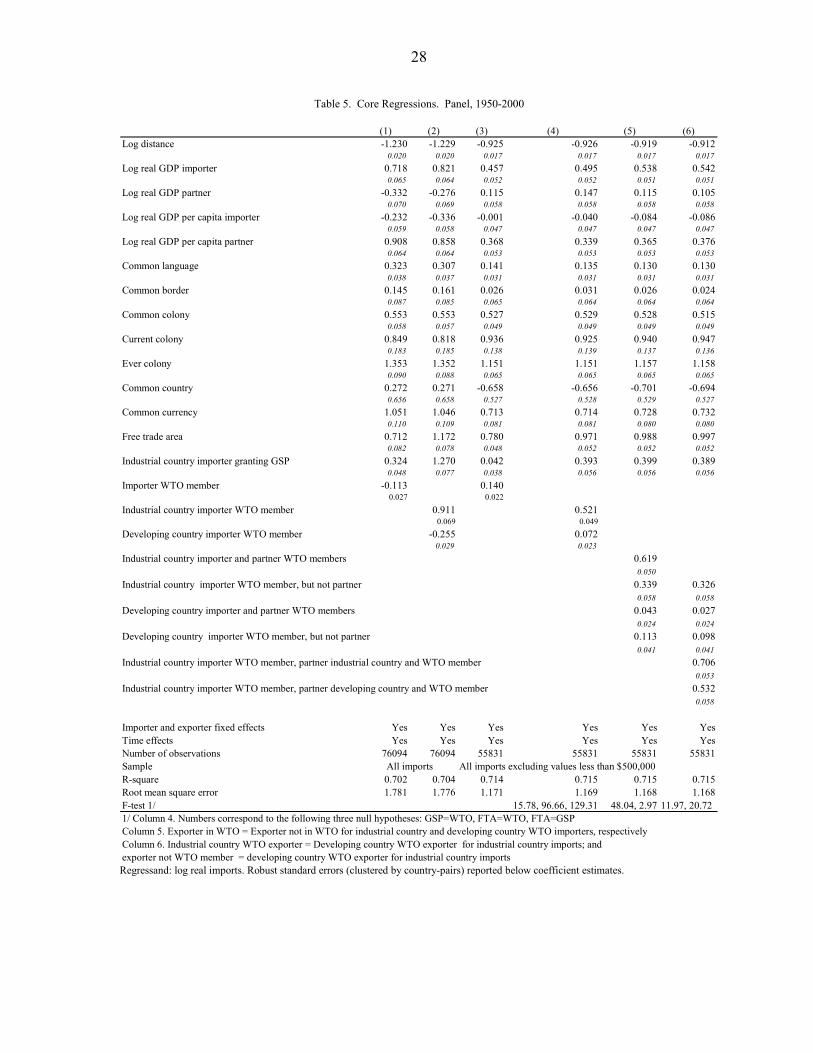
We now turn to the regression analysis. The basic gravity model, reported in Table 5, works well, yielding plausible estimates for the standard covariates—GDP, GDP per capita, distance—which are highly significant and very much in line with typical estimates from the literature. Tables 5 and 6 contain the core results for aggregate trade in panel and cross-section contexts, respectively. The basic Rose result about the ineffectiveness of the WTO in increasing trade is illustrated in column 1. Indeed, if membership in the WTO is undifferentiated, with all countries treated alike, our result is a more damning indictment of the WTO than even that in Rose (2002a). He found that membership in the WTO had no significant effect on trade. We find that membership has a significantly negative effect on trade: the average WTO member trades about 11 percent [exp(–0.113)–1] less than the average in the sample (column 1). But as we explained in the earlier section, the evolution of the WTO and its precursor the GATT, most notably involving the special treatment of developing countries, makes it essential to treat this group differently from industrial countries. Once this is done as in column 2, we see that the average result of undertrading obscures a significant difference between the behavior of industrial country members of the WTO and its developing country members. The coefficient on the former is positive and highly significant. As will be seen, this is a result that is robust to a large number of changes in specification, estimation procedure, and sample. On the other hand, the coefficient on the developing country WTO importer dummy is negative and significant.9 This negative sign, as it turns out, is not robust; indeed, it is quite fragile. For example, when we exclude observations with values of trade less than $500,000, 9 It is worth noting that t-statistics for the industrial country WTO dummy is almost always above 10, signifying that the coefficient estimates have a high degree of precision.
10
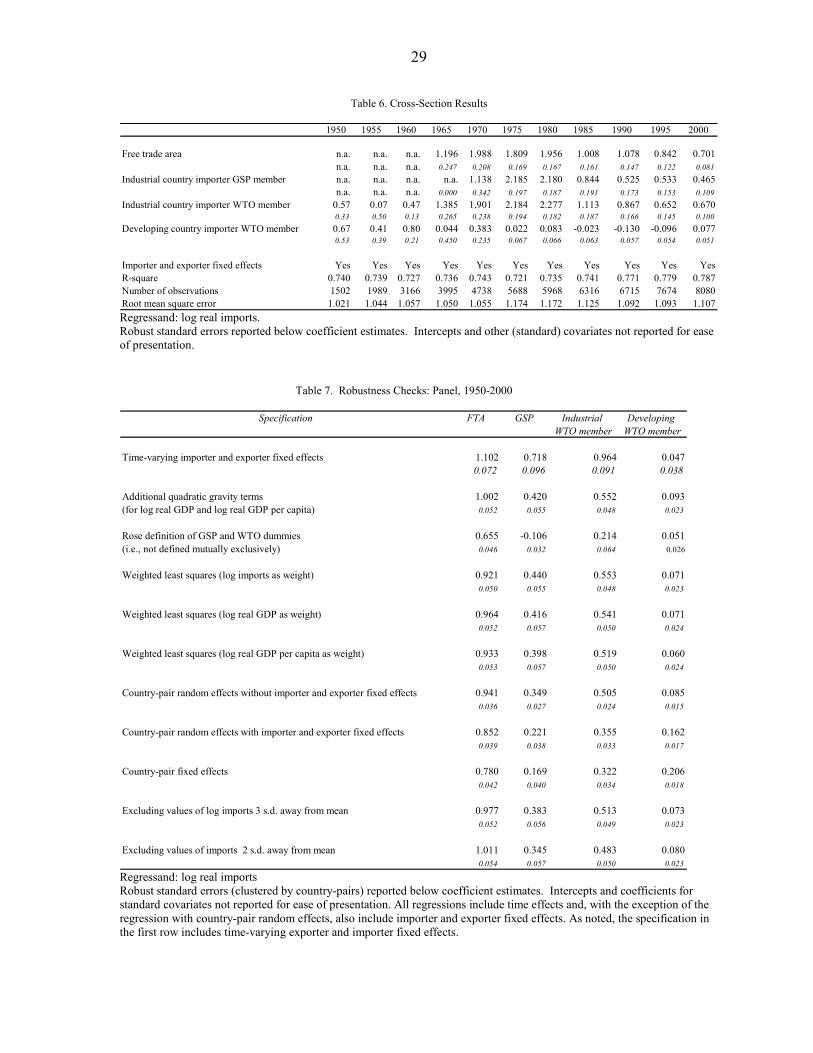
the negative coefficient turns positive and significant (column 4 of Table 5). There are plausible reasons to believe that small-valued observations are subject to sampling and measurement error. In particular, idiosyncratic shifts in the behavior of a single importer or even a single shipment may dominate the variations in the reported import value.10 Table 6 reports a sequence of cross-sectional estimations every five years from 1950 to 2000. The chief advantage of running separate regressions for different years is that the importer and exporter fixed effects are allowed to vary over time. This effectively permits the “multilateral resistance” in Anderson and van Wincoop (2003) to be time-varying. The coefficients on other control variables are not restricted to be the same over time either. The chief disadvantage of this approach is a possible loss of efficiency which, given the large size of the data set, is not a crucial loss. In any case, the coefficients on the industrial country WTO dummy are positive, and significant for all years beginning in 1960. The coefficient on the developing country dummy is less stable: it is positive and significant in the early years but negative and usually insignificant for the rest of the estimations. This result is consistent with the history of asymmetric trade liberalization in the WTO that we described earlier. Industrial countries reduced their tariff barriers under successive trade rounds while developing countries were accorded the freedom to maintain their trade barriers under the principle of special and differential treatment. The known asymmetry in tariff reductions shows up nicely in the data. Changes in nontariff barriers are apparently not large enough to completely offset the tariff reductions. If these results are interpreted causally, we can quantify the contribution of the WTO to increasing global trade. The coefficient for the industrial country dummy in the panel regression reported in column 4 of Table 5 is 0.52. This implies that industrial countries’ bilateral imports has on average been about 65 percent more [exp(0.52)–1] by virtue of their membership in the WTO. Taken literally, our results would imply that in 2000 alone, aggregate imports of industrial countries would have been higher by about $3 trillion than without the WTO, representing about 44 percent of world trade. This estimate is probably overstated because it does not take into account a substitution effect: if one country joined the WTO its aggregate trade would increase as we have estimated it; but if all countries joined the WTO there would be some displacement of imports from non-WTO members by those from WTO members. Having said that, we note that there are also reasons that our estimates may have understated the true impact of the WTO membership in raising world trade if there is positive feedback from higher trade to higher economic growth (see Frankel and Romer, 1999), which in turn spurs even more trade (the gravity equation examines trade for a given level of income). Of course, if the WTO had not accorded the freedom to developing countries to maintain trade barriers, and had required trade liberalization of them, the positive impact on global trade could have been greater still. 10 For these reasons, the remaining results reported in the paper will exclude observations with trade values less than $500,000, although we would emphasize that not doing so does not alter the basic nature of the results.
11
Some additional features of the world trading system are brought out by the results. Members of the WTO are obliged to extend trade privileges granted to any country (member or non-member) to all other members of the WTO under the MFN principle. But members are not obliged to extend the same privilege to non-members of the WTO. They can do so if they wish but there is no legal obligation to do so. In practice, do they? In column 5 of Table 5, each of the two WTO dummies is disaggregated into two dummies, depending on whether the exporter is also a WTO member. For industrial country WTO members, the coefficients on the dummy when the exporter is also a WTO member is greater than when the exporter is not a member (0.62 versus 0.34) and this difference is statistically significant.11 It appears that non-members do not seem to benefit equally from the liberalization under the WTO. This difference, which highlights the benefits of WTO membership, could arise for two reasons. The first is explicit discrimination; that is, barriers could be higher against imports from non-WTO members than from members. The second is akin to a product composition effect: that is, even though all goods are treated alike regardless of their provenance, barriers are higher on products of greater interest to non-members because these products have not been the subject of the reciprocity negotiations in the WTO.12 Being out of the WTO can thus have two types of disadvantages. This result, however, also points to the possible public good benefit of the WTO. The fact that imports from WTO non-members is positive and significant rather than zero could arise from the fact that WTO members extend some of the privileges of their WTO-induced liberalization to non-members. In our results, the public good benefit amounts to about 40 percent [exp(0.34)–1] additional exports for non-members to industrial country WTO members. In Table 7, we put our core specification through the usual hoops—the robustness-checks exercise. As the Table confirms, our core result—particularly the positive impact of the WTO on industrial countries’ imports—remains unchanged. The hoops include: adding time-varying importer and exporter fixed effects, quadratic gravity terms, using Rose’s (2002a) definition of the GSP and WTO dummies, using alternative estimation procedures: weighted least squares (with trade, real GDP, and real GDP per capita as weights), country-pair random effects, country-pair random effects with importer and exporter fixed effects, and country-pair fixed effects, and finally, discarding outlying observations.13
11 The F-test (with a value of 48.0) suggests that the null hypothesis of the equality of coefficients is easily rejected.
12 We are grateful to Alan Winters for drawing our attention to this point.
13 Specifically, we discard values of the dependent variable that are three and two standard deviations away from the mean, respectively.
12
In all cases, the industrial country dummy is highly significant and the magnitude of the coefficient remains broadly stable. We would draw particular attention to the first row in Table 7, which includes time-varying importer and exporter fixed effects. In economic term, this specification allows multilateral resistance a la Anderson and van Wincoop (2003) to change over time in the panel regression. Qualitatively, this extension does not change our basic conclusion. In fact, our results are even stronger in the sense that the industrial country WTO dummy increases in size while remaining significant.14 The only case in Table 7 where the industrial country coefficient declines significantly is in the specification with country-pair fixed effects estimations, where the coefficient value declines to 0.32, while remaining statistically significant. Conceptually, the specification that includes the country-pair fixed effects asks a “within” question: what does joining the WTO do to the import pattern? The specifications that exclude country-pair fixed effects but otherwise include importer and exporter fixed effects ask a different, “between” question: do WTO members exhibit a different trade patterns from non-members? Our paper has been focusing mostly on the “between” question and demonstrates that industrial country WTO members are significantly more open than non-members. On the “within” question, the effect is smaller numerically but still positive and non-trivial in economic term. The developing country dummy is generally positive and significant but the magnitudes are typically very small.
B. Asymmetries Between New and Old Developing Country Members
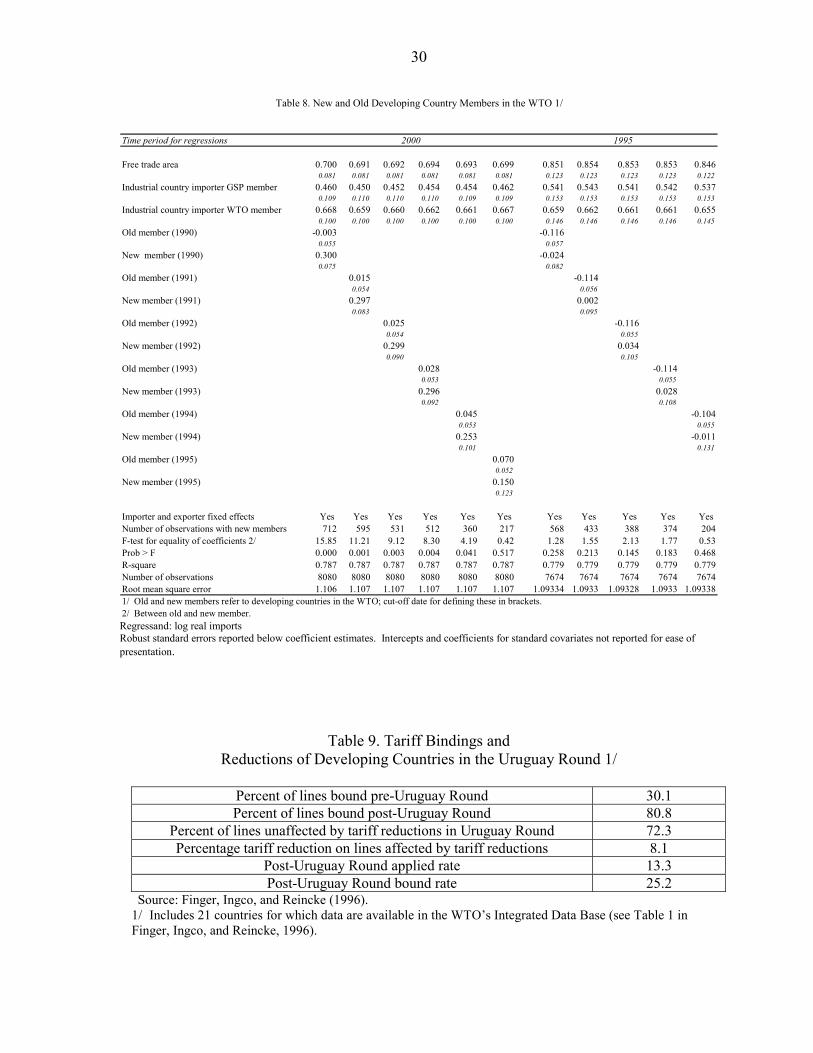
The next question we address is whether there has been any change in the trading patterns of WTO members in the recent past. There is a priori reason to expect changes because it is widely believed that the Uruguay Round marked a watershed in the status of developing countries in the WTO. Specifically, special and differential treatment came under attack in the Uruguay Round. A concerted effort was supposedly made to ensure that developing countries were integrated into the trading system, most notably by requiring them to take on more obligations to liberalize their trade regimes. A related development was on the front of new entrants to the WTO. By many accounts, post-Uruguay Round accessions are supposed to have been qualitatively different in the sense of extracting more trade liberalizing concessions from prospective entrants. But does the data support the proposition that the Uruguay Round really marked a watershed for developing countries? Table 8 attempts to shed light on this question. For the purposes of this table, developing country members are disaggregated into those that were members prior to the Uruguay Round (“old members”) and those that joined after it (“new members”). Given that the Uruguay Round negotiations lasted eight years, the question arises as to what is the 14 Including time-varying fixed effects increases dramatically the number of parameters to be estimated (about 300-350 parameters for each time period). Because of computational limitations, the sample for this specification had to be restricted to data for every ten rather than every 5 years beginning in 1950. The resulting sample contained 28667 observations compared with 55831 observation in the core specification.
13
appropriate cut-off date that distinguishes a possible regime change in the way the WTO treated its old and new members. One possibility would be to make 1995—the date of the formal creation of the WTO—as the cut-off date. But this would be too legalistic; indeed the creation of the WTO with its notion of a single undertaking—whereby all countries adhered to all the Uruguay Round agreements—was the culmination of the process of integrating developing countries into the trading system.15 In the absence of a strong justification for any one particular date, we allow the data to tell us whether and when there was a regime shift. Therefore, in our regressions, we successively define new members as those that joined after 1990, 1991, 1992, 1993, 1994, and 1995. We then test the hypothesis that WTO membership had a different impact on trade for these new members compared with the old ones. These results are reported in Table 8. Regressions for the year 2000 are reported in columns 1–6 while those for 1995 are in columns 7–11. Three features stand out. First, the regressions for 2000 indicate that the coefficient on the new WTO member dummy is positive and significant for all definitions of new members except when 1995 is used as the cut-off date for defining new members. The average coefficient value is about 0.28, representing extra trade of about 30 percent for new members. Second, in the regressions for 2000, the coefficients of the new and old dummies are significantly different from each other except when 1995 is used as the cut-off date for defining new members.16 This is suggestive of a regime change. But how is one to reconcile regime change with the fact that the coefficient on new members becomes smaller in size and statistically insignificant when 1995 is used as the cut-off date? A plausible explanation is that the lag between the start of WTO membership and detectable liberalization efforts is longer than 5 years. Indeed, developing countries are often given very long periods, sometimes up to 15 years, to phase in their liberalization. Columns 7–11 shed some light on this issue by reporting regressions for bilateral imports in 1995, when little time has elapsed for the new WTO members. The coefficients on new members that were significant in the 2000 trade equation become small and insignificant. These results are consistent with the practice of having the liberalization obligations phased in over a period of time. Countries that joined in the early 1990s experienced no significant increase in openness in 1995 but by 2000 they appear to have done so that was worth about an extra 30 percent of trade. 15 In private correspondence, Patrick Low of the WTO suggests that a date as early as the Mexican accession to the GATT in 1986 could be seen as the beginning of the process of integrating developing countries into the trading system.
16 As Table 8 shows, the null hypothesis for equality of coefficients is rejected by the F-tests at the 1 or 5 percent level in 5 of the 6 regressions.
14
We would note, however, that the coefficient on old developing country members is still not positive and statistically significant. This suggests that their obligations to liberalize even after the Uruguay Round have not become stringent enough to actually lead them to be more open than non-WTO members. Evidently, eliminating special and differential still has a long way to go. These are important findings because they sit at odds with the popular view that developing countries were actually integrated into the trading system in the aftermath of the Uruguay Round. In trade terms this did not happen for the old members of the WTO. Although developing countries’ bound tariffs may have come down in the Uruguay Round, actual tariffs barely budged. Table 9 shows that, although the percentage of tariff lines for which bindings (commitments) were taken on by developing countries increased by 50 percentage points due to the Uruguay Round, the actual tariff reductions brought about by the Round were much smaller: only 27 percent of tariff lines involved reductions in applied tariffs, and on these, the reduction was 8 percent. In other words, if tariff reductions are calculated on all tariff lines, the reduction would be about 2 percent. This lack of reductions in applied tariffs appears to be reflected in our result that old WTO members continued to be no more open than non-members even after the Uruguay Round. The irony relating to S&D in the Uruguay Round was that it was eliminated in areas—such as TRIPs—where maintaining it may actually have been welfare-enhancing. But S&D was preserved in the conventional area of trade liberalization in goods where its dilution would have been unambiguously welfare-enhancing.
C. Asymmetries Between Sectors
In this sub-section, we turn our attention to the asymmetry in the trade liberalization across sectors. The proposition that we wish to test is whether WTO membership has a differential impact for the industrial countries between protected and unprotected sectors. If WTO membership is a proxy for trade liberalization, then it should have had a greater impact on trade volumes where barriers came down compared with sectors where barriers have remained high. To explore this issue, we go to a recently available data set on disaggregated bilateral trade (disaggregated at the Harmonized System (HS) 4-digit level) that was not used by Rose (2002 a or b).17 We adopt a two-step strategy. In the first step, we identify sectors that are commonly considered to be highly protected by developed countries and sectors that are supposed to have been liberalized. In the second step, we fit a variation of the augmented gravity model to these data. The objective is to see whether actual patterns of trade volume reflect the known difference in trade barriers.18 17 Rose (2002a) does suggest that a sectoral analysis could shed further light on the impact of WTO membership.
18 For details of the data used in this part of the analysis see the Appendix, while Appendix Table 2 provides the list of countries covered.
15
We begin by describing how we select disaggregated tariff categories into the highly protected and liberalized sectors. First, we sort United States (ad valorem) MFN tariff rates at the HS 4-digit level (on imports from other developed WTO members) in 1990 and 2001 in descending order. We do the same for the European Union’s tariff rates. Second, we identify the set of 4-digit sectors in which both the United States and the EU have tariff rates that are greater than ten percent in both years. Note that these sectors may have additional specific tariffs. A complete list of these products is presented in Appendix Table 3. These 4-digit sectors can be broadly grouped into four categories: agricultural products, clothing, footwear, and other highly protected manufactured products. For each country pair and year, we then sum up the 4-digit imports within each of the four categories. Note that the data base does not have information on non-tariff barriers at this level of disaggregation. Therefore, while we are confident that the sectors that we have chosen are highly protected by developed countries, we cannot be sure if we have left out some other highly protected sectors (due to nontariff barriers). Third, we also collect the set of 4-digit sectors that both the United States and the EU have zero ad valorem and specific tariff rates. We take out agricultural products and raw materials from this list on the ground that there may be various non-tariff barriers that the information in the data base does not capture. We label the remaining set of zero-tariff 4-digit sectors as unprotected sectors. We specify a system of five equations, one for each of the following sectors: (i) unprotected manufacturing; (ii) clothing; (iii) footwear; (iv) agriculture; and (iii) other highly protected manufacturing. LogImport(j,k,S,t) = Z(j,t) γl + ∑ αi Mi + ∑ θhl Xh+ β1lFTA(j,k,t) + β2lGSP(j,k,t)
+ β3l WTO-DVED(j,k,t) + β4lWTO-DING(j,k,t) + ej,k,l,t
where S is an index representing the 5 sectors for which this equation is estimated. The regressors are common for all the equations. The equations have the standard gravity formulations and are identical to that described in Section II. Since the error terms in the five equation are potentially correlated, we estimate the five equations jointly using the Seemingly Unrelated Regression (SUR) technique. Allowing such cross-equation error correlations makes SUR more general than OLS. Each of the five equations has importer and exporter fixed effects and year effects. To allow for maximum flexibility, we do not restrict the parameters on similar regressors in different equations to be the same. The hypothesis that we test is a simple one. Sectors with the highest protection in industrial countries are those where the WTO has been least successful. Hence, WTO membership should have less impact than in sectors characterized by low levels of protection.
16
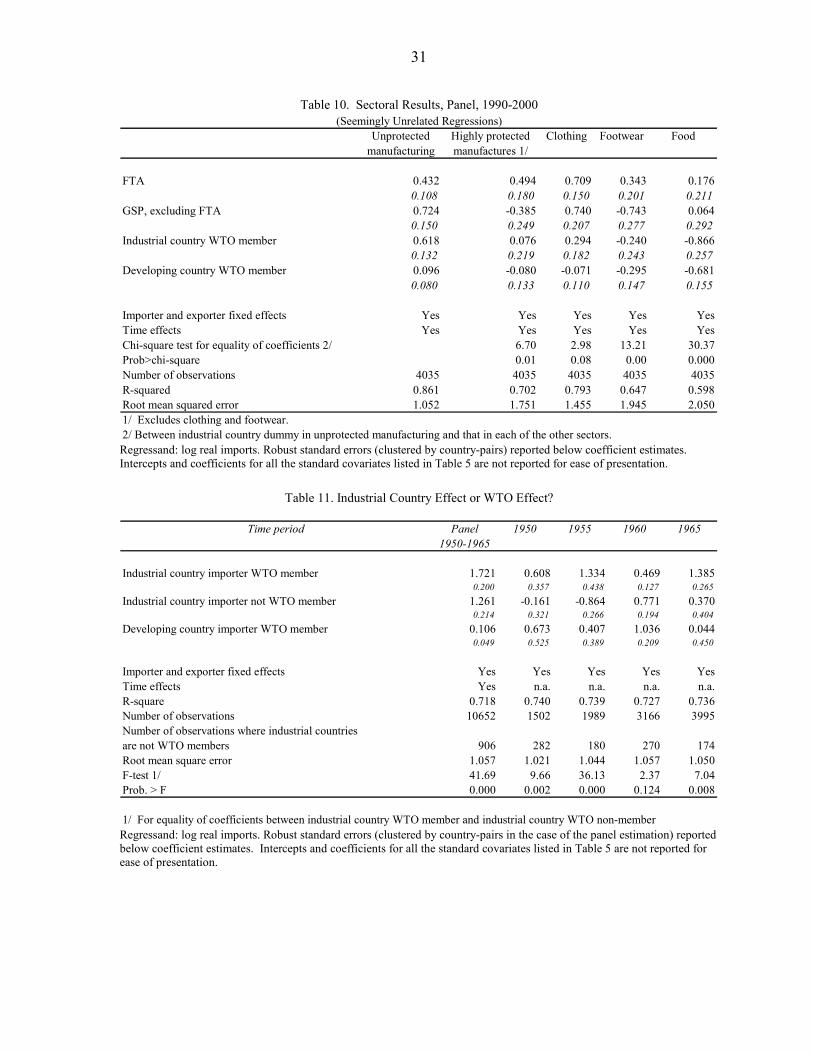
The United Nations WITS trade database has disaggregated data beginning in 1989. Consistent with our aggregate estimations reported earlier, we use data for 1990, 1995, and 2000 and discard observations with import values less than US$500,000. Table 10 presents the results for these estimations. The results for the sector with low protection (column 1) are consistent with the results for aggregate trade: for example, the industrial country WTO dummy is positive and highly significant with a coefficient value of 0.62 which is greater than the coefficient value of 0.5 in the aggregate estimations. We would expect WTO membership to lead to greater trade where it has effected greater liberalization and this is confirmed by our results. The developing country WTO dummy is positive and insignificant as in the aggregate estimations. This is therefore a reassuring benchmark against which we can compare the results for the protected sectors. For three of the four protected sectors—clothing, footwear and other manufacturing—the coefficients of the industrial country dummy are insignificantly different from zero. Formally, they are also significantly smaller than the coefficient in the unprotected sector.19 This provides confirmation that the WTO has not had any significant impact on trade in these sectors as we have postulated.20 For the fourth sector—agriculture—the industrial country WTO dummy is negative and significant. It appears that the exemption of agriculture from WTO disciplines has provided the freedom to industrial countries to throttle trade by introducing very high levels of protection. The permissiveness toward agriculture has proved very costly indeed because the coefficient estimates suggest that the typical industrial country imports of agricultural products is about 60 percent [exp(–0.87)–1] less than that of the average importer in our sample.
D. Industrial Country Effect or WTO Effect?
One of our main and robust findings is that industrial country WTO membership is associated with greater trade. In most years in our sample, however, all industrial countries are WTO members. How can we be sure that we are picking up a WTO effect rather than an industrial country effect? In response we would make a number of points. First, insofar as industrial countries have several distinguishing characteristics collectively and individually we control for them respectively through our various covariates—GDP, per capita GDP, proximity etc.—and our importer and exporter fixed effects. In other words, the results on the WTO dummy do not follow simply because they are richer or larger than other countries or in some ways 19 The hypothesis that the coefficient of the industrial country WTO dummy in the unprotected sector is equal to that in each of the protected sectors is rejected in three instances at the 1 percent level and in one instance at the 10 percent level (the chi-square values are reported in Table 10).
20 The developing country WTO dummy is also insignificant in three of the four protected sectors.
17
geographically or historically distinctive. Nevertheless, it is still possible that there are residual characteristics of industrial countries that are unobservable and therefore omitted from our set of regressors, biasing our results. Second, we also obtain and report some more direct evidence in favor of a WTO rather than an industrial country effect. It turns out that in the early years of our sample (1950-1965), a number of industrial countries (Germany, Austria, and Iceland among others) were not WTO members. We run panel and cross-section regressions for these years and, in addition to the usual industrial country WTO variable, add an industrial country WTO non-member variable. The results are reported in Table 11. The panel regression (column 1) shows that the while both industrial country WTO member and industrial country non-member coefficients are positive and significant, the two are significantly different from each other.21 The difference in the values of the coefficients suggests that an industrial country WTO member importing 200 percent more than an industrial country non-member.22 The year-by-year results (columns 2-5), also confirms, in 3 out of the 4 time periods, an economically and statistically significant difference in the importing patterns between industrial country WTO members and non-members. Third, there is additional evidence suggesting a distinct WTO effect rather than a pure industrial country effect. As Table 10 reports, consistent with the actual patterns of trade liberalization by industrialized countries, the WTO coefficient is different between protected and unprotected sectors. As Column 5 in Tables 5 reports, for industrial country importers, that the import volume depends on whether the exporters are members of the WTO or not. As Table 6 reports, the GSP and WTO coefficients are different for industrial countries. All these results suggest that it is trade and trade policy factors rather than industrial country status per se that underlie these differences. There is a separate question of whether industrial country liberalization would have taken place without the GATT/WTO. This paper does not and cannot address this question. However, if the null hypothesis is that the various rounds of liberalization under the GATT/WTO have not generated discernible patterns in trade volumes, the evidence in this paper can reject that hypothesis. Even on the broader “counterfactual” question, we would say that the evidence is suggestive of a positive role for the GATT/WTO. It should be understood in this context that the GATT/WTO represents a reciprocity framework, which facilitates import liberalization by harnessing the countervailing power of export interests to overcome the resistance from import-competing interests. So the question whether liberalization would have happened 21 The F-test (value of 41.7) rejects the hypothesis of the equality of the two coefficients.
22 The absolute value of the industrial country coefficients is high and greater than the average of the cross-section values possibly because of the fact that the fixed effects in the panel regression are not time-varying. But even the difference in the WTO member and non-member coefficients in the cross-section results point to a large WTO effect.
18
without the GATT/WTO is really one about the effectiveness of and need for a reciprocity framework. Did the reciprocity framework work? A few examples suggest that it did. The first was, of course, the successive multilateral rounds of tariff liberalization involving the United States and Europe. The second, more subtle example of the success of reciprocity comes from the highly protected sectors in industrial countries. Barriers in agricultural, clothing, and footwear have remained high in part because the reciprocity framework was implicitly absent: by embracing the right to protect their own markets (under the concept of special and differential treatment), developing countries opted out of the reciprocity framework, relieving the pressure on industrial countries to reduce barriers in these sectors. And when developing countries started to engage in the reciprocity framework in the Uruguay Round, progress was made, albeit limited, in bringing down industrial country barriers in agriculture and clothing.
E. Other Results
Our analysis also yields a number of additional findings that are worth noting. The first relates to the complaint that industrial countries’ trade policies discriminate against developing countries. Industrial country tariffs are highest in agriculture, textiles and clothing which are sectors of particular export interest to developing countries. This elicits the claim (e.g., Oxfam, 2003) about the unfairness of industrial countries’ trade policies. Column 6 of Table 5 sheds light on this question. The coefficient of the dummy relating to industrial country imports from other industrial countries is greater than that relating to imports from developing countries (where both types of exporters are WTO members) and this difference is statistically different.23 In other words, industrial countries do appear to trade more amongst themselves than with developing countries, ceteris paribus. The magnitudes of the coefficients suggest that trade with developing countries is about 32 percent less than trade with other industrial countries. But we cannot definitively assign this difference to higher barriers rather than to other factors that we may not have controlled for such as product composition, differential transportation costs etc. The second finding relates to the role of the GSP. As in Rose (2002a), GSP imparts a positive fillip to trade. The GSP coefficients are always positive and statistically and economically significant. But there is a disparity in the magnitude of the effects, with our results suggesting that the WTO has a greater economic impact than the GSP. The proper comparison is between industrial country imports under the GSP and under the WTO. Columns 4 and 6 of Table 5 allows us to answer this question. Column (4) suggests that, in terms of industrial country imports, the GSP effect (coefficient value of 0.39) is smaller than the WTO (0.52) effect. Even if we compare industrial country imports from developing countries under the GSP and the WTO, we find that the GSP (coefficient value of 23 The F-test (with a value of 15.0) suggests that the null hypothesis of equality of the two coefficients is rejected at the 5 percent level.
19
0.36) has a smaller effect than the WTO (0.44). In principle, these coefficients should be different from each other because the GSP provides for duty-free access for certain sectors whereas under the WTO the access is subject to the MFN tariff which is always non-negative. The smaller GSP coefficient suggests that product exclusions and the other restrictions under the GSP mitigate its benefits to an extent that makes it not very different from liberalization under the WTO.24 The third finding relates to the evolution in the various coefficients over time (Table 6). It is interesting that the magnitude of the coefficients on the FTA, GSP, and WTO dummies declines over time. The FTA dummy declines from 2.0 in 1970 to 0.7 in 2000 while the GSP dummy declines from 2.2 in 1975 to 0.5 in 2000. One reason for the decline in the FTA and GSP coefficients could be the reduction in average MFN tariffs—brought about by liberalization under the WTO—which reduces the value of preferential access under the GSP and free trade agreements. The temporal behavior of these coefficients could either be a testimony to the benefits of the WTO or to unilateral liberalization around the globe. Can one explain the decline in the magnitude of the WTO coefficient itself? We would suggest two possible answers. First, imports by non-members of the WTO could be increasing at a differentially rapid pace because of unilateral liberalization by them. Second, it could also be the case that as the WTO expands its membership, bringing within its fold a larger share of world trade, the distinction between WTO and non-WTO membership diminishes. Our analysis does not allow us to isolate these different effects. We would conclude this section with some observations on methodology and in particular on the performance of the gravity model as we have specified it. The gravity model appears to perform well in the sense that its results seem to be consistent with what we know about the operation of the WTO, GSP, and FTAs individually and relative to each other. The trading system more broadly seems to be well explained by the gravity specifications. First, in the aggregate panel estimations (Table 5), the FTA coefficient is significantly different from the WTO coefficient consistent with the former effecting deeper liberalization by reducing tariffs to zero.25 In the disaggregated estimations (Table 10), this pattern continues to hold for the protected sectors. Furthermore, the fact that the industrial country WTO coefficient is greater in the unprotected sectors (column 1 of Table 10) than in aggregate (column 4 of Table 5) is also consistent with our priors that WTO membership should lead to more trade precisely where the institution has presided over greater liberalization. 24 When we defined the GSP and WTO dummies in a manner consistent with Rose (2002a), we find that the GSP dummy becomes negative and insignificant, while the industrial country WTO dummy remains positive and significant, albeit with a lower point estimate of 0.21 (Table 7). This is to be expected, as we are looking for the trade effect of the GSP over and above any WTO effect.
25 The F-test (value of 96.7) rejects the null hypothesis of the equality of coefficients.
20
Second, the GSP dummies are insignificant in three of the four protected sectors which is consistent with the observation that industrial countries have tended to exempt the most protected sectors from the benefits granted to developing countries under the GSP program.26 Finally, in Appendix Table 8, we replicate Rose’s results and report some variations. The main result is that Rose’s results appear to be sensitive to the inclusion of country fixed effects:27 when the country effects are included, the WTO dummy (when both countries are members) becomes positive and significant, with the point estimate suggesting greater trade for the average WTO member of between 14 and 35 percent over nonmembers.
IV. SUMMARY AND CONCLUDING REMARKS
Rose (2002a) has seriously called into question the effectiveness and hence the usefulness of the WTO as a multilateral institution. His analysis implies that the WTO, whose raison d’être is to promote trade, has failed to do so. Our paper shows, however, that the GATT/WTO has done a splendid job of promoting trade wherever it was designed to do so and correspondingly failed to promote trade where the design of rules militated against it. The WTO has served to increase industrial country imports substantially, possibly by about 68 percent, the result of successive rounds of tariff liberalization. But it has done a less good job of increasing the imports of developing countries because developing countries were essentially exempted from the basic GATT/WTO mission of progressively lowering import barriers under the so-called principle of special and differential treatment. Luckily, given that industrial countries have accounted for nearly two-thirds of global imports during the period 1950–2000, the positive impact on global trade has been substantial, creating an additional 44 percent worth of current world trade. It is important to stress that the above does not imply that developing countries have not benefited from WTO membership. A distinction needs to be made between developing country WTO members as exporters and importers. Our results suggest that there has been little impact of WTO membership on developing countries’ imports. But the positive impact of WTO membership on industrial country imports meant that imports from developing countries (namely, developing country exports) also increased significantly. Developing country exports to industrial countries, on our estimates, were at least one-third greater because of developing country WTO membership. 26 Mattoo and others (2003) document this for the U.S. GSP scheme.
27 See the coefficient of the WTO dummy (when both are members) in columns 2 and 4 in Appendix Table 8 which include fixed effects and their counterpart specification without fixed effects (columns 1 and 3, respectively). This is recognized but not emphasized in Rose (2002a).
21
Second, there is some evidence that this permissiveness of the WTO toward developing countries has changed since the Uruguay Round. The good news is that new members are significantly different from old members in that membership in the WTO for the former group is associated with an increase in imports of close to 30 percent relative to nonmembers. The bad news is that the Uruguay Round has had little effect on the old members, who continue to be no more open than non-WTO members even in the aftermath of the Round. Special and differential treatment of developing countries is therefore alive and well for the old members of the GATT/WTO. The latter is consistent with the actual pattern of trade liberalization undertaken, or rather not undertaken, by developing countries in the Uruguay Round. Third, WTO membership in sectors with high protection in the industrial countries—food, clothing, and footwear—has had no impact on trade. The link between protection and trade is discernible in the data. Indeed, our paper is also very reassuring about the basic gravity model as we have specified it. The results are consistent with what one knows about the way the WTO, GSP, and FTAs work individually and relative to each other. The trading system as a whole seems to be well explained by appropriately specified gravity equations.
22
Appendix. Data Description and Sources Aggregate estimations Estimating the model requires data on bilateral aggregate trade, incomes, population, distance, as well as geographical, cultural, and historical information. The study uses a panel data set which covers 172 Fund member countries during the five-year periods from 1950 to 2000. The list of countries in the sample is presented in Appendix Table 1. Our data set is a slightly modified and updated version of Rose’s (2002a) data set, which is downloadable from Andrew Rose’s web-site. That paper describes the data set in detail, and we will only comment on a few data issues here. We use bilateral imports rather than trade as the regressand which we obtain from the IMF’s Direction of Trade Statistics. Bilateral imports are those reported by the importing country and measured in U.S. dollars and deflated by US CPI (1982–1983 prices) for urban areas (available from freelunch.com). Real GDP, per capita GDP and population data for 2000 come from the World Bank's World Development Indicators (WDI). WTO and FTA dummies for 2000 are extended based on the information available from the WTO official web site (wto.org). Data and sources for disaggregated estimations The TRAINS (Trade Analysis Information System) of the UNCTAD contains information on tariff and nontariff barriers at the most detailed commodity level. We utilize the US and EU MFN tariff schedules for 1989 and 2001 that are reported in 8-digit HS 1988/1992 and HS 1996 classifications, respectively.28 Our objective is to determine the list of industries subject to high and zero protection both in the US and EU for 1989 and 2001 respectively.29 We use ad valorem rates for these purposes.30 For each product at 4-digit disaggregation level we calculate a simple average of ad valorem rates applied to all 8-digit subsections within that product. We treat a given industry as protected if its average ad valorem tariff rate both in the US and the EU exceeded 10 percent. Similarly, a given 4-digit industry is considered to be unprotected if all the 8-digit subsections have zero tariffs (both ad valorem and non-ad valorem).
28 The 1989 EU tariff lines do not have MFN rates but instead conventional and autonomous rates are reported. We treat conventional tariff rates as MFN rates since they apply to the imports originating in WTO member countries. When conventional tariff rates do not exist for a product the autonomous rates are applied.
29 The last two decades witnessed gradual decline in trade barriers. For industries with no protection we use 1989 data since industries that were not subject to trade barriers are also likely to be so in 2001. Applying the same logic we use 2001 tariff schedules for the list of highly protected industries.
30 We cannot make use of non-ad valorem tariff rates since their use requires information on prices.
23
There are thirty three and forty one 4-digit industries that qualify as protected and unprotected, respectively. For each protected and unprotected industry, we obtain bilateral import data in 1990, 1995, and 2000 which cover 147 countries. The import data which come from the United Nations’ COMTRADE database are disaggregated at the HS 1988/1992, 4-digit level and are deflated by US urban CPI (1982–1984 prices).31 We define four broad product categories—food, clothing, footwear, and miscellaneous manufacturing and, then, sort protected and unprotected industries by categories.32 Not surprisingly, all unprotected industries fall into the miscellaneous manufacturing category. For a given year and country pair we obtain the value of imports in each broad category by summing bilateral imports of all products within that category. Thus, for protected industries our data contain bilateral imports in food, clothing, footwear, and manufacturing. All industries with zero tariff rates are aggregated into unprotected manufacturing. The remaining variables are the same as those used in the aggregate estimations.
31 Since the list of unprotected industries is obtained using tariff line for 2001 which is reported in HS 1996 classification, we use the concordance from HS 1996 to HS 1988/1992.
32 See Appendix Table 3 for the list of industries by level of protection and broad category.
24
REFERENCES
Anderson J.E., 1979, “A Theoretical Foundation for the Gravity Equation,” American Economic Review, Vol. 69, No. 1, pp. 106–16.
______, and E. van Wincoop, 2003, “Gravity with Gravitas: A Solution to the Border
Puzzle,” American Economic Review, Vol. 93, No. 1, pp. 170–92. Bhagwati, J., 1991, The World Trading System at Risk, (London: Harvester Wheatsheaf). Deardorff, A. V., 1998, “Determinants of Bilateral Trade: Does Gravity Work in a
Neoclassical World?” in The Regionalization of the World Economy ed. by J.A. Frankel, (Chicago: University of Chicago Press), pp. 7–22.
Eglin, R., 1987, “Surveillance of Balance-of-Payments Measures in the GATT,” The World
Economy, 10, No. 1, pp. 1–26. Finger, J.M., M.D. Ingco, and U. Reincke, 1996, “The Uruguay Round: Statistics on Tariff
Concessions Given and Received” (Washington: World Bank). Frankel, J., 1997, Regional Trading Blocs in the World Economic System, , (Washington:
Institute for International Economics). ______, 1998, The Regionalization of the World Economy (Chicago: University of Chicago
Press). ______, and D. Romer, 1999, “Does Trade Cause Growth?” American Economic Review,
Vol. 89 No. 3, pp. 379–99. Helpman, E., and P. Krugman, 1995, Market Structure and Foreign Trade, (Cambridge, MA:
MIT Press). Oxfam, 2003, “EU Hypocrisy Unmasked: Why EU Trade Policy Hurts Development,”
Oxfam Policy Papers (Oxford: Oxfam). Mattoo, A., D. Roy, and A. Subramanian, 2003, “The Africa Growth and Opportunity Act
and Its Rules of Origin: Generosity Undermined,” World Economy, Vol. 26, No. 6, pp. 829–51.
Persson T., 2001, “Currency Unions and Trade: How Large Is the Treatment Effect?”
Economic Policy, pp. 433–48. Rose, A.K., 2000, “One Money One Market: The Effect of Common Currencies on Trade,”
Economic Policy, Vol. 30, pp. 9–45.
25
Rose, A.K., 2002a, “Do We Really Know that the WTO Increases Trade?” NBER Working Paper No. 9273 (Cambridge, MA: NBER).
______, A.K., 2002b, “Do WTO Members have More Liberal Trade Policy?” NBER
Working Paper No. 9347 (Cambridge, MA: NBER). ______, A.K., and R. Glick, 2002, “Does a Currency Union Affect Trade? Time-Series
Evidence,” European Economic Review, Vol. 46 No. 6, pp. 1125–51. Wei, S.J., 1996, “Intra-National Versus International Trade: How Stubborn are Nations in
Global Intergration?” NBER Working Paper, No. 5531 (Cambridge, MA: NBER). Wolf, M., 1987, “Differential and More Favorable Treatment of Developing Countries and
the International Trading System,” The World Bank Economic Review, Vol. 1, No. 4, pp. 647–68.
World Trade Organization, 2003, “Trade Restrictions for Balance-of-Payments Purposes—
Notes on Issues Raised by Developing Countries in the Doha Round,” WT, TF/COH/13, Document number 03–0970 (2/14/2003).
World Trade Organization, website www.wto.org/english/thewto_e/minist_e/min99_e/ english/about_e/22fact_e.htm.
26
Table 1: MFN Tariff Cuts by Industrial Countries 1/
Implementation
Period Round Weighted Tariff
Reduction Implied Tariff Level at period beginning
2/ 1948–63 First five GATT rounds
(1947–62) a/ 36 percent 15.4
1968–72 Kennedy Round (1964–67) b/ 37 percent 11.3 1980–87 Tokyo Round (1973–79) c/ 33 percent 8.3 1995–99 Uruguay Round d/ 38 percent 6.2
Source: WTO website: www.wto.org/english/thewto_e/minist_e/min99_e/english/about_e/22fact_e.htm 1/ Industrial products excluding petroleum. 2/ Derived from column 3 and applied to the 2001 tariff level of 4.5 percent reported in Finger, Ingco, and Reincke (1996). a/ US only. b/ US, Japan, EC(6), and UK. c/ US, EU(9), Japan, Austria, Finland, Norway, Sweden and Switzerland. d/ US, EU(12), Japan, Austria, Finland, Norway, Sweden, and Switzerland.
Table 2: Percentage of Tariffs “Bound” in the GATT Prior to Uruguay Round 1/ Industrial Countries 2/ Developing Countries 3/ Industrial Products 84.7 31.8 All Merchandise Trade 80.2 30.1 Source: Table G.2 in Finger, Ingco, and Reincke (1996). 1/ The term “bound” refers to the commitment by countries in the WTO not to raise tariffs beyond a certain level. The fewer the “bound” tariffs, the less the commitment to liberalize trade barriers. The percentages are weighted averages over all product groups and by each country’s MFN imports. 2/ Includes Australia, Austria, Canada, Switzerland, European Union, Finland, Hong Kong, Japan, Norway, New Zealand, Singapore, Sweden, and the U.S. 3/ Includes 21 countries for which data are available in the WTO’s Integrated Data Base (see Table 1 in Finger, Ingco, and Reincke, 1996).
27
Table 3. Use of Trade Restrictions for Balance of Payments Reasons in the GATT/WTO: Selected
Examples 1/ Years of Duration 2/ Invocation 2/ Argentina early 1970s–91 Approx. 20 Bangladesh early 1970s– 30+ Brazil 1949–95 46 Chile 1949–late 70s Approx. 30 Colombia 1985–92 7 Egypt mid-1960s–95 Approx. 30 Ghana late 1950s–late 80s Approx. 30 India 1949–2000 51 Indonesia late 1950s–early 80s Approx. 30 Korea 1968–late 80s Approx. 30 Nigeria 1984–98 14 Pakistan 1949–2001 52 Peru late 1960s–91 Approx. 30 Philippines 1980–95 15 Sri Lanka 1949–98 49 Tunisia mid-1960s–97 Approx. 30 Turkey mid-1950s–97 Approx. 40 Sources: GATT/WTO documents and Eglin, World Economy (1987). 1/ This table does not necessarily indicate how long countries have actually been using quantitative restrictions; rather, it refers to how long countries have sought legal cover for them in the GATT/WTO under Articles XII:B and hence escaped multilateral pressure to eliminate the measures. The table does not include all countries that have invoked the balance-of-payments exceptions to justify trade restrictions. 2/ The years of invocation and duration are not exact.
Sources: United Nations, WITS Trade Database. The average and maximum tariffs are unweighted averages of HS-8 digit tariff lines that make up the corresponding HS 4-digit categories listed in Appendix Table 3 and grouped under the 4 categories in this table.
Sector Max. Average Max. Average Max. Average Max. Average Clothing 23 16 36 17 13 12 33 13Food 180 25 25 14 75 17 350 28Footwear 20 13 48 25 17 17 48 22Misc. manufactures 28 12 38 14 22 13 38 14
Table 4. Tariffs in Highly Protected Sectors in the United States and European Union, 1989 and 2001
1989 2001 EU US EU US
28
(1) (2) (3) (4) (5) (6)Log distance -1.230 -1.229 -0.925 -0.926 -0.919 -0.912
0.020 0.020 0.017 0.017 0.017 0.017Log real GDP importer 0.718 0.821 0.457 0.495 0.538 0.542
0.065 0.064 0.052 0.052 0.051 0.051Log real GDP partner -0.332 -0.276 0.115 0.147 0.115 0.105
0.070 0.069 0.058 0.058 0.058 0.058Log real GDP per capita importer -0.232 -0.336 -0.001 -0.040 -0.084 -0.086
0.059 0.058 0.047 0.047 0.047 0.047Log real GDP per capita partner 0.908 0.858 0.368 0.339 0.365 0.376
0.064 0.064 0.053 0.053 0.053 0.053Common language 0.323 0.307 0.141 0.135 0.130 0.130
0.038 0.037 0.031 0.031 0.031 0.031Common border 0.145 0.161 0.026 0.031 0.026 0.024
0.087 0.085 0.065 0.064 0.064 0.064Common colony 0.553 0.553 0.527 0.529 0.528 0.515
0.058 0.057 0.049 0.049 0.049 0.049Current colony 0.849 0.818 0.936 0.925 0.940 0.947
0.183 0.185 0.138 0.139 0.137 0.136Ever colony 1.353 1.352 1.151 1.151 1.157 1.158
0.090 0.088 0.065 0.065 0.065 0.065Common country 0.272 0.271 -0.658 -0.656 -0.701 -0.694
0.656 0.658 0.527 0.528 0.529 0.527Common currency 1.051 1.046 0.713 0.714 0.728 0.732
0.110 0.109 0.081 0.081 0.080 0.080Free trade area 0.712 1.172 0.780 0.971 0.988 0.997
0.082 0.078 0.048 0.052 0.052 0.052Industrial country importer granting GSP 0.324 1.270 0.042 0.393 0.399 0.389
0.048 0.077 0.038 0.056 0.056 0.056Importer WTO member -0.113 0.140
0.027 0.022Industrial country importer WTO member 0.911 0.521
0.069 0.049Developing country importer WTO member -0.255 0.072
0.029 0.023Industrial country importer and partner WTO members 0.619
0.050Industrial country importer WTO member, but not partner 0.339 0.326
0.058 0.058Developing country importer and partner WTO members 0.043 0.027
0.024 0.024Developing country importer WTO member, but not partner 0.113 0.098
0.041 0.041Industrial country importer WTO member, partner industrial country and WTO member 0.706
0.053Industrial country importer WTO member, partner developing country and WTO member 0.532
0.058
Importer and exporter fixed effects Yes Yes Yes Yes Yes YesTime effects Yes Yes Yes Yes Yes YesNumber of observations 76094 76094 55831 55831 55831 55831Sample All imports excluding values less than $500,000R-square 0.702 0.704 0.714 0.715 0.715 0.715Root mean square error 1.781 1.776 1.171 1.169 1.168 1.168F-test 1/ 15.78, 96.66, 129.31 48.04, 2.97 11.97, 20.721/ Column 4. Numbers correspond to the following three null hypotheses: GSP=WTO, FTA=WTO, FTA=GSPColumn 5. Exporter in WTO = Exporter not in WTO for industrial country and developing country WTO importers, respectivelyColumn 6. Industrial country WTO exporter = Developing country WTO exporter for industrial country imports; andexporter not WTO member = developing country WTO exporter for industrial country imports
All imports
Table 5. Core Regressions. Panel, 1950-2000
Regressand: log real imports. Robust standard errors (clustered by country-pairs) reported below coefficient estimates.
29
1950 1955 1960 1965 1970 1975 1980 1985 1990 1995 2000
Free trade area n.a. n.a. n.a. 1.196 1.988 1.809 1.956 1.008 1.078 0.842 0.701n.a. n.a. n.a. 0.247 0.208 0.169 0.167 0.161 0.147 0.122 0.081
Industrial country importer GSP member n.a. n.a. n.a. n.a. 1.138 2.185 2.180 0.844 0.525 0.533 0.465n.a. n.a. n.a. 0.000 0.342 0.197 0.187 0.191 0.173 0.153 0.109
Industrial country importer WTO member 0.57 0.07 0.47 1.385 1.901 2.184 2.277 1.113 0.867 0.652 0.6700.33 0.50 0.13 0.265 0.238 0.194 0.182 0.187 0.166 0.145 0.100
Developing country importer WTO member 0.67 0.41 0.80 0.044 0.383 0.022 0.083 -0.023 -0.130 -0.096 0.0770.53 0.39 0.21 0.450 0.235 0.067 0.066 0.063 0.057 0.054 0.051
Importer and exporter fixed effects Yes Yes Yes Yes Yes Yes Yes Yes Yes Yes YesR-square 0.740 0.739 0.727 0.736 0.743 0.721 0.735 0.741 0.771 0.779 0.787Number of observations 1502 1989 3166 3995 4738 5688 5968 6316 6715 7674 8080Root mean square error 1.021 1.044 1.057 1.050 1.055 1.174 1.172 1.125 1.092 1.093 1.107
Table 6. Cross-Section Results
Regressand: log real imports. Robust standard errors reported below coefficient estimates. Intercepts and other (standard) covariates not reported for ease of presentation.
Specification FTA GSP Industrial Developing WTO member WTO member
Time-varying importer and exporter fixed effects 1.102 0.718 0.964 0.0470.072 0.096 0.091 0.038
Additional quadratic gravity terms 1.002 0.420 0.552 0.093(for log real GDP and log real GDP per capita) 0.052 0.055 0.048 0.023
Rose definition of GSP and WTO dummies 0.655 -0.106 0.214 0.051(i.e., not defined mutually exclusively) 0.046 0.032 0.064 0.026
Weighted least squares (log imports as weight) 0.921 0.440 0.553 0.0710.050 0.055 0.048 0.023
Weighted least squares (log real GDP as weight) 0.964 0.416 0.541 0.0710.052 0.057 0.050 0.024
Weighted least squares (log real GDP per capita as weight) 0.933 0.398 0.519 0.0600.053 0.057 0.050 0.024
Country-pair random effects without importer and exporter fixed effects 0.941 0.349 0.505 0.0850.036 0.027 0.024 0.015
Country-pair random effects with importer and exporter fixed effects 0.852 0.221 0.355 0.1620.039 0.038 0.033 0.017
Country-pair fixed effects 0.780 0.169 0.322 0.2060.042 0.040 0.034 0.018
Excluding values of log imports 3 s.d. away from mean 0.977 0.383 0.513 0.0730.052 0.056 0.049 0.023
Excluding values of imports 2 s.d. away from mean 1.011 0.345 0.483 0.0800.054 0.057 0.050 0.023
Table 7. Robustness Checks: Panel, 1950-2000
Regressand: log real imports Robust standard errors (clustered by country-pairs) reported below coefficient estimates. Intercepts and coefficients for standard covariates not reported for ease of presentation. All regressions include time effects and, with the exception of the regression with country-pair random effects, also include importer and exporter fixed effects. As noted, the specification in the first row includes time-varying exporter and importer fixed effects.
30
Time period for regressions
Free trade area 0.700 0.691 0.692 0.694 0.693 0.699 0.851 0.854 0.853 0.853 0.8460.081 0.081 0.081 0.081 0.081 0.081 0.123 0.123 0.123 0.123 0.122
Industrial country importer GSP member 0.460 0.450 0.452 0.454 0.454 0.462 0.541 0.543 0.541 0.542 0.5370.109 0.110 0.110 0.110 0.109 0.109 0.153 0.153 0.153 0.153 0.153
Industrial country importer WTO member 0.668 0.659 0.660 0.662 0.661 0.667 0.659 0.662 0.661 0.661 0.6550.100 0.100 0.100 0.100 0.100 0.100 0.146 0.146 0.146 0.146 0.145
Old member (1990) -0.003 -0.1160.055 0.057
New member (1990) 0.300 -0.0240.075 0.082
Old member (1991) 0.015 -0.1140.054 0.056
New member (1991) 0.297 0.0020.083 0.095
Old member (1992) 0.025 -0.1160.054 0.055
New member (1992) 0.299 0.0340.090 0.105
Old member (1993) 0.028 -0.1140.053 0.055
New member (1993) 0.296 0.0280.092 0.108
Old member (1994) 0.045 -0.1040.053 0.055
New member (1994) 0.253 -0.0110.101 0.131
Old member (1995) 0.0700.052
New member (1995) 0.1500.123
Importer and exporter fixed effects Yes Yes Yes Yes Yes Yes Yes Yes Yes Yes Yes Number of observations with new members 712 595 531 512 360 217 568 433 388 374 204F-test for equality of coefficients 2/ 15.85 11.21 9.12 8.30 4.19 0.42 1.28 1.55 2.13 1.77 0.53Prob > F 0.000 0.001 0.003 0.004 0.041 0.517 0.258 0.213 0.145 0.183 0.468R-square 0.787 0.787 0.787 0.787 0.787 0.787 0.779 0.779 0.779 0.779 0.779Number of observations 8080 8080 8080 8080 8080 8080 7674 7674 7674 7674 7674Root mean square error 1.106 1.107 1.107 1.107 1.107 1.107 1.09334 1.0933 1.09328 1.0933 1.093381/ Old and new members refer to developing countries in the WTO; cut-off date for defining these in brackets.2/ Between old and new member.
19952000
Table 8. New and Old Developing Country Members in the WTO 1/
Regressand: log real imports Robust standard errors reported below coefficient estimates. Intercepts and coefficients for standard covariates not reported for ease of presentation.
Table 9. Tariff Bindings and
Reductions of Developing Countries in the Uruguay Round 1/
Percent of lines bound pre-Uruguay Round 30.1 Percent of lines bound post-Uruguay Round 80.8
Percent of lines unaffected by tariff reductions in Uruguay Round 72.3 Percentage tariff reduction on lines affected by tariff reductions 8.1
Post-Uruguay Round applied rate 13.3 Post-Uruguay Round bound rate 25.2
Source: Finger, Ingco, and Reincke (1996). 1/ Includes 21 countries for which data are available in the WTO’s Integrated Data Base (see Table 1 in Finger, Ingco, and Reincke, 1996).
31
Unprotected Highly protected Clothing Footwear Foodmanufacturing manufactures 1/
FTA 0.432 0.494 0.709 0.343 0.1760.108 0.180 0.150 0.201 0.211
GSP, excluding FTA 0.724 -0.385 0.740 -0.743 0.0640.150 0.249 0.207 0.277 0.292
Industrial country WTO member 0.618 0.076 0.294 -0.240 -0.8660.132 0.219 0.182 0.243 0.257
Developing country WTO member 0.096 -0.080 -0.071 -0.295 -0.6810.080 0.133 0.110 0.147 0.155
Importer and exporter fixed effects Yes Yes Yes Yes YesTime effects Yes Yes Yes Yes YesChi-square test for equality of coefficients 2/ 6.70 2.98 13.21 30.37Prob>chi-square 0.01 0.08 0.00 0.000Number of observations 4035 4035 4035 4035 4035R-squared 0.861 0.702 0.793 0.647 0.598Root mean squared error 1.052 1.751 1.455 1.945 2.0501/ Excludes clothing and footwear.2/ Between industrial country dummy in unprotected manufacturing and that in each of the other sectors.
Table 10. Sectoral Results, Panel, 1990-2000(Seemingly Unrelated Regressions)
Regressand: log real imports. Robust standard errors (clustered by country-pairs) reported below coefficient estimates. Intercepts and coefficients for all the standard covariates listed in Table 5 are not reported for ease of presentation.
Time period Panel 1950 1955 1960 19651950-1965
Industrial country importer WTO member 1.721 0.608 1.334 0.469 1.3850.200 0.357 0.438 0.127 0.265
Industrial country importer not WTO member 1.261 -0.161 -0.864 0.771 0.3700.214 0.321 0.266 0.194 0.404
Developing country importer WTO member 0.106 0.673 0.407 1.036 0.0440.049 0.525 0.389 0.209 0.450
Importer and exporter fixed effects Yes Yes Yes Yes YesTime effects Yes n.a. n.a. n.a. n.a.R-square 0.718 0.740 0.739 0.727 0.736Number of observations 10652 1502 1989 3166 3995Number of observations where industrial countriesare not WTO members 906 282 180 270 174Root mean square error 1.057 1.021 1.044 1.057 1.050F-test 1/ 41.69 9.66 36.13 2.37 7.04Prob. > F 0.000 0.002 0.000 0.124 0.008
1/ For equality of coefficients between industrial country WTO member and industrial country WTO non-member
Table 11. Industrial Country Effect or WTO Effect?
Regressand: log real imports. Robust standard errors (clustered by country-pairs in the case of the panel estimation) reported below coefficient estimates. Intercepts and coefficients for all the standard covariates listed in Table 5 are not reported for ease of presentation.
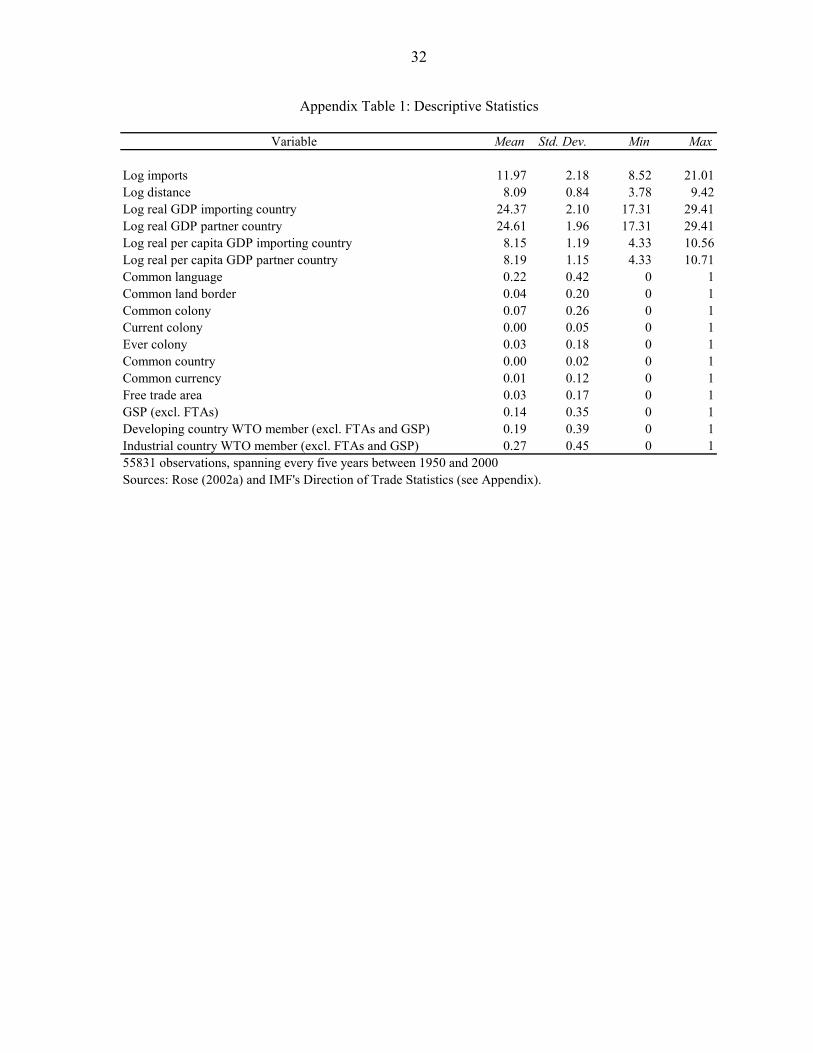
32
Variable Mean Std. Dev. Min Max
Log imports 11.97 2.18 8.52 21.01Log distance 8.09 0.84 3.78 9.42Log real GDP importing country 24.37 2.10 17.31 29.41Log real GDP partner country 24.61 1.96 17.31 29.41Log real per capita GDP importing country 8.15 1.19 4.33 10.56Log real per capita GDP partner country 8.19 1.15 4.33 10.71Common language 0.22 0.42 0 1Common land border 0.04 0.20 0 1Common colony 0.07 0.26 0 1Current colony 0.00 0.05 0 1Ever colony 0.03 0.18 0 1Common country 0.00 0.02 0 1Common currency 0.01 0.12 0 1Free trade area 0.03 0.17 0 1GSP (excl. FTAs) 0.14 0.35 0 1Developing country WTO member (excl. FTAs and GSP) 0.19 0.39 0 1Industrial country WTO member (excl. FTAs and GSP) 0.27 0.45 0 155831 observations, spanning every five years between 1950 and 2000Sources: Rose (2002a) and IMF's Direction of Trade Statistics (see Appendix).
Appendix Table 1: Descriptive Statistics

33
Industrial Countries:AUSTRALIA (1948) GREECE (1950) NORWAY (1948)AUSTRIA (1951) ICELAND (1968) PORTUGAL (1962)BELGIUM (1948) IRELAND (1967) SPAIN (1963)CANADA (1948) ITALY (1950) SWEDEN (1950)DENMARK (1950) JAPAN (1955) SWITZERLAND (1966)FINLAND (1950) LUXEMBOURG (1948) UNITED KINGDOM (1948)FRANCE (1948) NETHERLANDS (1948) UNITED STATES (1948)GERMANY (1951) NEW ZEALAND (1948)
Developing Countries and TerritoriesALBANIA (2000) GHANA (1957) PANAMA (1997)ALGERIA GRENADA (1994) PAPUA N.GUINEA (1994)ANGOLA (1994) GUATEMALA (1991) PARAGUAY (1994)ANTIGUA AND BARBUDA (1987) GUINEA (1994) PERU (1951)ARGENTINA (1967) GUINEA-BISSAU (1994) PHILIPPINES (1979)ARMENIA GUYANA (1966) POLAND (1967)AZERBAIJAN HAITI (1950) QATAR (1994)BAHAMAS HONDURAS (1994) REUNION (1948)BAHRAIN (1993) HONG KONG SAR (1986) ROMANIA (1971)BANGLADESH (1972) HUNGARY (1973) RUSSIABARBADOS (1967) INDIA (1948) RWANDA (1966)BELARUS INDONESIA (1950) SAMOABELIZE (1983) IRAN, ISLAMIC REPUBLIC OF SAO TOME & PRINCIPEBENIN (1996) IRAQ SAUDI ARABIABERMUDA (1948) ISRAEL (1962) SENEGAL (1963)BHUTAN JAMAICA (1963) SEYCHELLESBOLIVIA (1990) JORDAN (2000) SIERRA LEONE (1961)BOTSWANA (1987) KAZAKHSTAN SINGAPORE (1973)BRAZIL (1948) KENYA (1964) SLOVAK REPUBLIC (1993)BULGARIA (1996) KIRIBATI SLOVENIA (1994)BURKINA FASO (1963) KOREA(R) (1967) SOLOMON ISLANDS (1994)BURUNDI (1965) KUWAIT (1963) SOMALIACAMBODIA KYRQYZ REPUBLIC (1998) SOUTH AFRICA (1948)CAMEROON (1963) LAO PEOPLE'S DEM. REP. SRI LANKA (1948)CAPE VERDE LATVIA (1999) ST. KITTS&NEVIS (1994)CENTRAL AFRICAN REP. (1963) LESOTHO (1988) ST.LUCIA (1993)CHAD (1963) LIBERIA ST.VINCENT AND THE GRENADINES (1993)CHILE (1949) LIBYAN ARAB JAMAHIRIYA SUDANCHINA (2001) LITHUANIA (2001) SURINAME (1978)
COLOMBIA (1981)MACEDONIA, former YUGOSLAV REPUBLIC OF SWAZILAND (1993)
COMOROS (1948) MADAGASCAR (1963) SYRIACONGO, DEM. REP. OF (ZAIRE) (1971) MALAWI (1964) TAJIKISTANCONGO, REP. OF (1963) MALAYSIA (1957) TANZANIA (1961)COSTA RICA (1990) MALDIVES (1983) THAILAND (1982)COTE D'IVORIE (IVORY COAST) (1963) MALI (1993) TOGO (1964)CROATIA (2000) MALTA (1964) TONGACYPRUS (1963) MAURITANIA (1963) TRINIDAD&TOBAGO (1962)CZECH REPUBLIC (1993) MAURITIUS (1970) TUNISIA (1990)DJIBOUTI (1994) MYANMAR (1948) TURKEY (1951)DOMINICA (1993) MEXICO (1986) TURKMENISTANDOMINICAN REP. (1950) MOLDOVA (2001) UGANDA (1962)ECUADOR (1996) MONGOLIA (1997) UKRAINEEGYPT (1970) MOROCCO (1987) UNITED ARAB EMIRATES (1994)EL SALVADOR (1991) MOZAMBIQUE (1992) URUGUAY (1953)EQUATORIAL GUINEA NAMIBIA (1992) UZBEKISTANESTONIA (1999) NEPAL VANUATUETHIOPIA NICARAGUA (1950) VENEZUELA (1990)FIJI (1993) NIGER (1963) VIETNAMGABON (1963) NIGERIA (1960) YEMEN, REPUBLIC OFGAMBIA, THE (1965) OMAN (2000) YUGOSLAVIA, SOCIALIST FED. REP. OF (1966)GEORGIA (2000) PAKISTAN (1948) ZAMBIA (1982)
ZIMBABWE (1948)
Sources: Rose (2002a) and WTO website on accession (http://www.wto.org/english/thewto_e/acc_e/acc_e.htm).
Appendix Table 2. List of Countries in the Sample(Dates of GATT/WTO accession in parenthesis)
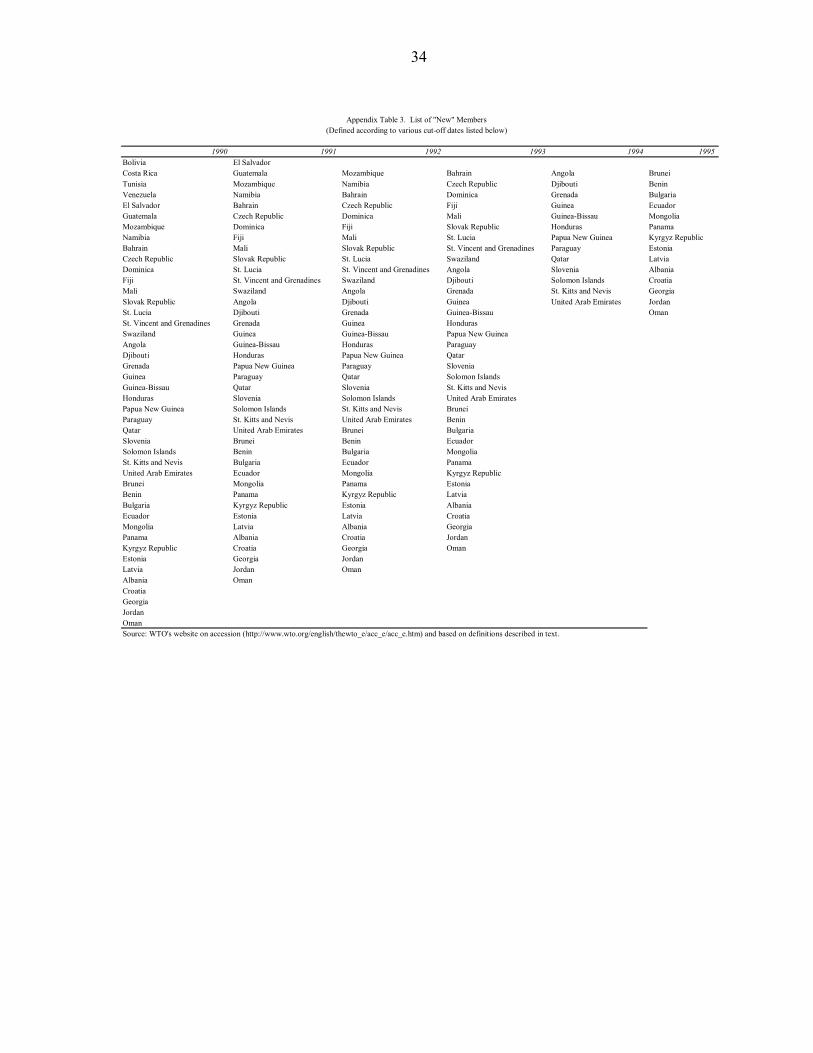
34
1990 1991 1992 1993 1994 1995Bolivia El Salvador Costa Rica Guatemala Mozambique Bahrain Angola BruneiTunisia Mozambique Namibia Czech Republic Djibouti BeninVenezuela Namibia Bahrain Dominica Grenada BulgariaEl Salvador Bahrain Czech Republic Fiji Guinea EcuadorGuatemala Czech Republic Dominica Mali Guinea-Bissau MongoliaMozambique Dominica Fiji Slovak Republic Honduras PanamaNamibia Fiji Mali St. Lucia Papua New Guinea Kyrgyz RepublicBahrain Mali Slovak Republic St. Vincent and Grenadines Paraguay EstoniaCzech Republic Slovak Republic St. Lucia Swaziland Qatar LatviaDominica St. Lucia St. Vincent and Grenadines Angola Slovenia AlbaniaFiji St. Vincent and Grenadines Swaziland Djibouti Solomon Islands CroatiaMali Swaziland Angola Grenada St. Kitts and Nevis GeorgiaSlovak Republic Angola Djibouti Guinea United Arab Emirates JordanSt. Lucia Djibouti Grenada Guinea-Bissau OmanSt. Vincent and Grenadines Grenada Guinea HondurasSwaziland Guinea Guinea-Bissau Papua New GuineaAngola Guinea-Bissau Honduras ParaguayDjibouti Honduras Papua New Guinea QatarGrenada Papua New Guinea Paraguay SloveniaGuinea Paraguay Qatar Solomon IslandsGuinea-Bissau Qatar Slovenia St. Kitts and NevisHonduras Slovenia Solomon Islands United Arab EmiratesPapua New Guinea Solomon Islands St. Kitts and Nevis BruneiParaguay St. Kitts and Nevis United Arab Emirates BeninQatar United Arab Emirates Brunei BulgariaSlovenia Brunei Benin EcuadorSolomon Islands Benin Bulgaria MongoliaSt. Kitts and Nevis Bulgaria Ecuador PanamaUnited Arab Emirates Ecuador Mongolia Kyrgyz RepublicBrunei Mongolia Panama EstoniaBenin Panama Kyrgyz Republic LatviaBulgaria Kyrgyz Republic Estonia AlbaniaEcuador Estonia Latvia CroatiaMongolia Latvia Albania GeorgiaPanama Albania Croatia JordanKyrgyz Republic Croatia Georgia OmanEstonia Georgia JordanLatvia Jordan OmanAlbania Oman Croatia Georgia Jordan Oman Source: WTO's website on accession (http://www.wto.org/english/thewto_e/acc_e/acc_e.htm) and based on definitions described in text.
Appendix Table 3. List of "New" Members(Defined according to various cut-off dates listed below)
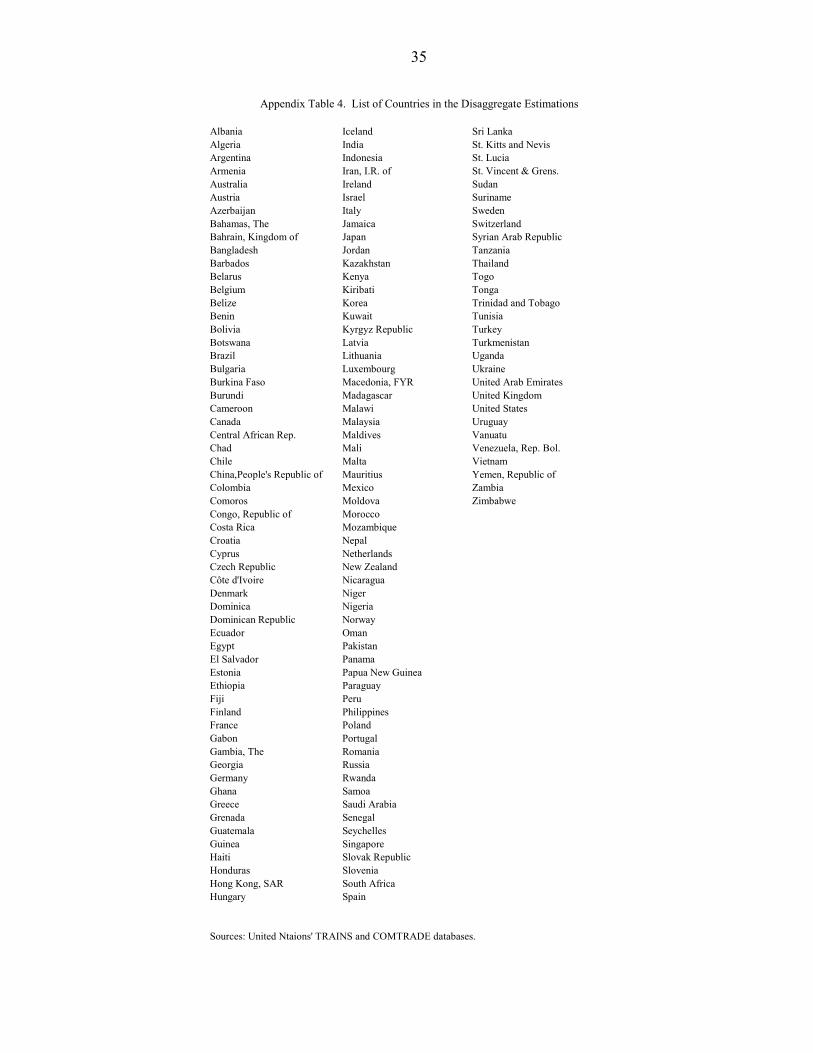
35
Albania Iceland Sri LankaAlgeria India St. Kitts and NevisArgentina Indonesia St. LuciaArmenia Iran, I.R. of St. Vincent & Grens.Australia Ireland SudanAustria Israel SurinameAzerbaijan Italy SwedenBahamas, The Jamaica SwitzerlandBahrain, Kingdom of Japan Syrian Arab RepublicBangladesh Jordan TanzaniaBarbados Kazakhstan ThailandBelarus Kenya TogoBelgium Kiribati TongaBelize Korea Trinidad and TobagoBenin Kuwait TunisiaBolivia Kyrgyz Republic TurkeyBotswana Latvia TurkmenistanBrazil Lithuania UgandaBulgaria Luxembourg UkraineBurkina Faso Macedonia, FYR United Arab EmiratesBurundi Madagascar United KingdomCameroon Malawi United StatesCanada Malaysia UruguayCentral African Rep. Maldives VanuatuChad Mali Venezuela, Rep. Bol.Chile Malta VietnamChina,People's Republic of Mauritius Yemen, Republic ofColombia Mexico ZambiaComoros Moldova ZimbabweCongo, Republic of MoroccoCosta Rica MozambiqueCroatia NepalCyprus NetherlandsCzech Republic New ZealandCôte d'Ivoire NicaraguaDenmark NigerDominica NigeriaDominican Republic NorwayEcuador OmanEgypt PakistanEl Salvador PanamaEstonia Papua New GuineaEthiopia ParaguayFiji PeruFinland PhilippinesFrance PolandGabon PortugalGambia, The RomaniaGeorgia RussiaGermany RwandaGhana SamoaGreece Saudi ArabiaGrenada SenegalGuatemala SeychellesGuinea SingaporeHaiti Slovak RepublicHonduras SloveniaHong Kong, SAR South AfricaHungary Spain
Sources: United Ntaions' TRAINS and COMTRADE databases.
Appendix Table 4. List of Countries in the Disaggregate Estimations
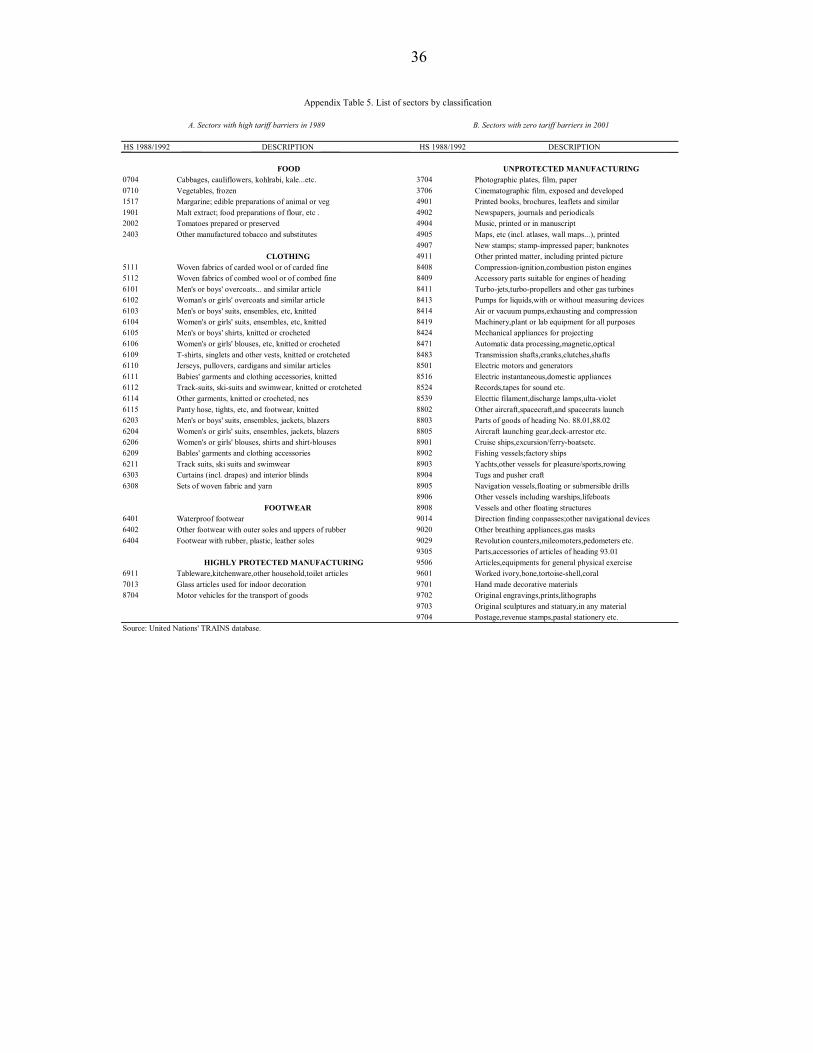
36
HS 1988/1992 DESCRIPTION HS 1988/1992 DESCRIPTION FOOD UNPROTECTED MANUFACTURING
0704 Cabbages, cauliflowers, kohlrabi, kale...etc. 3704 Photographic plates, film, paper 0710 Vegetables, frozen 3706 Cinematographic film, exposed and developed 1517 Margarine; edible preparations of animal or veg 4901 Printed books, brochures, leaflets and similar 1901 Malt extract; food preparations of flour, etc . 4902 Newspapers, journals and periodicals 2002 Tomatoes prepared or preserved 4904 Music, printed or in manuscript 2403 Other manufactured tobacco and substitutes 4905 Maps, etc (incl. atlases, wall maps...), printed
4907 New stamps; stamp-impressed paper; banknotes CLOTHING 4911 Other printed matter, including printed picture
5111 Woven fabrics of carded wool or of carded fine 8408 Compression-ignition,combustion piston engines 5112 Woven fabrics of combed wool or of combed fine 8409 Accessory parts suitable for engines of heading 6101 Men's or boys' overcoats... and similar article 8411 Turbo-jets,turbo-propellers and other gas turbines 6102 Woman's or girls' overcoats and similar article 8413 Pumps for liquids,with or without measuring devices 6103 Men's or boys' suits, ensembles, etc, knitted 8414 Air or vacuum pumps,exhausting and compression 6104 Women's or girls' suits, ensembles, etc, knitted 8419 Machinery,plant or lab equipment for all purposes 6105 Men's or boys' shirts, knitted or crocheted 8424 Mechanical appliances for projecting 6106 Women's or girls' blouses, etc, knitted or crocheted 8471 Automatic data processing,magnetic,optical 6109 T-shirts, singlets and other vests, knitted or crotcheted 8483 Transmission shafts,cranks,clutches,shafts 6110 Jerseys, pullovers, cardigans and similar articles 8501 Electric motors and generators 6111 Babies' garments and clothing accessories, knitted 8516 Electric instantaneous,domestic appliances 6112 Track-suits, ski-suits and swimwear, knitted or crotcheted 8524 Records,tapes for sound etc.6114 Other garments, knitted or crocheted, nes 8539 Electtic filament,discharge lamps,ulta-violet 6115 Panty hose, tights, etc, and footwear, knitted 8802 Other aircraft,spacecraft,and spacecrats launch 6203 Men's or boys' suits, ensembles, jackets, blazers 8803 Parts of goods of heading No. 88.01,88.02 6204 Women's or girls' suits, ensembles, jackets, blazers 8805 Aircraft launching gear,deck-arrestor etc. 6206 Women's or girls' blouses, shirts and shirt-blouses 8901 Cruise ships,excursion/ferry-boatsetc. 6209 Bables' garments and clothing accessories 8902 Fishing vessels;factory ships 6211 Track suits, ski suits and swimwear 8903 Yachts,other vessels for pleasure/sports,rowing 6303 Curtains (incl. drapes) and interior blinds 8904 Tugs and pusher craft6308 Sets of woven fabric and yarn 8905 Navigation vessels,floating or submersible drills
8906 Other vessels including warships,lifeboats FOOTWEAR 8908 Vessels and other floating structures
6401 Waterproof footwear 9014 Direction finding conpasses;other navigational devices 6402 Other footwear with outer soles and uppers of rubber 9020 Other breathing appliances,gas masks 6404 Footwear with rubber, plastic, leather soles 9029 Revolution counters,mileomoters,pedometers etc.
9305 Parts,accessories of articles of heading 93.01 HIGHLY PROTECTED MANUFACTURING 9506 Articles,equipments for general physical exercise
6911 Tableware,kitchenware,other household,toilet articles 9601 Worked ivory,bone,tortoise-shell,coral 7013 Glass articles used for indoor decoration 9701 Hand made decorative materials 8704 Motor vehicles for the transport of goods 9702 Original engravings,prints,lithographs
9703 Original sculptures and statuary,in any material 9704 Postage,revenue stamps,pastal stationery etc.
Source: United Nations' TRAINS database.
Appendix Table 5. List of sectors by classification
A. Sectors with high tariff barriers in 1989 B. Sectors with zero tariff barriers in 2001
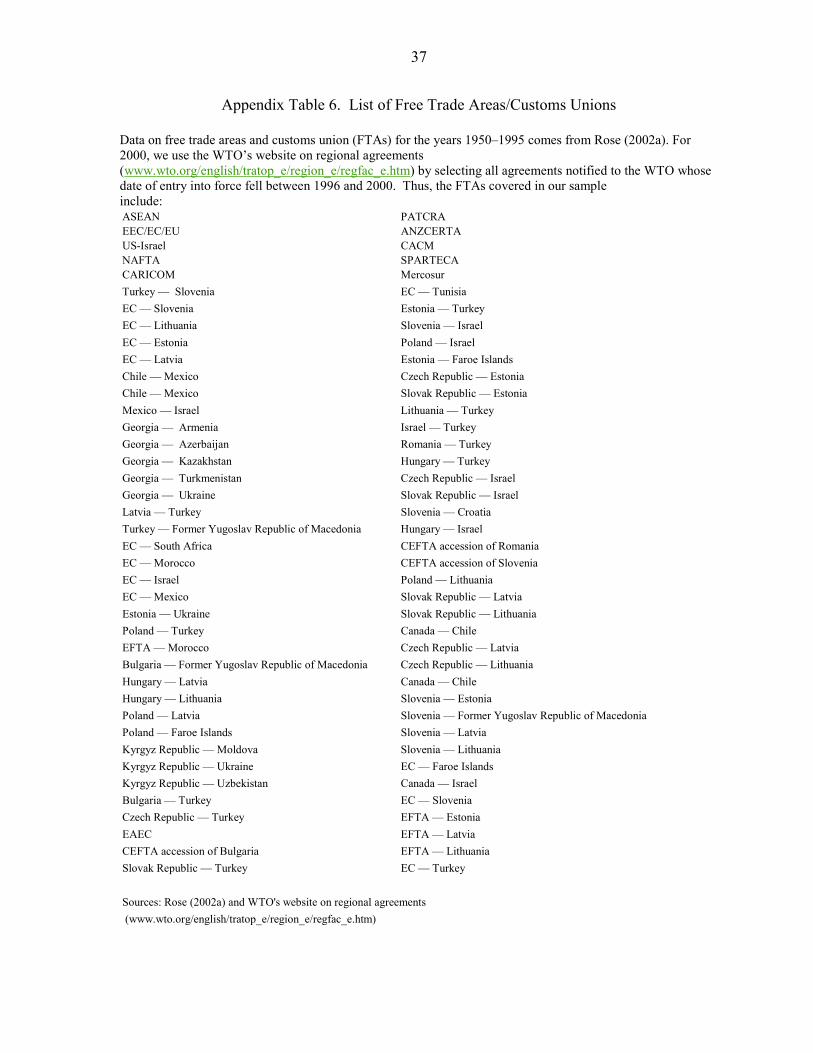
37
Appendix Table 6. List of Free Trade Areas/Customs Unions Data on free trade areas and customs union (FTAs) for the years 1950–1995 comes from Rose (2002a). For 2000, we use the WTO’s website on regional agreements (www.wto.org/english/tratop_e/region_e/regfac_e.htm) by selecting all agreements notified to the WTO whose date of entry into force fell between 1996 and 2000. Thus, the FTAs covered in our sample include:ASEAN PATCRAEEC/EC/EU ANZCERTAUS-Israel CACMNAFTA SPARTECACARICOM MercosurTurkey — Slovenia EC — TunisiaEC — Slovenia Estonia — Turkey EC — Lithuania Slovenia — IsraelEC — Estonia Poland — IsraelEC — Latvia Estonia — Faroe IslandsChile — Mexico Czech Republic — EstoniaChile — Mexico Slovak Republic — EstoniaMexico — Israel Lithuania — Turkey Georgia — Armenia Israel — TurkeyGeorgia — Azerbaijan Romania — Turkey Georgia — Kazakhstan Hungary — Turkey Georgia — Turkmenistan Czech Republic — IsraelGeorgia — Ukraine Slovak Republic — IsraelLatvia — Turkey Slovenia — CroatiaTurkey — Former Yugoslav Republic of Macedonia Hungary — IsraelEC — South Africa CEFTA accession of RomaniaEC — Morocco CEFTA accession of SloveniaEC — Israel Poland — LithuaniaEC — Mexico Slovak Republic — LatviaEstonia — Ukraine Slovak Republic — LithuaniaPoland — Turkey Canada — ChileEFTA — Morocco Czech Republic — LatviaBulgaria — Former Yugoslav Republic of Macedonia Czech Republic — LithuaniaHungary — Latvia Canada — ChileHungary — Lithuania Slovenia — EstoniaPoland — Latvia Slovenia — Former Yugoslav Republic of MacedoniaPoland — Faroe Islands Slovenia — LatviaKyrgyz Republic — Moldova Slovenia — Lithuania Kyrgyz Republic — Ukraine EC — Faroe IslandsKyrgyz Republic — Uzbekistan Canada — IsraelBulgaria — Turkey EC — SloveniaCzech Republic — Turkey EFTA — EstoniaEAEC EFTA — LatviaCEFTA accession of Bulgaria EFTA — LithuaniaSlovak Republic — Turkey EC — Turkey
Sources: Rose (2002a) and WTO's website on regional agreements (www.wto.org/english/tratop_e/region_e/regfac_e.htm)
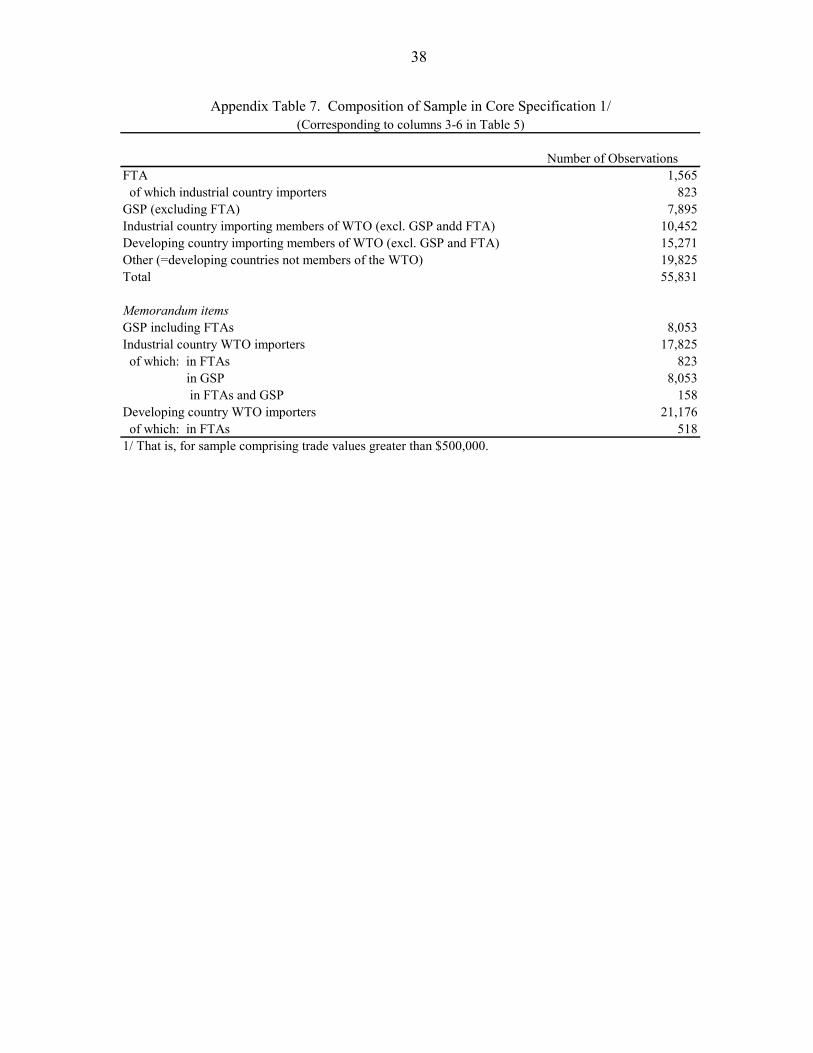
38
Number of ObservationsFTA 1,565 of which industrial country importers 823GSP (excluding FTA) 7,895Industrial country importing members of WTO (excl. GSP andd FTA) 10,452Developing country importing members of WTO (excl. GSP and FTA) 15,271Other (=developing countries not members of the WTO) 19,825Total 55,831
Memorandum itemsGSP including FTAs 8,053Industrial country WTO importers 17,825 of which: in FTAs 823 in GSP 8,053 in FTAs and GSP 158Developing country WTO importers 21,176 of which: in FTAs 5181/ That is, for sample comprising trade values greater than $500,000.
Appendix Table 7. Composition of Sample in Core Specification 1/(Corresponding to columns 3-6 in Table 5)
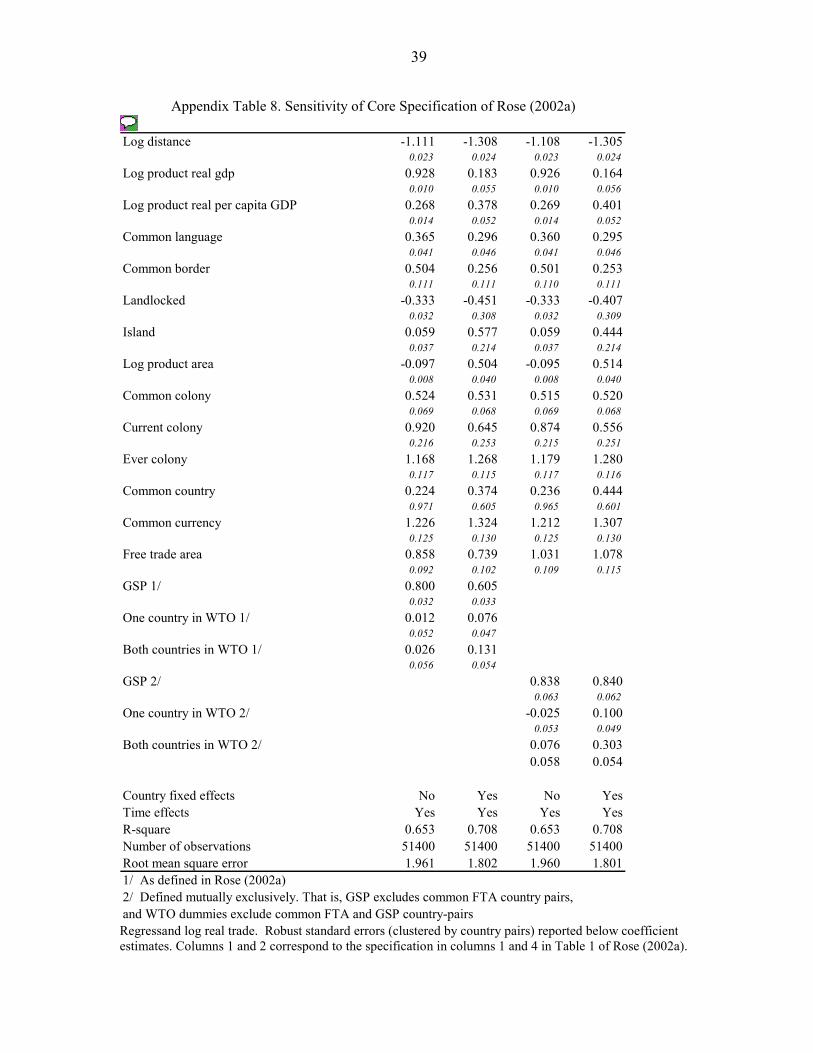
39
Log distance -1.111 -1.308 -1.108 -1.3050.023 0.024 0.023 0.024
Log product real gdp 0.928 0.183 0.926 0.1640.010 0.055 0.010 0.056
Log product real per capita GDP 0.268 0.378 0.269 0.4010.014 0.052 0.014 0.052
Common language 0.365 0.296 0.360 0.2950.041 0.046 0.041 0.046
Common border 0.504 0.256 0.501 0.2530.111 0.111 0.110 0.111
Landlocked -0.333 -0.451 -0.333 -0.4070.032 0.308 0.032 0.309
Island 0.059 0.577 0.059 0.4440.037 0.214 0.037 0.214
Log product area -0.097 0.504 -0.095 0.5140.008 0.040 0.008 0.040
Common colony 0.524 0.531 0.515 0.5200.069 0.068 0.069 0.068
Current colony 0.920 0.645 0.874 0.5560.216 0.253 0.215 0.251
Ever colony 1.168 1.268 1.179 1.2800.117 0.115 0.117 0.116
Common country 0.224 0.374 0.236 0.4440.971 0.605 0.965 0.601
Common currency 1.226 1.324 1.212 1.3070.125 0.130 0.125 0.130
Free trade area 0.858 0.739 1.031 1.0780.092 0.102 0.109 0.115
GSP 1/ 0.800 0.6050.032 0.033
One country in WTO 1/ 0.012 0.0760.052 0.047
Both countries in WTO 1/ 0.026 0.1310.056 0.054
GSP 2/ 0.838 0.8400.063 0.062
One country in WTO 2/ -0.025 0.1000.053 0.049
Both countries in WTO 2/ 0.076 0.3030.058 0.054
Country fixed effects No Yes No YesTime effects Yes Yes Yes YesR-square 0.653 0.708 0.653 0.708Number of observations 51400 51400 51400 51400Root mean square error 1.961 1.802 1.960 1.8011/ As defined in Rose (2002a)2/ Defined mutually exclusively. That is, GSP excludes common FTA country pairs, and WTO dummies exclude common FTA and GSP country-pairs
Appendix Table 8. Sensitivity of Core Specification of Rose (2002a)
Regressand log real trade. Robust standard errors (clustered by country pairs) reported below coefficient estimates. Columns 1 and 2 correspond to the specification in columns 1 and 4 in Table 1 of Rose (2002a).