Embed Size (px)
DESCRIPTION
NCBFAA Government Affairs Conference September 24, 2007. Vessel Operators and Non-Vessel Operators: Partners or Adversaries in Contract Negotiation? Tim Perry APL, Ltd. AGENDA. Trade Outlook We’re in This Together Successes & Challenges Summary. Trade Outlook. - PowerPoint PPT Presentation
Citation preview
NCBFAA Government Affairs ConferenceSeptember 24, 2007
Vessel Operators and Non-Vessel Operators:
Partners or Adversariesin Contract Negotiation?
Tim PerryAPL, Ltd.
AGENDA
1. Trade Outlook2. We’re in This Together3. Successes & Challenges4. Summary
Trade Outlook
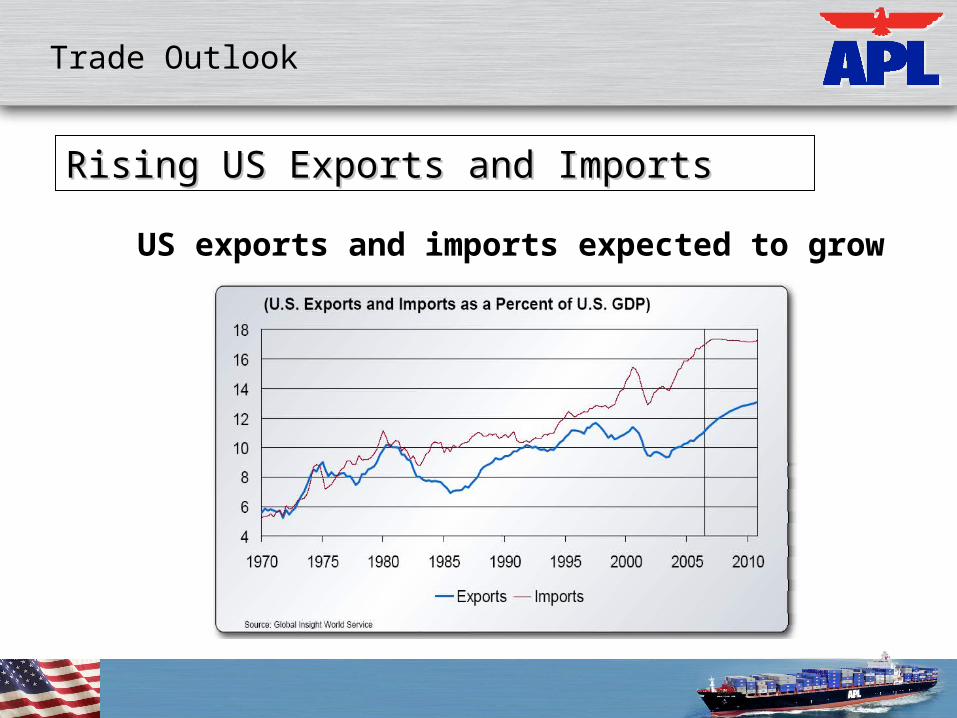
Rising US Exports and ImportsRising US Exports and Imports
US exports and imports expected to grow
Trade Outlook
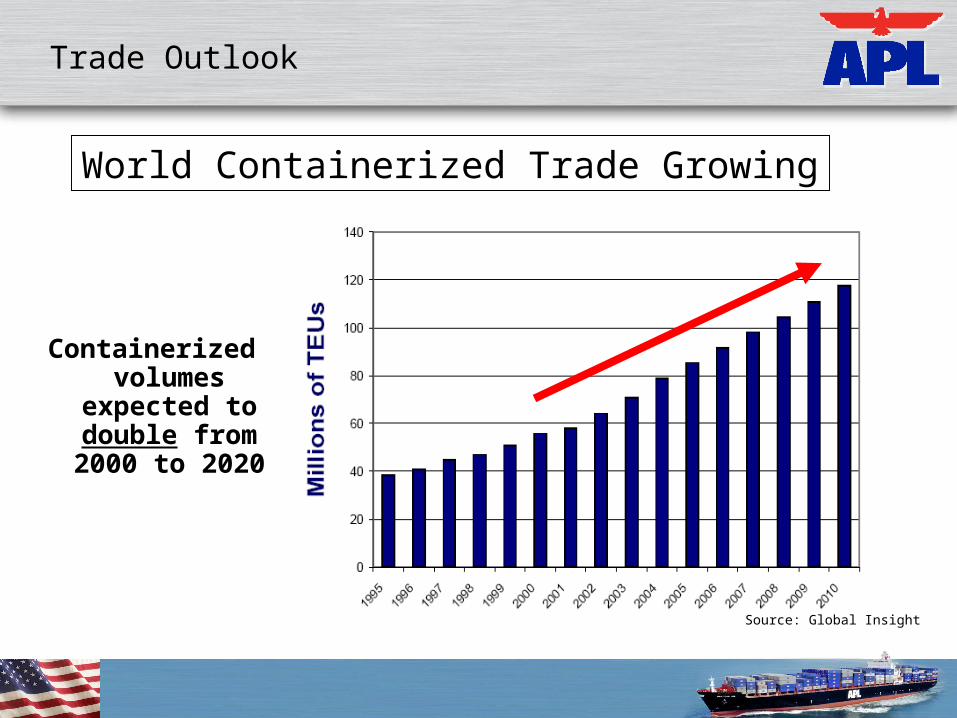
Containerized volumes expected
to double from 2000 to 2020
Source: Global Insight
World Containerized Trade Growing
Trade Outlook
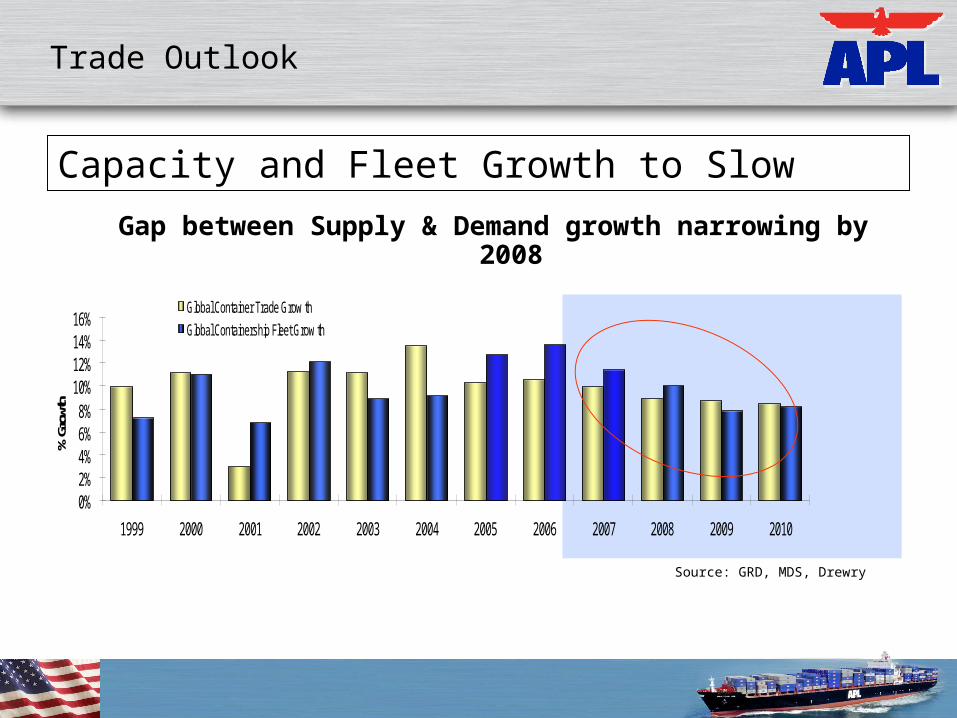
Capacity and Fleet Growth to Slow
Gap between Supply & Demand growth narrowing by 2008
Source: GRD, MDS, Drewry
0%2%4%6%8%
10%12%14%16%
1999 2000 2001 2002 2003 2004 2005 2006 2007 2008 2009 2010
% Gr
owth
Global Container Trade Grow th
Global Containership Fleet Grow th
Trade Outlook
TACOMA
1,776 2,557
SEATTLE
1,7984,396
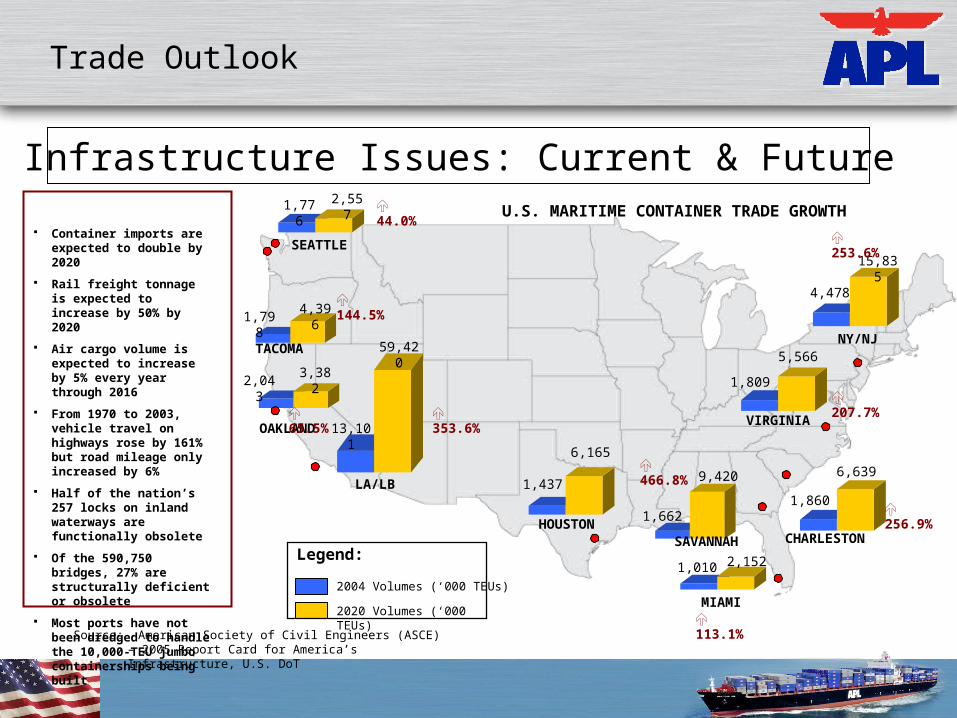
Container imports are expected to double by 2020
Rail freight tonnage is expected to increase by 50% by 2020
Air cargo volume is expected to increase by 5% every year through 2016
From 1970 to 2003, vehicle travel on highways rose by 161% but road mileage only increased by 6%
Half of the nation’s 257 locks on inland waterways are functionally obsolete
Of the 590,750 bridges, 27% are structurally deficient or obsolete
Most ports have not been dredged to handle the 10,000-TEU jumbo containerships being built
OAKLAND
2,0433,382
LA/LB
13,101
59,420
HOUSTON
1,437
6,165
2,1521,010
MIAMI
SAVANNAH
1,662
9,420
CHARLESTON
1,860
6,639
VIRGINIA
1,809
5,566NY/NJ
4,478
15,835
2004 Volumes (‘000 TEUs)
2020 Volumes (‘000 TEUs)
Legend:
U.S. MARITIME CONTAINER TRADE GROWTH
Source: American Society of Civil Engineers (ASCE) – 2005 Report Card for America’s Infrastructure, U.S. DoT
44.0%
144.5%
65.5% 353.6%
113.1%
256.9%
253.6%
207.7%
466.8%
Trade Outlook
Infrastructure Issues: Current & Future

Rail Growth in North America
Intermodal traffic in US has almost
doubled in the past 15 years – trend likely to continue
Trade Outlook
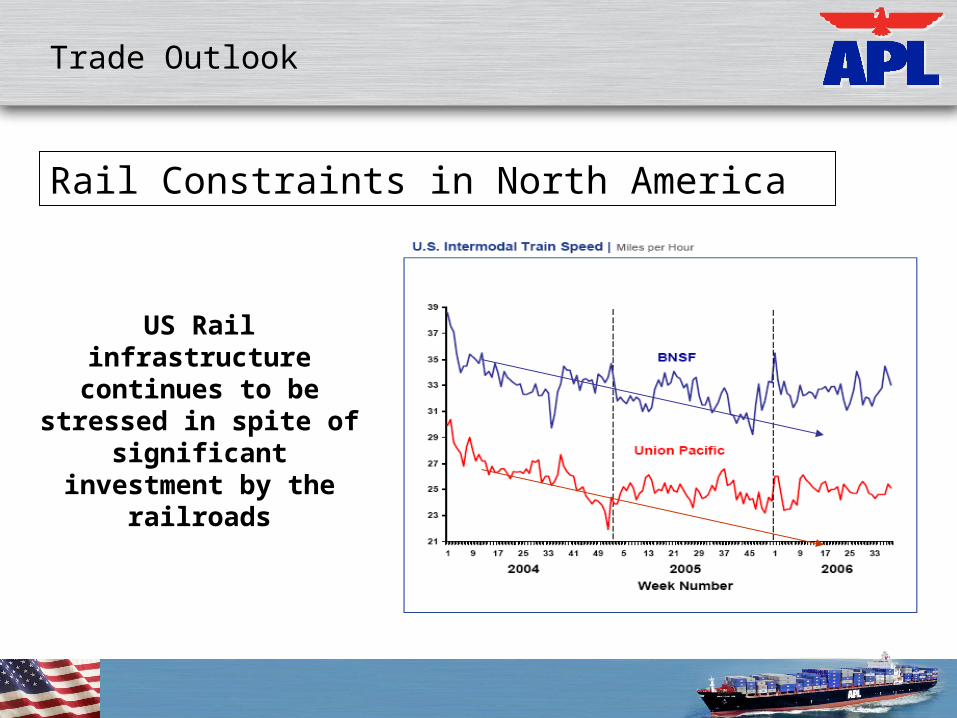
Rail Constraints in North America
US Rail infrastructure continues to be stressed
in spite of significant investment by the
railroads
Trade Outlook
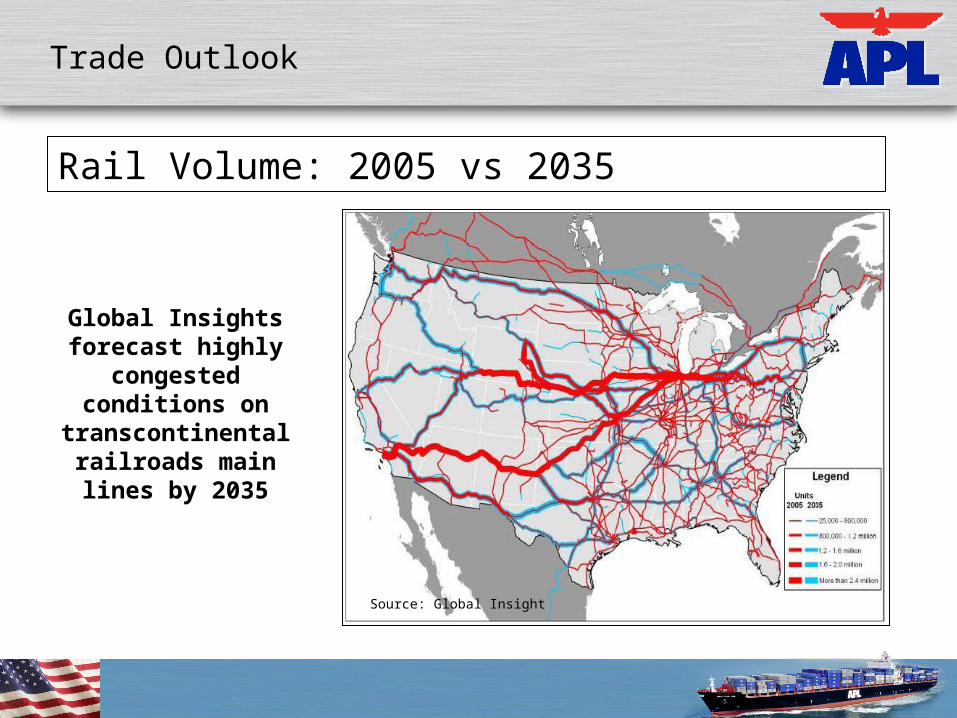
Global Insights forecast highly
congested conditions on
transcontinental railroads main lines
by 2035
Rail Volume: 2005 vs 2035
Source: Global Insight
Trade Outlook
Trade Outlook
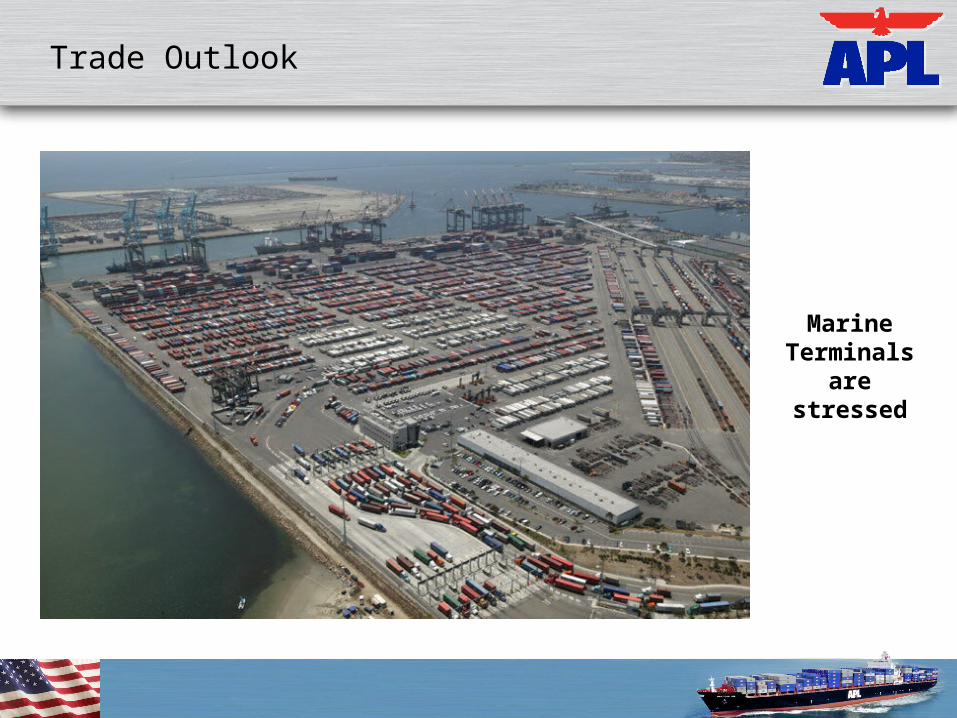
Marine Terminals are
stressed
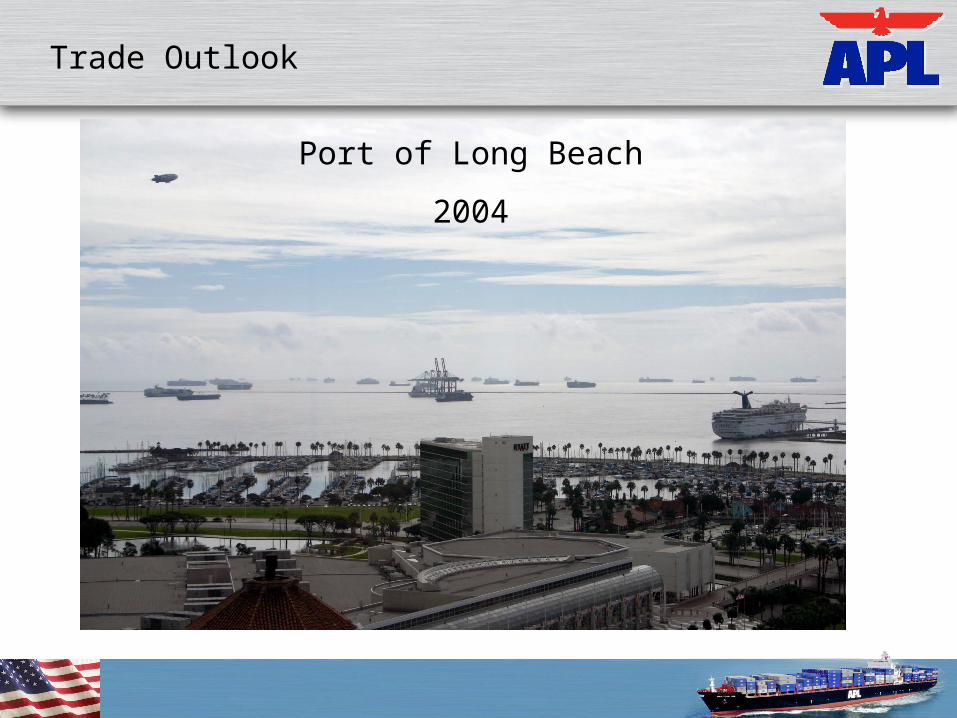
Port of Long Beach
2004
Trade Outlook
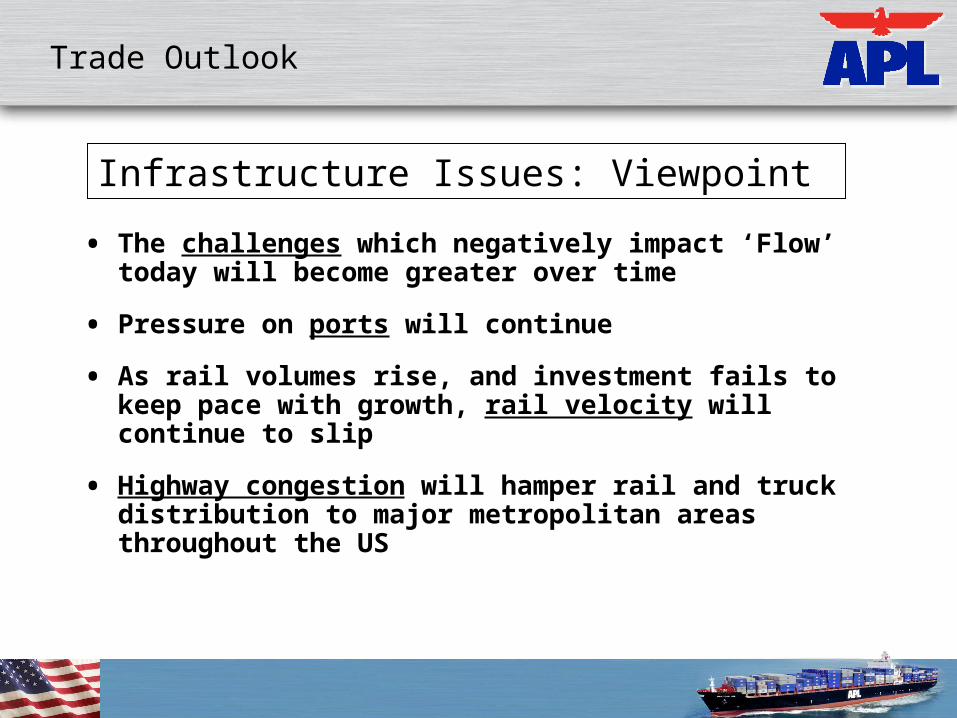
Infrastructure Issues: Viewpoint
• The challenges which negatively impact ‘Flow’ today will become greater over time
• Pressure on ports will continue
• As rail volumes rise, and investment fails to keep pace with growth, rail velocity will continue to slip
• Highway congestion will hamper rail and truck distribution to major metropolitan areas throughout the US
Trade Outlook
We’re All In This Together
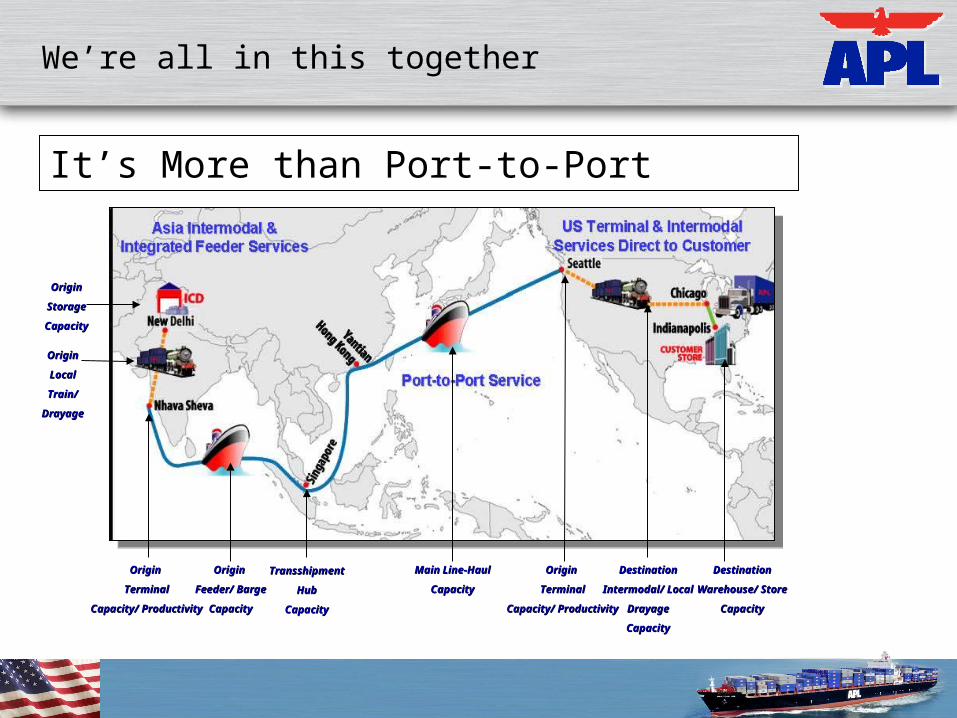
It’s More than Port-to-Port
OriginOrigin
LocalLocal
Train/Train/
DrayageDrayage
Origin Origin
Feeder/ BargeFeeder/ Barge
CapacityCapacity
Main Line-HaulMain Line-Haul
CapacityCapacity
DestinationDestination
Intermodal/ LocalIntermodal/ Local
DrayageDrayage
CapacityCapacity
Origin Origin
TerminalTerminal
Capacity/ ProductivityCapacity/ Productivity
Origin Origin
TerminalTerminal
Capacity/ ProductivityCapacity/ Productivity
DestinationDestination
Warehouse/ StoreWarehouse/ Store
CapacityCapacity
TransshipmentTransshipment
HubHub
CapacityCapacity
OriginOrigin
StorageStorage
CapacityCapacity
We’re all in this together
• Parties have everything to gain by partnering.
• “Closeness” – from booking through delivery.- Vessel Schedules- Port Rotation- Cargo Details- Info that Shipper is NVO
→ VOC must know in order to manifest properly.
• Demurrage is a symptom of low cargo velocity.
We’re all in this together
Successes and Challenges
• “24 Hour Rule”
- Special BL
- Master BL and House BL relationship
• Exams
- Random VACIS, “Pop & Tap”
- FDA
- “1M”
Successes and Challenges
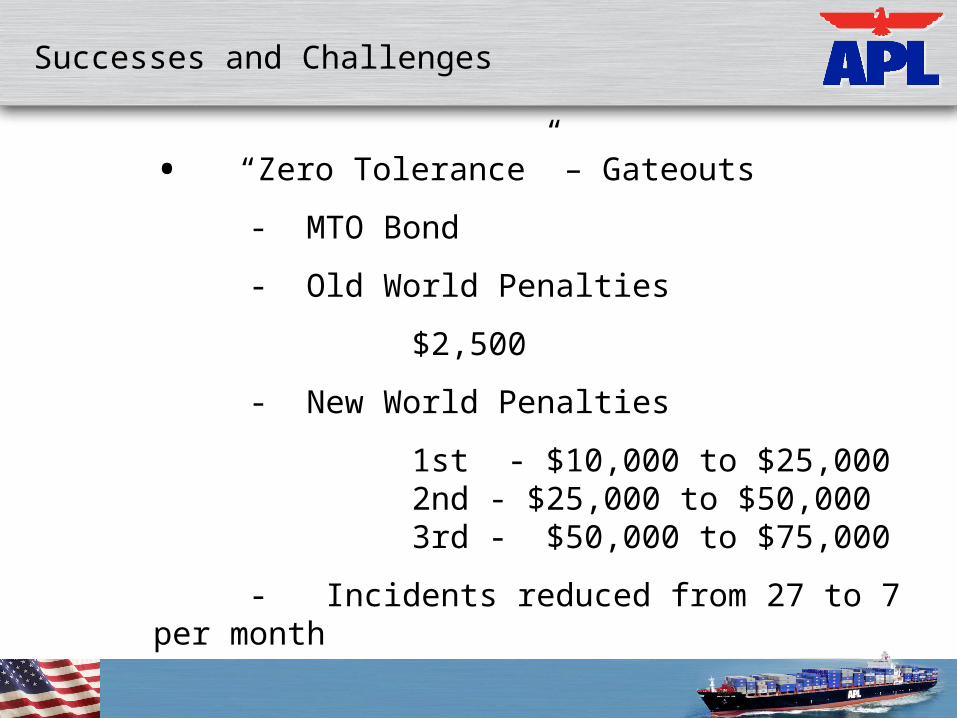
• “Zero Tolerance” – Gateouts
- MTO Bond
- Old World Penalties
$2,500
- New World Penalties
1st - $10,000 to $25,000 2nd - $25,000 to $50,000 3rd - $50,000 to $75,000
- Incidents reduced from 27 to 7 per month
Successes and Challenges
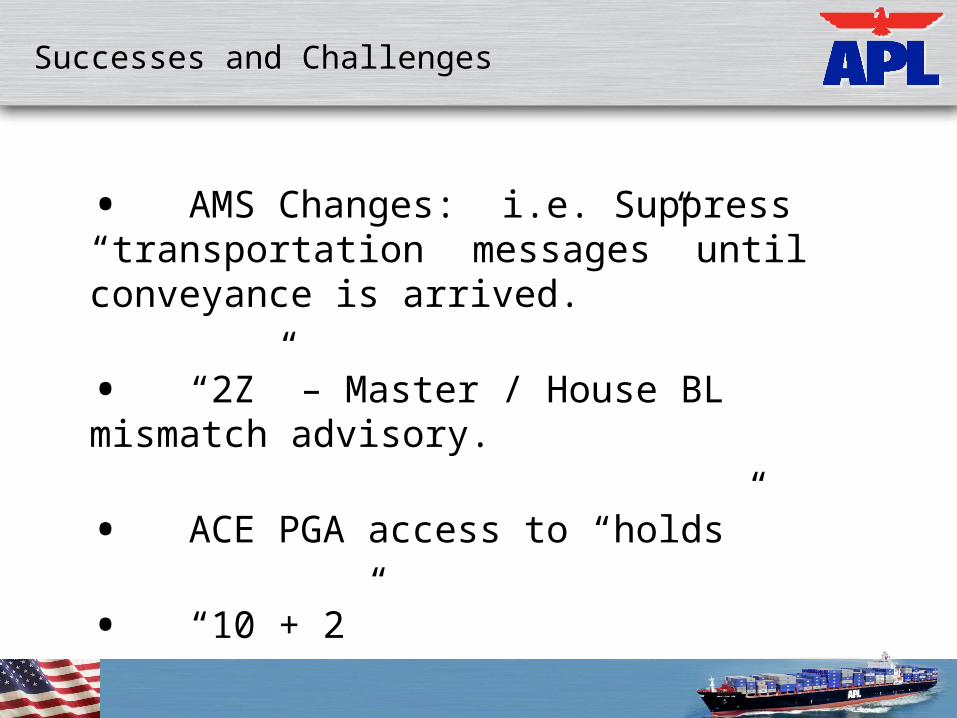
• AMS Changes: i.e. Suppress “transportation messages” until conveyance is arrived.
• “2Z” – Master / House BL mismatch advisory.
• ACE PGA access to “holds”
• “10 + 2”
Successes and Challenges
Summary
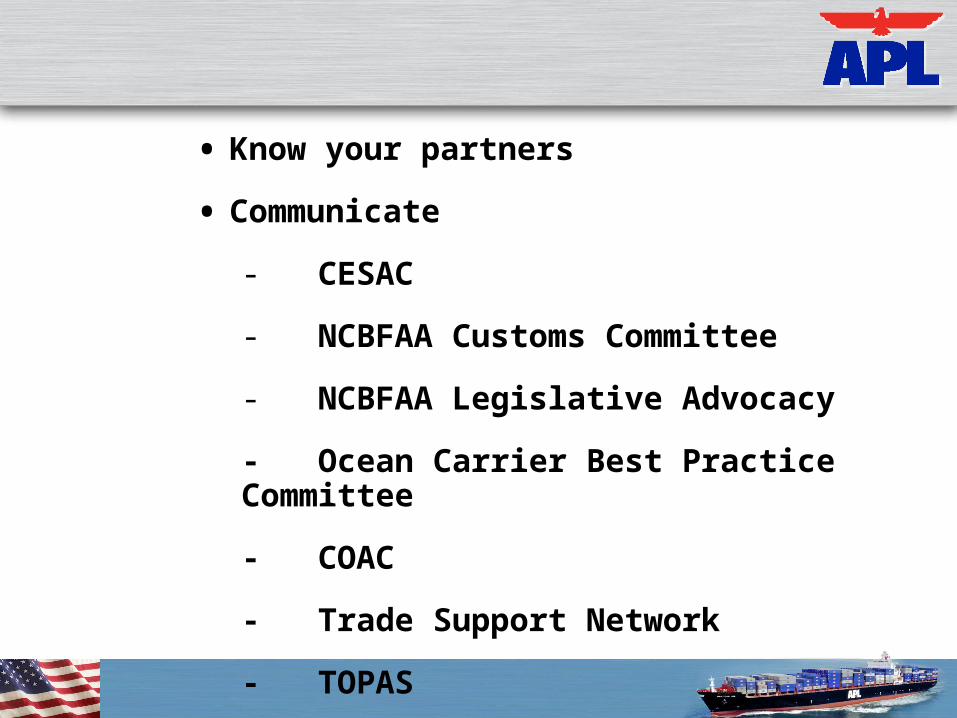
• Know your partners
• Communicate
- CESAC
- NCBFAA Customs Committee
- NCBFAA Legislative Advocacy
- Ocean Carrier Best Practice Committee
- COAC
- Trade Support Network
- TOPAS
Thank you.
Tim PerryAPL, Ltd.1667 K Street NW, Suite 400Washington, DC 20006
[email protected] 202.496.2482
NCBFAA Government Affairs ConferenceSeptember 24, 2007