Embed Size (px)
Citation preview
1
U.S. Department of Commerce
National Oceanic and Atmospheric Administration National Weather Service
National Centers for Environmental Prediction 5830 University Research Court
College Park, MD 20740
NCEP Office Note 472
The NEMS GFS Aerosol Component: NCEP’s global aerosol forecast system
Sarah Lu1, Arlindo da Silva2, Mian Chin2, Jun Wang1, Shrinivas Moorthi1, Henry Juang1,
Hui-Ya Chuang1, Youhua Tang3, Luke Jones4, Mark Iredell1, and Jeffery McQueen1
1 NOAA/NCEP Environmental Modeling Center
2 NASA Goddard Space Flight Center 3 NESDIS Center for Satellite Applications and Research 4 European Centre for Medium-Range Weather Forecasts
November 2013
2
TABLE OF CONTENTS
1. Introduction 3
2. Model Configuration 4
2.1 Atmospheric Model: NEMS GFS 4
2.2 Aerosol Model: GOCART 5
2.3 Linking NEMS GFS with GOCART 6
3. NGAC Operational Implementation 7
3.1 The Q4FY12 Implementation 7
3.2 NGAC Products Descriptions and Distributions 8
4. NGAC Evaluation and Applications 9
5. Summary 11
References 13
Appendix 15
3
1. Introduction
Aerosols affect the radiation budget both directly (through scattering and absorption) and
indirectly (through cloud-radiation interaction). Dust-laden Saharan air layer is found to reduce
occurrences of deep convection and suppress tropical cyclone activities in the North Atlantic and
Caribbean (Dunion and Velden, 2004). Aerosols may be viewed in their role as air pollutants,
regulated by the environmental agencies because of their adverse health effects. Long range
transport of aerosol pollutants is found to impact air quality as well as visibility across
international borders and across the oceans.
The Global Forecast System (GFS) is the cornerstone of the operational production suite of
numerical guidance at National Centers for Environmental Prediction (NCEP). The atmospheric
forecast model used in the GFS consists of a global spectral model (GSM) with a comprehensive
physics suite (Moorthi et al., 2001 with recent upgrades documented at the GFS webpage at
http://www.emc.ncep.noaa.gov/GFS/doc.php). The analysis system used in the GFS is a three-
dimensional hybrid variational-Ensemble Kalman Filter (EnKF) system (Wang et al., 2013).
The physical processes crucial for modeling the aerosol effects are, however, either poorly
represented or missing in NCEP’s global forecast and assimilation system. In the forecast
model, the aerosol attenuation are determined from prescribed aerosol distributions based on a
global climatological aerosol database (Hess et al., 1998) and the aerosol indirect effects on
clouds and precipitation formation are not accounted for. Background aerosol conditions are
currently assumed in the analysis system. For atmospheric conditions with anomalously high
aerosol loading, bias correction and quality control procedures could be compromised due to the
unaccounted effects of aerosol attenuation.
Efforts to develop a prognostic aerosol capability at NCEP have been underway within
NCEP Environmental Modeling Center (EMC). Specifically, EMC has collaborated with NASA
Goddard Space Flight Center (GSFC) to develop NEMS GFS Aerosol Component (NGAC) for
predicting the distribution of atmospheric aerosols over a global domain. The forecast model
component is the Global Forecast System (GFS) within NOAA Environmental Modeling System
(NEMS) and the aerosol component is Goddard Chemistry Aerosol Radiation and Transport
(GOCART) Model.
4
NGAC provides the first operational global aerosol forecasting capability at NOAA. The
first implementation, NGAC Version 1 (NGAC V1), provides dust-only guidance since
September 2012. The rational for developing global aerosol forecasting and assimilation
capabilities at NCEP includes: (1) To improve weather forecasts and climate predictions by
taking into account of aerosol effects on radiation and clouds; (2) To improve the handling of
satellite observations by properly accounting for aerosol effects during the data assimilation
procedure; (3) To provide the necessary aerosol (lateral and upper) boundary conditions for
regional air quality predictions; and (4) To assess the aerosol impact on climate, human health,
ecosystem, and visibility.
This document describes model configuration in section 2. The operational
implementation of NGAC Version 1 is discussed in Section 3. Model evaluation and
applications are presented in Section 4. Concluding Remarks are given in Section 5.
2. Model Configuration
2.1 Atmospheric Model: NEMS GFS
The efforts to develop a unified modeling framework to streamline the interaction of
analysis, forecast, and post-processing systems within NCEP have been underway since late
2000 (Black et al., 2009). Specifically, NCEP EMC is developing NOAA Environment
Modeling System (NEMS, http://www.emc.ncep.noaa.gov/index.php?branch=NEMS) with a
component-based architecture following the Earth System Modeling Framework (ESMF)
(http://www.earthsystemmodeling.org), marking the first general use of ESMF technology within
NCEP. The ESMF collaboration involves many of the major climate, weather and data
assimilation efforts in the U.S., including NOAA/NCEP, NASA Global Modeling and
Assimilation Office (GMAO), the National Center for Atmospheric Research (NCAR), and the
Naval Research Laboratory (NRL). This multi-agency effort aims to promote the exchange and
reusability of earth system modeling components and to facilitate faster knowledge transfer and
technology adaptation.
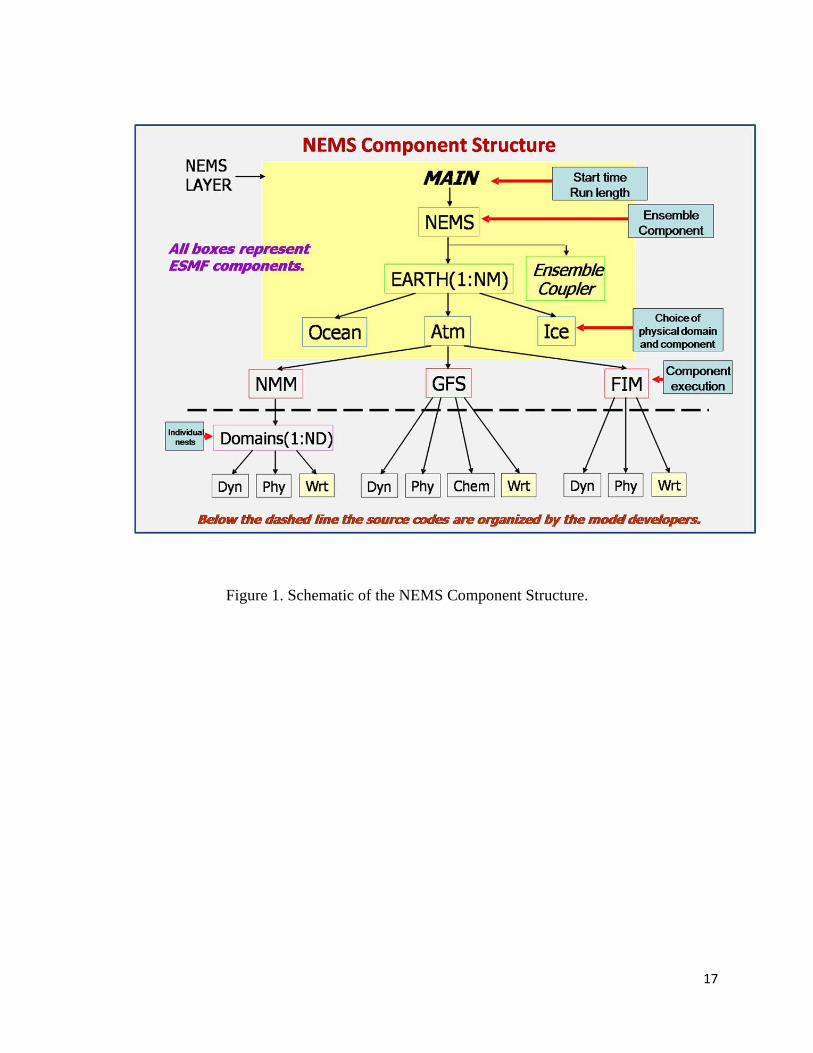
The general design for NEMS is depicted in Figure 1. ESMF organizes NEMS atmosphere
model into collections of components with standardized interfaces, arranged in a hierarchical
structure. Currently the Global Forecast System (GFS), the B-grid version of Nonhydrostatic
5
Multiscale Model (NMM-B), and the Flow-following finite-volume Icosahedral Model (FIM)
have been placed under the NEMS framework. A unified I/O system has been developed to
handle the synchronous production and writing of output, which in turn has been linked with
NCEP’s unified post-processing system.
The FIM atmosphere model is developed by NOAA Earth System Research Laboratory
(ESRL). The NMM-B model, developed by NCEP, is the North American Model (NAM,
http://www.emc.ncep.noaa.gov/index.php?branch=NAM) providing operational meso-scale
weather forecasts since October 2011. The NEMS version of GFS, also developed by NCEP,
consists of the same spectral dynamic core and physics parameterization as the operational GFS
with the following exceptions. First, GFS atmospheric model has been restructured to include
separate components for the model’s dynamics and physics as well as a coupler through which
information is passed between the dynamics and physics. Second, enhanced I/O and post-
processing capabilities are introduced in the NEMS GFS. These include the option to output
history files in native Gaussian grids instead of spectral grids and the option to run model
integration in parallel to post-processing. Third, GFS physics parameterizations have been re-
structured with a flexible interface, allowing it to be called by other dynamic cores. The option
to assemble GFS physics as the NEMS unified physics package again reflects NCEP’s modeling
strategy toward a unified yet flexible modeling infrastructure. Fourth, research and development
have been made to enable emerging capabilities in the NEMS GFS. The prognostic aerosol
capability discussed in this paper consists of NEMS GFS with the aerosol option turned on. The
Whole Atmosphere Model (WAM) developed by NCEP Space Weather Prediction Center
(SWPC), spanning from the surface to the thermosphere, has been adopted into NEMS GFS via
EMC-SWPC collaboration and is targeted for operational implementation in 2015. In addition,
extensive work is already under way to develop a fully coupled atmosphere-land-sea ice-ocean
prediction system (Climate Forecast System Version 3, CFS V3) by coupling NEMS GFS with
the ocean model.
2.2 Aerosol Model: GOCART
Funded mainly by NASA Earth Science programs, the GOCART model was developed to
simulate atmospheric aerosols (including sulfate, black carbon (BC), organic carbon (OC), dust,
and sea-salt), CO, and sulfur gases (Chin et al., 2000, 2002, 2004, 2009; Ginoux et al., 2001,
6
2004; Bian et al., 2010; Kim et al., 2013). Originally GOCART was developed as an off-line
Constituent Transport Model (CTM), driven by assimilated meteorological fields from the
Goddard Earth Observing System Data Assimilation System (GEOS DAS). As part of the
Goddard Earth Observing System Versions 5 (GEOS-5) atmospheric model development at
NASA GSFC, an ESMF compliant GOCART grid component has been developed (Colarco et al.
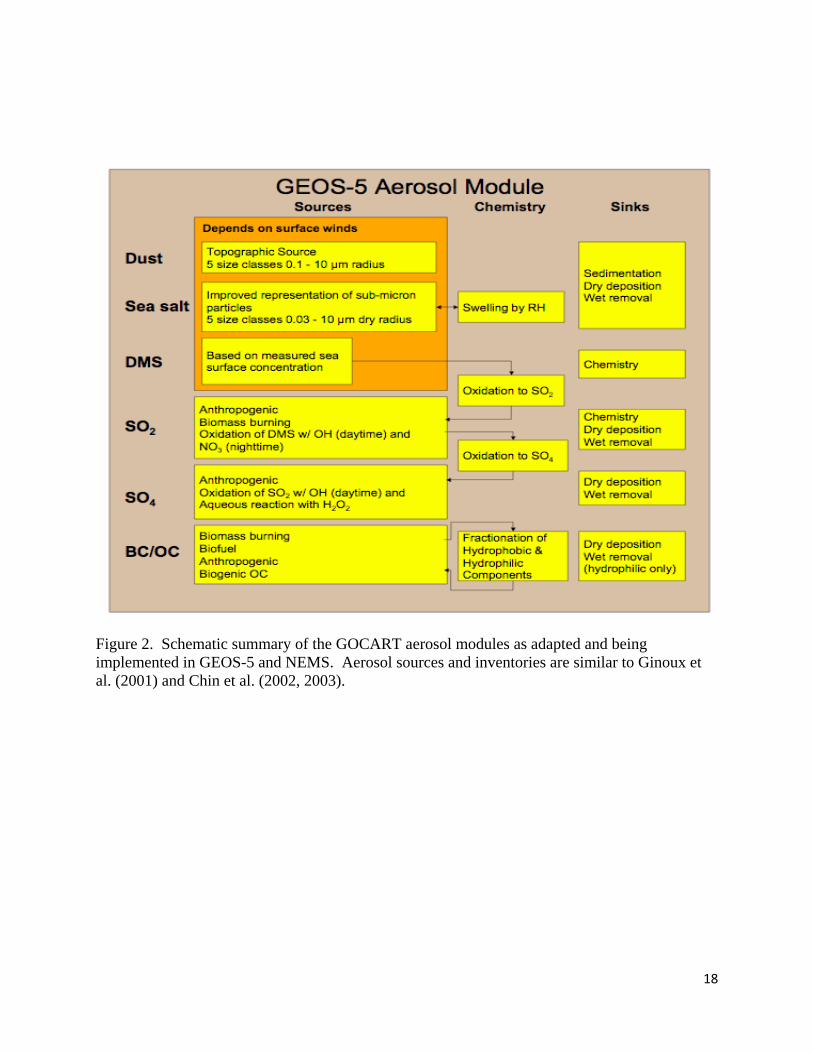
2010). When running within GEOS-5, the GOCART component provides aerosol processes
such as emissions, sedimentation, dry and wet deposition (Figure 2). Advection, turbulent and
convective transport is outside the scope of the GOCART component, being instead provided by
the host atmospheric model. In GEOS-5 implementation, the GOCART grid component is
coupled to the radiation parameterization of the host model, providing an explicit account of
aerosol direct radiative effects. In addition to the same natural and anthropogenic emissions used
by the off-line GOCART model, the GOCART grid component also ingests daily biomass
burning emissions from the Quick Fire Emission Dataset (QFED, Darmenov and da Silva 2013).
QFED emissions are based on fire radiative power retrievals from Moderate Resolution Imaging
Spectroradiometer (MODIS), on board Aqua and Terra satellites. The inclusion of daily
satellite-observed smoke emissions into GOCART provides a practical tool to model the highly
variable biomass burning emissions.
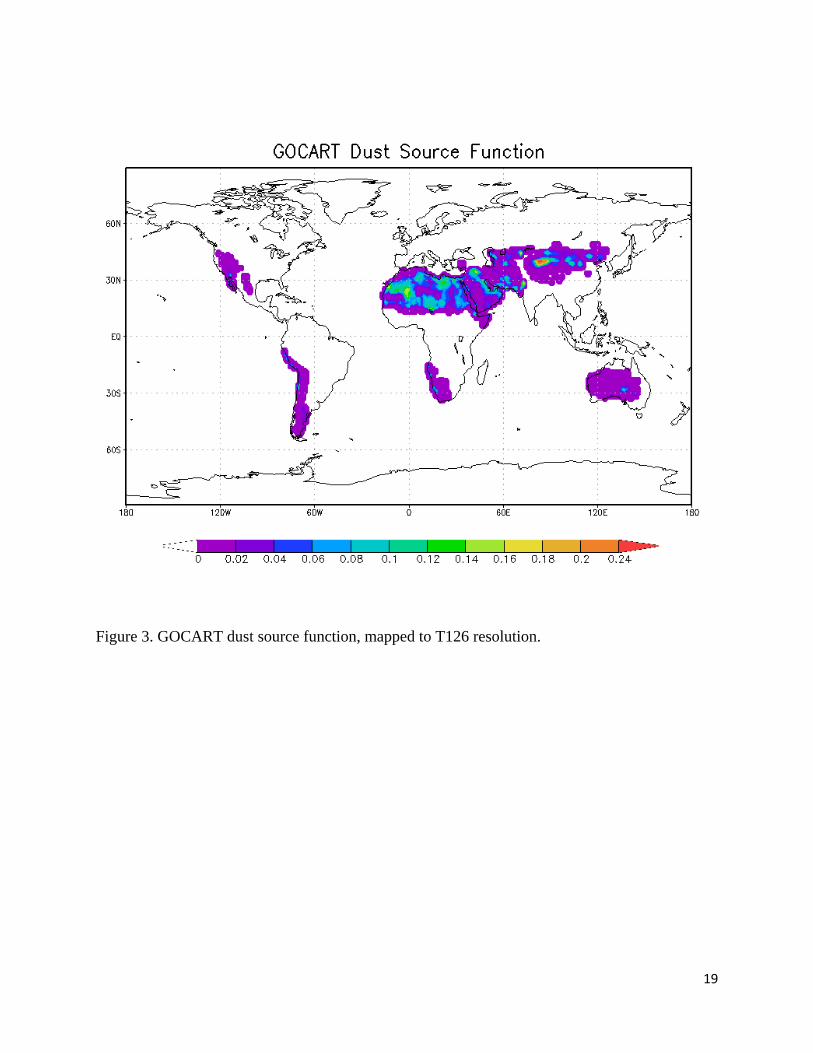
For dust, a topographic source function and mobilization scheme following Ginoux et al.
(2001) is used. The dust emission parameterization depends on 10-m wind, the threshold
velocity of wind erosion, and dust source function. The threshold velocity of wind erosion is
determined from dust density, particle diameter, and surface wetness. The dust source function
(shown in Figure 3), representing the probability of dust uplifting, is determined from surface
bareness and topographical depression features. A new dynamic dust source function based on
the satellite observed surface vegetation change (Kim et al., 2013) has been incorporated into the
off-line GOCART aerosol simulations at GSFC. The inclusion of such observation-based, time-
dependent emissions is important for model to capture the large variation of aerosol sources.
2.3 Linking NEMS GFS with GOCART
The GOCART grid component originally developed for GEOS-5 is fairly independent of
the host model, encapsulating the basic aerosol production and loss functionality. Consistent
with standard ESMF architecture, details of the interface to NEMS are isolated into a coupler
7
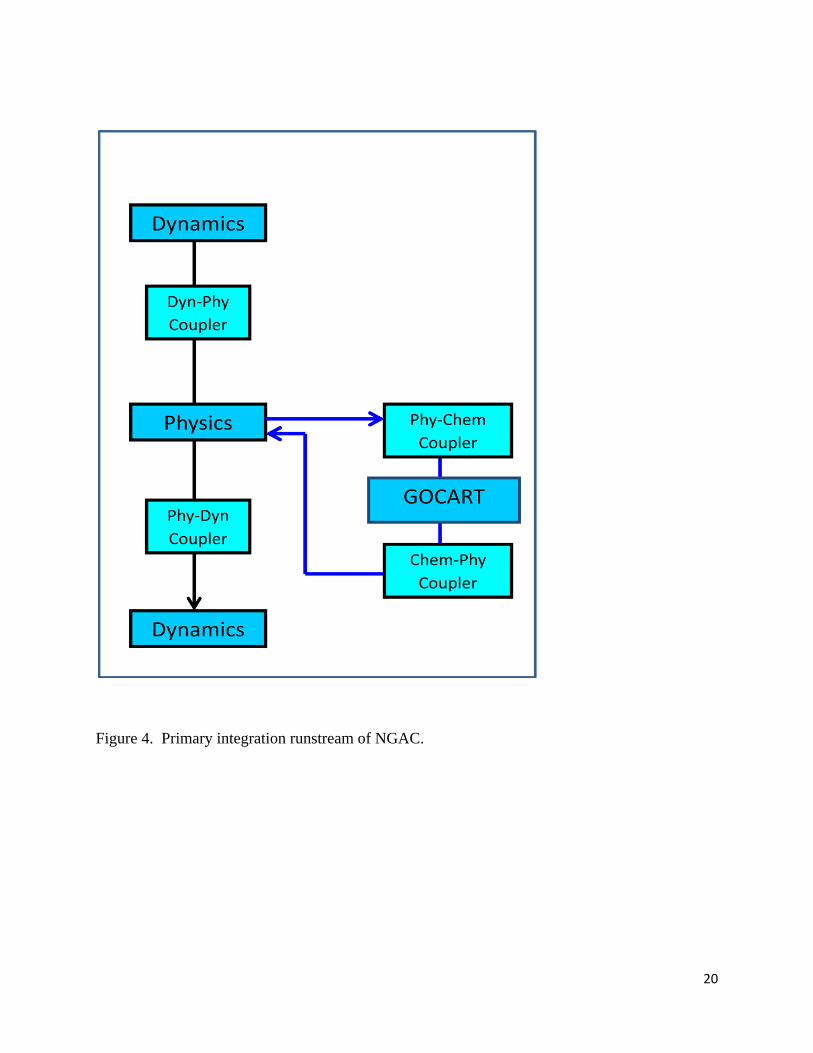
component. Figure 4 shows the integration run stream of NGAC. Couplers are built to transfer
and transform the data between NEMS GFS and GOCART. For instance, the physics-to-
chemistry coupler performs the following tasks: (i) vertical flip for 3-dimensional fields, as
GOCART is top-down while NEMS GFS is bottom-up, (ii) unit conversion as different units are
used in NEMS GFS and GOCART for some fields such as precipitation rate, and (iii)
conversions and calculations for these fields needed by GOCART such as inferring relative
humidity and air density from ambient temperature and moisture fields. Despite the ESMF
flavor in how GOCART is implemented, GOCART is incorporated into NEMS GFS as a column
process similar to how ozone physics was incorporated. It updates 3-dimensional aerosol
loading after physical processes, run on the same grid as physics and dynamics, and is fully
coupled with physics and dynamics at each time step.
The advantages for taking the so-called on-line approach include:
Consistent: no spatial-temporal interpolation, and same physics parameterization
Efficient: lower overall CPU costs and easier data management
Interactive: allowing for aerosol feedback to meteorology
The aspect of aerosol feedback is critical since an important goal for the development of NGAC
is to provide improved estimates of atmospheric aerosols for improving NCEP’s medium range
weather forecasts and climate prediction.
3. NGAC Operational Implementation
A phased approach is used to implement NGAC at NCEP. In the first phase, NCEP
produces dust-only guidance. The second phase of NGAC implementation is to produce the full
suite of aerosol forecasts (including dust, sea salt, sulfate, and carbonaceous aerosols) using
satellite-based real-time biomass burning emissions. The next phase is to produce aerosol data
assimilation using NGAC short term forecasts as first guess. Only first phase implementation
undertaken in 4th quarter of Fiscal Year 2012 (the Q4FY12 Implementation) is discussed in this
document.
3.1 The Q4 FY12 Implementation
8
Effective on September 11, 2012, starting with the 0000 Coordinated Universal Time
(UTC) cycle, NCEP began to run and disseminate dust predictions from the NGAC system.
NGAC Version 1 provides 5-day dust forecasts, once per day for the 0000 UTC cycle. Dust
initial conditions are taken from the 24-hours forecast from previous day while meteorological
initial conditions are down-scaled from high-resolution GFS analysis (the so-called replay
mode). It has the same dynamics and physics as the operational high-resolution GFS, except it
uses the Relaxed Arakawa-Schubert scheme (Moorthi and Suarez, 1992, 1999) for deep
convection and runs at lower spatial resolution. At present, the aerosol direct radiative effects in
NGAC are determined from the same aerosol climatology data set as in the operational GFS.
The specific configuration that GOCART prognostic aerosols are not interactive with the
radiation scheme of NEMS GFS is chosen to facilitate more straightforward testing and fine
tuning in the near term and will be changed to be radiatively interactive in later implementation.
While the ultimate goal at NCEP is a full-up earth system with the inclusion of aerosol-
radiation feedback and aerosol-cloud interaction, the incorporation of prognostic aerosol
modeling within the operational GFS infrastructure is not feasible at this time. Instead, the
NGAC forecasts are executed at lower resolution (T126 L64, ~ 100 km) in parallel to the
operational GFS (currently with T574 L64 resolution as on November 2013, ~ 27 km). NCEP is
working toward having the high resolution GFS to read the low resolution NGAC aerosol fields
instead of aerosol climatology in the near future. The dual resolution approach (low-resolution
for aerosol forecasting and high resolution for medium range weather prediction) will likely
remain unless the computation resources at NCEP are increased substantially.
3.2 NGAC Products Descriptions and Distributions
Primary NGAC output fields are global three-dimensional dust mixing ratios for five
particle sizes with effective radius at 1, 1.8, 3, 6, and 10 micron. Two-dimensional aerosol
products, such as dust aerosol optical depth (AOD) and surface mass concentrations, are also
available.
Web-based presentation of NGAC forecasts is available at the following location:
http://www.emc.ncep.noaa.gov/gmb/sarah/NGAC/html/realtime.ngac.html
9
The EMC NGAC website displays dust AOD at 550nm and surface mass concentrations over
global domain and several regional domains (e.g., trans-Atlantic region, Asia, and continental
US (CONUS) regions).
The NGAC V1 output is available in GRIB2 format on 1x1 degree output grid, with 3-
hourly output from 00 to 120 hours. Output files and their contents are listed in the Appendix.
Users can access the NGAC digital products from NOAA Operational Model Archive and
Distribution System (http://nomads.ncep.noaa.gov/) as well as from NCEP's ftp/http server at the
following locations:
http://www.ftp.ncep.noaa.gov/pub/data/nccf/com/ngac
ftp://ftp.ncep.noaa.gov/pub/data/nccf/com/ngac
Among these two- and three-dimensional aerosol products specified in the Appendix, dust
AOD at 550 nm is the most widely used product (discussed in next section). Potential usage for
NGAC V1 dust products includes, but is not limited to: dust column mass density, emission and
removal fluxes for dustl budget study; dust deposition fluxes for ocean productivity; and dust
surface mass concentrations for air quality. NCEP produces AOD at several spectral bands as
requested by potential users and stakeholders. Specifically, AOD at 340nm, 860nm, 11.1 µm are
targeted for UV index forecasts, AVHRR SST retrievals, and AIRS temperature retrievals,
respectively, once the full suite of aerosols become operational in next phase implementation.
4. NGAC Evaluation and Applications
EMC Forecast Verification System (FVS) has been extended to verify NGAC dust AOD
against MODIS total AOD over the Africa region where dust is the dominant aerosol type. The
FVS provides quantitative measures to monitor NGAC performance routinely. The efforts to
ingest near-real-time AErosol RObotic NETwork (AERONET) and Cloud-Aerosol Lidar and
Infrared Pathfinder Satellite Observations (CALIPSO) for NGAC evaluation are also in progress.
In addition, NGAC forecasts are evaluated using observed total AOD from the surface sun
photometer network (AERONET) and from space-borne MODIS and also compared with dust
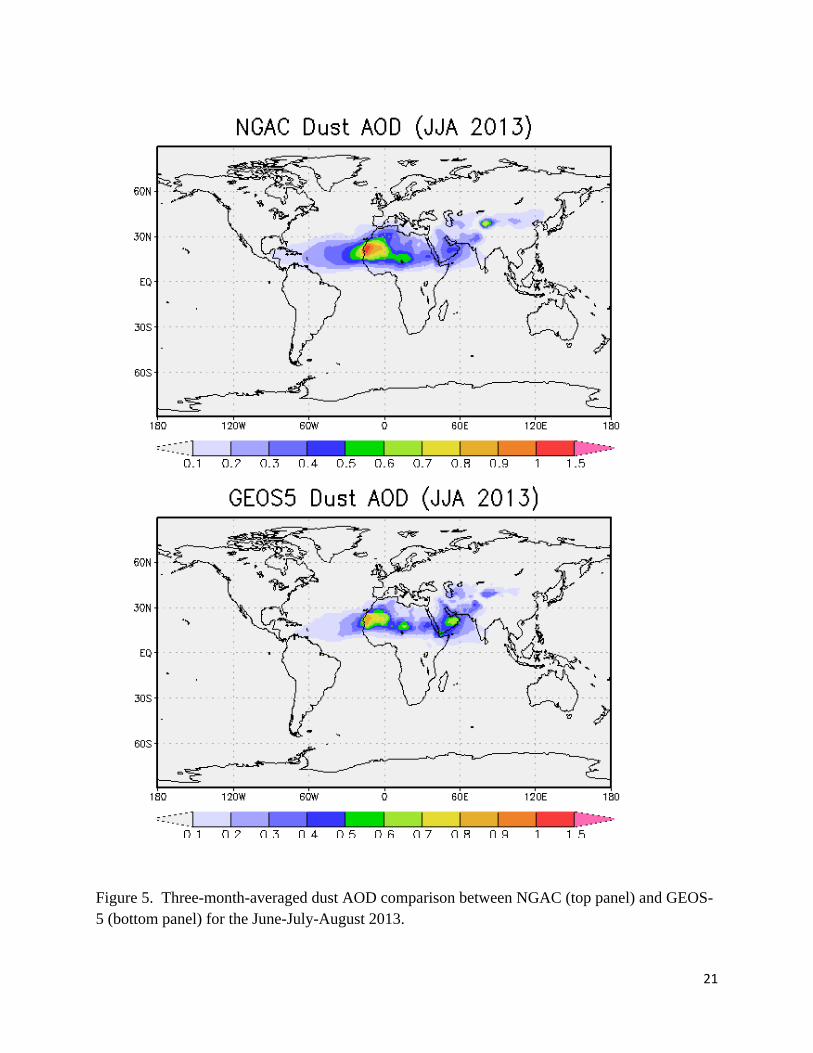
AOD from other models. An example is give here where dust AOD at 550nm from NGAC is
compared with GEOS-5 results for the June-July-August, 2013 period (Figure 5). The overall
spatial pattern from NGAC is consistent with that of GEOS-5. Elevated dust loading near the
10
source regions (e.g., Sahara desert in north Africa, the Bodele depression over Chad, the Syrian
desert in mid East, the Taklimakan desert in northwest China) are clearly shown as well as long-
range dust transport across the Atlantic ocean. While both GEOS-5 and NGAC use the same
aerosol module (GOCART Grid Component), GEOS-5 aerosol forecast is run on higher spatial
resolution (0.25 degree) with the inclusion of full aerosol sources and the assimilation of total
AOD from MODIS.
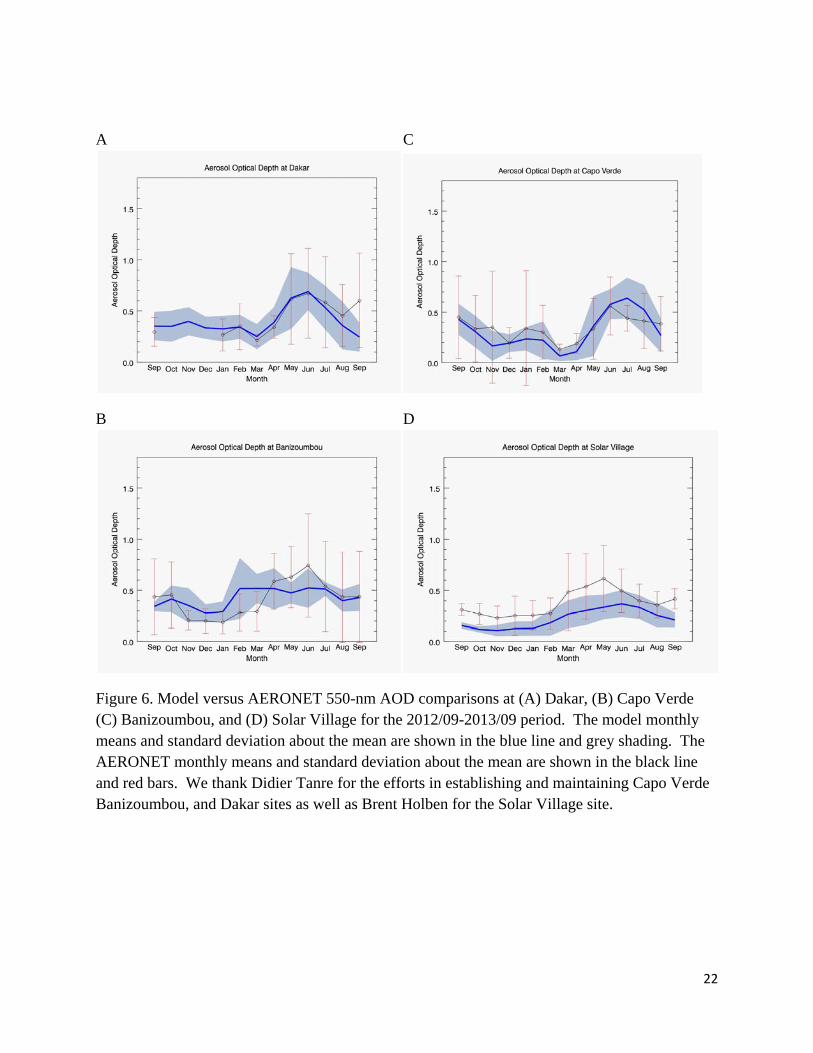
Another example is shown in Figure 6 where NGAC forecasts are evaluated with observed
AOD at four AERONET sites during the September 2012-September 2013 period. The
comparison is made between dust AOD at 550 nm from NGAC and total AOD at 550 nm
interpolated from AOD values at 440 nm and 675 nm sampled by sun photometer. These four
sites are all directly impacted by dust outbreaks. The Dakar site is located in Senegal, North
Africa near the Sahara dust source region while the Capo Verde site is an ocean site at Sal Island
downwind of Saharan dust sources. The Banizoumbou, Niger site is influenced by Saharan dust
outbreaks and occasionally biomass burning activities (Cavalieri et al., 2010). The Solar Village,
Saudi Arabia site is located in the middle of the Arabian Peninsula with significant contribution
of desert dust particles. NGAC simulations are found to captures the seasonal variability in the
dust loading at these sites except for Banizoumbou. Future work is needed to address the
weakness found in the NGAC.
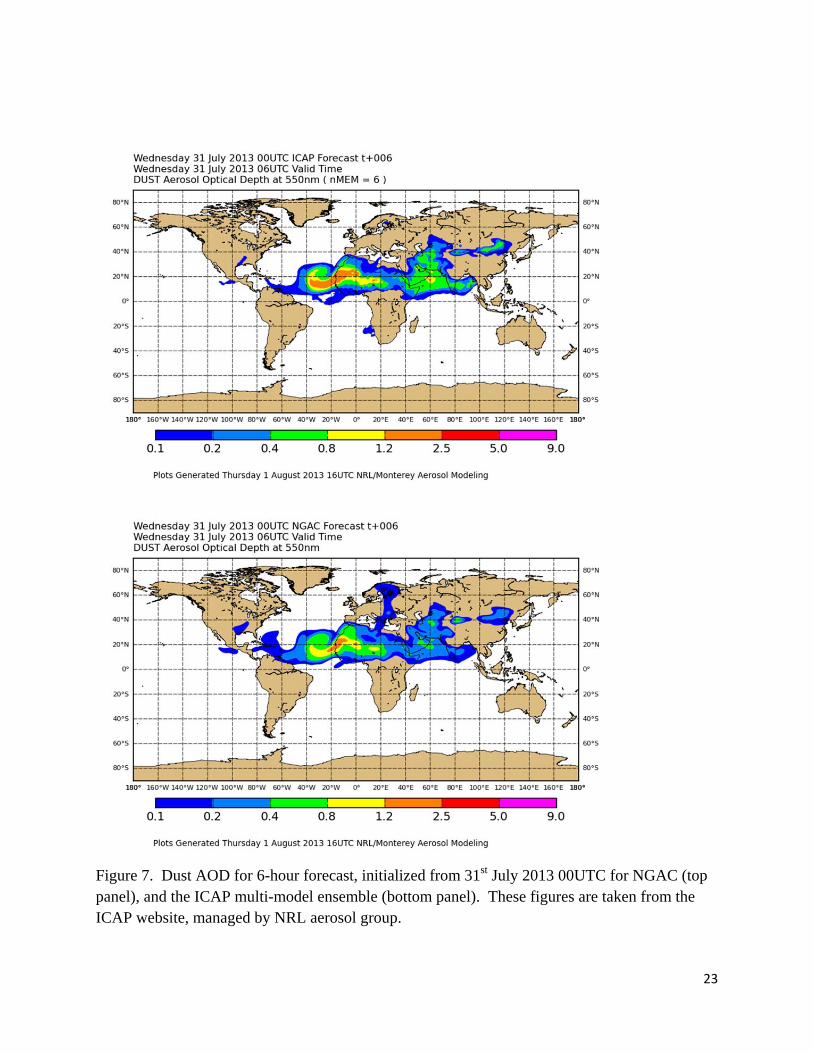
As shown in Figures 5 and 6, dust AOD at 550nm is used extensively for evaluation and
verification at EMC. It is also used routinely by two international programs for model inter
comparion and multi model ensemble. First, NGAC V1 is one member of the International
Cooperative for Aerosol Prediction (ICAP) global multi-model ensemble. Figure 7 shows the
dust AOD for 6-hour forecast initialized from 31st July 2013 00UTC from NGAC and the ICAP
global multi-model ensemble. The ensemble is based on 6 members including NGAC and the
models from NRL, GMAO, European Centre for Medium-Range Weather Forecasts (ECMWF),
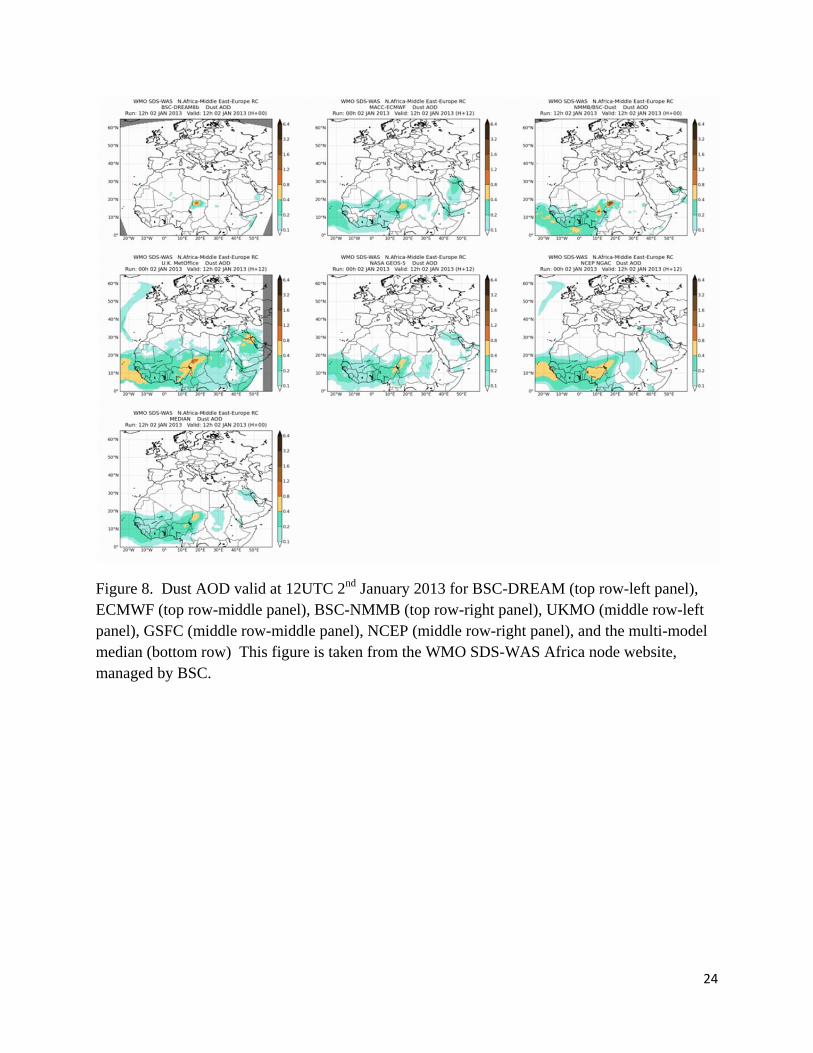
Japan Meteorological Agency (JMA), and Barcelona Supercomputing Center (BSC). Second,
dust forecasts from NGAC V1 participate in the multi-model comparison conducted by WMO
Sand and Dust Storm Warning Advisory and Assessment System (SDS-WAS) Regional Center
for Northern Africa, Middle East, and Europe, hosted at BSC, Spain. Figure 8 shows the dust
AOD valid at 2nd January 2013 12UTC from NGAC and several global and regional models.
Participation in ICAP and WMO SDS-WAS provides a continuous assessment of the quality of
11
NGAC dust products and put them in the context of the ICAP and SDS-WAS model suite,
establishing the reasonableness of NGAC relative to the community state of the art.
Trans-Atlantic dust transport is clearly shown in Figures 5 and 7. Trade winds steer
African dust westward across the Atlantic ocean, covering vast areas of the North Atlantic and
sometime reaching the Americas (e.g., the Caribbean, southeastern USA, Central America, and
Amazon basin). This has implications for air quality, public health, climate, and biogeochemical
cycle. An example on using NGAC dust information to improve regional air quality forecasts is
presented here. Under a NOAA-EPA partnership, NOAA is undertaking the responsibility to
develop and maintain the National Air Quality Forecasting Capability (NAQFC) (Otte et al.,
2005; Davidson et al. 2008). The AQF system is based on EPA Community Multi-scale Air
Quality (CMAQ) model driven by meteorological forecasts from the NCEP NAM at 12 km.
Static climatological lateral boundary conditions that do not account for long-range dust
transport across the boundaries are currently used.
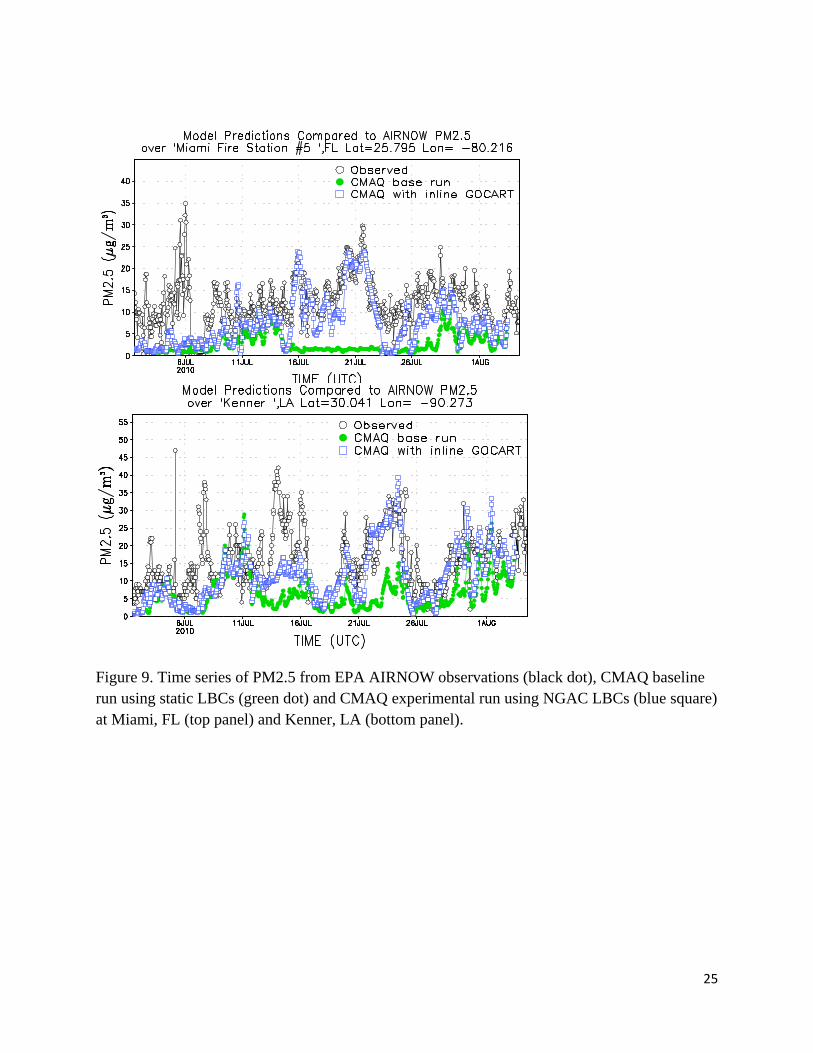
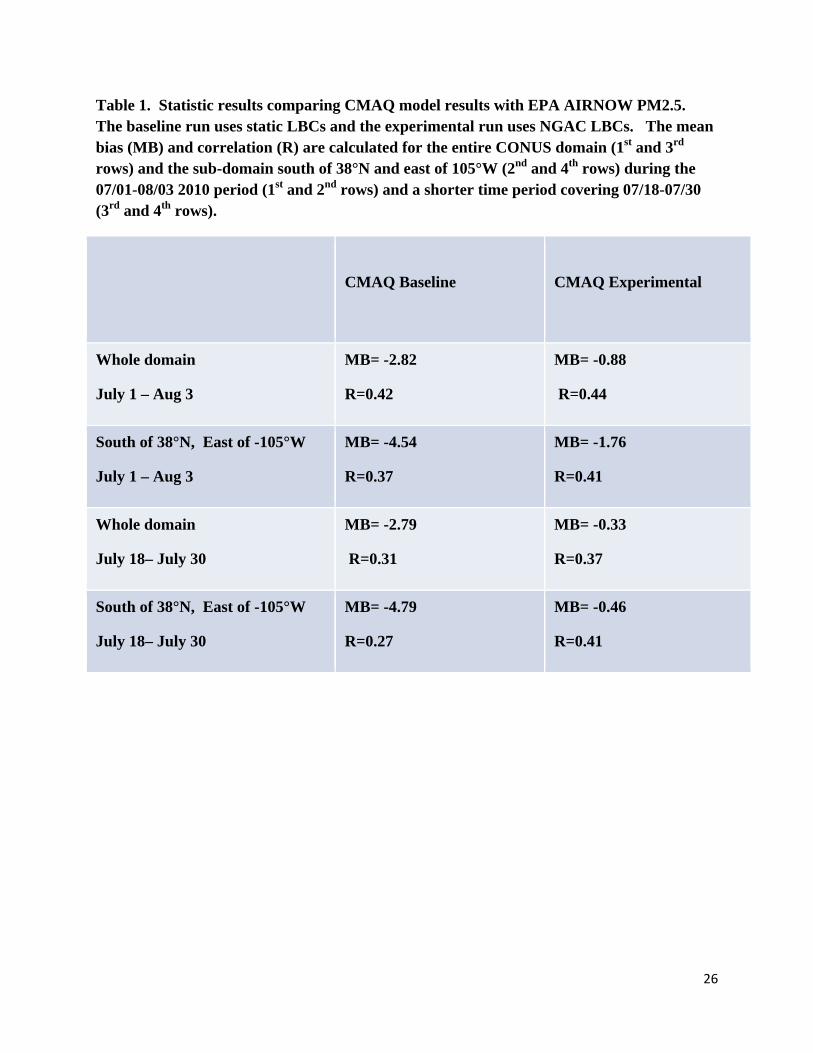
Two CMAQ runs are conducted for the July 2010 period. The baseline run uses static
boundary conditions and the experimental run uses dynamic lateral boundary conditions (LBCs)
from NGAC. Figure 9 shows the observed and modeled surface particulate matter smaller than
2.5 microns (PM2.5) at two AIRNOW stations in the southeast U.S. Table 1 presents the
statistic results of the CMAQ compared to the EPA AIRNOW PM2.5 observations. It is found
that the incorporation of LBCs from NGAC reduces model biases and improves correlation.
Clearly, the inclusion of long-range dust transport via dynamic LBCs leads to significant
improvements in CMAQ forecasts during dust intrusion episodes.
5. Summary
GSFC’s GOCART aerosol module has been implemented into NEMS GFS at NCEP via
NOAA/NCEP-NASA/GSFC-Howard University collaborations. While NGAC (NEMS GFS
coupled with GOCART) has the capability to forecast dust, sulfate, sea salt, and carbonaceous
aerosols, the Q4FY12 implementation was to establish dust-only guidance.
NGAC Version 1.0 implemented in September 2012 provides the first operational global
dust forecasting capability at NOAA. The NGAC dust forecasts are routinely verified against in-
situ and satellite observations using EMC’s verification package as well as by international
12
programs. Qualitative evaluation and quantitative verification indicate that NGAC provides dust
forecasts with reasonable quality.
While the initial NGAC implementation is limited in its scope (dust-only, without data
assimilation), it has laid the groundwork for various aerosol-related applications. Future
operational benefits associated with NGAC include:
Enable future operational global short-range full-package aerosol prediction (the phase 2
implementation)
Provide the first step toward an operational aerosol data assimilation capability at NCEP
(the phase 3 implementation)
Allow aerosol impacts on medium range weather forecasts (GFS/GSI) to be considered
Provide global aerosol information required for various applications (e.g. satellite radiance
data assimilation, satellite retrievals, SST analysis, and UV-Index forecasts)
Allow NCEP to explore aerosol-cloud-climate interaction in the Climate Forecast System
(CFS), as GFS is the atmosphere model of the CFS
Provide lateral aerosol boundary conditions for regional aerosol forecast system
13
REFERENCE
Bian, H., M. Chin, S. R. Kawa, H. Yu, and T. Diehl, 2010: Multi-scale carbon monoxide and aerosol correlations from MOPITT and MODIS satellite measurements and GOCART model: implication for their emissions and atmospheric evolutions, J. Geophys. Res., 115, D07302, doi:10.1029/2009JD012781.
Black, T., H. M. H. Juang, and M. Iredell, 2009: The NOAA Environmental Modeling System at NCEP, Proc. of 23rd Conference on Weather Analysis and Forecasting/19th Conference on Numerical Weather Prediction, Ameri. Met. Soc., Omaga, NE, Paper 2A.6.
Cavalieri, O., F. Cairo, F. Fierli, G. Di Donfrancesco, M. Snels, M. Viterbini, F. Cardillo, B. Chatenet, P. Formenti, B. Marticorena, and J. L. Rajot, 2010: Variability of aerosol vertical distribution in the Sahel, Atmos. Chem. Phys., 10, 12,005-12,023, doi:10.5194/acp-10-12005-2010.
Chin, M., D. L. Savoie, B. J. Huebert, A. R. Bandy, D. C. Thornton, T. S. Bates, P. K. Quinn, E. S. Saltzman, and W.J. De Bruyn, 2000: Atmospheric sulfur cycle in the global model GOCART: Comparison with field observations and regional budgets, J. Geophys. Res., 105, 24,689-24,712.
Chin, M., P. Ginoux, S. Kinne, O. Torres, B. N. Holben, B. N. Duncan, R. V. Martin, J. A. Logan, A. Higurashi, and T. Nakajima, 2002: Tropospheric aerosol optical thickness from the GOCART model and comparisons with satellite and sunphotometer measurements, J. Atmos. Sci., 59, 461-483.
Chin, M., P. Ginoux, R. Lucchesi, B. Huebert, R. Weber, T. Anderson, S. Masonis, B. Blomquist, A. Bandy, and D. Thornton, 2003: A global aerosol model forecast for the ACE-Asia field experiment, J. Geophys. Res., 108, 8654, doi:10.1029/2003JD003642.
Chin, M., D. A. Chu, R. Levy, L. A. Remer, Y.J. Kaufman, B. N. Holben, T. Eck, and P. Ginoux, 2004: Aerosol distribution in the northern hemisphere during ACE-Asia: Results from global model, satellite observations, and sunphotometer measurements, J. Geophy. Res., 109, D23S90, doi:10.1029/2004JD004829.
Chin, M., T. Diehl, O. Dubovik, T. F. Eck, B. N. Holben, A. Sinyuk, and D. G. Streets, 2009: Light absorption by pollution, dust and biomass burning aerosols: A global model study and evaluation with AERONET data, Ann. Geophys., 27, 3439-3464.
Colarco, P., A. da Silva, M. Chin, and T. Diehl, 2010: Online simulations of global aerosol distributions in the NASA GEOS-4 model and comparisons to satellite and ground-based aerosol optical depth, J. Geophy. Res., 115, D14207, doi:10.1029/2009JD012820.
Darmenov, A. and A. da Silva, 2013: The Quick Fire Emissions Dataset (QFED) – Documentation of versions 2.1, 2.2 and 2.4, Technical Report Series on Global Modeling and Data Assimilation, 32.
Davidson, P., K. Schere, R. Draxler, S. Kondragunta, R. A. Wayland, J. F. Meagher, R. Mathur, 2008: Toward a US National Air Quality Forecast Capability: Current and Planned Capabilities. Air Pollution Modeling and Its Application XIX. Eds. C. Borrego and A.I. Miranda. 226-234, ISBN 978-1-4020-8452-2, Springer, The Netherlands.
14
Dunion, J. P. and C. S. Velden, 2004: The impact of the Saharan air layer on Atlantic tropical cyclone activity, Bull. Am. Meteorol. Soc., 85, 353-365.
Ginoux, P., M. Chin, I. Tegen, J. Prospero, B. Holben, O. Dubovik, and S.-J. Lin, 2001: Sources and global distributions of dust aerosols simulated with the GOCART model, J. Geophys. Res., 106, 20,255-20,273.
Ginoux, P., J. Prospero, O. Torres, and M. Chin, 2004: Long-term simulation of dust distribution with the GOCART model: Correlation with the North Atlantic Oscillation, Environ. Modeling and Software, 19, 113-128.
Hess, M., P. Koepke, and I. Schult, 1998: Optical properties of aerosols and clouds: The software package OPAC, Bull. Am. Meteor. Soc., 79, 831-844.
Kim, D., M. Chin, H. Bian, Q. Tan, M. E. Brown, T. Zheng, R. You, T. Diehl, P. Ginoux, and T. Kucsera, 2013: The effect of the dynamic surface bareness to dust source function, emission, and distribution, J. Geophys. Res., 118, 1–16, doi:10.1029/2012JD017907.
Moorthi, S., and M.J. Suarez, 1992: Relaxed Arakawa-Schubert; A parameterization of moist convection for general circulation models. Mon. Wea. Rev., 120, 978-1002.
Moorthi, S., and M.J. Suarez, 1999: Documentation of version 2 of Relaxed Arakawa-Schubert cumulus parameterization with moist downdrafts, NOAA Technical report NWS/NCEP 99-01. 44 pp
Moorthi, S., H.-L. Pan, and P. Caplan, 2001: Changes to the 2001 NCEP Operational MRF/AVN Global Analysis/Forecast System, NOAA Technical Bulletin No. 484, 14 pp.
Otte, T. L., G. Pouliot, J. E. Pleim, J. O. Young, K. L. Schere, D. C. Wong, P.C. Lee, M. Tsidulko, J. T. McQueen, P. Davidson, R. Mathur, H. Y. Chuang, G. DiMego and N. Seaman, 2005: Linking the Eta Model with the Community Multiscale Air Quality (CMAQ) modeling system to build a national air quality forecasting system. Wea. Forecasting. 20, 367-384
Wang, X., D. Parrish, D. Kleist, J. Whitaker, 2013: GSI 3DVar-Based Ensemble–Variational Hybrid Data Assimilation for NCEP Global Forecast System: Single-Resolution Experiments. Mon. Wea. Rev., 141, 4098–4117. doi: http://dx.doi.org/10.1175/MWR-D-12-00141.1
15
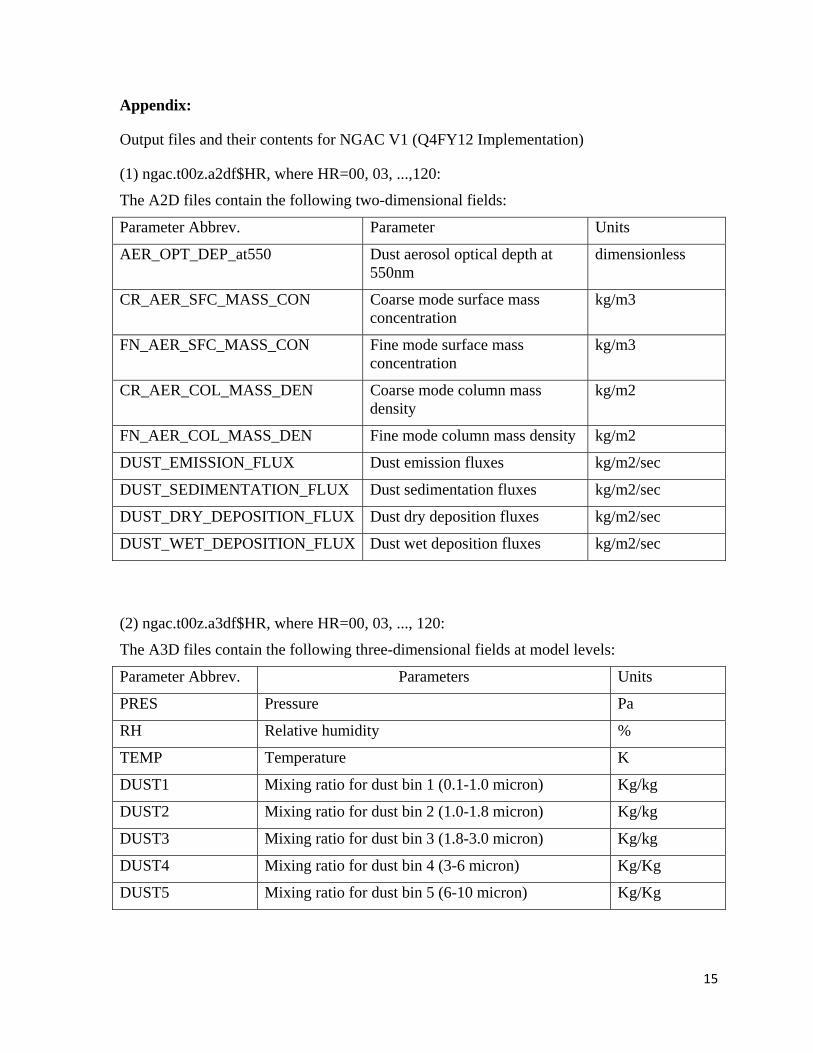
Appendix:
Output files and their contents for NGAC V1 (Q4FY12 Implementation)
(1) ngac.t00z.a2df$HR, where HR=00, 03, ...,120:
The A2D files contain the following two-dimensional fields:
Parameter Abbrev. Parameter Units
AER_OPT_DEP_at550 Dust aerosol optical depth at 550nm
dimensionless
CR_AER_SFC_MASS_CON Coarse mode surface mass concentration
kg/m3
FN_AER_SFC_MASS_CON Fine mode surface mass concentration
kg/m3
CR_AER_COL_MASS_DEN Coarse mode column mass density
kg/m2
FN_AER_COL_MASS_DEN Fine mode column mass density kg/m2
DUST_EMISSION_FLUX Dust emission fluxes kg/m2/sec
DUST_SEDIMENTATION_FLUX Dust sedimentation fluxes kg/m2/sec
DUST_DRY_DEPOSITION_FLUX Dust dry deposition fluxes kg/m2/sec
DUST_WET_DEPOSITION_FLUX Dust wet deposition fluxes kg/m2/sec
(2) ngac.t00z.a3df$HR, where HR=00, 03, ..., 120:
The A3D files contain the following three-dimensional fields at model levels:
Parameter Abbrev. Parameters Units
PRES Pressure Pa
RH Relative humidity %
TEMP Temperature K
DUST1 Mixing ratio for dust bin 1 (0.1-1.0 micron) Kg/kg
DUST2 Mixing ratio for dust bin 2 (1.0-1.8 micron) Kg/kg
DUST3 Mixing ratio for dust bin 3 (1.8-3.0 micron) Kg/kg
DUST4 Mixing ratio for dust bin 4 (3-6 micron) Kg/Kg
DUST5 Mixing ratio for dust bin 5 (6-10 micron) Kg/Kg
16
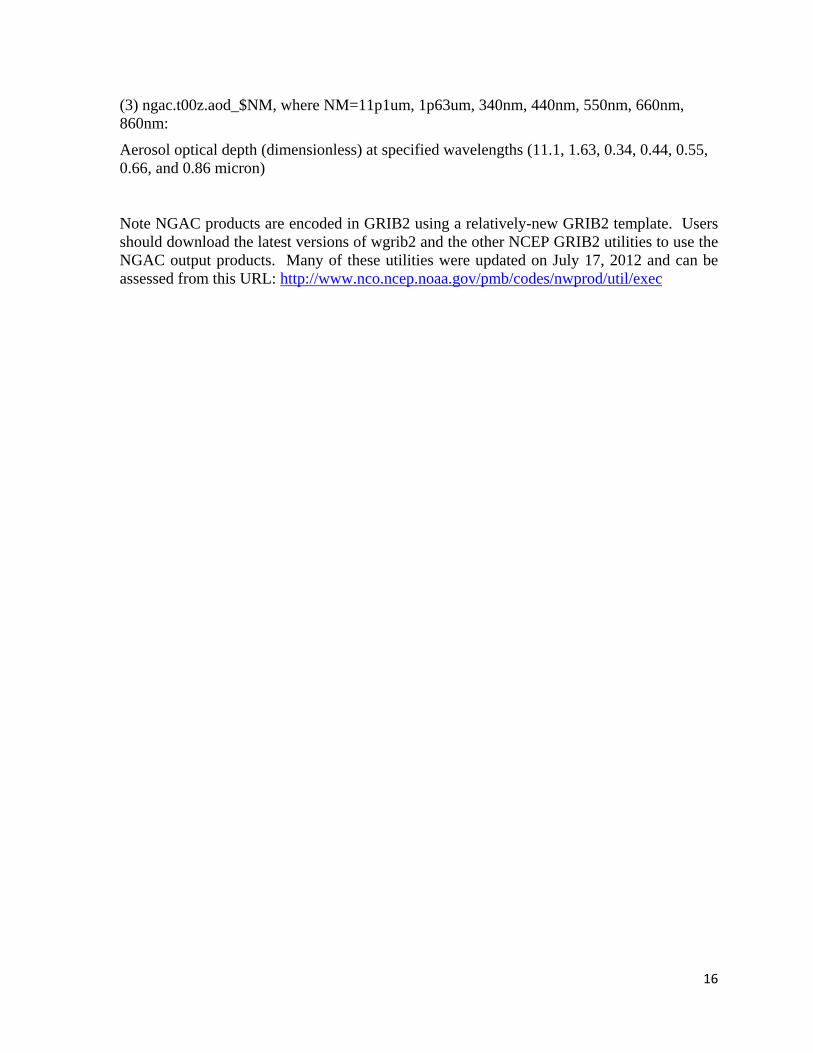
(3) ngac.t00z.aod_$NM, where NM=11p1um, 1p63um, 340nm, 440nm, 550nm, 660nm, 860nm:
Aerosol optical depth (dimensionless) at specified wavelengths (11.1, 1.63, 0.34, 0.44, 0.55, 0.66, and 0.86 micron)
Note NGAC products are encoded in GRIB2 using a relatively-new GRIB2 template. Users should download the latest versions of wgrib2 and the other NCEP GRIB2 utilities to use the NGAC output products. Many of these utilities were updated on July 17, 2012 and can be assessed from this URL: http://www.nco.ncep.noaa.gov/pmb/codes/nwprod/util/exec
17
Figure 1. Schematic of the NEMS Component Structure.
18
Figure 2. Schematic summary of the GOCART aerosol modules as adapted and being implemented in GEOS-5 and NEMS. Aerosol sources and inventories are similar to Ginoux et al. (2001) and Chin et al. (2002, 2003).
19
Figure 3. GOCART dust source function, mapped to T126 resolution.
20
Figure 4. Primary integration runstream of NGAC.
21
Figure 5. Three-month-averaged dust AOD comparison between NGAC (top panel) and GEOS-5 (bottom panel) for the June-July-August 2013.
22
A C
B D
Figure 6. Model versus AERONET 550-nm AOD comparisons at (A) Dakar, (B) Capo Verde (C) Banizoumbou, and (D) Solar Village for the 2012/09-2013/09 period. The model monthly means and standard deviation about the mean are shown in the blue line and grey shading. The AERONET monthly means and standard deviation about the mean are shown in the black line and red bars. We thank Didier Tanre for the efforts in establishing and maintaining Capo Verde Banizoumbou, and Dakar sites as well as Brent Holben for the Solar Village site.
23
Figure 7. Dust AOD for 6-hour forecast, initialized from 31st July 2013 00UTC for NGAC (top panel), and the ICAP multi-model ensemble (bottom panel). These figures are taken from the ICAP website, managed by NRL aerosol group.
24
Figure 8. Dust AOD valid at 12UTC 2nd January 2013 for BSC-DREAM (top row-left panel), ECMWF (top row-middle panel), BSC-NMMB (top row-right panel), UKMO (middle row-left panel), GSFC (middle row-middle panel), NCEP (middle row-right panel), and the multi-model median (bottom row) This figure is taken from the WMO SDS-WAS Africa node website, managed by BSC.
25
Figure 9. Time series of PM2.5 from EPA AIRNOW observations (black dot), CMAQ baseline run using static LBCs (green dot) and CMAQ experimental run using NGAC LBCs (blue square) at Miami, FL (top panel) and Kenner, LA (bottom panel).
26
Table 1. Statistic results comparing CMAQ model results with EPA AIRNOW PM2.5. The baseline run uses static LBCs and the experimental run uses NGAC LBCs. The mean bias (MB) and correlation (R) are calculated for the entire CONUS domain (1st and 3rd rows) and the sub-domain south of 38°N and east of 105°W (2nd and 4th rows) during the 07/01-08/03 2010 period (1st and 2nd rows) and a shorter time period covering 07/18-07/30 (3rd and 4th rows).
CMAQ Baseline CMAQ Experimental
Whole domain
July 1 – Aug 3
MB= -2.82
R=0.42
MB= -0.88
R=0.44
South of 38°N, East of -105°W
July 1 – Aug 3
MB= -4.54
R=0.37
MB= -1.76
R=0.41
Whole domain
July 18– July 30
MB= -2.79
R=0.31
MB= -0.33
R=0.37
South of 38°N, East of -105°W
July 18– July 30
MB= -4.79
R=0.27
MB= -0.46
R=0.41