Embed Size (px)
Citation preview

Data from theNATIONAL HEALTH SURVEY
NCHSGrowth Curvesfor ChildrenBirth-18YearsUnited States
Smoothed percentile distributions of body size (weight, length orstature, and head circumference) attained at specific chronologicages from birth to 18 years and body weight for length are pre-sented and discussed. Height and weight data for adults 18-24 yearsare also presented in the tables.
DH EW Publication No. (PHS) 78-1650
U.S. DEPARTMENT OF HEALTH, EDUCATION, AND WELFAREPublic Health Service
National Center for Health StatisticsHyattsville, Md. November 1977
Series 11Number 165

I
Library of CongressCataloging in Publication Data
Hamill, Peter V. V.NCHS growth curves for children.
(Vital and health statistics: Series 11, Data from the National Health Survey; no. 165)(DHEW publication; (PHS) 78-1650)
Includes bibliographical references.1. Children-Growth. 2. Children-Growth-Charts, diagrams, etc. .3. Children in the
United States–Anthropometry. I. Hamill, Peter V. V. II. Title. HI. Series: UnitedStates. National Center for Health Statistics. Vital and health statistics: Series 11, Datahorn the National Health Survey, Data from the health examination survey; no. 165.IV. Series: United States. Dept. of Health, Education, and Welfare. DHEW publication;(PHS) 78-1650.RA407.3.A347 no. 165 [RJ131] 312’.0973s 77-8931ISBN O-84O6-O1OO-X [612.6’5’0212]
NATIONAL CENTER FOR HEALTH STATISTICS
DOROTHY P. RICE, Director
ROBERT A. ISRAEL, Deputy Director
JACOB J. FELDMAN, Ph.D.,Assotite Director for Analysis
GAIL F. FLSHE~ Associate Director for the Cooperative Health Statistics System
ELIJAH L. WHITE, Associate Director for Data SystemsJAMES T. BAIRD, JR., Ph.D., Associate Director for International StatMics
ROBERT C. HUBER, Associate Director forManagement
MONROE G. SIRKEN, Ph.D., Associate Director for Mathematical Statktics
PETER L. HURLEY, Associate Director for Operations
JAMES M. ROBEY, Ph.D., Associate Director for Program Development
PAUL E. LEAVERTON, Ph.D., Associate Director for Research
ALICE HAYWOOD, Information Officer
DIVISION OF”HEALTH EXAMINATION STATISTICS
MICHAEL A. W. HATTWICK, M.D., DirectorPETER V. V. HAMILL, M.D., Medical Adviser
JEAN ROBERTS, Chie~ Medical Statistics Branch
ROBERT MURPHY, C.kief, Survey Planningand Development Branch
COOPERATION OF THE U.S. BUREAU OF THE CENSUS
h accordanceV&I specificationsestablisbcdby tbe NaticmalCenterfor Heahh Statistics,the Bureauof tbe Census,undera contmctualagreement,participatedin the designandselec-tion of the sample,and carriedout the fimt stageof tbe fieIdintcn’iewingandcertainpartsofthestatisticalpmcming.
Vital and Health Statistics-Series 1 l-No. 165
DHEW Publication No. (PHS) 78-1650
Libmy of Congress Catalog CmdN.nrber 77-8931
., .
CONTENTS
introduction ....................................... ......................................................................................................
Mctbod .....................................................................................................................................................Fels Research Institute Data ................................................................................................................NCHS Data ....................................................................................................................... ..................
Population Reference Data ..................................................................................................................Growth Charts ....................................................................................................................................
Discussion ................................................................................................................................................Wcigbt Distributions by Length ...........................................................................................................Uses and Rdiabfi~of NCHSSmootied Pemntile titifor Attined Body Wze ............................
Recumbent Length or Stature ..............................................................................................................curve Smoothing ........................... ..............................................................................................W.....Secular Trend ................................................" .....................................................................................
References ...............................................................................................................................................
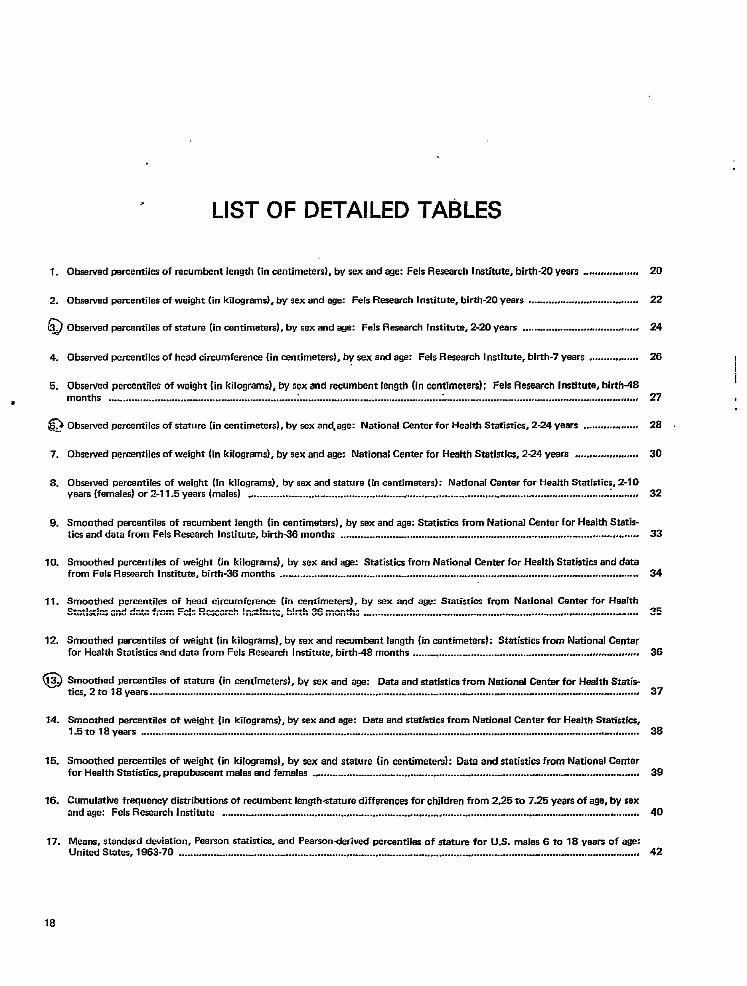
List of Detailed Tables ..............................................................................................................................
AppendixesI. Growtbcbarls ...............................................................................................................................If. TecfmicafNotes .............................................................................................................................
LIST OF FIGURES
I. Comptison ofsdecWdpmcenties ofw&@tforrecumbent len@titi wti@tforstatm, indutiga l-centimeter adjustment as a typical median difference between recumbent Iength and stature:Mafes, bktb-l. years, F.efsResearcb Institute da@males, 2-11.5 yems, National Centmfor Hd&Statistics &@ .....................................................................................................................................
2. Sdected p=cmWes ofwti@tby stit@forprepubescent mdes:Obsewed tita, Fels R~edhti-tute; smoothed data, Nationaf Center for Heaftb Statisti~ ...............................................................
1
;4
55
5
667
91414
16
IS
5164
11
12
,.,
iii
SYMBOLS
Datanot avaib.ble-——-————— ---
Category non applicable---- . . .
Quantity ZmO——--—––-——--–— . -
Qnantity more than O but lessthan0.05-— 0.0
Figure does not meet standards ofreliabihy or precision .— *
.
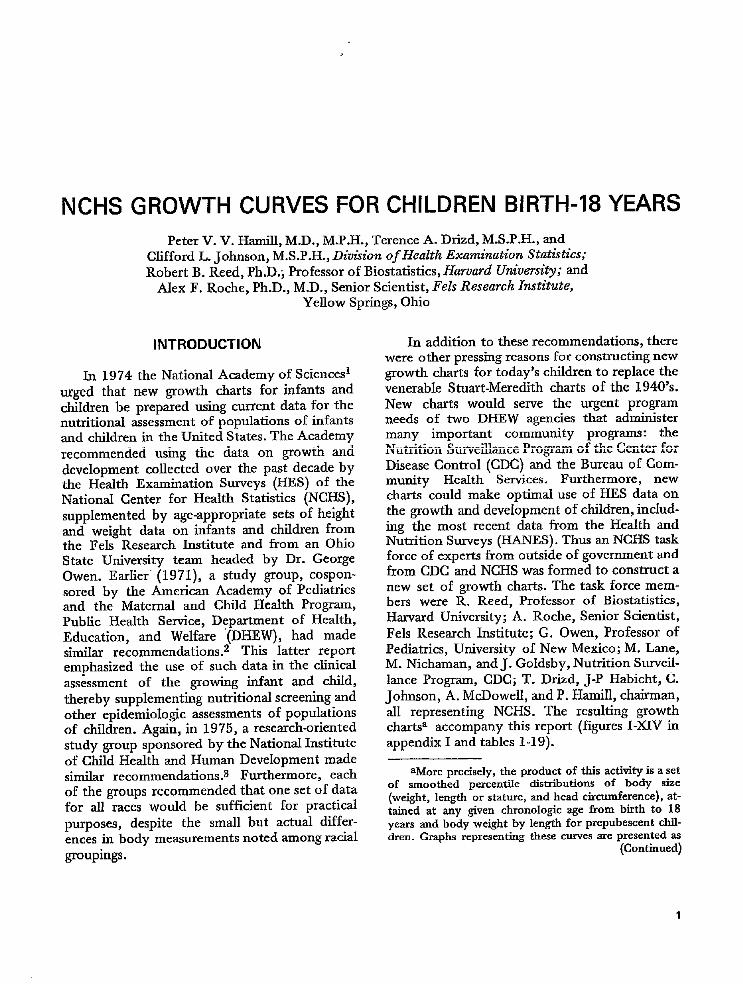
NCHS GROWTH CURVES FOR CHILDREN BIRTH-18 YEARS
Peter V. V. Hamill, M.D., M.P.H., Terence A. Dnzd, M.S.P.H., andClifford L. Johnson, M.S.P.H., Dirsirion of Health Examination Statistics;Robert B. Reed, Ph.D~, Professor of Biostatistics, Harvard University; and
Alex F. Roche, Ph.D., M.D., Senior Scientist, Fels Research Institute,Yellow Springs, Ohio
INTRODUCTION
In 1974 the National Academy of Scienceslurged that new growth charts for infants andchildren be prepared using current data for thenutritional assessment of populations of infantsand children in the United States. The Academyrecommended using the data on growth anddevelopment collected over the past decade bythe Health Examination Surveys (HES) of theNational Center for Health Statistics (NCHS),supplemented by age-appropriate sets of heightand weight data on infants and children fromthe Fels Research Institute and from an OhioState University team headed by Dr. GeorgeOwen. Earlier” (1971), a study group, cospon-sored by the American Academy of Pediatricsand the Maternaf and Child Health Program,Public Health Service, Department of Health,Education, and Welfare ‘(DHEW), had madesimilar recommendations.z Thk latter reportemphasized the use of such data in the clinicafassessment of the growing infant and child,thereby supplementing nutritional screening andother epidemiologic assessments of populationsof children. Again, in 1975, a research-orientedstudy group sponsored by the National Instituteof Child Health and Human Development madesimilar recommendations.3 Furthermore, eachof the groups recommended that one set of datafor afl races would be sufficient for practicalpurposes, despite the small but actual differ-ences in body measurements noted among racialgroupings.
In addition to these recommendations, therewere other pressing reasons for constructing newgrowth charts for today’s children to replace thevenerable Stuart-Meredith charts of the 1940’s.New charts would serve the urgent prognmneeds of two DHEW agencies that administermany important community programs: theNutrition Surveillance Program of the Center forDkease Control (CDC) and the Bureau of Com-munity Health Services. Furthermore, newcharts could make optimaf use of HES data onthe growth and development of children, includ-ing the most recent data from the Health andNutrition Surveys (HANES). Thus an NCHS taskforce of experts from outside of government andfrom CDC and NCHS was formed to construct anew set of growth charts. The task force mem-bers were R. Reed, Professor of Biostatistics,Harvard University; A. Roche, Senior Scientist,Fels Research Institute; G. Owen, Professor ofPediatrics, University of New Mexico; M. Lane,M. Nichaman, and J. Goldsb y, Nutrition Surveil-lance Program, CDC; T. Drizd, J-P Habicht, C.Johnson, A. McDowell, and P. Hamifl, chairman,afl representing NCHS. The resulting growthcharts’ accompany this report (figures I-XIV in
aPPendix I ~d table= 1-19)-
aMore precisely, the product of thk activity is a setof smoothed percentile dktributions of body size(weight, length or stature, and head circumference), at-tained at anv given chronohwic age from birth to 18years and body-weight by length for prepubescent chil-dren. Graphs representing these curves are presented as
(Continued)
1

The new charts and tables were constructedusing current body measurement data and ex-ploiting the most recent advances in data analy-sis and computer technology. These data arederived either from the Fels Research Instituteor from the Herdth Examination Surveys of theNational Center for Health Statistics. One set ofcharts for children from birth to 3 years (figuresI-VIII) is based on body measurements colIectedat Fela Research Institute during the 1929-75period. The set of charts for children 2-18 yearsof age (figures IX-XIV) is based on NCHS datawhich were collected between 1963 and 1974.
The NCHS task force benefited from theadvice offered by many interested agencies andindividuals; most importantly they benefitedfrom the Preschool Nutrition Survey of 1968-70. In this survey, body measurements of 3,500children aged 1-5 years were collected by theOhio State University team headed by Dr.0wen.4 HIS group collected body measurementsin a manner similar to Fels and NCHS. Thesedata were very useful as interim data and forcomparative purposes until the HANES data onpreschool children became available. However,these data were not used in constructing the newgrowth charts because the task force tried to
(Footnote a continued)well as data from selectedpointson the smoothed:per-centile curves in tabular form. As will also be explsmed,these curves sre “contained” in a deck of 308 computerCsrds.
The term “growth charts” is cosnruonly used (andmisused) in referriug to several ~pes of data by whichchd@en’s growth status is assessed. Sizes aftaz%ed at agiven age are the bases of these NCHS “cbsrts” rmdshoufd be distinguished from growth rmlocity charts,which can only be constructed from, and used for,longitudinally obtained incremental data. Specialists
in ?YOWh disorders need growth velocity ChWS beca~egrowth velocity charts are more sensitive indicators ofslight changes in growth status than the more visual“sizes-attained” growth records. Of course, the moresensitive “charts” are SISO more sensitive to errors inboth their origiial construction and their application,and they are more difficult to interpret. The more com-mon NCHS type of curve is based on cross-sectionaldata; these curves are used most properly to comparebody sizes of cbiidrerr at one given point in time as weUas to chart clinically the gTowtb curve of the individualchiid. These more common mrves provide a good
approximation untif the erratically phased pubertalgrowth spurts begin.
avoid pooling data sets wherever possible, keep-ing the number of reference populations to aminimum.
The first two groups of charts (figuresI-VIII), which cover the period birth-36 monthsseparately by sex, present curves for bodyweight by age, recumbent length by age, weightby length (assuming an approximate independ-ence of chronologic age under 4.o years) ,b andhead circumference by age. These data werederived from the body measurements of 867children who were followed in a longitudinrdstudy conducted at the Fela Research Institutefrom birth to 24 years by serial examination: atbirth, 1 month, 3 months, 6 months, 9 months,1 year, 1% years, 2 years, 2% years, 3 years ofage, and wery year or two thereafter.c The sam-ple chiIdren were drawn from middfe-class whitefam~les who lived within a convenient distanceto Yellow Springs, Ohio (about 25 miles east ofDayton), to be studied for many years in thislongitudinal study. These children were theproducts of essentially normal birthsd and werein reasonably good health. As will be consideredmore fully in the Discussion section of this re-port, the biases introduced by this imperfectsampling design were judged not of sufficientmagnitude to disqualify the use of these data,especially since there were rio suitable alterna-tive data for the first year of life. Other factors,such as the technical reliabilityy of the measure-ments, the huge sample size, and the availab~lty
bAs WiII be discussed further, this growth Statistic
assumes an approximate age independence from infancyuntiI the occurrence of the marked changes in body pro-
portions that begin in eady pubescence and continuepast puberty. Its most irnsnediate practical use k forthose areas of the world where the chiidren beingassessed do not have accurately recorded birth dates,
cSome chiidren were not measured at every exarnknation period; the average number examined at anygiven age under 18 years was between 700 and S00.
d’fhcre was a purposeful overrepresentation ofmultiple births in the FeIs study population. There were4 sets of tripkts, all of whom were excluded from theseanalyses; however, 14 sets of twins were retained becausetheir body measurements were not significantly dif-ferent from those of the other children. There was noexclusion for low birth weight (40 of tbe 867 children,or 4.6 percent, weighed Icss than 2,500 grams; onfy 1child weighed less than 1,500 grams),
2

of all the data in a computer-compatible formmore than compensated for the sampling defi-ciencies for these purposes.
The sex-specific charts for children 2-18years include curves for body weight by age,stature by age, and weight by stature (only forprepubescent children).’ NCHS data from threeseparate surveys were used in their construction:HES Cycle 11 of children ages 6-11 years (1963-65), HES Cycle HI of youths ages 12-17 years(1966-70), and HANES I of children ages 1-17years (1971-74) (a chronologic age subset of thetotal data, ages 1-74 years). Bemuse of the simi-larity and efficiency of the stratified probabilitysample designs, the data from the three NCHSsurveys (see tables 18 and 19, figures XV-XVHI)could be both melded for consecutive age group-ings and combined when certain age groupsoverlapped (i.e., after separate study of theircomparability, which is described in appendix II,the data of HANES children 6-17 years were“pooled” with those of HES Cycle II and HESCycle HI). The nationally representative natureof these HES data has been described in pub-lished reports.5 -a
Of the sets of data used to prepare thegrowth charts, only the HES data on heights andweights of children 6-17 years, collected in1963-70, have been reported previously.g. 10Parts of the Fels data have been used in otherpublications,] 1‘15 and data from the first halfof the HANES I sample were included in a pre-vious preliminary report.16 Both of these groupsof data are presented in this report and will be
eAa is discussedelsewhere,there is anassumptionofaP~mx~ate age independence in the relationship ofweight by lcingth from infancy untif the occurrence ofthe marked changes in body proportions which begin inearly pubescence snd continue past puberty. Its mostimmediate practicaf use is for those sreas of the worldwhere accurate birth dates have not been recorded forthe children being assessed. To maximize the range ofthe applicable population while minimizing d~tortion ofthe data by pubescent chifdren, the cmves were con-structed using the foflowing sets of HES-HANES datx(1) afl girls tafler than 90 centimeters but shorter than137 centimeters (which was the 95th percentile instature for HES girls S years of age) and ages 10 yearsor less; and (2) an boys tsfler than 90 centimeters butshorter than 145 centimeters (which was the 95th pm-centite in stature of HES boys at age 9.5 years) and ages11.5 years or less.
compared with each other and with the HESdata at common points of age overlap.
The seven percentile curves (i.e., 5th, 10th,25th, 50th, 75th, 90th, and 95th percentiles) ineach chart are based on percentile points of ob-served data grouped by age, which weresmoothed by a le”mt squares cubic sp!ine tech-nique developed at the University of Wisconsinby DeBoors and Rice.l 7 “Splining” is a %ermborrowed from carpentry and mechanics to, de-scribe a mode of joining two independent piecesby a third piece which becomes common toboth. In this mathematical application, the“pieces” are polynomials of a degree n, con-nected at selected points (knots) and each pairof successive polynomials having at the knotidentical values of their function and of thefirst n-1 derivatives. Thus, in the cubic” splinefunctions used in this case, two cubics have thesame value, the same slope or velocity, and thesame acceleration at the knot where they arejoined. The number and placement of theseknots requires both knowledge of the propertiesof the data and pragmatic tests of the results.
The program used in this work provides forchoosing either a fixed or a variable knot modeof placement. With fixed knots, the programiterates to obtain a least squares fit subject tothe specified locations of the knots. With varia-ble knots, the program varies the knot Iogationsfrom an initially specified set in order to achievethe least squares fit with the minimaf residual.
The NCHS task force tested many combina-tions of optimally fitting the smoothed curves tothe data. Repeatedly, they varied the numberand location of the knots, using both the fixedknot and the variable knot programs and evalu-ated many delineations of the various data sets.Although some general rules usually suggested atleast an approximate knot selection (see appen-dix II), the best choices were ultimately madeby comparing the predicted curves against con:cornitantly printed overlays of the observeddata points and by using @lmum residusds.The goal was to achieve a maximal smoothingconsonant with the least distortion of the plot-ted percentile points in the original observeddata. With these data it was found that fixedknots at the same ages for all percentiles ii agiven chart (e.g., weight by age, birth-36
3

months) produced percentile lines that were notIocaUy distorted while yielding a good fit to theobserved data.
The metric scale was generally used through-out the life of these data in terms of data genera-tion (i.e., the original body measurements), datapreparation, data analysis, and chart construc-tion. However, to help the task force members,the data would occasionally be converted topounds and inches. The basic scfing of thecharts is metric; however, for the convenience ofthose users who are steadfastly rooted in theEnglish system of weights and measurements,supplementary designations in pounds andinches are provided as well.
METHOD
The measuring techniques are essentially asdescribed in the National Academy of Sciencessubcommittee repord published by CDC. Theminor differences in instrumentation and tech-nique used by the Fels Research Institute mdby the National Center for Health Statisticshave all been taken into account and will bedescribed separately within this report.
Fels Research 1nstitute Data
Weight. –Nude body weight was accuratelymeasured using a regularly calibrated beam bal-ante. The children were measured nude up to 2years of age. Two- and three-year-olds worestandardized clothing; the weight of this clothingwas subtracted from the observed data.
Recumbent length.-Recumbent lengthswere obtained on most subjects from birth to24 years of age, and two examiners were alwaysemployed to help with the proper alignment ofthe subject and to hold the younger children prop-erly. The subject was stretched out fully on aspecially constructed measuring table, his headtouching the fixed headboard, and the flatteningof any lumbar Iordosis was attempted. Keepingthe child’s knees as extended as possible, theexaminer brought the footboard up firmly
a~st tie soles of the feet to create a rightangle. The head circumference was taken with asteel tape placed 1 inch above the glabella infront and at the maximum diameter of the occi-put. The tape was carefully kept in one hori-zontal plane and drawn snugly.
In this serial study, every effort was made toassure independence of observations of measure-ments from one visit to another. The measurersdid not have access to previous data at the timeof measurement. At each visit every child wasmeasured twice (i.&, by two anthropometristswho worked cooperatively and also exchangedmeasuring roles). Interobserver differences areknown to be small.
Status-e.-At about 2% years of age, or whenthe subjects could stand erectly, stature wasmeasured in addition to recumbent length. Itwas measured in the standard manner. with thehead in the Frankfort plane, the child stood talland erect without upwm-d pressure exerted onthe mastoids, and he obeyed the examiner’sinstruction to “Take a deep breath and hold it .“
Thus, from approximately 3 years of agemost of the subjects had a dual set of linearmeasurements: recumbent length and stature.However, the Fels stature measurements werenot used in the construction of the charts; theywere used only for amdysis and in discussion oftechnical problems.
NCHS Data
Weight.–A Toledo self-balancing scale,which prints the weight directly onto a perma-nent record, minimized observer and recordererror. The printed weight was later transferredto a punched card and subsequently to magnetictape. AIthough all body weight data from Felsrepresent nnde weights, those from HES includeIight, standardized examination clothing withthe following approximate weights at variousages: 0.05 kilograms at 1 and 2 years, 0.09 kilo-grams at 3-5 years, and 0.11 to 0.30 kilogramsfrom 6 to 18 years.
Stature. –Stature (standing height) was meas-ured on a stadiometer. In the standard manner(used aIso in the Fels measurement collection)the chiId stood in stocking feet with feettogether and back and heels against the uprightbar of the stature scale. In neither the Fels studynor in the Health Examination Survey (HES)was upward pressure exerted on the subjects’mastoids by the examiner to purposefully“stretch everyone in a standard manner” as hasbeen done in other studies.ls-zo
However, the HES equipment had differentcharacteristics from that used in the Fels study.
4
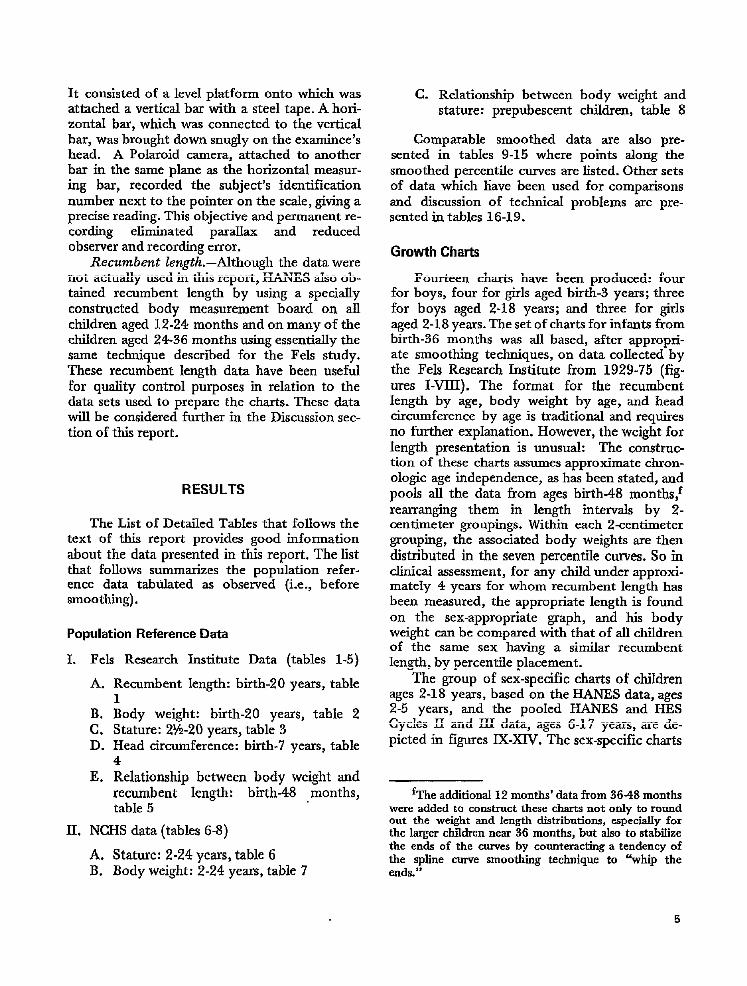
It consisted of a level platform onto which wasattached a vertical bar with a steel tape. A hori-zontal bar, which was connected to the verticalbar, was brought down snugly on the examinee’shead. A Polaroid camera, attached to anotherbar in the same plane as the horizontal measur-ing bar, recorded the subject’s identificationnumber next to the pointer on the scale, giving aprecise reading. This objective and permanent re-cording eliminated parallax and reducedobserver and recording error.
Recumbent length. –Although the data werenot actually used in this report, HANES also ob-tained recumbent length by using a speciallyconstructed body measurement board on allchildren aged 12-24 months and on many of thechildren aged 24-36 months using essentially thesame technique described for the Fels study.These recumbent length data have been usefulfor quality control pm-poses in relation to thedata sets used to prepare the charts. These datawill be considered further in the Discussion sec-tion of this report.
RESULTS
The List of Detailed Tables that follows thetext of this report provides good informationabout the data presented in this report. The listthat follows summarizes the population refer-ence data tabtdated as observed (i.e., beforesmoothing).
Population Reference Data
I. Fels Research Institute Data (tables 1-5)
A. Recumbent length: birth-20 years, table1
B. Body weight: birth-20 years, table 2C. Stature: 2%-20 years, table 3D. Head circumference: birth-7 years, table
4E. Relationship between body weight and
recumbent length: birth-48 months,table 5
II. NCHS data (tables 6-8)
A. Stature: 2-24 years, table 6B. Body weight: 2-24 years, table 7
C. Relationship between body weight andstature: prepubescent children, table 8
Comparable smoothed data are also pre-sented in tables 9-15 where points along thesmoothed percentile curves are listed. Other setsof data which liave been used for comparisonsand discussion of technical problems are pre-sented in tables 16-19.
Growth Charts
Fourteen charts have been produced: fourfor boys, four for girls aged birth-3 years; threefor boys aged 2-18 years; and three for girlsaged 2-18 years. The set of charts for infants frombirth-36 months was all based, after appropri-ate smoothing techniques, on data collected bythe Fels Research Institute from 1929-75 (fig-ures I-VIII). The format for the recumbentlength by age, body weight by age, and headcircumference by age is traditional and requiresno further explanation. However, the weight forlength presentation is unusual: The construc-tion of these charts assumes approximate chron-ologic age independence, as has been stated, andpools all the data from ages birth-48 months:rearranging them in length intervals by 2-centimeter ~oupings. Within each 2-centimetergrouping, the associated body weights are thendistributed in the seven percentile curves. So inclinical assessment, for any child under approxi-mately 4 years for whom recumbent length hasbeen measured, the appropriate length is foundon the sex-appropriate graph, and his bodyweight can be compared with that of rdl childrenof the same sex having a similar recumbentlength, by percentile placement.
The group of sex-specific charts of childrenages 2-18 years, based on the HANES data, ages2-5 years, and the pooled HANES and HESCycles II and III data, ages 6-17 years, are de-picted in figures IX-XIV. The sex-specific charts
fThe additiond 12 months’ datafrom 3648 monthswere added to construct these chsrts not ordy to roundout the weight and length distributions, especially forthe larger children near 36 months, but also to stabilize
the ends of the curves by counteracting a tendency ofthe spline curve smoothing technique to “whip theends.”
5
of stature by ageg and weight by age use similardata sets, but the chart of weight by stature ofthe boys is somewhat different from the chartof weight by stature for girls. Because girls reachpuberty and the onset of pubescence 1%-2 yearsbefore boys (an estimated 19 months earlieraccording to HES datal 0 ), the two data sets forprepubesccnce had to be selected and defineddifferently.
Iu construction of these weight-by-lengthcharts, approximate chronologic age independ-ence “of this relationship has been assumed frombirth until the marked changes in body size andproportions occurring at the pubertal growthspurt. But in cross-sectional data as that jointlyprovided by HES and HANES, there are noserial body measurements on each subject fromwhich to construct individual growth charts,whic~ would clearly indicate when this growthspurt has started. In addition, data about thepresence or absence of the correlated phenom-ena of pubescence were not obtained on chil-rken under 12 years of age. Consequently, thetruncation of the upper end of the data setcould only be defined by chronologic age andKody size measurements, and separately for boysand girk.
very few girls would have reached the earli-est pubescent growth changes in stature or‘weight by 8.0 years of age so that their effect onthe data set is negligible. For example, the frosteffects of the pubescent growth spurt of suffi-cient magnitude affecting enough girls to influ-ence cross-sectional population data have been“estimated to occur at 10.25 years.10 But ratherthan truncating the NCHS reference populationat age 8.0 years, an attempt was made to maxi-miz~ the age range of the population for whichthese data are appropriate (i.e., to include mostprepubescent gik, regardless of chronologicage). The most precocious maturers would likelybe the tallest because those children who havebeen largest since birth tend to mature at anearly age and also because those who do matureearly consequently become larger than the rest.
SIJntil almost 3.0 years of age, those dataarea suix-
tnre of recnsahent length and stature measurements andmay, therefore, be as much as 2 centimeters higher than“if all were stature measurements. This will be discussedin further detail in this section.
By excluding the tallest members of the popula-tion, the chronologic age couId safely be ex-tended to 10.0 years with very little risk of datacontamination by pubescent girls. Consequently,if only those girls whose stature was greater than137 centimeters (i.e., above the 95th percentileat age 8 years by HES data) were excluded fromthe NCHS data set, the height and weight meas-urements from the remaining girls could safelyserve as a prepubescent reference population.Thus, the concomitant constraints of chrono-Iogic age and stature enable production of thelargest and most broadly applicable NCHS dataset, commensurate with a very high safeguardagainst distortion by the somatic changes inpubescent girls.
Analogous constraints were used to arrive atthe appropriate data set for boys. But, becausethe boys lag bebind the girls in maturity byapproximately 19 months,] O both the chrono.Iogic age limit (i.e., 11.5 years rather than 10.0years) and the age at which the height constraintof 146 centimeters was chosen (i.e., 95th per-centile at 9.5 years opposed to 8.0 years) wereplaced 18 months later than those of the girls.Hence, sdthough the data sets upon which thetwo charts are constructed are somewhat differ-ent (and as can readily be seen comparing figureXIII with figure XIV, the relevant stature rangeis 9 centimeters greater for boys than for girls),the most important biologic constraint is com-mon for both. The appearance of the earliestsigns of pubescence,h regardless of chronologicage, invalidates the applicability of these chartsof weight by stature to that individual.
DISCUSSION
Weight Distributions by Length
Attempts to separate populations of peopleinto groups expressing degrees of leanness orfatness with quantitative precision have usuaIlyrelated measurement o.f weight to height in someway. “Ponderal index” (height cubed/weight)
hThe signs of early pubescence are breast buddia%
testicular eulargemcn~ aud growth, coarsening, and
PiSm~fig of ZXWIY and pubic hair. (Pubic hairdevelopment is frequently the most nseful single indi-cafor in fieId studies.)
has been used frequently and offers some con-ceptual appeal by cubing the nnidmensionalm-e%-iure (stature) making it three dimensionaland, hopefully, more like a three-dimensionalvolumetric measure which might afford a more
appropriate comPfison with weight. However,in practice, thk index is limited because i!behaves differently within the two sexes and atdifferent ages as the axis by which excessivelylean or excessively fat children and/or adults aredistinguished from the “normals.” In this reportneither the ponderrd index nor any of the otherratios or formulas are presented: not interpretivequantitative indices but the more descriptivepercentile distributions of body weights by sexare used for a given length or stature.
This report is not proclaiming a new biologicprinciple that the relationship between weightand height is essentially linear and age independ-ent from birth to the beginning of the pubertalgrowth spurt (at which time body propotiionsand the relationships of weight to stature beginto change dramaticallyzl ). On the contrary, asubsequent report will demonstrate that this isnot quite true, at least for children from 2 yearsamd older. In a normal population of growingchildren of the same height, those who arechronologically older will also be slightlyheavier. It is considered, however, that the ageindependence of the relationship is close enoughso that body weight dktributed by staturegroupings is a useful statistical device for classi-fying populations especially into various cate-gori$?s of nutritionally related growthdkturbances. It can be most useful when othercritical information such as chronologic age iseither unknown or unreliably reported, and ifweight and height are the only body measure-ments that can be obtained accurately (espe-cially when lacking an accurate measure of tri-ceps or sub scapular skinfold, or even a reliable
upper urn Circumference).
Usesand Reliability of NCHS SmoothedPercentilesCurvesfor Attained Body Size
The NCHS tables are based on current andhigh quafity growth data as well as on the mostrecent advances in data processing and analysis.These charts should be worthy replacements forthe venerable Stuart-Meredith charts, which first
appeared in 1946.22 AH the steps of data handlingand chart production are uniquely documentableand reproducible-from sampling design and exe-cution to measurement milieu, from data editingto final data set selection, and from the selectionand modification of the curve-smoothing processto the production of the final computerizedcurves. In addition, the generation of the equa-tions and the plotting of the curves maybe dupli-cated on any large digital computer with plottingcapability, either to produce charts or for com-puter storage to analyze data from new studies.The information necessary to reproduce the per-centile curves is contained in a deck of 308 com-puter cards that could be supplied by NCHS.For clinical use, however, accurate grotih chartsfor widespread dk.semination based on theNCHS percentiles have already been producedby the Ross Laboratories, Columbus, Ohio.Several major research and service projects, whichwill be facilitated by computer processing oflarge amounts of anthropometnc, clinical, andnutritional data in comparison with the NCHSreference data, are already ‘underway using thedeck of computer cWds. The Nutrition Surveil-lance Program of CDC, having contributed sig-nificantly to the development of these percentilecurves, has been, of course, the first to exploitthis resource in their progmun. During the pastseveral decades researchers at Harvard collectedextensive anthropometric data on more than800 cases of congenitrd heart disease, both pre-and post-operatively. These data will now bequantified with the NCHS reference points andmany crucial questions (e.g., optimal age ofsurgical intervention in specified conditions totilmize permanent growth retardation) can besystematically worked on. In addition, severalprograms are nuder way for measuring the posi-tive growth effects of nutritional and medicalcare intervention, utilizing the deck of NCHScomputer cards.
The widespread use of this common stand-ard reference will facilitate the much neededcomparative and standardized studies of popula-tions, both on national and international levels.The practical advantage of reproducibility facili-tates widespread computer use and creates a“common coinage,” another virtue of articulat-ing and documenting such a complex process.With future new information, new concepts, or
7

more efficient ways of organizing and looking atthese kinds of growth data, the steps in the pro-
duction of those percentile curves can be
retraced; the juncture of major decisions can be
reexamined; and modifications can rationally be
applied on firm grounds without distorting theintegrity of the remaining body of data. This
degree of definition and articulation is also valu-able epidemiologically by enabling clear anddetailed comparisons of this body of referencedata, which also includes a host of other biologic
and socioeconomic variables associated with
growth and development in the data of theHesdth Examination Surveys, with other bodiesof growth data, including their associated vari-
ables.New charts, which accurately represent the
growthi of cbiIdren in the Ufited States, @l
probably not have to be constructed for a long
time because of the technical quality of thesecharts & population estimates and also becausechildren’s growth rates, which had been increas-
ing for the past century or more, have appar-
ently stabilized, at Ieast for the present. (See thesection, “Secular Trends,” for further discus-sion of this latter point.)
High as this task force claims the overall
qurdity of these charts to be, all segments of allcharts are not of identical statistical quality or
quality Of population estimate. Some segmentsare better than others. The better segments will
continue to be used after segments of lesserquality have been replaced or modified.
The parameters of body weight, length,stature, and head circumference, by increasingchronologic age arranged in percentile distribu-tions, have been very nseful and probabIy wiIlcontinue to be useful for many years to. come.The capability of presenting them in smoothed
percentile curves (of the articulated quality inthis report) represents a distinct advance over
presentation of these variables with a central
tendency (mean or median) and standard devia-
iGrowth charting, in the context of this paper, asstated in the CTutroduction,” always means dirtancecurves or size attained at a given age (or length) as @stin-gnished from growth velocity rwves, which are incre-mental or rate estimates aud cm only be constrictedfrom longitudinal data. ThE distinction becomes mostcriticaf at the pubertal growth spmt.g,1 0,23-26
tions or synthetically generated or hand-smoothed percentiles. The relationship betweenweight and length is complex, and in this firstlarge-scale organization of data, the task forcewas aware of walking on thin ice. The assump-tion of age independence over the age span usedis only approximately true, at best. In addition,-there were many alternative ways to define the“ages and body sizes considered, each tvith some-what different consequences. Some of the usesand abuses have been foreseen, but certainly notall of them. As more detaiIed epidemiologic,clinical, and experimental data (metabolic andgrowth) are applied to these reference data,much will be learned, and modifications andrdterations will probably be made. However, thebasic population estimates as defined and pre-sented here are good data.
Because of the nature and efficiency of thesamples, all the NCHS data provide somewhatmore reliable population estimates, and ofknown quality and reliability, than are providedby the corresponding data from the Fels
Research Institute. The sampling design of theFels data is acknowledged to be limited geo-graphically, culturally, socioeconomically, andgenetically. In addition, careful comparisons ofthe Fels body measurements with NCHS datashow that, although the median values are quitesimilar, both the low and high outer percentilesare slightly restricted in the Fek data; that is,the Fels population is slightly less heterogeneousthan is the more nationally representative NCHSsample. However, birth weights of the Fels studysubjects compared with a nationally representa-tive set available from the National Center forHealth Statistical were remarkably similar when
jA recently available5-percentsample(not yet pub-fished) of aff live bii weightsia the United Statesin1974 stratified by race, region, and socioeconomic level.The median birth weight for the total U.S. sample was
3.32 kilograms(3.36 kilogramsfor whitesalone), whilethat of the Felssamplewasafso3.32kilograms.The sex-specific mediansagreed almost as welb 3.40 kilogramsfor both Fels and U.S. males aud 3.25 and 3.26 kifo-
Wsms for Fels and U.S. femrdes, respectively, Whenchildren with low birth weights (i.e., less than 2,500
wrns) were compared, the two samples were,a!Wn,very simflM: about 7.4 percentof the U.S. sampleaud about 7.9 percent of the Fels children fell in thiscategory. Interestingly, when the two samples were
(Confina)
adjusted for race and multiple births, with onlysfightly less than the expected 5 percent of theFels babies above the U.S. 95th percentile.
Beginning at age 1 year (the earfiest point atwhich there are comparable data from Fels andHES), there is a sfight restriction at the extremepercentiles of the Fels data. This restricteddistribution ia slightly greater for weight andweight by length .than it is for length. Thisslightly augments the restriction of the 90th and95th percentiles of Fels data of weight by lengthcompared with NCHS data of weight by stature,when appropriately repositioning and adjustingthe overlapping charts for the known systematicdifferences between recumbent length andstature measurements. Some of this disjunctureat the highest percentile is due in part to a Felssampling bias as well as to inherent problems,especially at these ages, when attempting tocompare recumbent length with stature measure-ments. (This will be dkcussed further in thetext.)
Akhough there were no technical reasons todoubt the reliability of the head circumferencepopulation estimates based on the Fels data,either by evidence of internal inconsistencies ofthe data or when compared with other availabledata from highly imperfect samples, the confi-dence with which these data can be offered isdiminished by the fact that there were no otherreliable NCHS types of population estimates towhich they could be compared at any age. (TheNCHS head circumference data available at thktime are known to be tectilcally flawed.) There-fore, our confidence cannot be as great for thesedata as it is for the data on stature by age andthe body weight by age percentiles, especiallybetween ages 6 and 18 years when there was
, almost perfect agreement between the two cor-responding sets of NCHS data (HANES andHES), each of which, in itself, provided highlyreliable estimates of those population param-eters.
(Footnote -icontinued)modified to achieve m-am cornparability (i.e., U.S.whkes against Fels sample adjusted to reflect the U.S.proportion of twinningbecause the Fels study purpose-fully had contained an excess of twius), the percentagesof low bti weightswere almostidentical for the UnitedStatesand Fela(6.3 and 6.4 percent).
In summary, although there is some varia-tion in the degree of confidence in the perma-nency, the reliability, and present usefulnessof the data and the charts as population esti-mates, there are only three smalf known excep-tions to our claim that these charts representhighly accurate population estimates. First,there is very slight limitation of the variation orheterogeneity of the Fels study participants inbody weight. Second, due to this slight samplingrestriction and also to some probable biases andtecMlcal problems in both measurement ofrecumbent length and statures, and selection ofsamples between ages 2 and 3 years, there is alimitation of the 90th and 95@ percentile ofweight by length, most pronounced at thosebody lengths corresponding approximately toages 2 ad 3 years. And thwd, as will be dis-cussed in more detail, there is an upward distor-tion of the stature-by-age curves between 2 and3 years because of an unavoidable admixture ofrecumbent lengths and stature measurementswhich is most marked nearest to 2 years of agewhere the upward distortion is approximately1.5 to 2 centimeters, and it approaches zero dis-tortion at 3 years. The judgment of the NCHStask force was to adhere strictly to a poficy ofno data adjustments, and to describe deficien-cies we knew about, indeed, to bring themclearly to the attention of those who would beusing our charts.
Recumbent Length or Stature
The relationship between the two majormodes of estimating the linear extent of the longaxis of the body—recumb ent length measured ona board and stature measured on a stadiometer—is complex. In those few studies in which bothmeasurements were performed on a subject atthe same visit, the median recumbent length wasusually 1 centimeter to approximately 1Y2centi-meters greater than was the median of stature.But as Roche and Davilal 1 have pointed out,even the median differences are quite study spe-cific. The overalf median differences reported inonly four separate studies ranged from O.7centimeter to 1.7 centimeters. However, the‘range of median differences was greater andvaried by sex and age. The median differences
9

wer: greatest among the youngest children (2-and 3-year-olds), and tended to be slightlygreater among girls and to be less among thefatter and possibIy also the tall children at anygiven age.
The exact reasons why measurements ofrecumbent Iengthj which momentarily relievesthe upright body from gravitational pressure,are approximately 1 to 1.5 centimeters greaterthan those for stature for most people, are notcompletely clear. Increase in the intervertebraldisk spaces due to relief from gravitational pres-sure probably requires more recumbent timethan the few minutes usually allotted for thesekinds of examinations. A large part of the causeis probably not related to this strictly physica.-mechanical explanation, but rather to a moredynamically postural one which includes muscletone and body set. Some of the known sourcesof variation are sex, age, time of day of measure-ment, length of time (recumbent versus upright),“body size, postural attitude and psychologicalset of the subject, and the sub tIe and complexdifferences between the two techniques as em-ployed by different examiners and in differentexamination settings.
Because of this complex set of factors andfrom the examination of median differences,Roche and Davila rightly conclude in theirreport that directly recording each of the twovariables is the ideal.] 1 But when only one meas-urement is available, and when, for the sake ofcontinuity, it is necessary to convert, then a rea-sonable adjustment can be made in most cases,if there are sufficient sets of dual measurementsand a proper analysis of the datafiom the samestudy. In other words, each study must calibrateits own median differences. Otherwise, theadjustments will be very crude (between ~.5 and2 centimeters for most of the youngest childrenand approximately 1 centimeter for most of theadolescents and adults if standzwd measuringtectilques are accurately applied for both setsof measurements).
The situation is actually more complex thanthe examination of median differences and acursory look at correlation coefficients wouldsuggest. A preliminary examination of the dis-tribution of. the differences between these two
examinations by individual subject is even moreconfusing and warrants a more detailed discus-sion than is possible here. The differences arestartlingly large for a small part of the sample,large enough in these particular subjects toinvalidate any conversion from one mode to theother, using a median adjustment, even a study-specific one. In these extreme pairs it is difficqltto determine what part is situatiord (measuringtechnique and milieu and also the subject’scooperation and behavior), and what partreflects true biologic variation (which could *Oinclude some pm.tural deformity). When a seriesof dual measurements is available on the samesubject at repeated visits, it would seem that ifonly one pair were in the extreme range, then itwould most likely be related to the measuringtechnique. If the difference between recumbentlength and stature is consistently large or smallin the absence of known structural, postural, orbehavioral defects, then it must be concludedthat the subject is a true variant,in which case acomection factor that is specific for thatindividual could be imputed, if necessary, forthe missing one of a pair of measurements.
The consideration of these complexities wasforced upon us in trying to interpret the signifi-cant defect observed when attempting to mergethe weight-by-recumbent-length curves with theweight-by-stature curves, after adjusting for amedian difference resulting from the. two tech-niques.
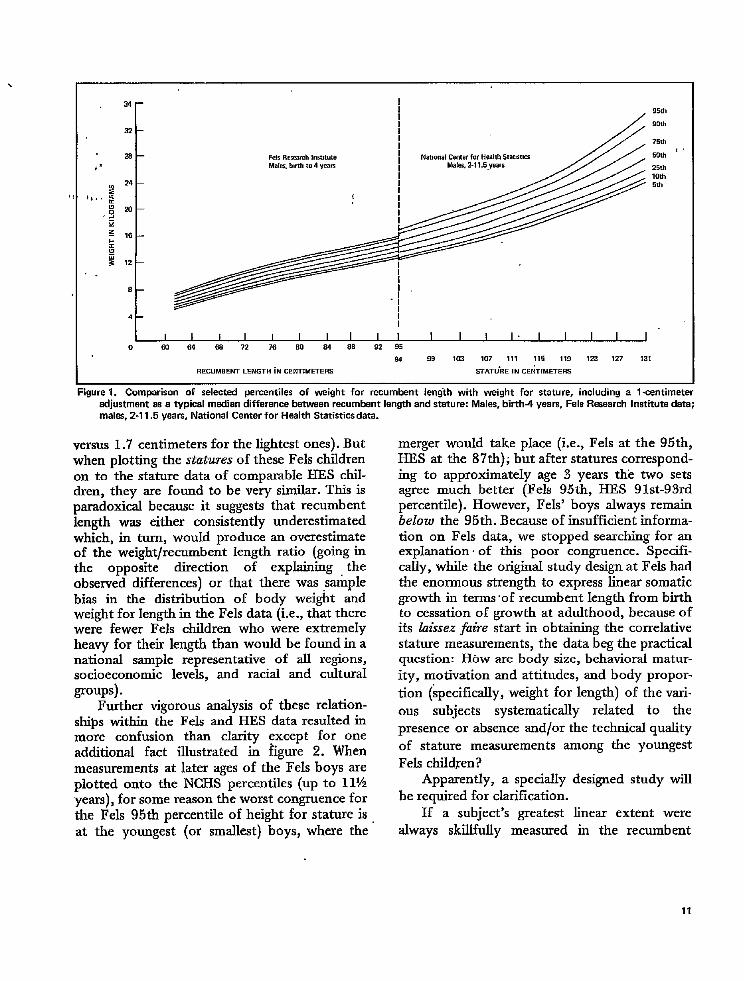
As shown in figure 1 after this adjustmentwas made, the curves for the 5th percentilethrough the 75th percentile all connected well.However, the 90th and 95th percentiles ofweight by recumbent length (Fels data) were sub-stantiality lower than the corresponding curvesfor weight by stature (NCHS data), i.e., the 95thpercentile of the weight by recumbent lengthconnected at the 87tb percentile of weight bystature. When the set of differences among thoseFels children who had both measurements wereexamined, for those children in the 90th percen-tile and above in body weight as compared tothose in the 10th percentile and below, it wasfound that the average mean difference betweenthe two kinds of measurements was much lessamong the heavier children (1.2 centimeters
10
34
32
28
[
Fd% Research lm,,tuteMales. buth to 4 wars
III
I/
95*
II1I
Nat,.ana! cam< for Health StatntmMales 2.1 1.5.YWS L;
I I ! I I I I I I I I I I 1. I I I I06063687276 8084809295
I
94 99 103 107 117 115 119 123 127 131
RECUM9ENT LENGTH iN CENTIMKERS STATU’RE IN CEPiT( METERS
,gure 1. Comparison of selected percentiles of weight for recumbent length with weight for stature, including a 1-centimeteradjustment as a typical median difference between recumbent length and stature: Males, birth-4 years, Fels Research Institute data;males, 2-11.5 years, National Center for Health Statistics data.
versus 1.7 centimeters for the lightest ones). Butwhen plotting the statures of th~se Fels ctidrenon to the stature data of comparable HES chil-dren, they are found to be very similar. This isparadoxical because it suggests that recumbentlength was either consistently underestimatedwhich, in turn, would produce an overestimateof the weight/recumbent length ratio (going inthe opposite duection of explainbg the
abserved differences) or that there was ptiplebias in the distribution of body weight andweight for length in the Fels data (i.e., that therewere fewer Fels children who were extremelyheavy for their length than would be found in anational sample representative of all regions,socioeconomic levels, and raciaf and culturalgroups).
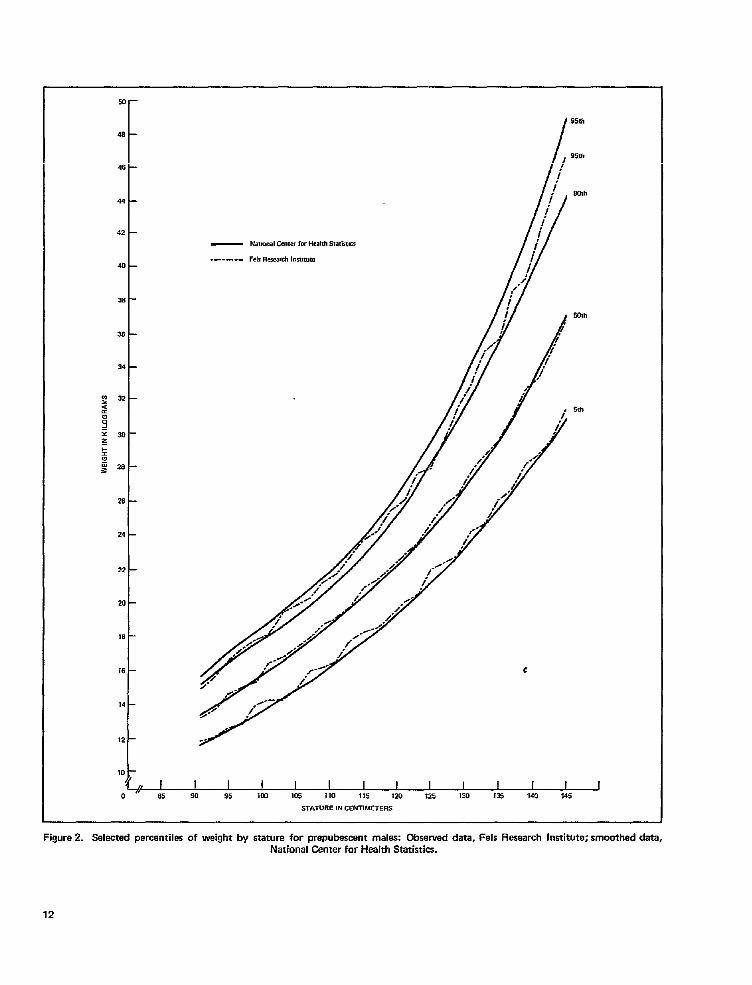
Further vigorous analysis of these relation-ships within the Fels and HES data resulted inmore confusion than clarity except for oneadditional fact illustrated in figure 2. Whenmeasurements at later ages of the Fels boys areplotted onto the NCHS percentiles (up to 11%years), for some reason the worst congruence forthe Fels 95A percentile of height for stature is
at the youngest (or smzdlest) boys, where the
merger would take place (i.e., Fels at the 95th,HES at the 87th); but after statures correspond-ing to approximately age 3 years the two sets
agree much better (Fek 95*, HES 9lst-9 3rdpercentile). However, FeIs’ boys always remainbelow the 95th. Because of insufficient informa-tion on Fels data, we stopped searching for anexplanation of this poor congruence. Specifi-cally, while the original study design at Fels hadLie enormous strength to express linear somaticgrowth in terms of recumbent length from birthto cessation of growth at adulthood, because ofits lasksezfaire start in obtaining the correlativestature measurements, the data beg the practicalquestion: HOW are body size, behavioral matur-
ity, motivation and attitudes, and body propor-
tion (specifically, weight for length) of the vari-
ous subjects systematically related to the
presence or absence and/or the technicaf quality
of stature measurements among the youngest
Fels chiidren?Apparently, a specially designed study wilf
be required for clarification.
If a subject’s greatest linear extent were
always skillfully measured in the recumbent
11
50—
48 -
46 —
44 -
42
40 -
38 -
36 —
3’4 -
32 —
30 —
a -
26 -
24 -
22 -
20 –
18 —
16 —
14 —
12 -
— Nat,onalCMter fm HealthStat.kt,cs
------ Fe!, FIese,ti Insuome
Figure 2. Selected percentiles of weight by stature for prepubescent male= Observed data, Fels Research Institute; smoothed data,
National Center for Health Statistics.
position from birth onwards, as was done in theFels study, these considerations would be aca-demic. Of course, stature (standing height) isthe almost universsd mode of measuring thelinear extent of older children and adults, bothin growth studies and in clinical practice.Because infants and most children younger than2 years cannot stand well enough to allow satis-factory upright measurements, that group mustbe measured in the recumbent position. If chartswere constructed selecting only those childrenwho could stand prop erly for stature measure-ments, distorted reference data biased towardthe most mature and biggest children (those whocould stand upright) would result. In clinicalpractice and for epidemiologic comparisons(both in interpreting the sets of reference datafrom which these charts were constructed andthen estimating the length or stature of irtdivid-ual young children), the awkward transitionperiod cannot be avoided. Some problems aresure to occur in selecting the measurement tech-nique and interpreting the data; whatever themeasurement mode used, the quality of themeasurement may be poor. The only approachto the dilemma is to do one’s best, aware of thelimitations.
Even in the skilIed hands of the NationalCenter for Health Statistics, that part of theHANES data that deals with linear measurementof children between the ages of 2 and 3 years isflawed. Over the 3-year period when the HANESdata were being collected, several teams ofresearchers operated in different parts of theUnited States in three separate cmavans oftrailers. All had the same set of instructions, butall did not interpret those instructions in idehti-cal ways. A measuring board was used by allteams to measure recumbent length of infantsbetween 1 and 2 years of age; all children 3years of age and older were measured standingupright. However, the instructions required thata dual set of measurements (recumbent lengthand stature) be taken on children between 2 and3 years of age. This was not universally done,and in most cases the mode of measurement forthe 2-3-yezw age group was not recorded. There-fore, we do not know if the linear measurementsrecorded for that group represent recumbent orstature data. These data have all been treated as
stature, both in the stature-by-age charts (2-18years) and the weight-by-stature charts (pre-pubescent).
On careful reconstruction of the operationalrecords and internal inspection of the HANESdata and also by comparing them with data fromthe Owens study and from the Fels study, withspecial attention to the relationship of recum-bent length-stature measurements, the followingconclusion was made about this small subset ofHANES data: Nearest age 2 years most of themeasurements are recumbent (but selectivelybiased toward the smallest and least maturechildren); the proportion of statures increasesfrom age 2 until at age 2.9 years almost all themeasurements are probably statures. Wedeliberated long about this particular segment ofdata and were tempted to make an exception toour nde of “no adjustments to observed data.”Recognizing that adjusting this bit of data wouldintroduce more problems than would be solved(there is a selective bias across the weight andheight ~ercentilis, of an unknown magnitude,that would require a differential adjustment atdifferent percentiles), we made no adjustment.Because the body weight estimates are perfectlysound for this age segment, and because it waspredicted that the length of many childrenwo~d be measured standing (more convenientand likely to yield better technical results in allbut the most experienced examination centers–assuming the child is able to stand properly), itwas judged desirable to include stature percen-tiles beginning at 2 years of age and to presentthe data as the best available at the present timewith the following caveat: the median is 1.5 to 2centimeters too large at 2 years of age (i.e.,greater than it would have been if all values hadactually been stature measurements and if allchildren were capable of proper stature meas-urements at that age), but thk discrepancyprogressively diminishes and disappears atapproximately 2.9 years of age.
This is the only known technical defect in allthese data. The fact that it occurs at the difficulttransition between 2 and 3 years of age(between the recumbent and stature years),where the two sets of charts overlap by age, andwhere measuring precision is low, somewhateases the practical impact of the problem.
13

Curve Smoothing
The NCHS task force decided that appropr-iately smoothed growth curves not only lookbetter but, if the smoothing process does’ notdistort the basic data, they represent realitybetter. Although mathematkd techniques forsystematically smo.oth-mg curves (like movingaverages or fitting the observations to - aGompertz curve) have been used for many yearsfor a variety of purposes, most growth ekpertshave smoothed their curves by ‘hand to minimizedistorting the data by unknown mathematicalfactors.
Perhaps the chief disadvantage of expertsmoothing by hand is that, like all great art, it isnot quantifiable and not reproducible. But withthe ava.ilabfity of computers and iterative plot-ting devices, there is the possibility of systematicsmoothing with checkpoints against theobserved data to see if the final results reason-ably represent the data. The goal resembles thatof the ideal nbise filter for phonograph or radio:to eliminate aU of the noise but none of themusic–’’noise” being those jagged deviationsfrom a smoothed line which are solely due tosampling variation, “music” being a true deflec-tion representing reality (such as the upwardMlection of the height-by-age curves in boysjust after age 11% years due to the beginning ofthe adolescent growth spurt).
Two basic methods of systematic, computer-ized curve smoothing were considered: (1) splinepolynomial smoothing of the observed percen-tiles and (2) smoothing by means of the Pearsoncurve system using polynomials in age to esti-mate the first four moments. The first is a wel.l-documented method readily avaifable for the
computer, even though it had never been appliedbefore to growth data and had several lirrsita-tions which would require adjustment andmo deification. The primary objection to thissystem in the beginning was that it, apparently,did not develop any coherent relationshipbetween the different percentile lines. Thesecond system, while very sensitive to theenormous amount of information contained inthe median or central tendency, would possiblybe oversensitive to outlying values (zdthoughmany outlyrng v31ues
usually presents the
14
are valid, this regiongreatest frequency of
spimious data); but this method would haverequired much more developmental work toadapt it for the present purpose than would themore folly developed cubic spline regressiontechnique. It was considered that, without theconstraints of time and resources, a third, andbetter, alternative would probably be to raisethe. degree of the existing spline polynomialsystem from cubic to quartic and thus allow abetter interrelationship between the percentilelines. Later it was realized that the existing cubicspline technique had another strength: twomodes (fixed or variable) of placing the knots.Using the fixed (constant) knot subroutine ulti-mately gave some degree of parallelism andinterrelationship between the percentiles. Whhmuch trial and error (feasible with a computer)and testing the resulting fits to see if they rea-sonably represent the data (only possible withthe data plotter), the cubic spline technique wasfinally employed to the eventual satisfaction ofthe NCHS task force. A brief description of thisspline system, together with a listing of some of
its strengths and weaknesses when applied tothese kinds of data, and a full discussion of themodifications employed in our application
appear in appendix II.
Secular Trend
In the analysis of these data, the markeddiminution and near cessation of the trend toconstantly increasing size of successive genera-tions of American children is the most dramaticand significant finding relating to humarr biologyand human growth in general. This secular trendto ever-increasing size and earlier maturation (auniversaJ finding among the countries of thewestern world for the past century that has be-come a good biologic index of the degree oftechnological and socioeconomic advance of thedeveloping countries) has been extensively dis-cussed many times.g~10JZ6-4Z
From hk careful comparisons of manygenerations of incoming Harvard students,Damon in 196827 was the first to seriouslysuggest the cessation, or at least a markeddiminution, in this trend in America.
Damon’s observations and those of severalothers36~43~44 were limited to data from the
upper socioeconomic segments of society, where
the cessation apparently first occurred. Thepresent findings both confirm those of Damonand extend them to include most segments ofthe American population.
A small but detlmite correlation was demon-strated in earlier NCHS dataz6 between thebody size of children in the United States andthe annual income and educational level of theirparents. Because the most recent data show avery slight increase in statures in the 5th and10th percentiles (and possibly “even a faintincrease at the 25th percentile as well) over thatof children born 5 or 10 years earlier and essen-tial stabilization (of statures, at least) for therest of the population, a firmer statement is nowwarranted of Darnon’s speculation, “The endmay be in sight.”zs
However, the precise dating of this cessation(which may be either temporary or permanentor may even yield to a reversal) is difficultbecause there were no data yielding reliablepopulation estimates (suck as the present ones)on the growth of children before 1963 on whichto make projections. In a detailed analysis com-
paring that first cycle of HES chiIdrenz6 withother available data (all of which had varyingdegrees of sampling Limitations), we concludedat that time, from data collected on childrenborn before 1950, that the secular trend,although possibly abating in the United States,had not yet ceased. From the analysis of ourcurrent sets, of data the congruence (as seen intables 18-19 between the statures and weights ofchildren from HES Cycles II and III and thosefrom HANES I, born almost 10 years later) isnot limited to identical median values but
applies to most of the distribution of staturesfrom at least the 25th to the 95th percentiles.Whatever complex of factors had been produc-ing the secular trend to increasing body size ofchildren (and adults) from the prenatal periodonward, had ceased to be of sufficient magni-tude by 1955 or 1956 to affect these rathersensitive data across most socioeconomic levelsof the American population. When the stragglerswilI finally achieve their genetic potential to fullstature can probably be better predicted by eco-nomic and social factors ‘than by biologic ones.
000
15

REFERENCES
lComrnittee on Nutrition Advisory to CDC, FNB,NAS-NRC: Comparison of body weights andlcm@s orheights of groups of children.h%tr. Rerr. 32:284, Mar.1974.
2 Owen, G. M.: The assessment and recording ofmeasurements of growth of cfildIeIH Report of a .smmconference. Pediati”cs 51(3) :461-466, Mar. 1973.
3Roche, A. F., and McKigney, J. L: Physicsl growthof ethnic groups comprisii the U.S. population. Am. J.D&. Child 130:62, 1976.
40wen, G. M. et al.: A study of nutritional stat= Of
preschool children in the United States, 1968-1970.Pediatn”cs 53:597, 1974.
5Nation~ Center for He~th &ati~tic~ : Plm ~dinitial program of the Heaftb Examination Survey. Vitaland Health Statistics. Series l-No. 4. DHEW Pub. No.(HRA) 74-1038. Heafth Resources Administration.Washington. U.S. Government Printing Office, Nov.1973.
6National Center for Heafth Statistics: Plan,operation, and response remdts of a program ofchifdren’s examinations. Vital and Health Statistics. PHSPub. No. 1000-Series I-No. 5. Public Health %rvice.
Washington, U.S. Government Printing Office, Oct.1967.
7N~ti~~~ cater for H.--& stati~tic~: plm ad
operation of a health examination snrvey of U.S. youths12-17 years of age. Vital and Health Statistics.SE&s l-No. S. DHEW Pub. No. (HRA) 75-101S. HeafthResources Administration. Washington. U.S.Government printing Office, Sept. 1974.
8Nation~ Center for He.tb stati~ti~s: pIan ad
operation of the Health and Nutiition Examinationsurvey, United States, 1971-73. Vital and HealthStatistics. Series l-No. 10a. DHEW Pub. No. (HSM)73-1310. Health Services and Mentaf Health Administra-tion. Washington. U.S. Government Printing Office, Feb.1973.
9Nationd Center for Health Statistics: Height ~d
weight of children, United States. Vital and HealthStatistics. Series 1 l-No. 104. DHEW Pub. No. (HRA)75-1093. Health Resources Administration. Washington.U.S. Government Printing Office, Sept. 1970.
10Nationd Center for Health Statistics: Height andweight of youths 12-17 years, United States. Vital andHealth Statistz”cs. Series l-No. 124. DHEW Pub. No.(HSM) 73-1606. Health Services and Mental Health
Administration. Washington. U.S. Government Printingoffice, Jan. 1973.
1lROche, A. F., and Davifa, G. H.: Dfierencesbetween recumbent length and statnre witbin individ-Ud,. Growth 38:313-320,1974.
12 Roche, A. F., and Davifa, G. H.: Pre-pubertal andpost-pubertal growth, in D. B. Cheek, cd., Fetal andPostnatal Growth–Hormones and Nutrition. New York.Jofm Wiley and Sons, Inc., 1975. pp. 409414.
13 RO&e> A. F., ad Dada, G.; Late adole~cent
growth in stature. Pediatrics 50: S74-880, 1972.14 Rofie, A. F.: Some aapects of adolescent growth
and maturation in H. N. Mm-roe, srrd J. I. McKigney,eds., Nutrient Requirem erzts in Adolescents. Cambridge,Massachusetts. Maamchusetts Institution of TechnologyPress, 1975. pp. 33-56.
15Tf&en, D., Bock, R. D., Waynor, H., and Roche, A.
F.: Individual growth in statnre: A comparison of fourUnited States growth stndies. Ann. Hum. Biol. 3:529-542,1976.
16Nationd Center for Heaftfr Statistics: Preliminary
findings of the first Heafth and Nutxition ExaminationSurvey, United States, 1971-1972, Dietary Intake andBiochemical Findings. DHEW Pub. No. (HRA)74-1219-1. Health Resources Administration. Washing-ton. U.S. Government Printing Office, Jan. 1974.
17DeBoor, C., and Rice, J. R.: Least Squares i%bkSpline Approximation I-Fixed Knotr. Technicsf ReportNo. 20, Compntcr Science Dept., Purdue University, W.Lafayette, fnd., Apr. 196S.
18 T-m, J. M.: PersonaJcommunication.19 Krogmm, W. M.: A handbook of the measurement
snd interpretation of height and weight in the growingchild. Monogr. Sot. lZes. Child Deu. 13(3), 1950.
2@mner, J. M., H1emanx, J., and Jarrmrn, S.: Growth
and physique studies, in J. S. Weiner and J. A. Low’e,eds., Human Biology, A Guide to Field Methods. D3PHandbook #9, Philadelphia. F. A. Davis Co., 1969.
21 NaticInd Center for Heafth Statistics: Body weight,
stature, snd sitting height: white and Negro youths12-17 years, United States. Vital and Health Statistics.Series 11-No. 126. DHSW Pub. No. (HRA) 74-1608.Health Resources Administration. Washington. U.S.Government Printing Office, Aug. 1973.
22 Stuart, H. C., and Meredith, H. V.: Use of bodymeasurements in the school health progmm. Am. ].Public Health 36:1365, 1946.
16
23 T_er, J. M., Wfritehouse, R. H., and Takaishi, M.:
Standards from birth to matnrity for height, weight,height velocity, and weight. velo,city: British children,1965. Arch. Di.s. Child. 4:454,1966.
24 Shuttleworth, F. K.: Sema] maturation and the
physical growth of girls age six to nineteen. Moraogr.Sot. Res. Child Dev. 2(5), 1937.
25BOU, F.: The gowtb of chWren. Science .,19:256-257, 281-282; 20:351-352,1892.
26National center for Health Statistics: Height andweight of chikiren: Socioeconomic status, United States.Vital and Health StatMics. Series 1 l-No. 119. DHEWPub. No. (HSM) 73-1601. Health Services and MentalHealth Adminktsation. Washington. U.S. GovemmcntPrinting Office, Oct. 1972.
27 Damon, A.: Secdw trind in height and weight
within old American familiee at H-d, 1870-1965.Am. J. F’hys. AnfhropoL 29(1):45-50, 1968.
28 D~on, A.: Linger body sizeand earliermenarche:
The end may be in sight. .SOC.Bs_ol. 21 (1) :8-11, 1974.29 Meredith, H. V.: Ch~ge in stature and body weight
of North American boys during the last 80 years, in L.Iipsitt and C. Spiker, eda., Aduances in Child Develop-ment and Behanior, Vol. 1. New York. Academic Press,1963. pp. 69-114.
3 OMere&h, K. V.: Findings from Asia, Austra6a,
Europe, and North America on secular change in meanheight of chikhen, youths and young adults. Am. J.Ph s. Anthropol. 44(2):3 15-326, 1976.
&yfcre&h, H v-,~d Mere&th, E. M., The stature of
Toronto children haff a centmy ago and today. Hum.Btbl. 16:126-131,1944.
32T~ner, J. M.: Growth at Adolescence, 2d ed.
Oxford. Blackwell Scientific Pub., 1962.33 T~ner, J. M.: fie ~e~m trend towards ezdier
physical maturation. T@%chr. Sot. Genees.k.44:524-539,1966.
34 TaMwr, J. M.: Earlier maturation in man. Sci. Am.218(1):21-27, Jan. 1968.
35 Tanner, J. M.; Trend towad em]icr menmche in
London, OS1O, Copenhagen, the Netherkmda and Hun-gary. Nature 243:95-96,1973.
36 Maresh, M. M.: A forty-five year investigation fOr
secular changes in physical maturation. Arm. J. Phys.Aqthro~o[. 36(1):103-109, Jan. 1972.
‘ 37Amundsen, D. W., and Dlers; C. J.: The age of
memu-che in classical Greece and Rome. Hum. BioL41(1):125-132, Feb. 1969.
~8Krogman, W. M.: Growth of head, face, trunk, andlimbs in Phdadelphia white and Negro children ofelementary and high school age. Monogr. Sot. Res. ChildDev. 35(3) Serial No. 136, 1970.
39vm wim~ga, J. C.: .$ecula[re Gmeivemchuining:
Lengte and Gewicht Surveys 1964-1966 in Netherlandsiti Historisch Perspectiefi Leiden. Nethcrkmds Institutevoor Preventive Geneeskunde TNO, 1972.
40 B0as, F.: Observations on growth of chifrken.Science 72:44-48, 1930.
41 Gruelich, W. W.: Some secular changes in thegrowth of “American born” and native Japanesechlkiren. Am. J. Phys. Anthropol. 45(3):553-568, 1976.
42-o, K., and Chung, C. S.: Do American born
‘Japanese children still grow faster than native Japanese?Am. j. I?hys. Anthropol. 43(2):187-194, Sept. 1975.
43 Ga~, & M.: Mapitude of .%x&wTrend in the FeLr
Population: Stature and Weight. Private printing. YeffowSpringe, Ohio, 1967.
44 Bakwfi, H., ~d McLa”gMin, S. D.: Sectdat increaseirr height. Is the end in sight? Lancet 2:1195-1196,1964.
45 Dtiel, c., and Wood, F.: Fitting Equationr to Data.
New York. Wiley-Interscience, 1971.
.LIST OF DETAILED TABLES
1. Observed percentilesof re.umtwnt length (in centimeters),by sex and age: Fels ResearchInstitute, birth-20 years ...................
2. Obserwd percentilesof weight (in kilograms),by sexand age: Fels ResearchInstitute, birth-20 yaars ......................................
@ Ohsewedpemntilesof matum (ince”timetem), bysexandage: Fekfls.sewch lnstitute,2-20yems ......................................
4. Observed percentilesof head circumfaranca [in centimeters),by sex and age: Fels Rmearch Institute, birth-7 years .................
5. Obsewed percentilesof weight (in kilograms), by sex and recumbent length (in centimeters); Fels ResearchInstitute, birth-48months .......................................................................................................................................................................................*
@ Obsarvedpemantilesof stature (in ce”timaters), by sexand,aga: National Cemerfor Health Statistics,2-24 years ...................
7.
8.
9.
10.
11.
12.
Observedpercentilesof waight (in kilograms), by sex and agti National Center for Haalth Statistics,2-24 years ......................
Observed percentilesof weight fin kilograms), by sexand stature (in centimeters): National Centar for Health Statistics,2-10years (femalas) or 2-11.5 yaars (males) .......................................................................................................................................
Smoothed percentilesof recumbent length (in centimeters), by sex and age: SWtistict from National Canter for Health Statis-tics and data from Fels Research Institute, birth-36 months .......................................................................................................
Smoothed percentilesof weight (in kilograms), by sex and age: Statisticsfrom National Centar for Health Statisticsand datafrom Fels ResearchInstituta, birth-36 months ............................................................................................................................
Smoothed percentiles of head circumference [in centimeters), by sex and age: Statistics from National Cemar for HaalthStatistim and data from Fels ResaarchInstitute, birth-36 months ...............................................................................................
Smoothed percentilesof waight (in kilograms), by sexand recumbent Iangth (in cmtimetars): Statisticsfrom National Centarfor Health Statisticsand data from Fels ResearchInstitute, birth-48 months ..............................................................................
@ SmOOthed Per=ntiles Of matu~ (in .e”timtierd, by sex and W: Data and fimisti~fromNtiio”al Ce”terforHealth Statis.
14.
15.
16.
17.
tics, 2 to 18 years.........................................................................................................................................................................
Smoothed percentilesof weight (in kilograms), by =X and age: Data and statisticsf rom Nzfional Center for Health Statistics,1.5 to 18 years ............................................................................................................................................................................
Smoothed percentilesof weight (in kilograms), by sex and stature [in centimeters): Data a“d statisticsfrom National Centerfor Health Statistics,prepubesesmtmalesand females .................................................................................................................
Cumulative frequency distributions of racumbent length-staturedifferences for children from 2.25 to 7.25 yearsof age, by sexand age Fats ResearchInstitute ................................................................................................................................................
Means, standard deviation, Pearsonstatistics,and Paarsonderived percentilesof stature for U.S. males 6 to 18 years of age:United States,1963-70 ...............................................................................................................................................................
20
22
24
26
27
2a
30
32
33
34
35
36
37
38
39
40
42
18

18. Selected observed percentiles of stature (in centimeters), by sex and age, for HES II (1963-65), HES III (1966-70),and HANES I (1971-74): United States...................................................................................................................................... a
19. Selectedobserved percentilesof weight {in kilograms), by sexand age, for HES II (1963-65), HES III (1966-70), and HAN ES I(1971 -74): United States ......................................................................................................................................................... 46
.,, .-..1. ,,
..< .. :,,,. .!.
19

---- ----Table 1. Obsewed percentiles of recumbent length (in centimete
Sex and age
Male—
5 years .................................................................... ...................
13%years ..... . .. ... . .. .. . ..... .. .. .. .... .. .. ... . ..... ..... . ..... . .. ... ..... ... ... . ...... ..
n
156274438425365374472425392364336319316302277266239
22724220615912714714313913514814014314214613813413112612213210712434
by sex anti age: kels HeSearch Institute, blrm-iw years
Observed percentile
5th I 10th \ 25th I 50th I 75th I 90th I 95th1 I I I i I
Recumbent length in centimeters
45.651.156.263.668.271.777.482.387.291.194.397.9
100.8I04.0107.1110.1[13.6116.2118.5121.2i24.5126.6129.2132.2[35.1137.3139.2141.7144.2146.4[49.0152.9154.7160.2163.0166. I167.2169.3I70.0I70.5169.4
47.151.757.464.469.372.978.583.588.492.295.399.0
102.3105.5106.9111.6115.2118.1120.9123.8126.6129.0131.5134.0136.2138.6140.9143.3145.9146.5152.9154.5158.1163.3166.2169.2171.0172.1172.3172.6172.3
48.653.358.266.170.774.580.385.690.384.197.8
101.2104.4[08.0111.3114.4117.8120.4123.7126.2129.4131.7134.6137.4140.1142.0145.2147.2150.7153.7157.6161.7165.5168.4170.8173.3I 74.4175.2175.8176.2177.2
49.954.861.267.672.476.282.387.792.396.5
100.5103.6107.4110.9114.2117.4120.6123.6126,7129.5132.6136.2137.7140.4142,8146.6148.7151,0154.5158.3162.5166.1170.0173.9176.4176.4180.0179.7180.6181.1162.0
51.556.263.269.474.277.784.389.884.798.8
103.3106.6110.1113.9117.6120.6124.3127.3130.7133.4136.6139.5141.4145.2147.6150.7153.5156.3160.1163.9167.4171.7175.2177.8180,2181.6184.0183.9784.2784.8185.0
53.357.664.871.175.880.186.592.287.1
101.4105.8109.0112.5116.7120.8123.4127.3130.0133.7136.4139.7142.8145.9147.8150.5154.2158.8161.7165.3170.4174.6176.5180.7183.1184.1,166.5187.2187.5188.3188.7189.3
54.258.465.872.176.867.488.293.588,1
102.9107.6111.21144118.9122.4125.8129.3132.1135.3139.1142.0147.2149.6151.3154.8157.3162.4166.2188,2173.0176.0181.5184<1186,1187.3187.7188.6188.6189,1191’7191.1
NOTE n = sample size.
20
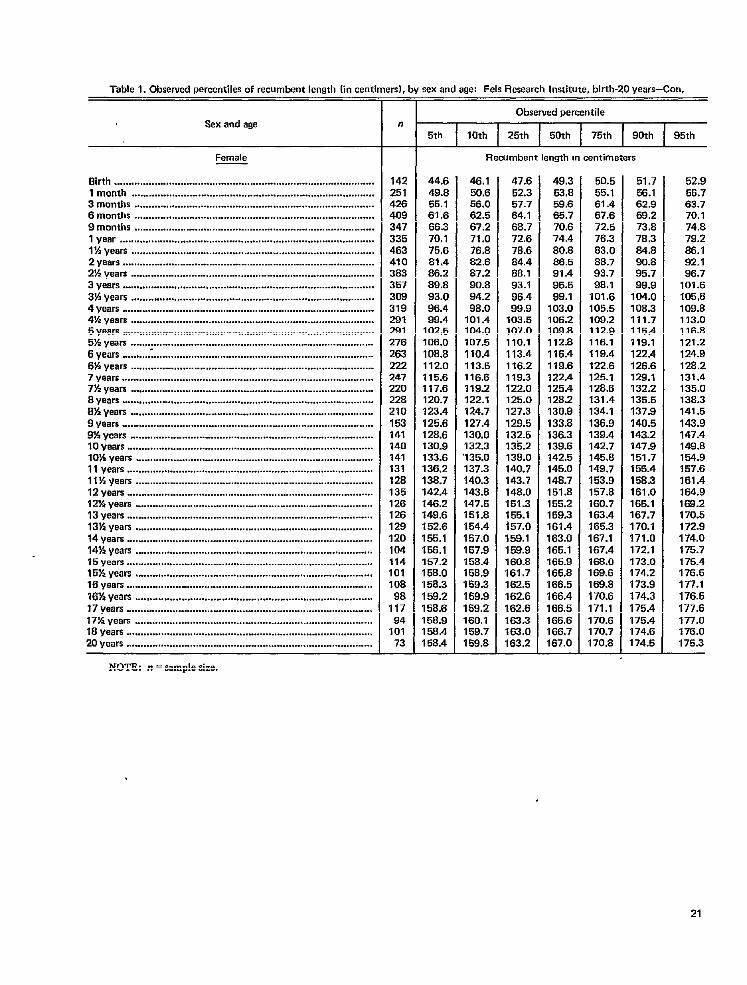
.-, –-, . ... . . . .,-----Table 1. Obsewed percentiles of recumbent length (in centimerd,
Sex and age
NOTE: n = sample size.
—
n
14225142640934733546341038335730931929129127626322224722022821015314114014113112813512612612912010411410110898
11794
10173
—
sex arm age: rem nesearcn Immure, umuwu years—~ on.
Observed percentile
6th I 10th 25thI
50th 75thI
90thI
95th
Recumbent length m centimeters
44.649.855.161.666.370.175.681.486.289.893.096.499.4
102.5106.0108.8112.0115.6117.6120.7123.4125.6128.6130.9133.6136.2138.7142.4[46.2148.6152.6I55.1156.1157.2158.0156.3159.2158.6158.9158.4158.4
46.150.656.062.567.271.076.882.687.290.894.298.o
101.4104.0107.6110.4113.5116.6119.2122.1124.7127.4130.0132.3135.0137.3140.3143.8147.6151.8164.4167.0I57.9158.4158.9159.3I59.9159.2160.1I59.7159.8
47.652.357.764.168.772.678.684.468.193.196.499.9
103.6107.0110.1113.4116.2119.3122.0125.0127.3129.5132.5135.2138.0140.7143.7148.0161.3!55.1i57.o159.1159.8160.8161.7162.5162.6162.6[63.3163.0163.2
49.353.859.665.770.674.480.886.591.495.599.1
103.0108.2109.8112.8116.4119.6122.4125.4128.2130.9133.8136.3138.6142.5145.0148.7151.8155.2159.3161.4163.0165.1165.9165.8166.5166.4166.5166.6166.7167.0
50.555.161.467.672.576.383.088.793.796.1
101.6105.5109.2112.9116.1119.4122.6125.1128.6131.4134.1136.9139.4142.7145.8149.7153.9157.8160.7163.4165.3167.1167.4168.0169.6169.8170.6171.1170.6I70.7170.8
51.756.162.969.273.876.384.890.895.799.9
104.0108.3111.7115.4119.1122.4126.6129.1132.2135.5137.9140.5143.2147.9151.7155.4158.3161.0165.1167.7170.1!71.0172.1173.0i74.2173.9174.3175.4176.4174.6I74.5.
52.956.763.770.174.879.286.192.196.7
101.6105,8109.8113.0116.8121.2124.9128.2131.4135.0138.3141.5143.9147.4148.6154.9167.6161.4164.9169.2170.5172.8174.0175.7175.4176.5177.1176.5177.6177.0176.0175.3
21
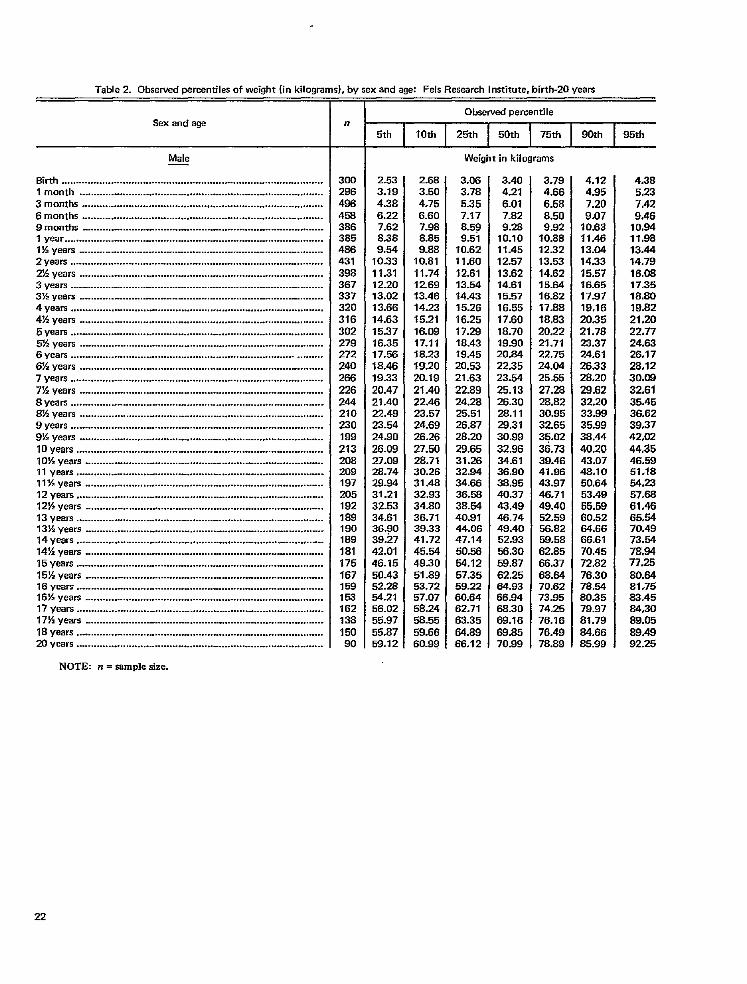
Table 2. Observedpercentiles of weight (in kilograms), by sex and age: Fels Research Institute, bhth-20 years
Sex and age n
—
30029649645838636548643139836733732031630227927224026622624421023019921320820919720519218919016918117516715915316213815090
Obsewed percentile
5th I 10th I 25th I 50th I 75th 90th I 95th
2.533.194.386.227.628.389.54
10.3311.3112.2013.0213.6614.6315.3716.3517.5618.4619.3320.4721.4022.4923.5424.9026.0927.0928.7429.9431.2132.5334.6136.9039.2742.0146.1550.4352.2854.2156.0255.9755.8759.12
2.683.504.756.607.988.859.68
10.6111.7412.6913.4614.2315.2116.0817.1118.2319.2020.1921.4022.4623.5724.6926.2627.5028.7130.2631 .4s32.9334.8036.7139.3341.7245.5449.3051.8953.7257.0758.245s.5559.6660.99
Weight in kilograms
3.063.785.357.178.599.51
10.6211.6012.6113.5414.4315.2616.2517.2818.4319.4520.5321.6322.8924.2625.5126.8728.2o29.6531.2632.9434.6636.5638.5440.9144.0647.1450.5654.1257.3559.2260.6462.7163.3564.8966.12
3.404.216.017.829.28
10.1011.4512.5713.6214.6115.5716.5517.6018.7019.9020.8422.3523.5425.1326.3028.1129.3130.9932.9634.6136.9036.9540.3743.4946.7449.4062.9356.3059.8762.2564.9366.9466.3o69.1668.8570.99
3.794.666.588.509.92
10.8812.3213,5314.6215.6416.8217.8818.8320.2221.7122.7524.o425.6527.2828.8230.9532.6535.0236.7339.4641.9643.9746.7149.4052.5956.8259.5862.8566.3768.6470.6273.9574.2576.1676.4978.89
4.124.957.209.07
10.6311.4613.0414.3315.5716.6517.9719,1620,3521.7823.3724.6126.3328.2o29.6232.2o33.9935.9936.4440.2043.0748.1050.6453.4955.5960.5264.6666.6170.4572.8276.3078.5480.3579.9781.7964.6685.99
4.385<237.429,46
10.9411.9813.4414.7916<0817.3518.8019.8221,2022.7724.6326.1726.1230.0932.6135.4536.6239,3742,0244.3646,5951.1854.2357,6861,4665,5470<4973.5478,9477.2580.6481.7583.45S4,3089,0589.4992.25
22

Table Z. observed percentiles of weight [jn ki10gIWn5
Sex and-age
NOTE: n = sample size.
]y se>
n
’2962814824383653504744123913573103222932812782642222472212312162182212152142011997-O?
I 85183164172152156141.747134151118125
77
Id age: Fels Research Institute, birth-20 years—Con.
Observed percentile
5th 10th 25th 50th 75th 90th 95th
2.223.084.115.817.107.72
8.019.72
I0.90I1.4712.1713.1913.9614.6115.4916.41I7.4018.3719.50!0.41!1 .40!2.44!3.s0!4.11!5.53!7.00!8.4210.1712.4113.4616.1019.14II .0213.1113.0513.4513.92W8813.9715.06[5.92
2.533.254.456.107.438.149.31
10.2311.2912.0812.7613.6914.4015.2616.2o17.1918.1119.2620.2521.2722.4423.4324.8925.7626.8828.4529.8331.8434.5036.2839.0741.1542.5944.1645.2245.2346.2046.3646.4046.8247.56
Wei!
2.893.624.866.617.898.81
10.0211.1412.1213.0113.70
14.6815.4216.4117.4218.5819.6520.6121.7222.9824.1525,4626.7926.3229.6131.2933.2635.9137.4940.7543.6245.2746.5948.5848.8748.9350.0750.5450.1251.0452.08
in kilo
3.253.975.417.208.549.57
10.7811.9712.9313.9514.9015.9916.8117.9018.9920.1221.4222.4923.7625.1626.6327.9529.8531.4233.8235.7138.4641.9143.3446.4548.8950.7451.2752.8553.5453.6554.4955.0554.9955.6456.49
3.604.305,937.809.26
10.2311.5212.7913.9115.1016.0117.3416.4119.5420.7722.2623.4924.8126.7426.0929.7731.8134.1736.5939.3742.3045.2148.1552.1154.0855.4456.5956.2058.3759.6258.0660.1260.4561.0861.3762.87
3.894.496.448.409.79
10.9112.2513.6614.8418.0117.0418.4619.6721.2422.4823.6925.5227.4429.1331.2733.7936.0539.0741.1644.8447.3151.6155.1857.3761.2462.7964.4065.4065.0565.9466.6465.9266.6367.7368.1669.15
3.984.816.788.74
10.1111.2912.7214.1315.4116.6717.71.19.3920.3921.9623.5125.4026.9728.9331.9433.3636.7939.5443.6445.4147.6449.9454.0259.4764.3764.6167.9469.7970.2071.6869.8470.8270.8271.8169.6172.3773.15
23

Table 3. Obsewed percentiles of stature (in centin
Sex and age
ters)=
n
—
2986
26228829329529727427123826822724421123019921320820919720519219119018918117516715915216313414992
y sex and age: Fels Research Insitute, 2-20 years
Observed percentile
6th Ioth 25th 50th 75th I 90th 95th
Stature in centimeters
81.285.189.792.598.399.4
102.9105.6109.1112.1115.1117.8120.4123.5126.1128.9131.3134.1136.1138.3140.6143.1145.4148.4151.71!S3.6159.5162.5164.9166.7168.o169.1168.3168.5
81.985.890.794.097.6
101.2104.1107.4110.7114.0116.6119.6122.5125.2127.9130.5133.1135.4737.7139.9141.8145.0147.5160.9153.7157.0162.1165.2167.6169.0169.6170.3170.3170.1
84.2S8.893.196.399.7
103.3106.7709.8113.2116.3119.4122.5125.2128.3131.2134.0136.5139,1141,8144.2146.3149.3152.7156.3160.0163.7167.1169.3171.3172.5173.2I73.9I74.4175.2
85.691.485.499.1
102.3105.7108.3712.7116.1119.3122.4125.9128.3131.6134.3137.3139.8142.3144.9147.5150.3I53.4I57.0160.5164.7168.6171.7I74.5176.3f77.4177.6176.6179.0180.1
87.893.397.5
101.7105.1108.7112.6116.1119.6122.7125.8129.3132.4135.1138.2140.8143.7146.6149.0151.8154.6158.2161.7165.9170.1173.6175.8178.2179.4180.9181.6182.2162.4183.4
92.o96.3
100.3104.4107.7111,5115.2118.8123.1125.8128.7132.7135.6138.4141.7144.3147.2149.7152.5155.4158.4162.9!68.8172.4176.0178.4181.5161.7183.6I64.9185.6186.2186<7166.8
92.797.6
101.9106.2109.6113.6117.6121A124.8127.8131,1134.7138.2141.2144.5146.6149.7152.8156.0159.1162.6166.7171.3175.5178.8181.9164.1165,2185.5187.2187.4188.1186.3189,6
24

Table 3. Obsewed percentiles of stature [in centimeters), by sex and age: FeIs Research Institute. 2-20 years–Con.
Sex and age n
26107248255289277286270265222248221232216219221216214201199202186184185173152159142147134155119126
79—
Observed percenti Ie
5th I 1Oth I 25th I 50th I 75th I 90th I 95th
81.684.689.092.495.198.1
101.4104.7107.7110.7114.0116.6119.3122.2125.1127.7129.4131.8134.7737.4140.6143.5146.7149.6152.6153.7154.9156.2156.3157.1156.2156.7157.1156.6
82.585.690.293.596.699.5
103.3106.3109.2112.3115.4118.1121.0123.5126.4129.2131.3133.7136.2139.2142.4145.5149.1152.2154.4156.1I56.9157.4157.5158.1157.4I57.9158.3157.9
Stature in centimeters
85.288.292.295.598.1
102.1106.7109.1112.2115.2117.9120.9123.6126.4129.3131.8134.5137.1140.2143.3147.1149.8153.6155.6157.3158.2159.1159.7160.4160.6160.5160.9160.6161,4
87.290.494.598.0
101.8105.1108.5111.5115.1118.2121.3124.4127.1130.0132.6135.8138.5141.1144.1147.5151.1154.4157.4159.4161.2162.1163.0163.5164.0164.3164.3164.3166.4165.4
89.292.496.8
100.4104.3107.6111.6114.6118.3121.2124.3127.2130.2133.3136.0138.8142.1145.3148.8153.0156.3159.1161.5183.3164.4165.3166.5167.2167.5168.2168.3168.4168.2168.5
88.894.699.2
102.9106.7110.4114.3117.5120.8125.1127.7131.3134.4137.1140.6144.1147,3151.8154.9159.5162.6164.2165.8167.8168.6156.9171.0170.8170.8171.5!72.7172.5171.7172.0
90.695.8
100.2104.5108.4112.0115.9119.6123.8127.4130.4133.6137.3140.8143.6145.6150.3154.0157.9162.0164.4167.6169.8170.8171.4172.4173.Q173.9173.7174.1175.1175.0172.9175.0
25
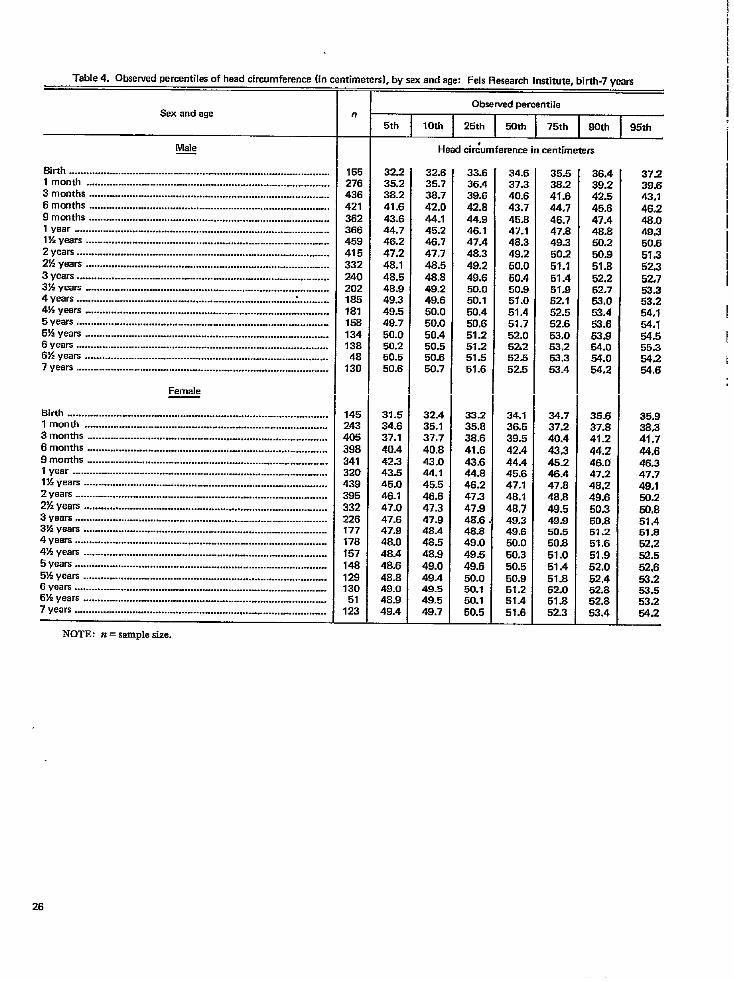
Table 4. Observed percentiles of head circumference (in centimeters), by sex and age: Fels Research Institute, birth-7 years
Sex and age
Male—
.
n
1552764364213623664594153322402021851s115s13413848
130
14524340539834132043939533222617717815714812913051
123
Observed psxcentile
5th 10th 25th 50th 75th 90th 95th
32:35:38:41.(43.(44.:46.:47:48.”48.!46.s49.:49.:49.;50.C50.:50.550.6
31.534.637.140.442.343.545.046.147.047.647.948.048.448.648.849.048.949.4—
Head cir.%mference in centimeters
32.635.738.742.044.145.246.747.748.648.849.249.650.050.050.450.550.650.7
32.435.137.740.843.044.145.546.647.347.948.448.548.949.049A49.549.549.7
33.636.439.642.844.946.147.448.349.249.650.050.150.450.651.251.251.551.6
33.236.838.641.643.644.846.247.347.94S.648.849.049.549.650.050.150.150.5
34.637.340.643.745.847.148.349.250.050.450.951.051.451.752.05Z252.552.5
34.136.539.542,444.445.647.148.148.749.349.650.050.350.550.951.251.451.6
35.538.247.644.746.747.849.360.251.151.451.962.152.552.653.063.253.353.4
34.737.240.443.345.246.447.848.649.549.950.550.851.051.451.852.051.852.3
36.439.242.545.647.448.850.250.951.852.252.753.053.453.653.964.0
!%
35.637.841.244.246.047.248.249.650.350,851.261.651.952.052.452.852.853.4
37.239.643.146.248.049.350<651.352.352.7
5?254,1
2::65.3
%
35.938.341.744.646.347.749,150.250.851.451.852,262.552,653.2!33.553.254.2
NOTE: n = sample size.
26

.Table 5. Observed vercentdes of wsiaht fin !410wamsl. bv sex and recumbent Ienul
Sex and recumbem length
——
n
597492
12s96
11312s12012316615616918’71921721401531721531651691S617417S177168154121
667996
122104123139132147151163160175157129136147142155164163162194176162160130
.—
in centimeters: Fek Research 1.SOtute, hi rth-lH monms
Observed percentile
5th 10th 25th 5oth 75th 90th 96th
.
.
.S.603.754.245.025.336.0s6.587.048.018.07S.349.099.319.75
10.0710.3611.0011.1811.5912.0912.431S.0913.3113.9514.22
.
.
.
3.544.024.105.015.156.o26.257.o27.427.738.176.739.049.209.s49.97
10.4110.7611.2011.5412.0712.3713.0714.02
.—
.●
●
3.714.064.455.145.736.206.657.178.108.268.?29.259.53
10.0710.2510.7211.1611.4112.0612.S612.98I3.3913.6014.3214.56
.
.
.
3.624.094.315.095.346.136.547.147.61S.lo6.399.099.209.46
10.1110.2910.9511.1511.6012.0412.44I3.03[3.3714.24
.
2,873,243.374,034,305,035.476.186.677,237.54S,388.349.239.73
10.1110.4510,7811.2911.6312.07‘12.5113.0913.3914.1214.4715.1215.48
3.023.243.623.664.324.925.335.666.487.737.516.108.569.039.469.67
10.1410.5411.0611.3711.7412.2212.5413.1613.5914.1214.90
.
3.203.533.784.374.705.456.036,557.147.666.168.859.419.72
10.3610.6611.1111.4911,9312.3412.7213,2313.7214.0714.7415.2715,7316.42
3.303,523,954,284.705.355,726,377.057,568.136.599.219.64
!0.0710.34I0.7411.21I 1.5312.0212.3812.7613.2913.7214.3714.8215.56
“
3.543.824.334.715.245.876.5S6.937.618.278.729.479.8910.4210.8911.3211.8712.23[2.8012.9713.4813.87
17.15
3.583.814.434.665.195,736.276.807.5s8,038.679.189.6710.1310.6010,9111.4211.7912.0312,6612,8913.5113.9214.4516.0415.656.S7
.
.●
4.925.736.516.917.567.896.769.249.87
10.53109711.5911.8112.5512.8213.5413.8513.9714.5614.8615.5316.0216.6917.4017.87
.
.
.
4.895.695.966.787.197.898.669.049.729.95
10.7810.91116111.8612.4612.6713.2913.59141214.6314.9616.7516,4416.99
.
.
.
.4.965.s96.S47.117.627.898.949.67
10.0410.8011.5611.871f .9712.6013.1613.S213.8714.5014.s415.1415.8116.6016,9817.6018.23
.“.
4.965.666.426.947.468.o36.669.559.90
10.4311.0111.1911.8812.0612.6712.891S.721S.S614.6514.8915.4815.9916.8617.54
NOTE n = WI@. size.
27
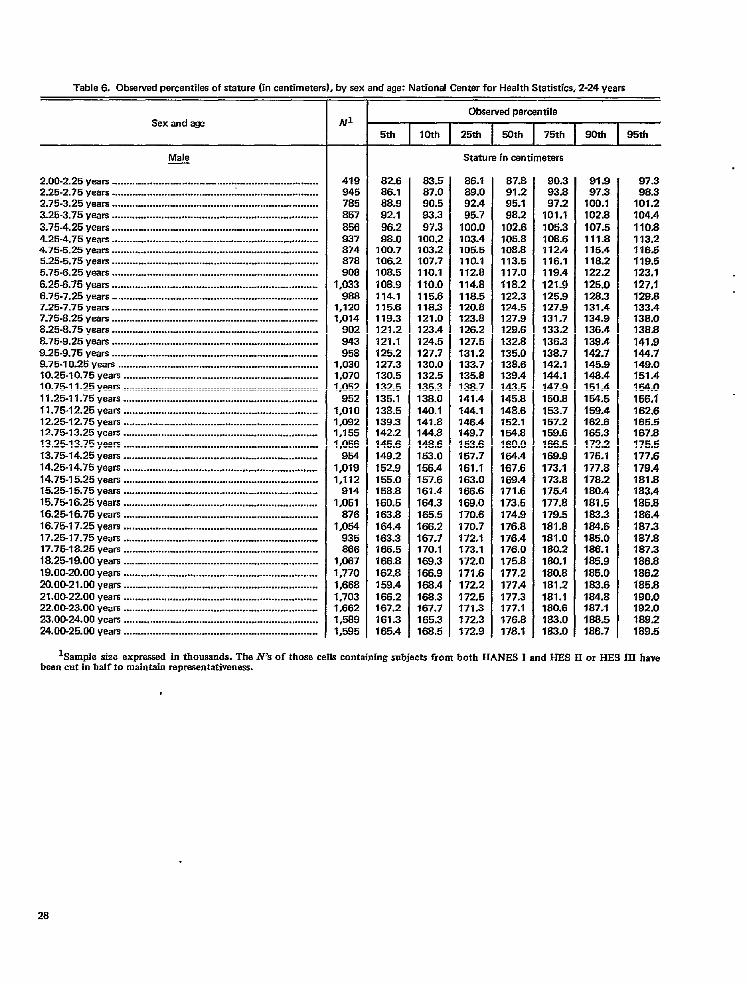
Table 6. Obsetved percentiles of stature (in centimeter
Sex and age
Male—
2.00-2.25 yearn ................................ .... ...................................2.25-2.75 years ..........................................l............................2.75-3.25 years ...... ..... ......... ................ ......... ..... ......... ..3.25-3.75 years .......................................................................3.75-4.25 years .......................................................................4.25-4.75 years ........................................................... ............4.75-5.25 years .......................................................................5.25-5.75 years .......................................................................5.75-6.25 years .......................................................... .............6.25-6.75 years .......................................................................6.75-7.25 years .. .....................................................................7.25-7.75 years .......................................................................7.75-6.25 years .......................................................................S.25-8.75 years ............. ..........................................................S.75-9.25 yeafs .......................................................................9.25-9.75 years .......................................................................9.75-10.25 years .....................................................................10.25-10.75 years ...................................................................10.7S1 1.25 yWS ...................................................................11.25-11.75 years ...................................................................11.75-12.25 years ...................................................................12.25-12.75 years ...................................................................12.7.513.25 years ...................................................................13.25-13.75 years ...................................................................13.75-14.25 years ...................................................................14.25-14.75 yeafs ...................................................................14.75-15.25 y,al’5 ...................................................................15.25-15.75 years ...................................................................15.75-16.25 years ...................................................................16.2.516.75 years ...................................................................16.75-17.25 years ...................................................................17.25-17.75 years ...................................................................17.75-18.25 years ...................................................................18.25-19.00 years ...................................................................19.00-20.00 yeafs ...................................................................20.00-21.00 years ...................................................................21.00-22.00 years ...................................................................22.00-23.00 years ...................................................................23.00-24.00 years ...................................................................24.00-25.00 years ...................................................................
by sex.
#fJ1
419945785857856837874878908
1,033988
1,1201,014
902943958
1,0301,0701,052
9521,0101,0921,1551,056
9541,0191,112
9141,051
8761,054
935866
1,0671,7701,6681,7031,6621,5891,595
)d age: National Center for Health Statistics, 2-24 years
Observed percentile
5th 10th 25th 50th 75th 90thI
95th
82.686.188.992.196.298.o
100.7106.2108.5108.9114.1115.6119.3121.2121.1125.2127.3130.5132.5135.1138.5139.3142.2145.6149.2152.9155.0158.8160.5163.8164.4163.3166.5166.8162.8159.4166.2167.2161.3165.4
63.587.090.593.397.3
100.2103.2107.7110.1110.0115.6118.3121.0123.4124.5127.7130.0132.5135.3138.0140.1141.8144.8148.6153.0156.4157.6161.4164.3165.5166.2167.7170.1169.3166.9168.4168.3167.7165.3168.5
Statu1
86.189.o92.495.7
100.0103.4105.5110.1112.8114.8118.5120.8123.8126.2127.5131.2133.7135.8138.7141.4144.1146.4149.7153.6167.7161.1163.0166.6169.0170.6170.7172,1173.1172.0171,6172.2172.5171.3172.3172.9
67.691.295.196.2
102.6105.8108.81‘73.5117.0‘118.2122.312’4.5127.9129.6132.8‘735.0138.6139.4143.5145.8148.6152.1154.8160.0164.4167.6169.4171.6173.5174.9176.8176.4176.0175.8177.2177.4177.3177.1176.8178.1
90.393.897.2
101.1105.3108.6112.4116.1119.4121.9125.9127.9131.7133.2136.3138.7142.1144.1147.9160.8153.7157.2159.6166.5189.9173.1173.8176.4177.8179.5181.8181.0160.2180.1180.8181.2181.1t 80.6183.0163.0
91.997.3
100,1102.8107.5111.8115.4118.2122.2125.0128.3131.4134.9136.4139.4142.7145.9148.4151.4154.6159.4162.6165.3172.2175.1177.8176.2180.4181.5183.3164.6165.0186.1165.9185.0163.6164.8187,1168.51S6.7
97.396.3
101.2104.4110.8113<2116.6119,5123.1127.1129.8133.4138.0136,8141.9144.7149.0151.4154.0156.1162.6165.5167.8176.5177.6179.4181.6163.4165.8166.4187.3187.8167.3186.6166,2165,8190.0192.0169.2189.6
%ample size expressed in thousands. The N’s of those cells containing subjects from both HANES I and HES H or HES 111 havebeen cut in half to maintafn representativeness.
28

Table 6. Observed percentiles of stature (in centimeters),
Sex and age
Female
2.00-2.25 years .......................................................................2.25-2.75 years .......................................................................2.75-3.25 years .......................................................................3.25-3.75 Vears .......................................................................3.75-4.26 years .......................................................................4.25-4.75 years .......................................................................4.75.5.25 years .......................................................................5.25-5.75 years .......................................................................5.75-&25 years .......................................................................&25.6.75 years .......................................................................6.?5-7.25 years .......................................................................7.25-7.75 years .......................................................................7.75-6.25 years .......................................................................8.25-6.75 years ............................................ ...........................8.75-9.25 years .......................................................................9.25-9.75 years .......................................................................9.75-10.25 years .....................................................................10.25-10.75 yearn ...................................................................10.75-11.25 years ...................................................................11.25-11.75 years ...................................................................11.75-12.25 years ...................................................................12.25-12.75 ye8K ...................................................................12.75-13.25 years ...................................................................13.25-13.75 years ...................................................................13.75-14,25 years ...................................................................14.25-14.75 yearn ...................................................................14,75-15.25 years .......................................................... .........15.25-15.75 yearn ...................................................................16.75-16.25 years ...................................................................16.26-16.75 years ...................................................................16.75-17.25 years ...................................................................17.25-17.75 years ...................................................................17.75-18.26 years ........ ...........................................................18,25-18.00 year’s...................................................................19,00-20.00 years ...................................................................20.00-21.00 years ...................................................................21.00-22.00 years ...................................................................22.00-23.00 years ...................................................................23.OC-24.00 years ...................................................................24.00.25.00 years ...................................................................
;ex an.
Ap
4409726228S7775S48876890866
1,025945952
i,004968988885
1,092I,086
870S62
1,0821,0191.0581,1201,080
9511,012980959836
I,108810826
1,420I,3s41,7711,818I,7341,6001,796
ae: National Center for Health Statistics. 2-24 years-Con.
Obsewed percentile
5th 10th 25th 50th 75th 90th 95th
8tature in centimeters
81.3S4.280.291.894.696.899.1
103.8107.1109.3ill.7115.8117.8118.9I22.2126.6129.0129.4132.1I34.5139.4141.7I43.7149.4149.8I50.3151.5152.6152.5I50.7151.8I50.7152.2I54.9I55.0152.3152.0I50.4154.2[52.3
82.585.390.792.896.297.6
101.1106.1109.0111.6113.2117.2119.5121.4124.8127.6130.3131.1134.8135.8142.2145.9147.7151.6151.6153.2153.3154.8f 54.6153.3154.6154.3155.5157.6155.9155.1154.6153.0156.0155.4
84.687.192.795.097.9
f00.5105.2108.4111.9114.3117.4120.0122.6124.4!28.4131.1134.4[35.2139.5141.7146.7[50.8163.0I55.4155.7I57.4157.2I57.9156.2I57.5158.0156.0159.8161.2I59.9I59.0158.5156.9158.6158.3
66.890.395.397.4
100.5103.8108.1111.8115.4117.7120.8123.7127.5129.2132.7135.1138.5140.6143.9147.3151.8154.8157.5159.6160.0161.8161.2162.9163.6162.1161.8162.6163.9165,3163.0163.2152.5162.8163.1162.3
89.993.496.799.8
103.8106.2111.6115.5118.6121.7124.3127.9130.6133.4137.7139.8143.0144.7148.8152.6156.4159.7161.4163.8163.4165.4166.3167.6167.7168.5166.5166.6168.0167.2166.8168.8167.0167.2166.8167.4
93.694.899.1
102.1106.0109.4113.7118.7122.1125.2126.8131.7132.9135.8141.0144.4147.0149.6153.7157.1161.4154.0165.5165.9167.1169.5171.2172.1f 70.7171.5171.6170.0171.0172.4170.6172.4170.8171.2170.5170.4
94.696.4
100.6103.6108.2112.0114.7121.3124.6126.9128.6134.2134.6138.0142.3147.6149.8152.4157.0158.8165.9165.7167.4169.2168.7171.1174.9176.2172.3172.6173.8172.5171.8174.2173.1175.3173.0174.5172.6171.6
lSample size expressed in thousands. The IV’s of those ceOscontaining subjects from both HANES Iand HES H m HfIS HI havebeen cut in half to mai”tah representativeness.
28

Table 7. Observed percentiles of weight (in kilograms
Sex and age
Male—
2.00-2.25 years .......................................................................2.25-2.75 years .......................................................................2.75-3.25 years .......................................................................3.25-3.75 years .................................. .....................................3.75425 years .......................................................................4.25-4.75 years ............ ...........................................................4.75-5.25 years .......................................................................5.25-5.75 years .................................................. ................ .....5.75-6.25 years .......................................................................6.25+.75 years .......................................................................6.75-7.25 years ............................. ..........................................7.25-7.75 years .......................................................................7.75-8.25 years .......................................................................8.25-8.75 years .......................................................................8.75-9.25 years ..... ........ .................. ..... .......... ... ........... ....9.25-9.75 years .......................................................................9.75-10.25 years .....................................................................10.25-10.75 years ...................................................................10.75-11.25 years ...................................................................11.2%1 1.75 years ......... ..........................................................11.75-12.25 years ...................................................................12.25-12.75 years ...................................................................12.75-13.25 years ...................................................................13.2%1 3.75 years . ... ..... ..... .. . ... .......... .............. .... ....13.75-14.25 years ...................................................................14.2S14.75 years ...................................................................14.75-15.25 years ...................................................................15.25-15.75 years ...................................................................15.75-16.25 yearn ...................................................................16.25-16.75 years ...................................................................16.75-17.25 years ...................................................................17.25-17.75 years ..................................................... ..............17.75-18.25 years ...................................................................18.25-19.00 years ...................................................................19.00-20.00 years ...................................................................20.00-21.00 years ...................................................................21.00-22.00 years ...................................................................22.00-23.00 years ...................................................................23.00-24.00 yKW5 ................................................ ...................24.00-25.00 years ...................................................................
Y sex
N1
419945785657856937874878908
1,033992
1,1201,014
902943958
1,0301,0701,052
9521,0101,0921,1551,056
9541,0191,112
9141,051
6761,054
935866
1,0671,7701,6681,7031,6621,5891,595
~age: National Center for Health Statisticsr 2-24 years
Observed percentile
5th 10th 25th 50th 75th 90th 95th
Weight in kilograms
9.9711.3112.2812.7013.63‘14.4214.9917.0116.6717.2118.5918.7620.2021.7122.0123.1124.4026.0927.9828.1730.1031.7232.1736.2438.2540.5242.1446.2646.8350.4652.1561.8054.7654.9655.4055.8652.6655.0258.1660.67
11.1011.8912.8413.3414.7015.0915.5217.3117.8017.8219.3920.0721.4722.6322.9824.3025.6327.7328.7930.1431.1832.8634.6137.8041.4743.6444.9349.1251.2953.2255.4255.5358,1860.3557.3857.7158.1759.14
63.96
11.6312.6313.5614.3315.4616.0216.9118.3319.5318.7021.3722.0423.4724.3525.1326.4027.9829.4831.2334.0734.2136.1838.4342.9246.8849.7050.3554.2955.7956.7760.6560.8162.0463.6265.8165.0465.2965.0965.5467.86
12.6713.5314.4315.3916.6417.7118.4719.8821.2121.5922.9324.3325.6526.3127.8929.6531.8332.5735.8637.4838.7541.9643.6249.2351.6555.3256.3558.9261.7464.7165.9066.6468.9668.8870.6871.6872.1271.7774.7179.37
14.0514.5715.3416.4617.8519.1720.2221.3922.8523.4125.2226.4828.7029.2731.7533.6336.0936.3939.6841.8446.4347.3050.1758.3860.7762.6263.6366.6869.3372.2873.7675.3675.4978.6776.4376.4480.9679.6682.4485.69
14.8516.6916.3917.7718.8720.4521,0223,2124.9626.2128.7429,0831.3633.0836.6238.5841.0840.7544.7147.1655.2454.0559.2263.4467.0472.697%.2775.4076.7881.6281.7283.3588.3692.6687.0166.8689,0490.5794.0597.60
15.4716.8017,3718.6320.6221.5122.5926.3226.4026,1830,7232.3135,1534.9640.2345.6743.6945.6651.8352.4562/4358.4564,2968.3976.6177.0376.9181,8186.o787,5791.2392.1684.7199,6096.4694.6496.~398.93
105.35103.19
lSamvle size expressed in thousands. The N’s of those cells containing subjects from both HANE8 1 and HES H or HES 111havebeen cut i_nhalf to maintain representativeness.
30

Table 7. Observed permntiles of weight (in kilogmms), b!
Sex and age
Female
2.00-2.25 yearn .. ..... ..... . .... ..... . . .... ..... . ..... ..... .. .. .. .... . . .. .. .... .. .....2.25-2.75 years .. .. ... ... .. .. .. .. .. ... . .. .. ..... . .... . ..... ..... ... .. . ..... . ... .. .....2.75-3.25 years ...... ..... ..... ..... . ..... ..... ... ... ..... ... .. .. .... .... .. .. .. . ..... .3.25-3.75 years .... .. .. ... . .... .. ... . .. .. ...... .. .... .. ... . ...... .. .. .. ... . .. .. .. .. .. .3.75.4.25 years ..... ..... . ... ...... . ..... ..... ... ... .. ... .. .... ..... ..... .. .... .... ...4.25-4.75 years .. .. .. .. .. .. ... . .. .. . ... .. .. .. .. .... .... .. .. .... ..... ... ... ..... .. .... .4.75-5.25 years ..... .... ... ... .. .. .. ... ... ..... ... .... .... .. ... ... ... ..... ..... . ..... .5.25-5.75 years ..... ... .. .. ... ..... .. .... ..... . .. .. . ... .. .. .... .. ... ... .. .. .... ..... . .5.75-6.25 years ... ..... .... ... ..... ... ... .. ... .. .... ..... .. .... ..... ..... .. .... . ... ...6.25-6.75 years .... ..... . .... .. .. .. .... ..... ... .... . ... .. ..... ..... .. .. .. ..... . .. .. . ..6.75-7.2’5 years ... .. .. .. .. .... .. ... ... .. .. .. .. .. .. .. .... . ... .. .... .. .. .. . ... .. .. .. .. ..7.25-7’ .75 years ..... ..... ..... ..... ... ... ..... ... .. . ..... .. .... ..... .. ... ... .. . ..... ..7.75-6.25 years ... .. .. .. .. .. .. .. .. .. .. .. .... .. .. .. .. .... .. .... .. .. .... ... ... .. .. .. .. ..6.25.6.75 years .. .... .. .. .. .. .... .. .. .. .. .. .... .. .. .. .. .. .. .. .. .... .. .. .. .. .. .. .. .. . ..8.75-9.25 years .. .. ... .. .. ... ..... ..... . .... . ..... . ..... ..... . ... .. .. ... . .... .. .... ...9.25-9.75 years ... . ..... .... ... ... . ..... ..... .. .. .. ..... ... ... ..... ..... . .. .. . ... .. .. .9.75-10.25 years .. ..... .... ..... .. ..... . .... . ..... . ... .. ..... ..... .. .. .. ..... .... .. ..10.25-10.75 years .... . .... .. ... . ..... . ..... ..... . .... . ..... .... .... ... ..... .. .... ...10.75-11.25 years .... .... .. .... ... ... .... .. ..... . ..... .... .. .. .. . ..... ..... .. .... ...11.25-11.75 years . .. .. .. .. .... . ... .. .. .. .. .... .... .. . ... .. .. ... . .. ... . .... .. .. .. .. ..11.75-12.25 years .... .... . ..... ..... . ..... ..... . ..... ... .. . ..... ..... ... .. .. .... .. ..12.25-12.75 years .... ..... . .... .... .. . ... .. ..... .. ... . ..... ..... .. .... ..... .. .... ...12.75-13.25 years ... ..... ... .. . ... .. .. .. .. .... . . .. .. . ..... .. ... ... .... .... .... .. ....13.25-13.75 years .... .... ..... . .. ... ..... .. ... . .... .. ..... . .... . .... . ..... ... .. . ....13.75-14.25 years .. ..... . .... .. .. .. ... .. . ..... ... ... ..... . .. .. . ..... ... .. ... ... ... ..14.25-14.75 years ..... ... ..... . .. ... ..... .... .. ..... ... .. . ..... .. .. .. ..... . .. .. . ....14,75-15.25 years .... .. .. .. .. .. .... . . .. .. .. .... .. .. .. .. ... . .... .. ... . .. ... . .. .. . ....15.25-15.75 years . .. .. .. .. ... .... ... .. .. .. .. .. .... ... ... .. .. .. .. .. .. .. ... ... .. . .....15.75-16.25 years .. ... .... .... ..... . ..... ..... . ..... .. .. .. ..... . .. .. .. .... .. ... . ....16.25-16.75 years . .. .. .. .. .. .. .. ... ... .. .. .. .. .. .... ..... . .. ...ti ... .. .. .. .. ... ... ..16.75-17.25 years .. .. ... ... .. .. .... .. ... . ..... .. .. .. ..... . ..... ..... .. .. .. ..... ... ..17.2517.75 years .. .. .. .. .. .... .. .. .. .. .. .. .. .. .. .. .. .. .. .. ... .. ..... .. .. .. .. ... ....17.75-18.25 years .. ... .. . ..... ..... . ..... ..... . ..... . .. ... ..... .. ... . .... . ... ... ... .18.25-19.00 years .... .. .... .. ... . .. .. . ... .. .... .. .. .. .. .... ..... . .. .. . ..... .... .. .. .19.00-20.00 years ... . . .... .. .. ... ... . . .... .. ... . ..... . .. .. .. .... ..... . .. .. .. .. .. ....20.00-21.00 years .... .. .. .... .. .. .... .. .. .. .. .. .. .. .. .. .. .. ..... . .. .. . ... .. .. .. .. .. .21.00-22.00 years ... .. .... .. .. .. .. .. .. .. ... . .. .. . . .... .. .. .. .. .. .. .. .. .. .. .. .. .... ..
22.00-23.00 years ... . .. .. .. .... .. .. .. ..... ..... .. .... .... .. .... . ... .. .... .. .. .. . ....23.00-24.00 years . .. .. .. .. .. .. .. .... .. ...... .... .. .. .. .. ... . .... ..... . .. .. . ..... .. ..24.00-25.00 years ... . .... . ..... .... .. ..... ... .. .. .... .. .. .. .. .. .. .. .. ..... ... .. . ....
iex anc.
N1
440972622687775646
876890866
1,025945952
1,004968966865
1,0921,086
870862
1,0821,019
1,0581,1201,080
9511,012
980959836
1,108810826
1,4201,3641,7711,8161,7341,6001.796
m! National Center for Health Statistics, 2-24 years-Con,
Observed percent! Ie
5th 10th 25th 50th 75th 90th 95th
Weight in kilograms
10.06
10.7712.1412.2913.1313.45
14.3315.1815.9917.0217.86
18.8420.1120.4722.2023.2924.3425.2826.7327.4429.7232.59
34.2137.7237.7440.7741.14
42.9943.6443.8643.6742.9045.0544.8346.6544.4046.0842.8645.5946.65
10.66
11.2012.4013.0313.6314.05
15.2116.2017.0917.7118.74
19.6020.7921.5023.1724.7225.2526.6928.3229.4532.7434.97
37.1739.4539.6642.9643.65
46.1145.7445.6946.5745.3647.8945.8948.8347.2348.5446.1847.7746.13
11.41
11.9813.1213.5814.5115.04
16.4817.4716.2119.2420.20
21.3322.4923.3025.2728.9228.0329.4232.0932.6636.4239.46
41.4445.0044.6647.2147.4648.9849.2249.4650.7650.5652.6851.0351.6251.7052.1551.3552.1652.06
12.21
12.7613.9314.6015.6816.57
17.7318.9220.1921.0622.13
23.7224.6926.3926.79
30.2831.6833.0036.1337.9741.7045.37
47,0850.3050.2253.0353.2955.2554.9254.9756.4955.2357.6856.9757.2457.2258.3658.8259.6756.86
12.66
13.9415.6115.9317.1517.76
19.6620.9622.3923.5523.9828.5427,7329.6933.4034.5436.3837.6342.2744.3648.7851.40
54.7956.8156.4460.9559.72
60.8061.5862.6462.2281.5962.3263.1663.4863.9464.6467.3864.6466.33
13.64
14.7416.8417.5418.2219.3521.2323.4424.8626.1726.91
29.8132.6333.6539.8639.8743.1645.9047.7250.7757.7756.10
62.2067.0566.4468.8871.5771.45
67.7072.3772.4570.6269.6272.6276.3372.1572.8875.5472.8077.17
14.5715.0917.7416.2818.9420.2622.1025.0126.7127.8929.5831.5535.2036.4542.6943.6245.9248.3754.4958.0964.7963.21
66.6175.7874.7076.4375.3677.7878.0383.1084.1984.8275.8678.7063.4875.6981.7685.3584.6266.04
lSample size expressed in thousands. The N% of those cells containing subjects from both H.4NE8 I and HES 11 or HES 111havebeen cut in half to maintain representativeness.
31

Table 8. Obfewed percentiles of weight 2in kilograms), by stature (in centimeter2.11.5 years (
I
and sex: National Center for Health Statistics, 2.10.0 yews (femaled or
330451451555359557414561553702641706912
1,0131.2341,1641,430
6471,5651,2771,5241,4431,5541,2811,1641,3561,043
709
33242956666S5224214255245223233651793909
1,0s91,1621.2771,2461,3191.2191.3271,1021,038
86966?. .. .. .. .
Observedpercentile
5th I 10tb 25th 50th 75thI
90thI
95th
12.0212.0612.3112.3113.7013.9214.3114.4515.5116.2016.1516.841s.041S.3618.4319.4920.4221.5022.3022.8423.9624.4524.6526.4726.112S.6528.s230.45
17.7312.0412,0613.0812.4914.0314.1414,3s14.6114.5516.0916.2S17.3518.091s,3919.4319.9620.4721.5322.5223.6624.4725.2526.05
. . .
. . .
. . .
. . .
12.2212.2212.6613.0614.0514.2014.6414.91
16.4316,5017.7818.3216.6019.0120.2321.1222.1922.9223.9124.3525.3325.4627.2126.4829.4631.1031.47
12.02712.1912.2.013.2212.9914.2614.3814.9515.7315.4016.3616.9218,131s,3718.s620,1620.3921.4122.2523.2E24.3c25.3C26.3C26.7E
. .
. .
.
Weight i“ kilt
12.8112.7113.6814.2814.5014.6215.6316.1416.5617.1017.5718.6619.1620.06,20.2921.3122.4222.9524.3124.7925.4126.7427.4528.6829.5931.1932.8234.24
12.4612.6612.9713.6614.2014.9515.0916.1916.4716.4217.1618.3018.6119.2320.1521.0921.5922,6923.2824.6225.3926.6728.1828.47
. . .
.,.
. . .
. . . . .
ms
14.9014.6115.4615.s0I6.1O17.1217.5118.30[8.98[9.7719.9121.2721.3922.0122.s124.4025.1926.1527.3123.3229.3531.3332.1833.4033.6536.8138.8o40.69
13.7014.5116.2615.4916.3317.3617.6217.8118.4618.5519.5120.8921.3421.9323.1823.9024.6125,7227.422S.7329.7332A733.0334.32
. . ..,,. . ..,.
15.5615.5116.9417.1216.o417.6816.1919.3319.7622,1321,5022.6321.9823.4123.7625,7626.7S27.0029.9131.3131,1734.7637.2236.5337.2540.9642.3744.5~
14.7115.5115.8416.3577.571 S.791 S.9219.0s19.5f19.7820.6422.0422,7023.6525,0225.6526,6S27.7429.6131.2133.4535.4336,1737.65
,..,.,,...,,
15.7915,s116.6117.7719,s618,9619.3019.6720.5323,1622.3723.8523,2223.8824.6426.8527.9530.1431.0534.3331<9635.6239.8337.7339.624S,3244.3948,8S
15.8415.6616.4917,2~17,9922/1619.5019.6619.s620.8721.4523.1423.7925.0725,9027.3626,6729.7231,1933.0435.21
39:2042,36
,..,,,,,,.,,
lSmnple size expressed in thomands The N% of those ..[1s contai”i.g subjects from both HAN33S 1 and HES 11 c.. HES 111 h.v. been cut in half tomahtain representative.es.
32

Table 9. Smoothed percentiles of recumbent length (in centimeters), by sex aand data f mm Fels Research Institui
Sex and age
Male—
Ohth . . . . . . . . . . . . . . . . . . . . . . . . . . . . . . . . . . . . . . . . . . . . . . . . . . . . . .Imonth . . . . . . . . . . . . . . . . . . . . . . . . . . . . . . . . . . . . . . . . . . . . . . . . . . . .3months . . . . . . . . . . . . . . . . . . . . . . . . . . . . . . . . . . . . . . . . . . . . . . . . . . .6months . . . . . . . . . . . . . . . . . . . . . . . . . . . . . . . . . . . . . . . . . . . . . . . . . . .9mcmths . . . . . . . . . . . . . . . . . . . . . . . . . . . . . . . . . . . . . . . . . . . . . . . . . . .12manths . . . . . . . . . . . . . . . . . . . . . . . . . . . . . . . . . . . . . . . . . . . . . . . . . .18months . . . . . . . . . . . . . . . . . . . . . . . . . . . . . . . . . . . . . . . . . . . . . . . . . .24manths . . . . . . . . . . . . . . . . . . . . . . . . . . . . . . . . . . . . . . . . . . . . . . . . . .30manths . . . . . . . . . . . . . . . . . . . . . . . . . . . . . . . . . . . . . . . . . . . . . .36m0nths . . . . . . . . . . . . . . . . . . . . . . . . . . . . . . . . . . . . . . . . . . . . . . . . . .
i aae: Statistics from National Center fm Health Statisticsbirth-36 months
Smcmthedl percentile
5th I 10th 25th 50th 75th 90th 95th
Recumbent length in centimeters
46.450.456.763.46S.071.777.582.387.091.2
45.449.255.461.866.169.876.081.366.090.0
47.551,357.764.469.172.878.783.588.292.4
48.650.256.262.667.070.877.282.587.091.0
49.053.059.466.170.674.380.585,690.194.2
48.251.957.864.268.772.478.884.268.993.1
50.554.661.167.872.376.162.487.692.396.5
49.953.559.565.970.474.380.986.591.395.6
51.856.263.069.774.077.784.389.994.698.9
61.054.961.267.872.476.3S3.O86.793.798.1
53.557.764.571.375.979.866.692,297.0
101.4
52.056.162.769.474.078.085.o90.895.6
100,0
54.458.665.472.377.181.288.193.898.7
103.1
62.966.863.470.275.079.186.192.096.9
101.5
%moothed by cubic-spline approximation, .s described in appendix 11.
33

Table 10. Smoothed percentiles of weight [in kilograms), by sex andfrom Fels Research Institt
Sex and age
we
8irth . . . . . . . . . . . . . . . . . . . . . . . . . . . . . . . . . . . . . . . . . . . . . . . . .lmonth . . . . . . . . . . . . . . . . . . . . . . . . . . . . . . . . . . . . . . . . . . . . . . . .3manths . . . . . . . . . . . . . . . . . . . . . . . . . . . . . . . . . . . . . . . . . . . . . . .6months . . . . . . . . . . . . . . . . . . . . . . . . . . . . . . . . . . . . . . . . . . . . . . .9months . . . . . . . . . . . . . . . . . . . . . . . . . . . . . . . . . . . . . . . . . . . . . . .12months . . . . . . . . . . . . . . . . . . . . . . . . . . . . . . . . . . . . . . . . . . . . . .18 months . . . . . . . . . . . . . . . . . . . . . . . . . . . . . . . . . . . . . . . . . . . . . .24m0nths . . . . . . . . . . . . . . . . . . . . . . . . . . . . . . . . . . . . . . . . . . . . . .30m0nths . . . . . . . . . . . . . . . . . . . . . . . . . . . . . . . . . . . . . . . . . . . . . .36months . . . . . . . . . . . . . . . . . . . . . . . . . . . . . . . . . . . . . . . . . . . . . .
Female
Sinh . . . . . . . . . . . . . . . . . . . . . . . . . . . . . . . . . . . . . . . . . . . . . . . . . .Imanth . . . . . . . . . . . . . . . . . . . . . . . . . . . . . . . . . . . . . . . . . . . . . . . .
3months . . . . . . . . . . . . . . . . . . . . . . . . . . . . . . . . . . . . . . . . . . . . . . .6mcmths . . . . . . . . . . . . . . . . . . . . . . . . . . . . . . . . . . . . . . . . . . . . . . .9mcmths . . . . . . . . . . . . . . . . . . . . . . . . . . . . . . . . . . . . . . . . . . . . . . .12months . . . . . . . . . . . . . . . . . . . . . . . . . . . . . . . . . . . . . . . . . . . . . .18months . . . . . . . . . . . . . . . . . . . . . . . . . . . . . . . . . . . . . . . . . . . . . .24months . . . . . . . . . . . . . . . . . . . . . . . . . . . . . . . . ..’ . . . . . . . . . . . .30months . . . . . . . . . . .. . . . . . . . . . . . . . . . . . . . . . . . . . . . . . . . . . . .36months . . . . . . . . . . . . . . . . . . . . . . . . . . . . . . .. . . . . . . . . . . . . . . .
: Statistics from National Center far Health Statistics and databirth-36 months
Smoothedl percentile
5thI
10thI
25th I 50th I 75thI
90thI
95th
We!ght in kilograms
2.543.164.436.207.528.439.59
I 0.5411.44I 2.26
2.362.97
4.185.797.007.648.929.87
10.7s11.60—
2.7S3.434.786.617.958.649.92
10.8511 .s012.69
2.583.22
4.476.127.348.19
9.3010.2611.2112.07
3.003.S25.327.208.569.49
10.6711.6512.6313.56
2.933.594.S66.607.89S.81
10.0411.1012.1112.99
3.274.295.987.859.1s
10.1511.4712.5913.6714.69
3.233.9s
5.407.21S.569.53
10.82
11.9012.9313.93
3.644.756.568.499.66
10.9112.3113.4414.5115.59
3.524.36
5.907.s39.24
10.2311.55
12.7413.9315.03
3.825.147.149.10
10.4911.5413.0514.2915.47
16.66
3.644.65
6.39S.389.63
lcl.s712.3013.5714.8115.97
4.15S.387.379.46
10.9311.9913.4414.7015.9717.28
3.814.92
6.74S.73
10.1711.2412.7614,0s15.3516.54
lSmoothed by cubic-spline approximation, as described in appendix U.
34

Table 11. Smoothed percentiles of head circumference (in centimeters], by sex and age: Statistics from National Center for HealthStatistic and data from Fels Research Institute. birth-36 months
Sex and age
Male,-_
6hth . . . . . . . . . . . . ...>. . . . . . . . . . . . . . . . . . . . . . . . . . . . . . . . . . . . . . . .Imonth . . . . . . . . . . . . . . . . . . . . . . . . . . . . . . . . . . . . . . . . . . . . . . . . . . . . . .3months . . . . . . . . . . . . . . . . . . . . . . . . . . . . . . . . . . . . . . . . . . . . . . . . . . . . .6montbs . . . . . . . . . . . . . . . . . . . . . . . . . . . . . . . . . . . . . . . . . . . . . . . . . . . . .9months . . . . . . . . . . . . . . . . . . . . . . . . . . . . . . . . . . . . . . . . . . . . . . . . . . .12manths . . . . . . . . . . . . . . . . . . . . . . . . . . . . . . . . . . . . . . . . . . . . . . .18nmnths . . . . . . . . . . . . . . . . . . . . . . . . . . . . . . . . . . . . . . . . . . . . . . . . . . . .24months . . . . . . . . . . . . . . . . . . . . . . . . . . . . . . . . . . . . . . . . . . . . . . . . . . . .30months . . . . . . . . . . . . . . . . . . . . . . . . . . . . . . . . . . . . . . . . . . . . . . . . . . . .36months . . . . . . . . . . . . . . . . . . . . . . . . . . . . . . . . . . . . . . . . . . . . . . . . . . . .
Female
6irth . . . . . . . . . . . . . . . . . . . . . . . . . . . . . . . . . . . . . . . . . . . . . . . . . . . . . . . .Imonth . . . . . . . . . . . . . . . . . . . . . . . . . . . . . . . . . . . . . . . . . . . . . . . . . . . . . .3months . . . . . . . . . . . . . . . . . . . . . . . . . . . . . . . . . . . . . . . . . . . . . . . . . . . . .6months . . . . . . . . . . . . . . . . . . . . . . . . . . . . . . . . . . . . . . . . . . . . . . . . . . . . .9months . . . . . . . . . . . . . . . . . . . . . . . . . . . . . . . . . . . . . . . . . . . . . . . . . . . . .12months . . . . . . . . . . . . . . . . . . . . . . . . . . . . . . . . . . . . . . . . . . . . . . . . . . . .18mcmths . . . . . . . . . . . . . . . . . . . . . . . . . . . . . . . . . . . . . . . . . . . . . . . . . . . .24months . . . . . . . . . . . . . . . . . . . . . . . . . . . . . . . . . . . . . . . . . . . . . . . . . . . .30months . . . . . . . . . . . . . . . . . . . . . . . . . . . . . . . . . . . . . . . . . . . . . . . . . . . .36months . . . . . . . . . . . . . . . . . . . . . . . . . . . . . . . . . . . . . . . . . . . . . . . . . . . .
-5th
32.634.938.441.543.544.846.347.348.048.6
32.134.237.340.342.343.545.046.147.047,6
Smoothedl percentile
10thI
25th 50th 75th , 90th
Head circumference m centirwtera
33.035.438.942.044.045.346.747.748.449.0
32.934.837.s40.942.844.145.646.547.347.9
33.936.239.742.844.s46.147.448.349.149.7
33.535.638.741.643.544.846.347.348.048.5
34.s37.240.643.845.847.046.449.249.950.5
34.336.439.542.444.345.647.148.148.649.3
35.638.141.744.746.647.949.350.251.051.5
34.837.140.443.346.146.447.946.S49.450.0
36.639.042.545.647.546.850.151.051.752.3
35.537.841.244.146.047.246.649.650.350.8
95th
37.239.643.146.246.149.350.651.452.252.8
35.938.341,744.646.447.649.150.150.861.4
lSmoothed by c“fdc-spline appmxinmtion, as describedin appendix 11.
35

Table 12. Smoothed percemiles of weighr 6. ki109rams). by sex and recumbent le.Statistics and data from Fek Research Imti
Sex and recumbent length
Fenwde
48-50 cenometers . . . . . . . . . . . . . . . . . . . . . . . . . . . . . . . . . . . . . . . . . . . . . . . . . . . . .50-52 centimeters . . . . . . . . . . . . . . . . . . . . . . . . . . . . . . . . . . . . . . . . . . . . . . . . . . . . .52-54 centimecws . . . . . . . . . . . . . . . . . . . . . . . . . . . . . . . . . . . . . . . . . . . . . . . . . . . . .5456centimetecs . . . . . . . . . . . . . . . . . . . . . . . . . . . . . . . . . . . . . . . . . . . . . . . . . . . . . .56-56 centimeters . . . . . . . . . . . . . . . . . . . . . . . . . . . . . . . . . . . . . . . . . . . . . . . . . . . . .58.60 centimeters . . . . . . . . . . . . . . . . . . . . . . . . . . . . . . . . . . . . . . . . . . . . . . . . . . . . .~42centimmem . . . . . . . . . . . . . . . . . . . . . . . . . . . . . . . . . . . . . . . . . . . . . . . . . . . . . .62-64 centimeters . . . . . . . . . . . . . . . . . . . . . . . . . . . . . . . . . . . . . . . . . . . . . . . . . . . . .W66centimeters . . . . . . . . . . . . . . . . . . . . . . . . . . . . . . . . . . . . . . . . . . . . . . . . . . . . .66%3centimeters . . . . . . . . . . . . . . . . . . . . . . . . . . . . . . . . . . . . . . . . . . . . . . . . . . . . .66-70 centimeters . . . . . . . . . . . . . . . . . . . . . . . . . . . . . . . . . . . . . . . . . . . . . . . . . . . . .70-72 centimeters . . . . . . . . . . . . . . . . . . . . . . . . . . . . . . . . . . . . . . . . . . . . . . . . . . . . .72-74 centimerws . . . . . . . . . . . . . . . . . . . . . . . . . . . . . . . . . . . . . . . . . . . . . . . . . . . . .74-76 cemirneters . . . . . . . . . . . . . . . . . . . . . . . . . . . . . . . . . . . . . . . . . . . . . . . . . . . . .76-78 centimeters . . . . . . . . . . . . . . . . . . . . . . . . . . . . . . . . . . . . . . . . . . . . . . . . . . . . .73-30 centimetws . . . . . . . . . . . . . . . . . . . . . . . . . . . . . . . . . . . . . . . . . . . . . . . . .80.62 centimeters . . . . . . . . . . . . . . . . . . . . . . . . . . . . . . . . . . . . . . . . . . . . . . . . . . . . .82-64 centimeter$ . . . . . . . . . . . . . . . . . . . . . . . . . . . . . . . . . . . . . . . . . . . . . . . . . . . . .6486centimeters . . . . . . . . . . . . . . . . . . . . . . . . . . . . . . . . . . . . . . . . . . . . . . . . .88-68 ccmtimeters . . . . . . . . . . . . . . . . . . . . . . . . . . . . . . . . . . . . . . . . . . . . . . . . . . . . .86-90 centimeters . . . . . . . . . . . . . . . . . . . . . . . . . . . . . . . . . . . . . . . . . . . . . . . . . . . . .90-92 centimeters . . . . . . . . . . . . . . . . . . . . . . . . . . . . . . . . . . . . . . . . . . . . . . . . . . . . .92-84 centimeters . . . . . . . . . . . . . . . . . . . . . . . . . . . . . . . . . . . . . . . . . . . . . . . . . . . . .84-96 centimeters . . . . . . . . . . . . . . . . . . . . . . . . . . . . . . . . . . . . . . . . . . . . . . . . . . . . .96-98 centimeters . . . . . . . . . . . . . . . . . . . . . . . . . . . . . . . . . . . . . . . . . . . . . . . .98-100 centimeters . . . . . . . . . . . . . . . . . . . . . . . . . . . . . . . . . . . . . . . . . . . . . . . . . . .100-102 centimerer5 . . . . . . . . . . . . . . . . . . . . . . . . . . . . . . . . . . . . . . . . . . . . . . . . . . .102-104 centimeter5 . . . . . . . . . . . . . . . . . . . . . . . . . . . . . . . . . . . . . . . . . . . . . .
(in centimeters): Slattsti.s from Natioml Center for Health, bir3h-48 months
5th
.
.
.
3.493.904.374.885.435.996.557.107.638.138.589.009.409.77
10.1410.4910.8511.2211.6012.0012.4212.8813.3713.9014.43
.
.
.
3.543.934.384.855.355.876.286.897.377.828.248.628.999.349.68
10.0310.3910.7611.1611.5812.0512.5513.1013.s3
. .
10th—
.
.
.
3.654.084.585.105.656.206.767.317.846.338.789.219.62
10.0110.3910.7611.1411.5311.9412.3712.8113.2813.7814.3014.85
...
3.644.054.504.995.5a6.036.567.087.588,058.4g8.909.299.67
10.0410.4110.7811.17II .5a12.0212.4E12.9E13.5114.08
. .
Smoothedl percentile
~
Weight in kilograms
2863.163.523.954.434.645.496.056.627.187.758.288.789.249.68
10.0910.4910.6811.2711.6712.0812.5212.9713.4513,9614.5015.0615.65
3.023.253.563.934.374.855.376.916.477.027.568.088.569.009.429.81
10.1910.5710.9411.3311.7412.1712.6313.1213.8414.1914.77
. . .
3.153.483.884.344.645.385.946.527.117.708.278.829.339.81
10.2710.7011.1211.5311.9312.3412.7613.2013.6614.1414.6615.2115.8116.45
3.283.553.694.294.765.275.826.396.977.558.118.649.149.58
10.0210.41! 0.8011,1811.5611.95‘f2.3612.8013.2743.7714.31f4.8715.46
. . .
3.503.664.264.765.295.846.427.o27.638.238.829.399.92
10.4310.9111.3611.8012.2312.6613.0713.5013.9414.4014.8816.3915.9416.5417,18
3.593.894.264.705.205.736.306.687.438.078.848.189.68
10.1410.5710.8711.3717.7612.1512.5512.9813.4613.9514.4815.0415.6316.26
. . .
90th ! 95th
.
.
.5.135.696.266.887.508.138.759.359.93
10.4810.9911.4811.9412.3912.6313.2613.6914,1314.5815,0515.5416.0616.6217.2217.87
.
.
.
5.025.556.126.707.307.908.509.069.s3
10.1510.6311.0811.5111.9312.3512.7613.1913.6314.1014.6115.1415.7116.3216.96
,.,
.
.
.6.335.886.477.037.728.368.999.62
10.2110<7711<2911,7812,2512.6913.1313.5614.0014.4414.9015.3915.9016.4317.0017.6018.24
.
.
.
5.216.776.386.957.558.158,759.339.36
10.4110.9111.3911.8512.2612.7213.1513.5714.0114.4514.9215.4215.9916.6417.36
. . .
lSnmothed by cubic.sp]f”e approximation, asdescribed i“ appendix 11.
36

,-.,---,------ .. . ,,.-,.. ....... . .. .. ....Table 13. Smoothed percentiles .3*stature Ii. cmtmemfsl. %’ sex and wc Data and staustica fro
Sex and aw
,au”r!., .,. !!,., ,.r “..!,,, OMC,>UG,, . .“ . . ,..!.
Smmthedl rmrcent,k
51h 10lh 2*h 50th I Jsth-90th 95th
Smwre incenumetm
94.4978
1Dzo106.?1G9.91135<17.0120.3123.5126.6129.7132.7
135.713s.s141.81449148.1151.5154.9i 58.5162.3166.11B.8173.4176717951819183.91B541866187.3t 87.6187.6
93.6%.6
1006104.51083172.011561182122.712611Z9.51329136.2139614281462149.5152.8156.21595162.71656168.1170.0171.3172.2172.81731173.3173.41735173,5173,6
%nmothed by <uhic.soline :PP,0X,IU2.1,0”. .s dascr,bcd ,. aPPm’J,x 112B,c.u= or a 1.-w,,,. Problem the pe,ce”t,le, of $tatum for ch,ldre” under 2.s ycam .,, not I@I,ly rel,abh. The age ,nterml rqmcae”kd B 2.0CK2 25 years
37

Table 14. Smooched c.erce.tilw of weight {in kd.awrns), bv sex and aw Data and Statmucs from Nat,onal Center for Health Statnsucs, 1.5 to 18 Years
lSnw.thed by c“buq,!inc zpproxim>t ,... as desc”b,d.i” append,, 11.
Smoothedx Pe,cent,ls
5th 10lh I 25th S-9th 75th I Wth I 95th
Wwht 8“ ktl.awann
..
.,..
38 .~’
.’

Table 15. Smoothed Dwcentdes of wmght (in kilograms]. bv %x and stature fin mntirneterd: Data and stmmtics from Natmnal Cenw far HealthStatistics, prepubescentmales an
Sex and s2ature
90.92 centimeters . . . . . . . . . . . . . . . . . . . . . . . . . . . . . . . . . . . . . . . . . . . . . . . . . . . . .92.94 centimeters . . . . . . . . . . . . . . . . . . . . . . . . . . . . . . . . . . . . . . . . . . . . . . . . . . . .94-96 centimeters . . . . . . . . . . . . . . . . . . . . . . . . .. . . . . . . . . . . . . . . . . . . . . . .96-98 ce.tim@em . . . . . . . . . . . . . . . . . . . . . . . . . . . . . . . . . . . . . . . . . . . . . . . . . . . . .98-160 centimeters . . . . . . . . . . . . . . . . . . . . . . . . . . . . . . . . . . . . . . . . . . . . . . . . .100-102 centimetms. . . . . . . . . . . . . . . . . . . . . . . . . . . . . . . . . . . . . . . . . . . . . . . . . . .102.104centimeten . . . . . . . . . . . . . . . . . . . . . . . . . . . . . . . . . . . . . . . . . . . . . . . . . . . .104-106 centlmetOrs . . . . . . . . . . . . . . . . . . . . . . . . . . . . . . . . . . . . . . . . . . . . . . . . .10&lOS.entimeters . . . . . . . . . . . . . . . . . . . . . . . . . . . . . . . . . . . . . . . . . . . . . . . . . . . .10EkllOcentimetws, . . . . . . . . . . . . . . . . . . . . . . . . . . . . . . . . . . . . . . . . . . . . . . . . . . .110-l 12centimeter5 . . . . . . . . . . . . . . . . . . . . . . . . . . . . . . . . . . . . . . . . . . . . . . . .112-l 14c0ntimeters . . . . . . . . . . . . . . . . . . .. . . . . . . . . . . . . . . . . . . . . . . . . . . . .114-l 18centimeters . . . . . . . . . . . . . . . . . . . . . . . . . . . . . . . . . . . . . . . . . . . . . . . . . . .116-l lltcentimetem . . . . . . . . . . . . . . . . . . . . . . . . . . . . . . . . . . . . . . . . . . . . . . . . . .llS-120cenorneters . . . . . . . . . . . . . . . . . . . . . . . . . . . . . . . . . . . . . . . . . . . .120-122 cwttimeters . . . . . . . . . . . . . . . . . . . . . . . . . . . . . . . . . . . . . . . . . . . . . . . . . . .,122-124 centimeters . . . . . . . . . . . . . . . . . . . . . ..’ . . . . . . . . . . . . . . . . . . . . . . . . . . .124-126 centimeters, . . . . . . . . . . . . . . . . . . . . . . . . . . . . . . . . . . . . . . . . . . . . . . . . . . .126-12Bcentimeters . . . . . . . . . . . . . . . . . . . . . . . . . . . . . . . . . . . . . . . . . . . . . . . . . . . .128-130 centimeters . . . . . . . . . . . . . . . . . . . . . . . . . . . . . . . . . . . . . . . . . . . . . . . . . . . .130.132 mntimeters . . . . . . . . . . . . . . . . . . . . . . . . . . . . . . . . . . . . . . . . . . . . . . . .132-134 centimeters . . . . . . . . . . . . . . . . . . . . . . . . . . . . . . . . . . . . . . . . . . . . . . . . . . .134.136.entimeters . . . . . . . . . . . . . . . . . . . . . . . . . . . . . . . . . . . . . . . . . . . . . . . . . . . .136-136 centimeters . . . . . . . . . . . . . . . . . . . . . . . . . . . . . . . . . . . . . . . . . . . . . . . . . . .138-140 centimeters . . . . . . . . . . . . . . . . . . . . . . . . . . . . . . . . . . . . . . . . . . . . . . . . . . . .140-142 centimeters . . . . . . . . . . . . . . . . . . . . . . . . . . . . . . . . . . . . . . . . . . . . . . . . . .142.144 cmtimeter5 . . . . . . . . . . . . . . . . . . . . . . . . . . . . . . . . . . . . . . . . . . . . . . . . .144-146 centimeters . . . . . . . . . . . . . . . . . . . . . . . . . . . . . . . . . . . . . . . . . . . . . . . .
Female
90.92 cmtimeters . . . . . . . . . . . . . . . . . . . . . . . . . . . . . . . . . . . . . . . . . . . . . . . . . . .92-94 centimeters . . . . . . . . . . . . . . . . . . . . . . . . . . . . . . . . . . . . . . . . . . . . . . . . . . . . . .94-96 centimeters . . . . . . . . . . . . . . . . . . . . . . . . . . . . . . . . . . . . . . . .96-98 centimeters . . . . . . . . . . . . . . . . . . . . . . . . . . . . . . . . . . . . . . . . . . . . . . . . . . . . . .96-100 centimeters . . . . . . . . . . . . . . . . . . . . . . . . . . . . . . . . . . . . . . . . . . . . . . . . . . . . .100-102 centimeters . . . . . . . . . . . . . . . . . . . . . . . . . . . . . . . . . . . . . . . . . . . . . . . . . . .102-104 cemimetws . . . . . . . . . . . . . . . . . . . . . . . . . . . . . . . . . . . . . . . . . . . . . . . . . . . .104-106 centimews. . . . . . . . . . . . . . . . . . . . . . . . . . . . . . . . . . . . . . . . . . . . . . . . . . . .106-108 centimeters . . . . . . . . . . . . . . . . . . . . . . . . . . . . . . . . . . . . . . . . . . . . . . . . . . . .108-l 10centimetets . . . . . . . . . . . . . . . . . . . . . . . . . . . . . . . . . . . . . . . . . . . . . . . . . . . .110-l 12centlmeters . . . . . . . . . . . . . . . . . . . . . . . . . . . . . . . . . . . . . . . . . . . . . . . . . . .l12-114centimeters . . . . . . . . . . . . . . . . . . . . . . . . . . . . . . . . . . . . . . . . . . . . . . . . . . . .114-116 centimeters . . . . . . . . . . . . . . . . . . . . .. .. L. . . . . . . . . . . . . . . . . . . . . . . . .116-l 18centImeters . . . . . . . . . . . . . . . . . . . . . . . . . . . . . . . . . . . . . . . .llS-120 centimeters . . . . . . . . . . . . . . . . . . . . . . . . . . . . . . . . . . . . . . . . . . . . . . . . . . .120-122 qentOmetws.. . . . . . . . . . . . . . . . . . . . . . . . . . . . . . . . . . . . . . . . . . . . . . . . . .122-124 centimnter5 . . . . . . . . . . . . . . . . . . . . . .. . . . . . . . . . . . . . . . . . . . . . . . . . . . . . .124.126 centimeterz . . . . . . . . . . . . . . . . . . . . . . . . . . . . . . . . . . . . . . . . . . . . . . . . . . . .126-128 centimeter .. I . . . . . . . . . . . . . . . . . . . . . . . . . . . . . . . . . . . . . . . . . . . . . . . . .128-130 centimeter3, . . . . . . . . . ...<.. . . . . . . . . . . . . . . . . . . . . . . . . . . . . . . . . . . .130-132 centimeters . . . . . . . . . . . . . . . . . . . . .. J. . . . . . . . . . . . . . . . . . . . . . . . . .132-134 centimeter+ . . . . . . . . . . . . . . . . . . . . . . . . . . . . . . . . . . . . . . . . . . . . . . . . . . . .134-136 centimeters . . . . . . . . . . . . . . . . . . . . . . . . . . . . . . . . . . . . . . . . . . . . . . . . . . . .136.138centimetem . . . . . . . . . . . . . . . . . . . . . . . . . . . . . . . . . . . . . . . . . . . . . . . . . . . .136-140 centimeters . . . . . . . . . . . . . . . . . . . . . . . . . . . . . . . . . . . . . . . . . . . . . . . . . . . .140-142 centimeters . . . . . . . . . . . . . . . . . . . . . . . . . . . . . . . . . . . . . . . . . . . . . . .142-144 centimeters . . . . . . . . . . . . . . . . . . . . . . . . . . . . . . . . . . . . . . . . . . . . . . . . . . .lM.1460entimeten . . . . . . . . . . . . . . . . . . . . . . . . . . . . . . . . . . . . . . . . . . . . . . . .
females
Smoothedl percenole
5th 10thI
25thI
50th I 75th 90th 95th
11.7012.0712.46128713.3173.7714.2514.7615.3015.8S16.4317.0417.6613.3218,9919.7020.4321.2021.9922.82236924.5925.5326.5127.532S.5929.7030.s6
11.46t16612.2612.6613.0613.4813.9114.3614.6415.3515.9016.48171117.7718.4819.2219.99208021.6522.5323.4424.38253526.34
. .
.
.
. . .
11.97123612.7713.2113.6714.1514.6516,18t5.73t6.3116.9117.531s.1818.65t9.5520.2821.0321.8222.6423.50243925.3226.3027.3228.3829.4830.6431.65
11.67Iz.to125312.9713.4213.8814.3614.85153715.9116.4817.0917.721S.4019.t 119.8520.6421.4722.3423.2524.2225.2226.2827.39
. . .
.
. .
. . .
Weight in kilograms
12.5813.0313.4913.9814.4815,0015.5416,1016.6s17,2817.9018.5419.2019.8920.6021.3422.1122.9223.7724.67256226.6227.6826.8029.9931.2532.583400
12.2812.74132113.7014.1914.69 It 6.2115.7516.3016.8717.4718.0618.7219.4020.1120.S721.68
1
22.5423.47244625.5226.6627.8829.19
. .
.
.
. . .
14.3514.8415.3415.s716.4116.9817.5716.18188219.4920.1820,9121.6622.4523,2824.1525.0726.0527.1028.2129.41306632.0533.51350636.7538.5440.45
14.11t 4.6315.1415.6616.1916.7317.2S17.S616.4619.0919.7620.4721.2322.0422.92238824.9126.0527.28286330.0931.6633.4135.29
. .
. . . I
. .~
15.2E16.8716.4517,0117.5618.1118.6719,25198620.5121.2221.9822.8223.7324,7325.8026,9628.1829.4830.6632.3133.8235.4037.0538.7740.5542.3944.29
14.98t56716,1316.6917.2417.601s.3s18.9619.6220.3021.0321.8122.6723.6024.6225.7326.8526.2729.71312832.99346436.8439.01
. .
. .
. . ..
—
.15.7216.4117.0617.W18.2918.S918.5020.1220.7621.4522.1822.9S23.s524.8025.8326.9628.1829.5030.9232.4434.07 .35.8137.6739.6541.7443.9748.324880
15.7416.4217.0517.6518.2318.S019.3819,9820.6121,2922.0322,04“23.732~.7125.8127.0328.3729.8731.5133.33
‘ 35.3337.53399342.54
.
.
. .
18mooihed by cubic-spline approximation, as described in appendix 11.
39
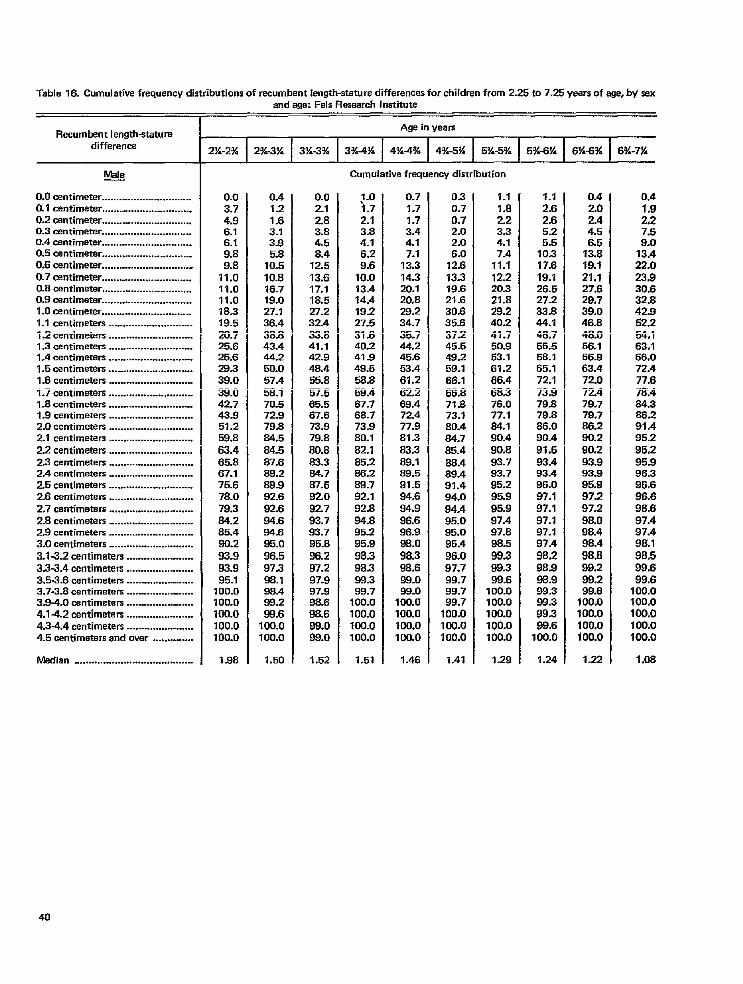
Table 16. Cumulative frequency distributions of recumbent Iength-stature differences for children from 2.25 to 7.25 vears of age, by sex
Recumbent Iength+taturedifference
*
0.0 centimeter ...............................0.1 centimeter ...............................0.2 centimeter ...............................0.3 centimeter ...............................0.4 centimeter. ..............................0.5 centimeter ...............................0.6 centimeter ...............................0.7 centimeter ...............................0.8 centimeter ...............................0.9 centimeter ...............................1.0 centimeter...............................1.1 centimeters.............................1.2 centimeters .............................1.3 centimete~ .............................1.4 centimeters .............................1.5 centimeter .............................1.6 centimeters .............................1.7 centimetwt .............................1.8 centimeters .............................1.9 centimeters .............................2.0 centimeter .............................2.1 centimeters .............................2.2 centimetm .............................2.3 centimeter .............................2.4 centimeters .............................2.5 centimeters .............................2.6 centimeters .............................2.7 centimeters .............................2.8 centimeters .............................2.9 centimeters .............................3.0 centimeters .............................3.1-3.2 centimeters .......................3.3-3.4 centimetm .......................3.5-3.6 centimeter .......................3.7-3.8 centimeters .......................3.94.0 centimeters .......................4.14.2 centimeters .......................4.34.4 centimeters .......................4.5 centimeters and over ..............
Median .........................................
and age: Fels Research Institute
Age in yea!s
2%-2% 2%-3% 3X-3% 3%-W 4%4% 4%-5% 5%-5% 5%-6% 6%-6% 6%-7%
Cumulative frequency distribution
0.03.74.96.16.19.89.8
11.011.011.018.319.520.725.625.629.339.039.042.743.951.2E43.863.465.867.175.678.079.364.285.480.293.993.995.1
100.0100.0100.0100.0100.0
1.98
0.41.21.63.13.95.8
10.510.816.719.027.136.438.843.444.250.057.458.170.572.979.884.564.587.668.289.992.692.694.694.695.096.597.398.198.4S9.289.6
100.0100.0
1.50
0.02.12.83.84.58.4
12.513.617.118.527.232.433.841.142.948.455.857.565.567.673.979.880.863.3e4.787.592.092.793.793.795.696.297.297.997.998.698.699.099.0
1.52
f .01.72.13.84.16.29.6
10.013.414.419.227.531.640.241.949.556.859.467.768.773.980.182.185.266.268.792.192.894.895.295.998.398.399.399.7
100.0100.0100.0100.0
1.51
0.71.71.73.44.17.1
13.314.320.120.629.234.736.744.246.653.461.262.269.472.477.981.383.389.189.591.594.694.996.698.986.098.388.69%3.099.0
100.0100.0100.0100.0
1.46
0.30.70.72.02.06.0
12.613.319.621.630.835.637.246.549.259.166.165.871.673.180.464.765.466.489.491.494.094.495.095.095.496.097.799.799.799.7
100.0100.0100.0
1.41
1.11.62.23.34.17.4
11.112.220.321.829.240.241.750.953.161.266.468.376.077.764.190.490.893.793.785.295.995.997.497.898.599.389.399.6
100.0100.0100.0100.0100.0
1.29
1.12.62.65.2
IE17.619.126.527.233.844.146.765.556.165.172.173.979.879.886.090.491.593.493.496.097.197.197.197.197.498.296.998.999.399.399.399.6
100.0
1.24
0.42.02.44.56.6
13.819.121.127.629.739.046.848.o56.156.963.472.072.479.779.786.290.290.293.993.995.997.297.298.098.498.498.899.299.299.6
100.0100.0100.0100.0
1.22
0.41.9242
;:13.422.023.930.832.842.952.254,163,166.072.477.678.464.388.291.495.296.295.996.396.696.696.697.497.498.196.699.699.6
100.0100.0100.0100.0100.0
1.06
40
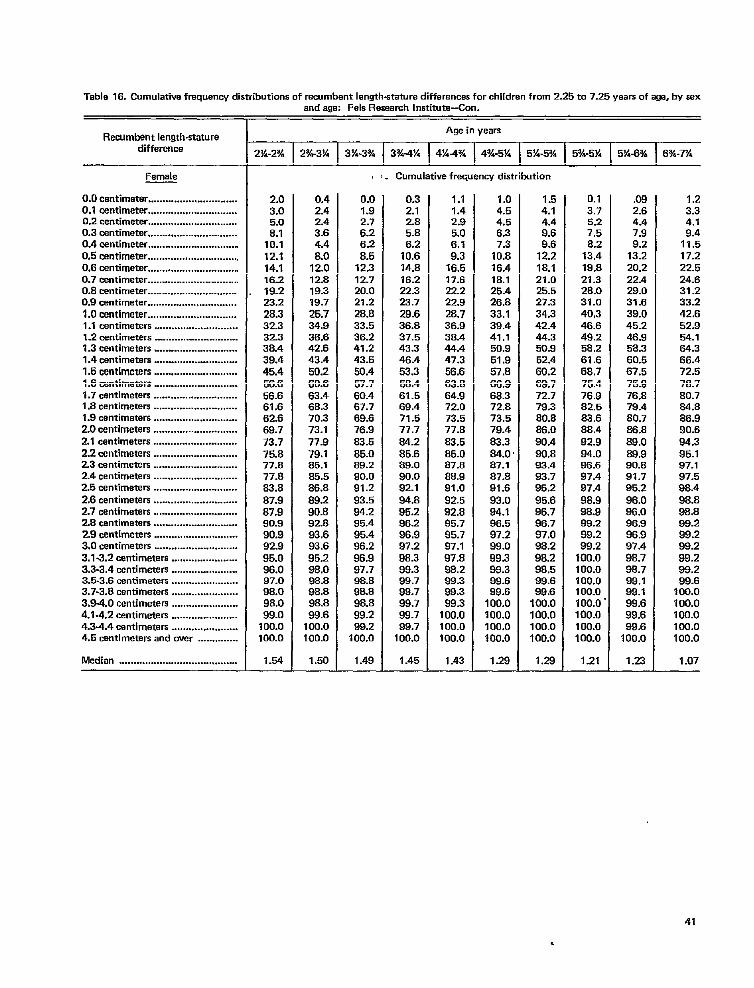
Table 16. Cumulative freouencv distributions of recumbent Ien.ath-statwe differences for children from 2.25 m 7.25 vears of sue. bv sex
Recumbent length-staturedifference
Female
0.0 centimeter .... ..... ..... . .... .. .... .. ... .0.1 centimeter . .. . ..... ..... ..... ..... . .. ... .0.2 centimeter, .. . ... .. ..... ..... ... ... .. ....0.3 centimeter ... ..... ... .. . ... .. ..... ..... ..0.4 centimeter ... ... .. . ..... ..... .. ... . .... . .0.5 centimeter .... .... ... ... .... .. ... . .. ... ...0.6 centimeter ... ... .. ..... .. ... .. .... ..... . .0.7 centimeter .. .. .. .... .. . ..... .... .. .... ....0.8 centimeter .. ... .. . .. ... ..... ... .. .. .... ..0.9 centimeter .. .... .. .... ... .. . ... ... ... . .. .
1.0 centimeter .. ..... ..... .... .. ..... ..... ...1.1 centimeters ... .... .. ..... ..... ..... .... .1.2 centimeters ... . .. .. ..... . ... .. .. . .. .1.3 centimeters .. ..... .. .... .. ... ..... .... ..1.4 centimeters .. ..... . ..... ..... . .... . ... ..1,5 centimeters .. ..... .. ... .. .... . .... ..... .1.6 centimeters .. ..... ... .. .. .... ..... . .. ...1.7 centimeters .. .. .. ..... . .... . ..... .. .. .. .1.8 centimeters .. .. .. .. ... ... ... . .... . ..... .1.9 centimeters . ..... .. .... .... .. ..... ..... .2.0 centimeters .... .. .... .. ..... ..... . ..... .
2.1 centimeters ..... ... .... .... .. .... ..... . .2.2 centimeters .. .... .... ..... .. ..... ... ... .2.3 centimeters ..... . ..... ..... . ..... .. ... . .2.4 centimeters . ..... .... .. ..... .. .... ..... .2.5 centimeters .. .... .. ... . ..... ..... .. ... . .2.6 centimeters . ..... . .... . ..... .. .. ... .... .2.7 centimeters .. .. .. ... .. ... .. . .. ... ..... . .2.S centimeters .... .. . ..... .... .. ..... .... ..2.9 centimeters .... .... .. .. .. ..... ..... .... .3.0 centimeters ... ..... ..... .... .. ..... .....3.1-2.2 centimeters .. .... . ..... ..... ... ...3.3-3.4 centimetcm .. ..... ..... . ..... .....3.6-3.6 centimeters .. . ... .. .... .. .... . ... .3.7-3.8 centimeters ....... .. .... ..... . ....3,9-4.0 centimeters .... ... . ... .. . .... . ....4.1-4.2 centimeters ...... . ..... . ..... .....4.3-4.4 centimeters .. ..... ... . .. ..... . ... .4.5 centimews and aver ... ... .... ....
Median ... .. ... . ..... ..... ... ... . ..... ..... .....
and age: Fels Research Institute-Con.
Age in years
2%-2% 2%-3X 3X-3% 3%-W 4%4% 4%-5% 5%-5% 5%-5% 5%-6% 6%-7%
2.03.05.08.1
10.1
12.114.116.219.223.226.332.332.338.439.445.456.656.661.662.569.773.775.877.877.883.687.987.990.990.992.9
95.096.097.098.098.099.0
100.0100.0
1.54
0.42.42.43.64.4
8.012.012.819.319.725.734.936.642.643.450.260.663.468.370.373.177.979.185.165.586.889.290.892.893.693.6
95.296.098.898.898.899.6
100.0t 00.0
1.50
0.01.92.76.26.28.5
12.312.720.021.228.833.536.241.243.550.457.760.467.769.676.9
83.5
85.089.280.091.293.584.295.495.496.2
96.997.798.898.898.699.299.2
100.0
1.49
1. Cumulative frequency distribution
0.32.12.85.86.2
10.614.816.222.323.729.636.637.543.346.4
53.358.461.569.471.577.7
64.285.689.090.092.194.8
85.296.296.997.298.389.399.799.799.799.799.7
100.0
1.45
1.11.42.95.06.19.3
16.517.622.222.928.736.938.444.447.3
56.663.664.972.073.577.883.5
85.067.888.991.092.592.895.795.797.197.898.299.399.399.3
100.0100.0100.0
1.43
1.04.54.56.37.3
10.816.418.125.426.633.139.441.150.951.957.866.968.372.873.579.483.384.087.167.891.693.094.196.597.299.099.399.399.698.6
100.0100.0100.0100.0
1.29
1.54.14.49.69.6
12.218.121.025.527.334.342.444.350.952.460.269.772.778.380.886.090.490.893.493.795.295.696.796.797.098.298.298.599.699.6
t 00.0100.0100.0100.0
1.29
0.1
3.76.27.58.2
13.419.821.328.o31.040,346.649.268.261.666.775.476.982.583.688.492.994.096.697.497.498.998.999.299.299.2
100.0t 00.0100.0100.0100.0100.0100.0100.0
1.21
.092.64.47.99.2
13.220.222.429.o31.639.045.246.958.360.567.576.976.879.480.786.889.089.990.891.796.2
96.096.096.996.997.496.798.799.198.199.699.699.6
100.0
1.23
1.23.34.19.4
11.517.222.524.831.233.242.652.954.164.386.472.578.780.764.686.990.6
94.395.197.197.598.4
98.888.699.299.299.299.299.299.6
t 00.0100.0100.0100.0100.0
1.07

.
Table 17. Means, standard deviation, Pearson statistics, and Pearscmderived percentiles of stature for U.S. males 6 to 18 years of agtx
Age
6.00-S.25 years ......................................................6.25-S.50 years ......................................................6.50-6.75 years ......................................................6.75-7.00 years ........................................... ...........7.00-7,25 years ......................................................7.25-7.50 years ......................................................7.50-7.75 years ......................................................7.75-8.00 year3 ......................................................8.00-8.25 years ......................................................8.25%.50 years ...................~.......... .................... ...8.50-6.75 years ......................................................8.75-9.00 years ................................................ .......9.00-9.25 years ......................................................9.25-9.50 years ......................................................9.50-9.75 yea= ......................................................9.75-10.00 years ....................................................10.00-10.25 years ..................................................1O.2E5-10.50 yearn .................................... ..............10.50-10.75 years ..................................................10.7S11 .00 years ..................................................11.00-11.25 yews ..................................................11.2S11 .50 years ..................................................11.50-11.75 years ..................................................11.75-12.00 years ..................................................12.00-12.25 years ..................................................12.25-12.50 years ..................................................12.50-12.75 years ..................................................12.75-13.00 years ...... ........................ .................. ..13.00-13.25 years ..................................................13.25-13.50 years ..................................................13.50-13.75 years ..................................................13.75-14.00 yearn ................................................ ..14.00-14.25 years ..................................................14.25-14.50 years ........................................ ..........14.50-14.75 years ..................................................14.75-15.00 years ..................................................15.00-15.25 years ..................................................15.2515.50 years ..................................................15.50-15.75 years ..................................................16.75-16.00 years ..................................................16.00-16.25 years ..................................................16.25-16.50 years ..................................................16.50-16.75 years ..................................................16.75-17.00 years ..................................................17.00-17.25 years ..................................................17.25-17.50 years ..................................................17.5GI 7.75 years ..................................................17.75-18.00 years ..................................................
United States. 1963-70
x
116.2118.2118.7121.0122.0123.4125.4126.6128.4129.1130.4131.3134.1134.7136.1137.3138.4139.5140.7143.1143.2144.6148.0147.0149.7149.7153.5155.2156.3159.s160.1762.7154.5166.9167.0169.1169.7171.7171.3173.3173.7174.1174.6175.0175.4176.3175.0176.2
s
4.84.84.75.54.35.25.35.75.06.14.86.26.56.27.06.76.46.66.16.56.57.35.86.76.27.98.38.36.78.49.18.69.06.8B.37.68.66.97.36.5<7.27.36.17.37.06.67.07.3
&
.2015
.0769
.0049
.0393
.0673
.0655
.0972
.1046
.1090
.1114
.1122
.1118
.1107
.1089
.1067
.1040
.1011
.0980
.0946
.0914
.0879
.0s44
.0808
.0773
.0738
.0703
.0668
.0635
.0602
.0571
.0542
.0514
.0488
.0465
.0445
.0429
.0416
.0409
.0408
.0413
.0428
.0448
.0481
.0526
.0587
.0665
.0764
.0888
P~
1-6.71631-2.5400
10.56892.28253.23353.77354.07484.23234.30134.31494.29384.25064.19444.13064.06293.99373.92493.65743.79203.72923.66923.61233.55643.50773.46003.41533.37353.33463.29853.26503.23413.20563.17953.15573.13403.11443.09683.06113.06713.05473.04393.03443.02623.01903.01273.00693.00142.9956
Pearson-derivedpercentile
5th 25th 50tht
75th 95th
Stature in centimeters
(1)(1)(1)
113.3114.1114.9115.9116.9117.9119.0120.1121.2122.4123.6124.8126.1127.4128.7130.1131.5132.9134.3135.7137.2138.6140.1141.5143.0144.5145.9147.4148.7150,2151.6152.9154.2155.4156.8156.0159.2160.2161.3162.3163.2164.1164.8165.5166.1
(11(1)(1)
117.3116.7119.9121.1122.3123.5124.8126.0127.3128.6130.0131.3132.7134.2135.6137.4138.5140.0141.5143.1144.5146.0147.5149.0150.6152.0153.5155.0156.3157.8159.2160.6161.8163.1164.3165.5166.6167.6168.7169.6170.4171.3171.9172.4173.0
(1)(11P)
120.8121.9123.1124A125.7127.c128.4129.5131.2132.6134.1135.5137.0138.5140.2141.6143.1144.7146.2147.8149.4150.9152.5153.9155.6157.1158.6160.1161.5163.0164.4165.7167.0168.3169.5170.7171.8172.9173.8174.7175.5176.3176.9177.4177.9
14 or f12~ beyond the range Of the Pearscmdistribution system making estimation of percentiles impossible.
P)(1)P)
124.2125,2126.4127.8129.2130.8132.’f733.8135,2136,7136.3139.8141.4142.9144.6146.2147.8149.5151.0162.8154.4155.9157.2159.1160.8162,3163,8165.4166,8168.3169,7171.0172.3173.6174.8176.0177.1178.1179.1179.9160.7181.4162.0162.4182.9
P)P)(1)
128.4130.1131.6133.3134.9136.6136.3140,0141.6143.3145.0148.7146.4150.1151.s153.6155.2167.0158.6160.3162.0163.6165.4166,9168.6170.2171.7173,2174.7176.2177.6178.9180.21ffl .4182.6183.8184.8185.6186.7187.5188.2188.9169.4169.8190,2
NOTE ~= mean;s = standard deviaticm;4 and 172= Pearsonstatistics.
42
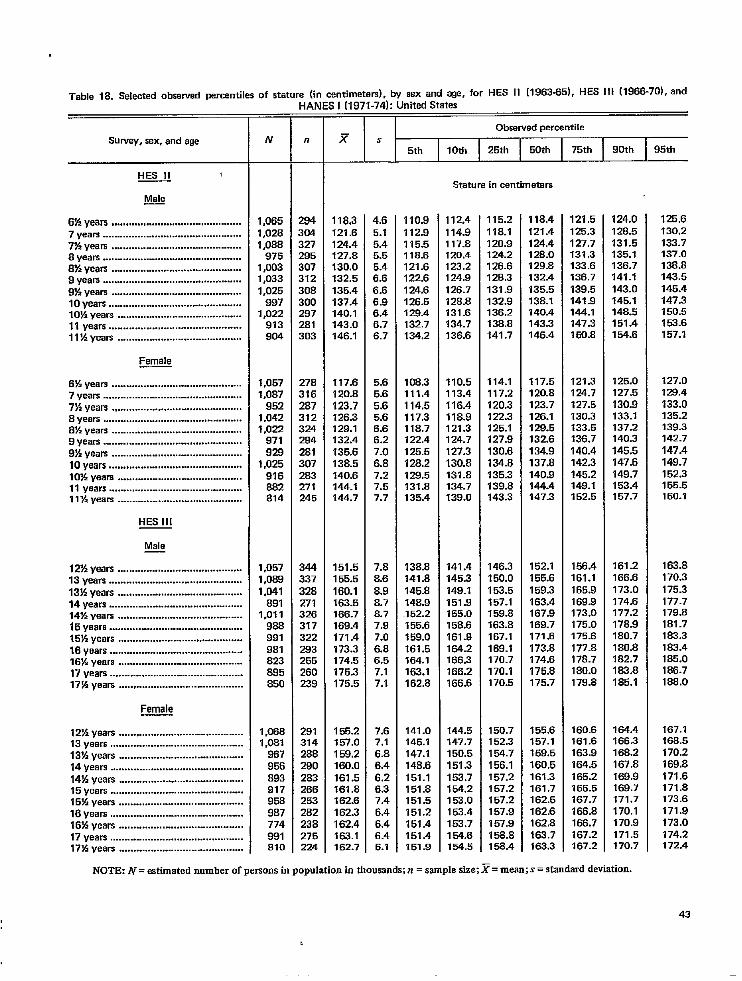
Surwey,sex, and age
~
@
6% yeaw .............................................7 years ................................................7?4wars .............................................8 years ................................................8% Yeats .............................................9 years ........................................ .......9fi years .............................................10 years ..............................................10K years ...........................................11 years ..............................................11% years ...........................................
Female
6!4 years .............................................7 years ................................................7% years .............................................8 yews ................................................i3Ayears .............................................9 years ................................................9% years .............................................10 year3 ..............................................10% yearn ...........................................11 years ..............................................11% years ...........................................
HES 11[
Male
1236years ...........................................13 years ..............................................13% years ...........................................14 years ..............................................14% years ...........................................15 years ..............................................15’%years ...........................................16 years ..............................................16!4 years ...........................................17 years ..............................................17% years ...........................................
—
n
294304327295307312308300297281303
278316287312324294281307283271?45
wJ37128?71126317322?93?55260239
291314288290283266253282238275224
Table 18. Selected observed percentiles of stature (in centimeters), by sex and age, for HES II (1963-851, HES III (1966-70}, andHANES I (1971-74): United States
Obsewed percentileF s
5th 10th 26th 50th 75th 90th 95thIv
1,0651,0261,088
9751,0031,0331,025
9971,022
913904
1,0571,087
8521,0421,022
971929
1,025916882814
I,0571,0891,041
8911,011
988991981823895850
1,0681,081
967956893917956987774991810
118.3121.6124.4127.6130.0132.5135.4137.4140.1143.0146.1
117.6120.8123.7126.3129.1132.4135.6138.5140.6144.1144.7
151.5155.5160.1163.5166.7169.4171.4173.3174.6176.3175.5
166.2157.0159.2160.0161.5161.8162.6162.3162.4163.1162.7
Female
12X years ...........................................13 years ..............................................13% years ...........................................14 years ..............................................14% years ...........................................15 years ..............................................15% years ...........................................16 years ..............................................16M years ...........................................17 years ..............................................17% years ...........................................
NOT2+ N = estimated number of persons in population in thousands; n = sample size; ~ = mean;s = standard deviation.
4.65.15.45.55.46.66.66.96.46.76.7
5.65.65.65.66.66.27.06.87.27.57.7
7.83.63.95.7B.77.97.06.85.57.17.1
7.67.16.86.46.26.37.46.46.46.46.1
110.9112.9115.5118.6121.6122.6124.6126.6129.4132.7134.2
108.3111.4114.5117.3118.7122.4125.5128.2129.5131.835.4
138.8141.8145.8148.9152.2155.6I59.0[61.5164.1163.1162.8
I41.0145.1147.1148.6151.1151.8161.5161.2[51.4[51.4[51 .9
.Wature in centim wters
112.4114.9117.8120.4123.2124.9126.7128.8131.6134.7136.6
110.5113.4116.4118.9121.3124.7127.3130.8131.8134.7139.0
141.4145.3149.1151.9I55.0158.6161.9I64.21663166.2I66.6
[44.5147.7I50.5I51.3153.7154.2I53.0163.4153.7154.6134.5
115.2118.1120.9124.2126.6128.3131.9132.9136.2136.8141.7
114.1117.2120.3122.3125.1127.9130.6134.8135.3139.8143.3
146.3I50.0I53.5I57.1159.8163.8167.1169.1170.7170.1I70.5
150.7152.3I54.7156.1157,2157,2157.2I57.9I57.9158.8156.4
118.4121.4124.4128.0129.8132.4135.5138.1140.4143.3146.4
117.5120.8123.7126.1129.5132.6134.9137.8140.9‘M4.4147.3
152.1155.6169.3163.4167.9169.7171.6173.8174.6175.8I75.7
155.6157.1I59.5160.5161.3161.7162.5162.6162.8163.7163.3
121.5125.3127.7131.3133.6136.7139.5141.9144.1147.3150.8
121.3124.7127.5130.3133.6136.7140.4142.3145.2149.1152.5
156.4161.1165.9169.9I73.0I75.0175.6177.8178.7I80.0179.8
I60.6161.6163.9164.5165.2[66.5167.7166.8166.7167.2i67.2
124.0128.5131.5135.1136.7141.1143.0145.1148.5151.4154.6
125.0127.5130.9133.1137.2140.3145.5147.6149.7153.4167.7
161.2I66.6173.0174.6177.2178.9180.7I80.8182.7183.8185.1
I64.4166.3168.2167.8[69.9[69.7171.7170.1I70.9171.5170.7
125.6130.2133.7137.0138.8143.5145.4147.3150.5153.6157.1
127.0129.4133.0135.2139.3142.7‘247.4149.7152.3155.5160.1
163.6170.3175.3177.7179.8181.7183.3183.4165.0186.7188.0
167.1168.5170.2169.8171.6171.8173.6171.9173.0174.2172.4
43

Table 18. Selected observed wr~ntiles of stature (in
SuIVeV, sex, and age
HANES I
Male—
20C-2.25 years ...................................2.25-2.75 years ...................................2.753.25 years ...................................3.25-3.75 years ...................................3.75425 yeats ...................................4.25-4.75 yews ...................................4.75-5.25 yearn ...................................5.25-5.75 years ...................................5.75.6.26 bears ...................................6.25-8.75 years ...................................675-7.25 V-B ...................................7.25-7.75 years ...................................7.75-8.25 years ...................................825-6.75 years ...................................6.75-9.25 years .................. .................9.25-9.75 years ...................................9.75-10.25 years .................................10.25-10.75 years ...............................10.75-11.26 years ........... ....................11.25-11.75 yeacs...............................11.75-12.25 years ...............................12.25-12.75 years ...............................12.7%13.25 years ...............................13.25-13.75 years ...............................13.75-24.26 years ............ ...................14.25-14.75 years ...............................14.75-15.25 years ...............................15.25-15.75 years ...............................15.75-16.25 years ...............................16.25-16.75 years ...............................16.75-17.25 years ...............................17.25-17.75 years ...............................17.75-18.25 years ...............................18.25-19.00 years ...............................19.00-20.00 years ...............................20.00-21.00 years ...............................21.00-22.00 years ...............................22.00-23.00 years ...............................23.00-24.00 years ...............................24.00-26.00 years ...............................
t
N
419945785857856937874876857
1,001957
1,1531,053
801853892
1,0641,1171,1921,0011,0821,1281,2211,0711,0181,0271,235
8371,121
9311,2121,020
7551,0671,7701,6681.7031,6621,5891,595
NE:
n
77157147146152162135146126SI7984807474849389926490
103988691869472698197S76398
1351041121079496
!ntimeters). by sex and aoe. for HES II (1963-65}. HES I I I (1988-70). and1971 -74): United States-Con.
Observed percentileF s
5th 10th 25th 50th 75th 90th 95th
Stature in centimeters
88.391.496.098.1
102.7105.7108.9113.0116.1117.8122.6124.5128.1129.3131.6134.3138.8139.8143.4I46.4I49.9152.6I54.2160.4164.2[67.6167.6I70.9173.2175.1176.8176.9I77.0176.5176.3176.5177.1I77.1177.2178.0
3.84.03.74.T4.34.55.04.34.76.14.75.25.75.06.25.46.36.06.26.97.68.o7.28.98.97.58.47.07.67.47.26.65.56.46.77.06.67.59.17.0
82.686.188.992.196.298.0
100.7106.2108.8108.5114.9115.4119.6121.8119.4125.2127.2131.5132.8136.3138.3139.1142.5145.1149.0154.8153.1159.5160.1163.41E4.6165.2170.1166.8162.8159.4166.2167.2161.3165.4
63.567.090.593.397.3
100.2103.2107.7108.8109.0116.4116.3121.0123.2124.1128.4130.9132.9134.9140.1140.4142.3144.4146.3153.1156.3155.6160.9164.6164.8166.1168.6171.1169.3166.9168.4166.3167.7166.3168.5
66.168.092.495.7
100.0103.5105.5110.1112.7113.0116.9120.9123.5125.8126.9130.7134.4135.6139.0141.4145.0145.7149.3153.6158.8162.5162.8165.9168.7170.1172.1172.8173.4172.0171.6172.2172.5171.3172.3172.9
87.891.395.198.2
102.6105.9108.8113.5117.3117.8122.9124.7127.6128.5133.8133.8139.3138.7143.6145.3149.4162.1154,4160.4165.2167.3168.7171.2173.3175.0177.3777.2176.2175.8177.2177.4177.3177.J176.8178.1
90.393.897.2
101.1105.3108.6112.4116.1119.2122.7126.4128.3132.1132.7135.9137.5142.8142.8147.9151.1153.9157.9158.8188.8170.0172.8173.1175.2177,8180.5182.5181.8179.6180.1180,8181.2181.1180.6163,0163.0
9’1.997.3
100.1102.8107.5111.9115.4118.3121.6125.7126.2131,5135.6136.3139.1141.9745.6148.2151.2164.7160.6163.7T63.I?71.2175.3178<2177.7180.1181,8183.7185,0164.8166.4185.9185.0183.6164.6187.1188.5186,7
87.398.3
101.2104.4110.8113.2116,5i 19.5122.7127.2128.6132.8139,1~38,6140.2144.4190.8151.5~5&
166:2167.1165.6176.1177.5?79,2i81.6164.0166.6180.1188.3187.2187.2186.8188.2185,8190,0182.0189<2169.5
NOTE: N = estimated number c.f pm-mm in population fn thowands.; n = sampk size; ~= mean:s = standard deviation.
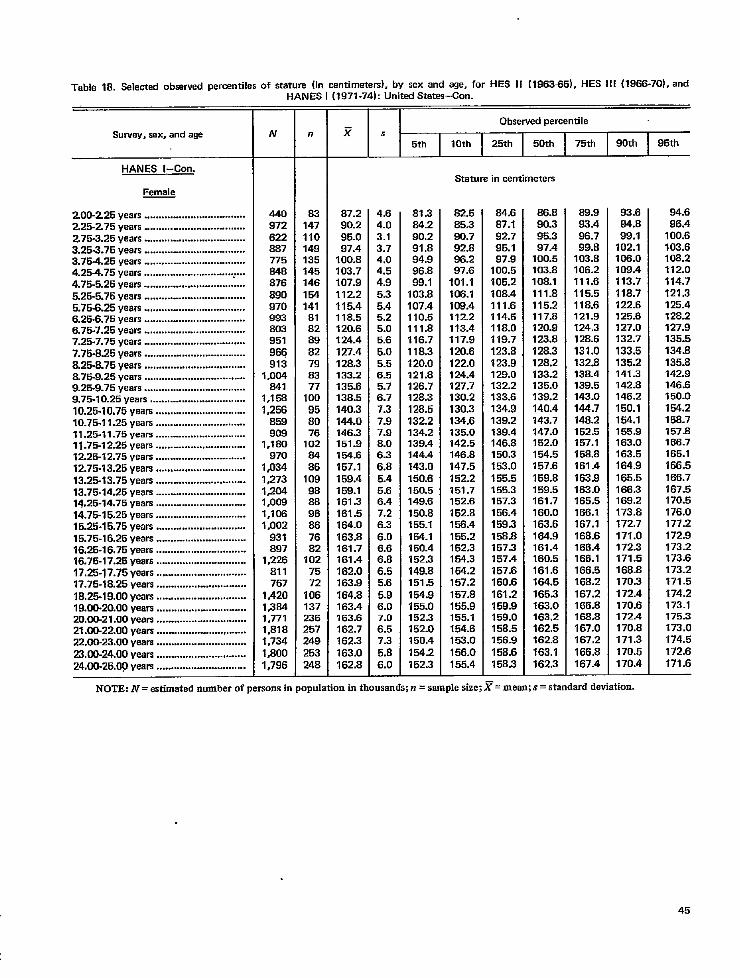
Table 18. Selecmd observed percentiles of stature (inHANES
Smvey, sex, and age
HANES l–Con.
-
200-2.25 years ...................................225-2.75 years ...................................275-3.25 years ...................................3.25-3.75 years ...................................3.75-4.25 years ...................................4.254.75 years ................................ ...4.75-5.25 years ...................................5.26-5.75 years ...................................5.75&25 years ...................................6.25.6.75 years ...................................6.75.7.25 years ...................................7.25.7.75 years ...................................7.75-8.25 years ...................................8.25-8.75 years ...................................6.75-9.25 years ...................................9.25-9.75 years ...................................9.75-10.25 years . . . . . . . . . . . .. . . . . . . . . . . . . . . . . . . . .
10.25-10.75 yIXIE ...............................10.75-11.25 years ...............................11.25-11.75 years . . . . . . . . . . . . . . . . . . . . . . . . . . . . . . .
11.75-12.25 years ...............................12.25-12.75 years ...............................12.75-13.25 years ...............................13.25-13.75 years ...............................13.75-14.25 years ...............................14.25-14.75 years ........................... ....14.75-15.25 years ...............................15.25-15.75 years ...............................15.75-16.25 years ...............................16.25-16.75 years ...............................16.76-17.26 vears ...............................17.25-17.75 years ...............................17.75-18.25 years ... ............................18.25-19.00 years .............. .................19.0(X20.00 years ...............................20.00-21.00 years .............. .................21.00-22.00 years ...............................22.00-23.00 years ...............................23.00-24.00 years ...............................24.00-26.00 years ...............................
N
44097262288777564a87689097099380395196Q913
1,004641
1,1581,256
859909
1,180970
1,0341,2731,2041,0091,1061,002
931697
1,226811767
1,4201,3641,7711,8181,7341,8001,796
n
—
8314711014913514514615414161826982798377
100958076
1026485
109988896867682
1027572
106137236257249253248
entimeters}, by sex and age, for HES II [196365), HES III (1966-70), and:1971-74): United States-Con.
IFs
87.290.295.097.4
100.8103.7107.9112.2115.4118.5120.6124.4127.4128.3133.2135.6138.5140.3144.0146.3151.9154.6157.1159.4159.1151.3161.5164.0163.8161.7161.4162.0163.9164.8163.4163.6162.7162.3163.0162.8
4.64.03.13.74.04.54.95.35.45.25.05.65.05.56.55.76.77.37.97.88.06.36.85.45.66.47.26.36.06.66.86.55.65.96.07.06.57.35.86.0
Observed percentile
5th 10th 25th 50th 75th 90th 95th
81.384.290.291.894.996.899.1
103.8107.4110.5111.8116.7118.3120.0121.8126.7128.3128.5132.2134.2139.4144.4143.0150.6150.5149.6150.8155.1154.1150.4152.3149.8151.5154.9155.0152.3152.0150.4154.2152.3
Stature in centimeters
82.585.390.792.896.297.6
101.1106.1109.4112.2113.4117.9120.6122.0124.4127.7130.2130.3134.6135.0142.5146.8147.5152.2151.-i152.6152.8156.4155.2152.3154.3154.2157.2157.8155.9155.1154.6153.0156.0155.4
84.687.192.785.187.8
100.5105.2108.4111.6114.6118.0119.7123.8123.9129.0132.2133.6134.8139.2139.4146.6150.3153.0155.5155.3157.3156.4159.3158.6157.3157.4157.6160.6161.2159.9159.0158.5156.9158.6158.3
86.890.395.387.4
100.5103.8108.1111.8115.2117.8120.8123.6128.3128.2133.2135.0139.2140.4143.7147.0162.0154.5157.6159.8159.5161.7160.0163.6164.9161.4160.5161.6164.5165.3163.0163.2162.5162.8163,1162.3
88.993.496.799.8
103.8106.2111.6115.5118.6121.8124.3128.6131.0132.8138.4139.5143.0144.7148.2152.6157.1158.6161.4163.9163.0165.5166.1167.1168.6168.4166.1166.5168.2167.2166.8168.8167.0167.2166.6167.4
93.664.899.1
102.1106.0109.4113.7118.7122.6125.6127.0132.7133.5135.2141.3142.6146.2150.1154.1165.9163.0163.5164.9165.5166.3169.2173.8172.7171.0172.3171.5168.8170.3172.4170.6172.4170.8171.3170.5170.4
94.696.4
100.6103.6108.2112.0114.7121.3125.4128.2?27.9135.5134.8135.8142.8146.6150.0154.2156.7157.8166.7165.1166.5166.7167.5170.5176.0177.2172.9173.2173.6173.2171.5174.2173.1175.3173.0174.5172.6171.6
NOTE: N= estimated number of personsin population in thousands;n = sample size; y= mean; # = standard deviation.
45

Table 19. Selected observedpercentiles of weight (in kilograms), bv sex and aae, for HES II (196335). H ES II i [1966-70). and HANEs I
Survey, sex, and age
~
Male—
6% years ........................................7 years ...........................................7% year5 ........................................8 years ...........................................8% years ........................................9 years ...........................................9% years ........................................10 years .........................................10%year5 ............................ ..........11 years .........................................11!4 years .......... ............................
-
6Zyeam ........................................7 yeas ...........................................734yean ........................................8 years ............................................8X years .........................................9 years ............................................9% years ........................................10 years ..........................................10% years .......................................11 years ..........................................11% years ..... ..................................
~
*
1214years .......................................13 years ..........................................13?4year5 .......................................14 years ..........................................1434yean .......................................15 years ..........................................15!4 years .......................................16 years ..........................................18% years .... ...................................17 years ..........................................17%yeaB .......................................
=
12!4 years ...... .................................13 years ..........................................13% years .......................................14 years ..........................................14% years .......................................15 years ..........................................15% yearn .......................................16 years ..........................................16Zyear5 .......... .............................17 years ..........................................17% years .......................................
N n
,06!,02[,08[97!,00:,03:,02599i,02:91:904
,057,08795:,042,02297192s
,02E916882814
,057,089,041891,011988991981823895850
,068,081967956893917958987774991810
294304327295307312308300297281303
278316287312324294281307263271245
34433732827132631732229325526o239
29131428829o283266253282238275224
Percentilez s
5th 10th 25th 50th 75th 9C7th 95th
Weightin kilograms
21.7623.3024.6726.3627.8728.9931.2032.2933.6336.1238.15
21.4522.7724.4425.3927.4129.4031.5233.5534.9437.6339.81
$2.43*5.4550.3853.6156.8559.31N .5053.6054.1958.4858.65
!6.4218.5650.83i2.23X.3954.8356.86$6.78;7.88i8.53i7.85
3.023.584.064.514.715.356.746.586.327.027.74
3.613.954.314.425.225.777.027.518.058.699.07
9.189.71
11.5712.3612.8611.2410.9012.3210.17I 1.68i 1.45
9.8910.2710.629.77
11.319.49
12.049.77
I1.7712.0910.28
16.8718.4118.9320.6021.4022.2823.4224.2825.4927.9627.87
16.3617.6618.5919.3520.3622.1322.7524.3224.7926.4328.28
30.9531.4236.1238.0339.3043.1417.1147.37$9.8350.15KC.08
31.8835.0136.4838.26!0.58!1.18!1.12!4.5615.0314.5114.79
17.6419.1719.9421.6622.6723.4024.6125.3826.8428.8029.57
17.3518.4619.6620.3621.5523.2324.3425.3426.1428.2o30.13
32.6434.4537.29$0.09$1.52$6.1049.625U.3352.1552.6356.37
35.2337.3918.53tO.28*2.88!4.0814.23t6.6786.7016.5716.88
20.0220.6822.1923.4624.7425.3326.9528.0929.4431.1032.90
18.9818.9121.4122.2223.6825.4o26.7028.1628.6432.0333.30
35.9238.45*1 .3245.33$9.1850.5754.7056,3757,1259.1330.78
39.23$1.55!3.86!6.14!7.07%7.97!8.9750.6350.4150.1551.04
21.4422.6S24.2326.0127.2228.2529.6931.1732.7935.0436.69
21.0922.2923.7524.7226.8528.3730.0131.8134.0336.2337.98
40.7244.2846.6551.3255.3858.3059.68E2.0262,4234.7556.96
45.6146.9548.6451.0452.4053.9154.94E4.8155.2057.1955.61
23.4C25.0326.6C28.4129.7C31.6033.3635.1336.6139.1441.80
23.3524.8826.6727.8729.6431.9034.9737.4839.1441.3945.00
47.2450.6157.2059.5362.7766.5266.6468.86E9.8672.6273.92
52.36K3.5356,5857.6059.8359.8151.0050.4652.66%2.2753.00
25.5C27.5229.4;31.4C34.3E35.7.!39.3339.2441.5e44.1347.75
26.6527.9129.8931.4233.8836,9641.6644.5145.9247.9851.68
55.8456.7266.4459.2271.3274.0076.1977.5978.22BO.64B4.77
59.3352,3153.0253.9157.9556.4672.6639.0170.6874.0659.78
27.4229.4731.6133,753%.8637.9246.0643.4044.5550.9553.09
27,7030,5331.7533.9838.0941.4345,7647,6349.6354.9059.18
58.9762.3471,1877.0378.7576.6663.6286.0881.7386.6791.54
63.6367.6589.8669.2571.7871.4082.6176.6579.3963,4677.96
NOTE: N = estimated number of pewam in population in thousands; n = sample size; ~ = mean;s = standard deviation.
46

,. . . ,, ---- ,. ----.-, ,,-- .. ,. ---.--, ,,, ..,-- .Table 19. Selecmdobservedpercentileso fweight(i
Survey, sex, and age
HANES I
Male—
200-2.25 years ...............................226-2.75 years ...............................275-3.25 years ...............................3.25-3,75 years ...............................3.764.25 years ...............................4.25.4.75 years ...............................4.75-5.25 years ...............................5.25-5.75 years ...............................5.75-6.25 years ...............................6.25.6.75 years ...............................6.76-7.25 years ...............................7.25-7.75 yea= ...............................7.75-8.25 y&31S...............................8.25-8.75 years ...............................8.76-9.25 years ...................... .........9.25-9.75 years ...............................9.75-10.25 years .............................10.25-10.75 years ...........................10.76-11.25 years ...........................11.25-11.75 years ...........................11.75-12.25 years ...........................12.25-12.75 years ...........................12.75-13.25 years ...........................13.25-13.75 years ...........................13.75-14.25 years ...........................14.25-14.75 years ...........................14.75-15.25 years ... ...... .... ...........15.25-15.75 years ...........................15.75-16.25 yea,, ...........................
16.25-16.75 years ...........................16.75-17.25 years ...........................17.25-17.75 yaars ...........................17.7546.25 years ...........................18.25-19.00 years ...........................19.00-20.00 years ....................... ....20.00-21.00 years ...........................21.00-22.00 years ...........................22.00-23.00 years ...........................23.00-24.00 years ...........................24.00-25.00 years ...........................
—
N
419945785857856937674878867,001957,153,053801853892054117192001082128221071018027235837121931212020775067770668703662569595
——
n
—
7715714714615216213514612681796480747464938992S490
103986691S69472898197876398
1351041121079496
10grams},uysexanaage, TOrnta II \la06-mw,nca 111i1300-/ul, ana rwmta t971-74): United States-Con.
PercentileY s
5th 10th 25th I 5oth I 75th I 90th 95th
12.7413.6914.6115.4s16.8517.6716.5520.2621.3121.9224.0024.5126.3726.3628.S330.6533.5733.7736.8739.0641.8543.2745.6150.6354.7157.4756.6960.4563.4166.8569.8S68.5872.2772.9272.4273.8073.5873.9476.3879.07
NOTE: N= estimated number of persons in population M
1.6o1.771.541.762.242.102.502.982.653.483.714.024.523.465.576.397.476.427.448.48I1.408.590.909.4812.28I0.7913.130.941.39
11.27
13.071.716.372.471.982.372.743.484.523.08
cwsar
9.9711.3112.2812.7013.8314.4214.9917.0116.6417.08!8.6216.6319.5121.6719.8922.8324.5526.7728.0028.5330.1132.2932.7436.4638.8042.7241.6244.4245.6651.1654.3250.4256.3454.9655.4055.S652.6555.0259.1660.S7
Weight in kilograms
11.1011.8912.8413.3414.7015.0915.5217.3117.7517.7219.4520.1321.0022.5722.6024.0825.9428.2128.7830.5931.0233.2234.7239.3243.2244.8443.6349.1751.0052.9956.3854.5059.0360.3557.3857.715s.1759.1460.6963.98 I
11.6312.6313.5514.3315.4616.0216.9116.3319.8419.3221.8921.8523.6924,2524.8525.7427.8929.5131.3735.0233.8636.8738.4044.3648.3450.1550.2653.7055.2256.0161.8360.5262.S953.6265.9165.0465.2966.0965.5467.96
12.6713.5314.4315.3916.5417.7118.4719.8821.2121.6623.7024.5125.4225.5127.5329.5832.6432.4036.3637.9439.0342.9243.2449.4851.7855.5654.8058.3761.6266.1967.9256.1968.9369.8670.5671.9072.1271.7774.7179.37 I
14.0514.5715.3416.4817.8519.1720.2221.3922.6623.7526.1726.3528.9328.7031.9333.8638.4736.1840.1442.0846.1547.8749.4356.6661.6263.1380.6367.2769.9974.6874.2976.5776.7576.6776.4378.4480.9679.66S2.44B5.69
14.8515.6916.3917.7718.8720.4521.0223.2124.5127.0730.3529.1731.5131.6638.5337.8641.6739.8545.1547.4655.6253.4058.4962.2867.4773.1468.9574.4375.8983.1982.9083.1490.0292.6687.0188.8689.0590.5794.0597.61
15.4716.8017.s718.6320.6221.5122.5925.3226.1728.7231.3732.9034.8332.9140.8745.0143.6351.7352.7152.4063.8855.9266.8465.1376.6375.0576.4879.3486.1988.5196.o892.8595.4099.6196.4894.8496.1496.93
105.35103.19
47

Table 19. Selected obsemedpercentiles ofweight tin Klograms), by$exand age, for HESll(19~%5], HESllf(1966-70), and HANESl
Survey, sex, and age Iv
HANES l–Con.
Female
2.00-2.25 years ...............................2.25-2.75 years ...............................2.753.25 years ...............................3.253.75 years ........... ....................3.754.25 years ...............................4.25-4.75 years . ... .......... .............4.75-5.25 years ...............................5.25-5.75 years ...............................5.75+5.25 years ...............................6.25-8.75 years ...............................6.75-7.25 years ...............................7.25-7.75 years ...............................7.75-8.25 years ...............................8.25-8.75 years ...............................8.7S-9.25 years ...............................9.25-9.75 years ...............................9.75-10.25 years .............................10.25-10.75 years ...........................10.75-11.25 years ...........................11.25-11.75 years ...........................11.75-12.25 years ...........................12.25-12.75 years ...........................12.7!3-13.25 years ...........................13.25.13.75 years ...........................13.75-14.25 years ...........................14.25-14.75 years ...........................14.75-15.25 years ... .... ........... .....15.25-15.75 yearn ...........................15.75-16.25 years ...........................16.25-16.75 years ...........................16.75-17.25 years ...........................17.25-17.75 years ...........................17.75-18.25 years ...........................18.25-19.00 years ...........................19.00-20.00 y,,,, .......... .................20.00-21.00 years ...........................21.00-22.00 yaar. ...........................22.00-23.00 years ...........................23.00-24.00 years ...........................24.0W25.00 years ...........................
440972622887775648876890970993803951966913
1,004641
1,1581,256
859909
1,180970
1,0341,2731,2041,0091,1061,002
931897
1,226811767
1,4201,3841,7771,81SI ,7341,8001,796
—
n
—
83747lla148135145146154141S1828982788377
100958076
102S486
109968696S67682
1027572
106137236257249253248
(1971-74): United States–Con.
Percentilex s
5th 10th 25th 50th 75th 90th 95th
Weight in kilograms
12.1912.9314.4814.8715.8816.6418.0719.5720.9921.7322.2424.1428.3226.6430.8431.1532.6234.2037.5639.0444.8946.0248.8852.S751.7656.3455.20!%.9456.7357.6157.9558.4459.8258.3160.0858.7060.0S60.7561.0461.27
1.461.4E1.781.751.842.182.393AI4.043.232.813.744.884.597.025.116.416.537.978.65
11.01S.62
10.7711.3711.9112.1s10.9011.2511.9112.5111.4917.2110.1010.2213.2110.1611.1013.6914.3513.74
10.OE10.7712.1412.2s13.1313.4514.3315.1s16.4417.le17.7018.7220.5320.3622.2523.9424.3525.8727.0026.6330.4532.6333.2538.5837.4341.1141.1346.0443.2342.9943.5242.7748.3344.8348.6544.4045.0s42.S645.5946.65
10.6E11 .2C12.4[13.0213.6314.OE15.2116.2C16.9917.8?18.6119.4221.1s21.2323.1325.3225.1827.2628.4228.8833.7334.6136.3540.1239.5743.5843.0746.9844.ss44.5944.s743.9649.9545.8946.8347.2348.5446.1947.7748.13
11.4111.9813.1213.5614.5115.0416.4877.4718.1419.0520.3621A422.7122.8925.1527.1227.8929.7932.1632.2836.7639.6241.3646.3044.9047.5646.5449.4648.7547.6550.7450.1154.1051.0251.6251.7052.1551.3552.1652.06
12.2112.7E13.9214.6[15.6E16.5717.7318.9:20.3421.0322.0623.7324.S726.0329.5130.4831.4832.5336.0537.9641.9445.5347.0950.8649.4453.8052.6956.7654.7454.5556.4954.4458.3256.9757.2457.2258.3658.8259.875S.6S
12.8613.9415.6115.9317.1517.7819.6620.9622.2323.9823.5326.6727.8929.3434.0334.1535.5437.0342.9544.1952.0150.7155.6957.1855.6262.3059.4561.4462.9563.2562.2959.9062.5463.1663.4663.9464.6467.36 I64.6466.33 ~
13.8414.7416.8417.5418.2219.3521.2323.4425.0526.7325.4S29.3033.4133.3841.3338.3541.9445.8147.3950.8684.0456.6262.0670.6667.4870A073.8367.8367.3073.117’I .5674.0168.8672.6376.3372,1572.8875.5472.8077.17
14.5715.0917,7418.2818.9420.2622.1025.0128.8728.0227.o131.2838.2335.1943.5542.0945.2247.9853.6o57.6o70.1761.7666.s077.7575.7688.1975.5275.577s.4488.2584.4890.6978.2178.7o83.4875,s981.7785.3584.6286.04
NO~:N=estimated number Ofpersons tipopulation intbo"s~ds; n=smple size;~=mean; s=standard deviation,
46
APPENDIXES
CONTENTS
L GIowth Cbds .............---------------.........................................................................................................
ff. Technical Notes ...................................................................................................................................Pooling of Data ..............................................................................................................................Splining ..........................................................................................................................................SmoothiigWith the Pearson Distribution System .........................................................................
APPENDIX TABLE
I. Memmdmafimm residtis fiomseven obsmedpercenties ofwti@t bystatie wing twodtema-tive knot selections for boys ages 2-1S years .....................................................................................
1.
If.
m.
Iv.
v.
VI.
VfI.
VIIf.
Ix.
x.
Xf.
ML
XlIf.
Xfv.
xv.
XVI.
XVIL
LIST OF APPENDIX FIGURES
k@hbyagepercentiIesforg irlsaged birth-S6montbs ............................................................
kngtb by age percentiles for boys ased birtb-36 months ...........................................................
Weight byagepercendles forgirfs aged birth-36 montis .............................................................
Weight by age percentik for boys aged birth-36 months ............................................................
Head circumference by age percentiles for girlsaged birtb-36 months .........................................
Weigbtby lengtbpercentiles forgirls aged birtb-36 months ........................................................
Head circumference by agepercentiles for boys aged birtb-36 month ........................................
Weigbtby length percendles for boysaged birtb-36montbs .......................................................
Statureby age percentiks for sMs aged 2 to 18 years.................................................................
Statureby age percentiles for boys aged 2 to 18 years..................................................................
Weight by age percentiles for girls aged 2 to 18 years. ..................................................................
Weight by age percentiles for boys aged 2 to 1S years ..................................................................
Weigbtby statue perceniik sforpre+ubescen tgirls....................................................................
Wcightby statumpercentiksf orprepubescentboys ...................................................................
Observed percentiles of stature by age for males of HIM fl (6-11 years), HIM III (12-17 Years),
and HANES I (6-17 years): United States ................................................................................
Observed percentiks of stature by age for females of HES If (6-11 years), HES JIf (12-17years), and ffANES I (6-17 years): United States .....................................................................
Observed percentiles of weight by age for makesof fIES 11(6-11 years),HES IfI (12-17 yearn),and HANES I (6-17 YWWS):United States ................................................................................
51
64646971
71
52
53
45
55
56
56
57
57
5s
59
60
61
62
63
65
66
67
49
XVHI. Observedpmcentilesof weightby agefor femafesof f18S If (6-1I yearn),HSSDI(12-17 years),
XIX.
xx.
XXI.
andHANES I (6-17 yet+l’S.):UnitedStates ......... ....................... . ..................... ...................... 68
Observedpercendfesof weightby staturefor prepubesxxntmales2-11.5 years: Dataandstatis-tics from NationalCenterfor Heafth.%adstics................ ......................................................... 70
Smoothedpmcemilesof weightby staturefor prepubescentmales2-11.5 y-: Dataandstatis-tics from NationaICenterfor HeakhStatistics............................................"................"...."".. 70
Observedand smoothed percendfes(usingtbe Pearsondistributionsystem) of staturefor mafes6-18 years,by age: UnitedStates ........Z~ ....... ........................................................................ 74
..’,, .
50
. .. .
APPENDIX I
GROWTH CHARTS

NATIONAL CENTER FOR HEALTH STATISTICS
Ln
0
m0
00
00)
m(0
U-Jw
0U-J
L!
Figurel. kngthby agepercentiles forgirls aged Wtih46mo”ths.
L
o 3 6 9 12 15 18 21 24 27 30 33 36
AGE IN MONTHS
-1“*
52
,

NATIONAL CENTER FOR HEALTH STATISTICS
Ln
o
m0
00
mm
om
Inm
0(D
Lo10
010
u)C9
Figure 11. Length by agepercentilesfor boys aged birth<6 months.
. ,:
95TH
90TH/ ‘/
1
0 369121518 212427303336
AGE IN MONTHS
*mb
*’cd
m
wa‘h
cd(nA
tocdh
-4
-J
$Al
03
53

NATIONAL CENTER FOR HEALTH STATISTICS
Figure ill. Weight byagepercentiles forgirls aged binh46 months.
m
h
(0
!0
*
m/ /
’25 TH—
N
/
/ .loTH_.
5TH
//
c1Yo . /
g- /
+1mmG { /
3
h K/ // /4 ‘“al
F-
Co
U-J
*
r)
N
0 3 6 9 12 15 18 21 24 27 30 33 36
AGE IN MONTHS
1
wOY
i-n
a
pm
mm
W
b
54

m
c1
cd
m
=$
cl
cd
NATIONAL CENTER FOR HEALTH STATISTICS
Figure IV. Weight by,agepercentiles for boys aged Mflh36montis.
G1
-4
a
m
N“ s
~Gl.1
0-0
&lor-n
-J
m
mN
0
mm
0CD
&
o 3 6 9 12 15 18 21 24 27 30 33 36
AGE IN MONTHS
55

NATIONAL CENTER FOR HEALTH STATISTICS
●
cdm
0U7
Nccl
Figure V. Head circumferencebyagepercentiles forgirls agedbfih36 months.
AGE IN MONTHS
o 36 9 12 15 18 21 24 27 30 33 36
. .75 TFL
50 55 60 65 70 75 ao 135 go 95 100 105 110
LENGTH IN CM
Fi9UreV1. Weight bylengtb percentilesforgirls aged tinh36mo"ths.
NlN
FJo
m
m
m
m
w
56
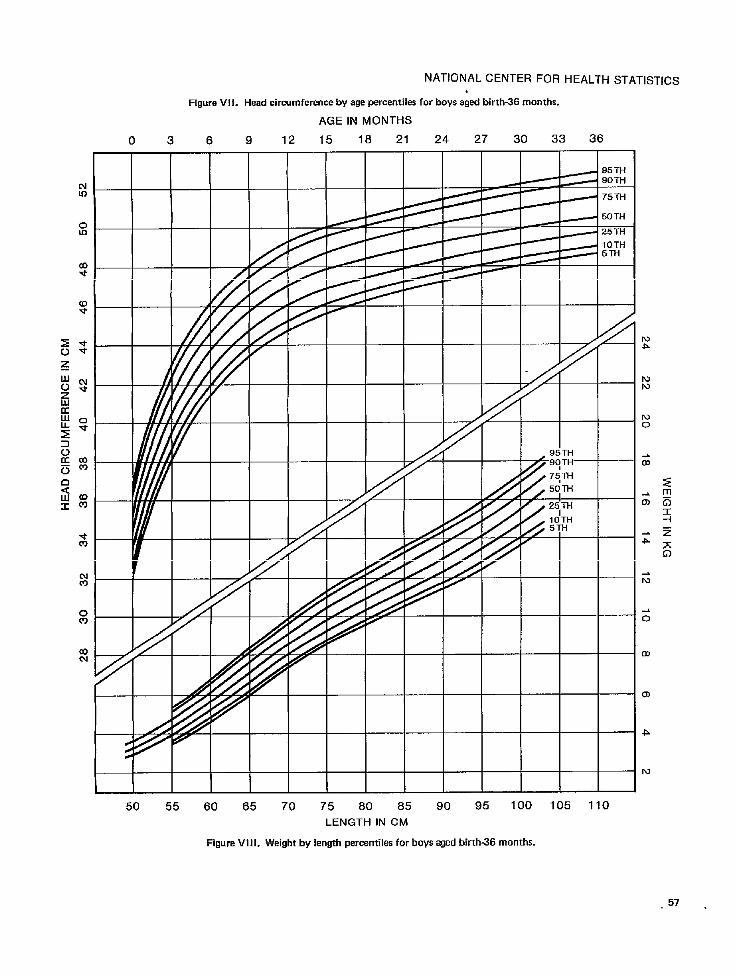
NATIONAL CENTER FOR HEALTH STATISTICS
Nu-l
oU-J
cl*
co-4’
Figure V1l. Headcircumference byagepercentiles for boysaged brth-36 months.
AGE IN MONTHS
03691215 182124273033 36
95TH90TH
I1
.
#
I’d0
03
N
o
m
m
.b
N
50 55 60 65 70 75 80 85 90 95 100 105 110
LENGTH IN CM
Figure Vlll. Weight by Iengthpercentiles for boys agedbimh46 months.
,57 .
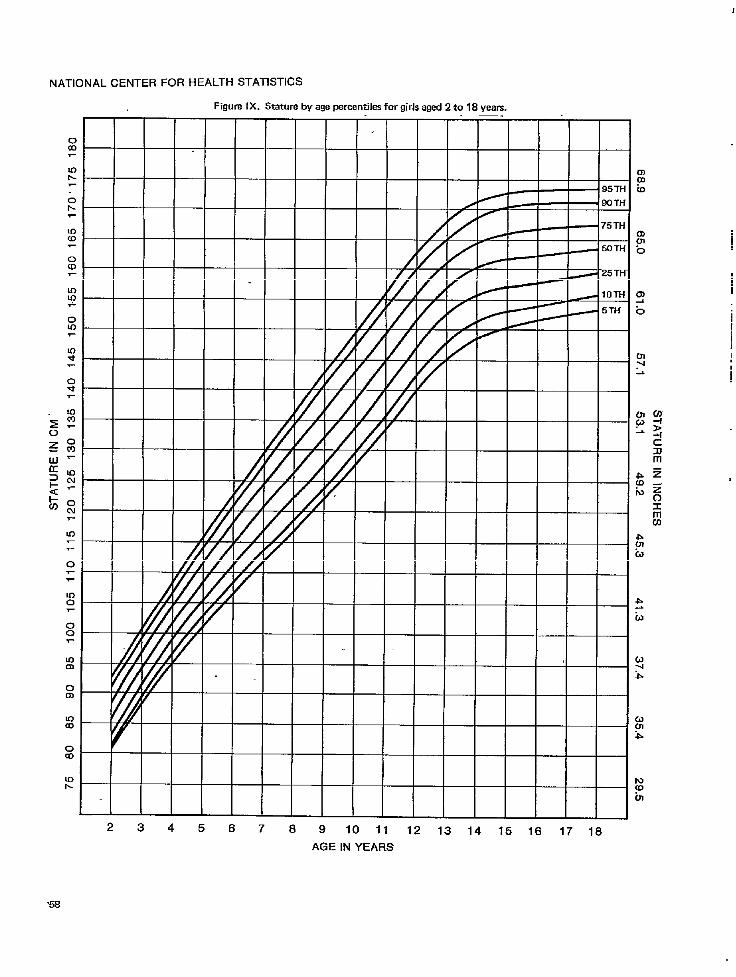
I
NATIONAL CENTER FOR HEALTH STATISTICS
Figure IX. Smtumby agepercentilesforoirlsaaed2to 18wms.—.
z 1 I I I I I I I I
m
In
0
Ln0
00
0m
law
0a
{
23456789 10 11 12 13 14 15 16 17 18
AGE IN YEARS
mmw
UJ
“0
muL
UJ>+cRm
IQw07
1
I
I
i
.5s

NATIONAL CENTER FOR HEALTH STATISTICS
:
m
o
mo
00
mm
0m
Figure X. Stature byagepercentiles for boysaged 2to18years.
. 95TH
I I I I I I I
23456789 1011 12 13 14 15 16 17 18
AGE IN YEARS
I II I I II
I
-J*b
-40
b
0)m?0
$.-J
iv
CJw-$
cd
in
59
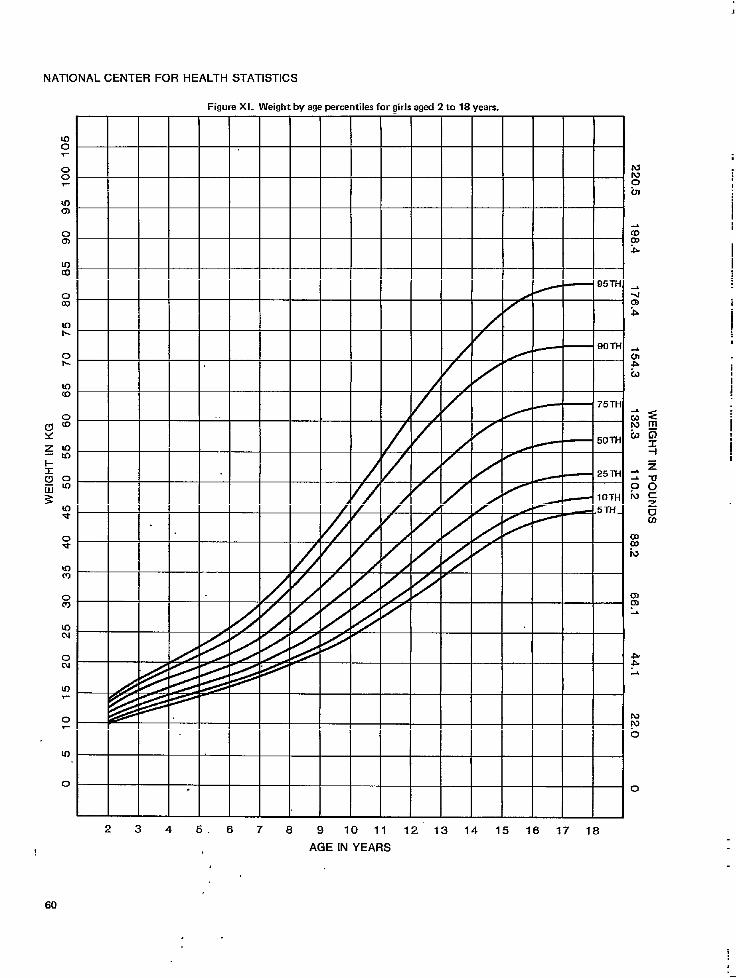
NATIONAL CENTER FOR HEALTH STATISTICS
100
00
U-J0)
0Cn
002
!0t.
0r.
IOu)
10
0
u-)
0
Figure Xl. Weight byagepercentiles forgirlsaged 2tolSyear.s.
wwoh
0m&
. 95TH -# ~ -1
m
/ Y
b
/ ‘90TH *
/ “ m+
/ ‘cd
~ ,< ;spg
/_ ~oTH co:
/ -
{/ +
25TH :z
y J {0;
/ 1oTH NC
5TH_z
/ ‘/ ‘ / /
u0)
/1/1 I 75TH
I /1 1 1 1 I 1 1 1 v , 1 1 ,
gw
(nmL
*.sL
& < _ _ _ _ _ _ _
mpo
0
I
I
I
i
,I1
1
i
234 5.6789 10 11 12’ 13 14 15 16 17 18
AGE IN YEARS
60

NATIONAL CENTER FOR HEALTH STATISTICS
Figur& Xl 1. Weight by age percentiles for boyq aged 2 to 18 years.
0
>.
~
.0w
0N
in
10, 95TH
UI
0m
Mlm
z
Inr-
E
m
U)u)
(!s0X(O
g
i-:xg
$$
m
:
0* h
Illm
0)
z L
:
0*
CiaL
In
0mp
0
U-1
0 0
23456789 10 11 12 13 14 15 16 17 16
i AGE IN YEARS
61
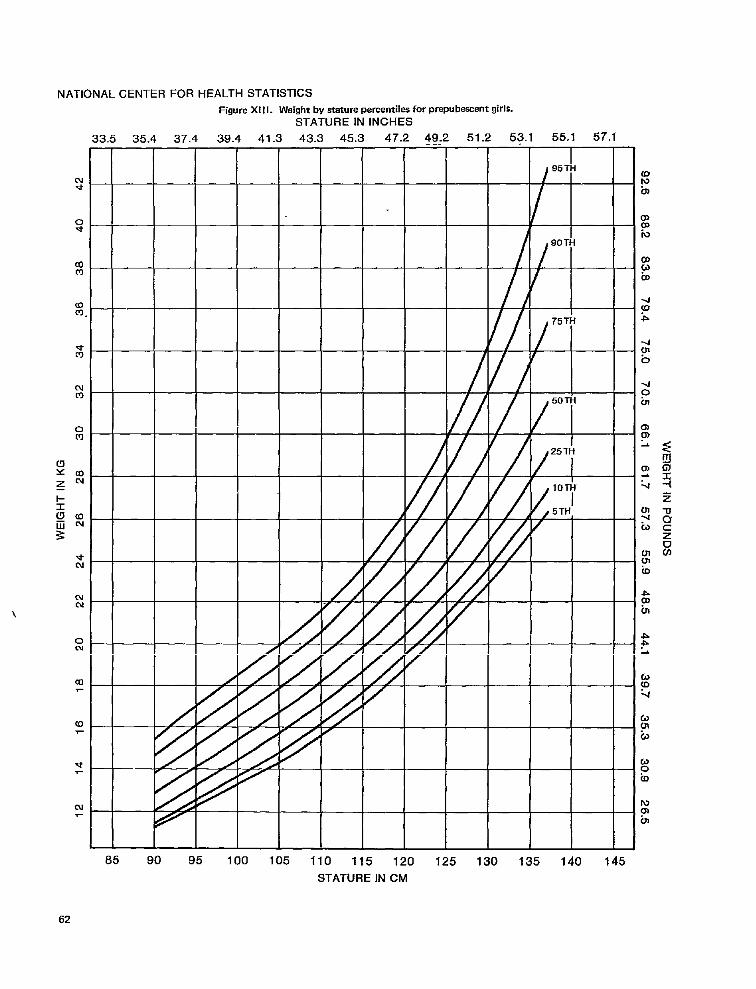
mm
N03
0m
\
oN
NATIONAL CENTER FOR HEALTH STATISTICS
Figure Xl Il. Weight bystature percentiles forprepube%entg iris.STATURE IN INCHES
33.5 35.4 37.4 39.4 41.3 43.3 45.3 47.2 49,2 51.2 53.1 55,1 57.1
Ne
0*
90 TH
/ ‘
75 TH
I
/ 25TH
(5Ym~N I
$Clal )❑ ml
3
-+N
/
NN
m /
w
/
-1
N
w10b
coCJto
6mL)
Caob
85 90 95 100 105 110 115 120 125 130 135 140 145
STATURE IN CM
62
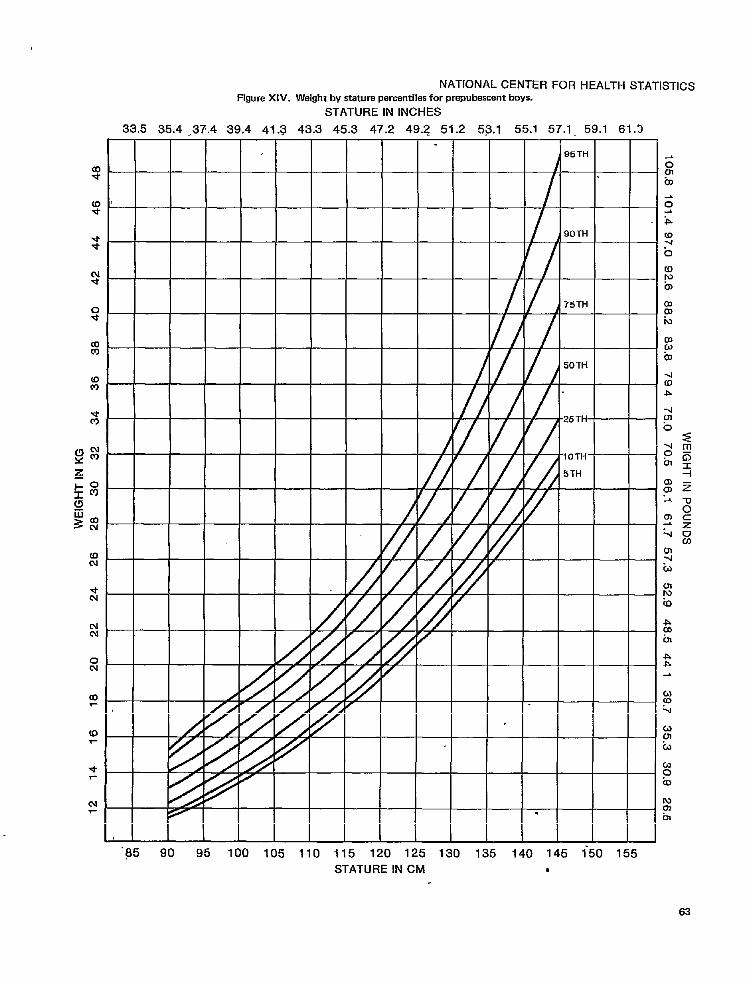
o*
03m
ccl
N
NATIONAL CENTER FOR HEALTH STATISTICS
Figure XIV. Weight bvstature percentiles forprepubescent boys.
STATURE IN INCHES
33.5 35.4 37.4 39.4 41.3 43.3 45.3 47.2 49.2 51.2 53.1 55.1 57.1 59.1 61.3
“85 90 95 Ioo 105 110 115 120 125 130 135 140 145 i50 155
STATURE IN CM .
63

APPENDIX II
TECHNICAL NOTES
Pooling of Data
As noted earlier, the NCHS data sets in the
age range 2-24 years were pooled, and theobserved percentiles were weighted to representthe U.S. population. Originally, there were threeseparate data sets; all have been described inearlier NCHSpublications.$8 The data collectedin Cycle II of the Health Examination Survey(HES) represent the U.S. population, aged 6-11years. The data collected in HES Cycle Ill repre-sent the U.S. population, aged 12-17 years.Finally, that data collected in Cycle I of theHealth and Nutrition Examination Survey(HANES) represent the U.S. population, agedbirth-74 years. Thus, the population segmentaged 6-17 years is essentially doubly repre-sented.
A number of considerations prompted themerging of the three data sets and the subse-quent reweighing of combined statistical esti-mates. By far the most important was the desireto stabfize the extreme percentiles; these statis-tics are vulnerable to the effects of outliers ifunusually large statistical weights are associatedwith the outliers. Thk phenomenon wasobserved particularly in the HANES I data; forexample, one subject represented over 5 percentof the U.S. population of 20 Yi-year-old females.The simple addition of more cases (with asso-ciated sample weights) normally will mitigatethe effects of such unusual situations.
A second very important consideration wasthat of timeliness. The fjrst two data sets werecollected from 1963 to 1970. Although they
NOTE: A list of references foflows the text.
are some of the best population data ever col-lected in thk fieId, it was felt that the additionof the third data set would guarantee that anymends present could be detected and reported,Conversely, if no trends were detected, thiscould be reported as well.
This examination for trends actually pre-ceded the generation of the spline curves. Mostof the work is summed up in tables 18 and 19and figures XV-XVIII and represent raw data.The small stature differences detected suggestthat no secular trend toward greater stature ispresent except in the 5th and possibly 10th per-centiles. The body weights show a very slight up-ward shift of the entire distribution, but foronly one line was the shift statistically signifi-cant. Since the similarities far outweighed thedifferences, the merged data sets would providepercentiles much like those of the original datasets.
On the other hand, it could be argued thatthe inclusion of the two eadier data sets, if theywere quite similar to the later data set, was re-dundant, and the estimates need be based ordyon the most up-to-date data. However, the datasets are of unequal quality, due to differences inthe designs and response rates of the three sur-veys. Cycle II had the best response rate, about,95 percent, and Cycle III had the second best,about 90 percent. Unfortunately, the HANES Iresponse rate dropped to barely 74 percent. Inaddition, as a result of the survey design, theHANES I sampling weights are far more variablethan those of either HES If or HES III; thehighest sampliig weight is sometimes more than40 times the lowest. This is particularly unfortu-nate for the estimation of percentiles, where, as
a4
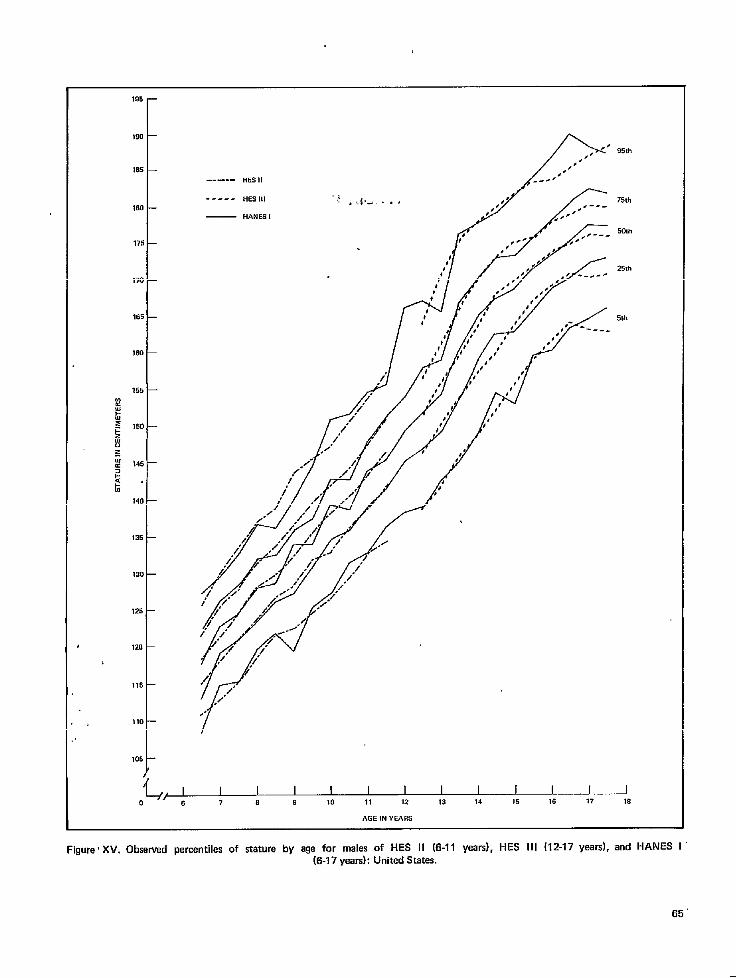
195 —
190
185 —
lBO —
175 —
170 -
165 —
160 —
155 —
2
~
% 150 —
&
“~
# 145 –
~
k“
140 —
135 —
I 30 —
126 —
120 —
115 —
110 —
105 —
/
L’1 I I I I I I I I I I I I0 “6789 1011121314 15161718
AGE IN YEARS
Figure’ XV. Observed percentiles of stature by age for males of HES II [6-11 years), HES III (12-17 years), and HANES I(6-1 7 years): United States.
65

1S5
F
.
19D
185
1.
. . . . . . . . . . . . . . . . . HES 11
180 : _____ ~ESlll
175
170
165
103
155
:
;
~ %50
:“~
145&.
z6 ,40
135
130
125
120
115
110
,._ H*Nn,
,/
-..
)105
0G, 1 I I I I I I I i I I I I678 9 10 11 12 13 ,4 ,5 ,6 ,7 IR
AGE IN YEARS
Figure XVI. Obwrved percentiles of stature by age for females of HES II 16-f 1 fears), f4ES III (12-f 7 years), and HANES I
..- [6-1 7 yea!s): United States.,,, .
66
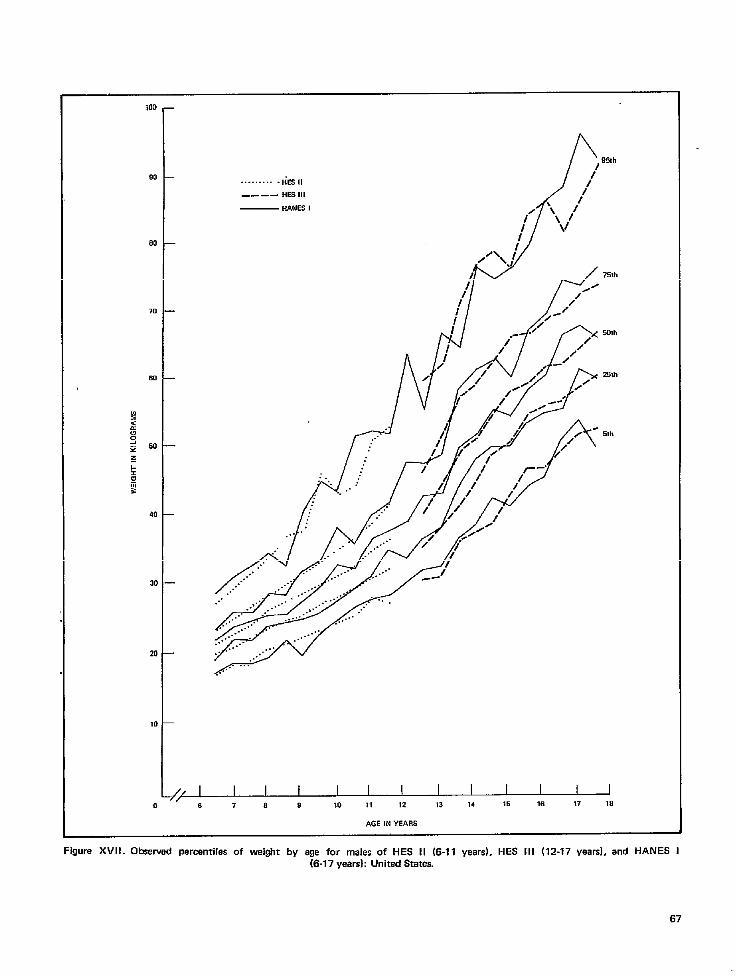
100
90
80
70
80
40
30
20
10
0
.. .. .HESII—--— HES Ill
— HANES 1
P,)95[h
/’
/i’
..
v I I I I I I I I I I I I 1678910 1112131415 161718
AGE IN YEARS
Figure XVI 1. Observed percentiles of weight by age for males of H ES II (6.11 years), HES III (12-17 years], and HANES I
(6-1 7 years): United States.
67

la
x
8(
6(
40
30
20
10
0
---- HES 11
---- HES [l,
— HANE5 1
AGE IN YEARS
Figure XVI 11. Observed .per~ntiles of weight by age for fe~~les of HES II (6-II years), HES III (12-17 years), and HAffES I
(6-17 years]: United States.

noted, single very heavily weighted cases coulddistort the more extreme percentiles.
In summation, there was very little to argueagainst the merger of the three data sets, and agreat deaf to argue in favor of it. The three datasets, with their original sample weights, wereliterally concatenated into au overall data set of20,749 subjects. The percentiles were computedwith the original sample weights intact, butwhen reported, the sums of the statisticsweights were reduced by half to return to anapproximation of the U.S. population.
Splining
As described in the body of this report,splining is a mechanism used to fit curves to abody of data in such a way that no discontinni-ties (i.e., disjunctions or sharp angles at junc-tions) exist in the final curves. Splining isparticularly useful in smoothing data that couldnot be fitted well with a single equation of rela-tively low degree, say, no more than cubic. Inother circumstances an optimum fit may beachieved by the sp~me technique where theresearcher is either unsure of the exact biologicphenomena underlying the relationship of thedependent and independent variables, or is notinterested in mathematically describing thatrelationship in a way that makes biologic“sense.” Another benefit, and it is one very sig-nificant for our purposes, is that the spl.iningmechanism can fit curves to data that reflectalmost any relationship (e.g., exponential, J-shaped, etc.), and that the researcher can achievea certain degree of “commonality” between vari-ous percentiles of a given data set by specifyingcommon parameters. Finally, the capacity to setthese parameters as they seem most effectivesomewhat frees the researcher from slavishobedience to results generated by a nondiscrimi-nating computer.
In order to illustrate the technique, the pro-cedure which generated a single graph, that ofweight by stature for males aged 2-11.5 years,will be described. The same procedure was usedin all the other cases, each differing only in par-ticulars.
The first step was to generate percentiles ofweight by stature (2-centimeter intervals of
stiature for this example), and these values canbe found in table 8. These statistics wereweighted to represent the U.S. population when-ever NCHS data were used, a decision dkcusseclin the previous section. The seven observedpercentile lines were then plotted (figure XIX):and the graph was inspected to estimate thelocation and number of points called “knots.”
These knots are deflmed as the beginningsand ends of sections into which the originalcurve is broken. N-degree equations are thenindividually fit to these sections by the leastsquares method, with the additional constraintsthat, for all contiguous sections, the functionsand their n- 1 derivatives must agree at the knot.It is in the selection of these knots that the re-searcher’s experience and prior knowledge ofthe phenomenon under consideration is themost helpful, but even then, some general rulesare applicable. Given the large number of curvesto be fit, and knowing growth to be a fairly“smooth” function, the authors always strove touse as few knots as possible, consonant with agood fit. Beyond this, knots were chosen wherethe curve showed the most change (i.e., where ,the second and third derivatives changed sign),and at endpoints. In the last case, since thefitted curves were least stable near the ends,data points beyond that eventually publishedwere generated and fit whenever possible andthe curves truncated to the last point of interest.
The program used for this fitting containedan optional routine for automatically varyingthe knot locations from those originally speci-fied to optimize the fit. Unfortunately, theresults obtained were somewhat erratic and notbiologically meaningful. The reduction in meanresiduals achieved was far too slight to justifythe use of this somewhat mindless method.
Returning to the example, knots werechosen as in column 1 of table I. The fittedcurves were generated and plotted; the observeddata points were then overIaid on this plot (fig-ure XX). Quantitative assessments were made ofthe mean and maximum residurds (a residual isthe difference between an observed and a pre-dicted value), and a qualitative assessment wasyade of the plot. The major consideration ofthe latter evaluation was the absence of any sus-tained but local over- or underestimations. In
69
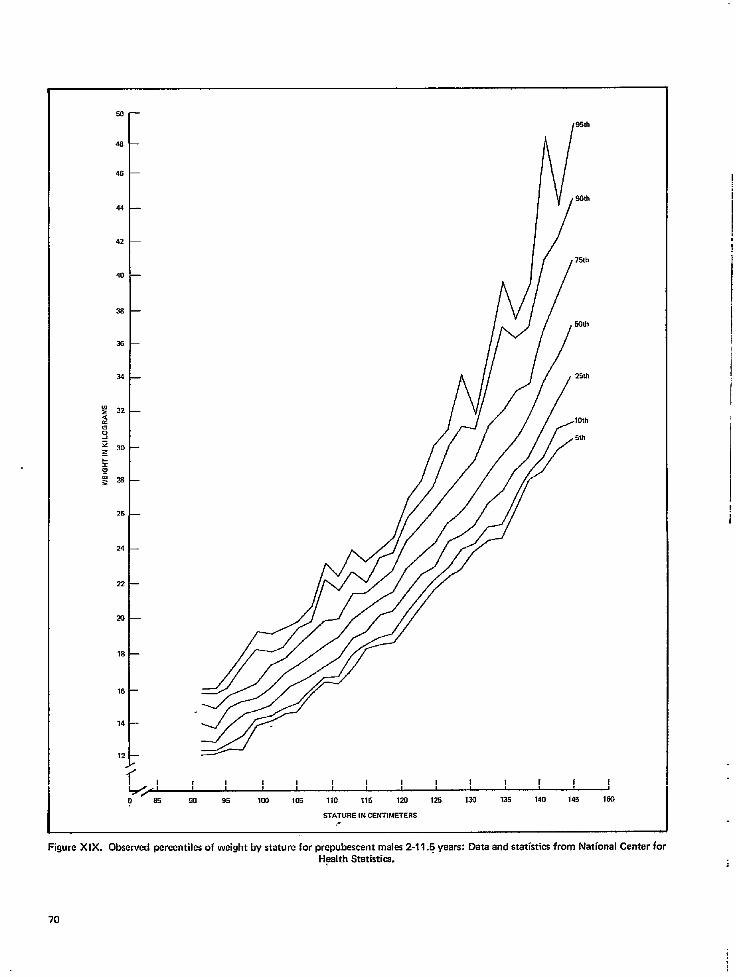
54
48
46
44
42
40
38
36
34
‘+ 32
:
:
: 30
c
$
$ 28
26
24
22
2.3 —
18 —
16
14 —
12
,
,95th
L/ I I I 1 I I I I I I I I iD 85 90 95 100 105 110 115 120 125 130 135 140 145 lEfJ
STATURE IN CENTIMETERS
Figure XIX. Obsewed percentiles of weight by stature for prepubescent males 2-11.5 vears: Data and statistics from N~~Onal center forHealth Statistics,
70

Table 1. Mean and rn-aximum residuals.. from- seven obs6wedpercentiles of weight by ststure using two alternative knot
selections for bow ages 2 to 18 years
Percentile “MaxI- Maxi-
Mean mum Mean mum
I 1 1
Residual in kilograms
0.27
L
0.920.24 0.850.21 0.730.21 0.680.30 1.450.52 2.110.91 5.16
0.27 0.950.24 0.940.21 0.680.22 0.900.29 1.510.55 2.360.82 5.22
lLocidion of three knot selections in centimeters.
thk instance there were none, but the antici-pated relationship between mean residuals andpercentiles was observed here and for all thegraphs. That is, the mean residuals were alwayssmallest for intermediate percentiles (25th and50th), larger for the lower percentiles (5th and10th), and largest for the higher percentiles. Thisresult is no more than a reflection of the varia-bility of the respective observed percentdes.
In an attempt to improve the fit, the fittingand evaluation procedure was duplicated withbe knots as indicated in column 2. The moststriking result was seen in the similarity of theresidual values, with only one of the seven pairsof mean residuals differing by more than 0.01kilograms. In general, however, the second’kttempt was less successful than the first, andsubsequent attempts were no more successful.
This procedure was repeated for each of the”14 charts. On a few occasions arbitrary decisions. .were made concerning at what point to termi-nate a chart (e.g., the endpoint of the weight-by-recumbent-length charts), and in these cases thedecision was based on information concerningphe relative strength of the data and on relevantphysiological information (see text). Other thanthat, the published curves are literally copies ofthose generated by the computer.
Smoothing With the Pearson - .”Distribution System
‘ - Fitting equatioris ~,~oown’ ri&t.45 For even
,,
data is a study in its ~ ‘the simplest problem,’ ‘
that:of the two-dimemiond case, care must be.exercised in fulfiig assumptions and avoidinggrievous oversights. For the data rkported herelseveral considerations compounded this diffi-Cuky.
The most important of these was a desire toachieve some “commonality” or “parallelism”between the seven curves that appear on eachchat. Certainly a relationship exists betweenany two percentile lines, and since the samephenomenon is being described over the entirerange of the independent variable, this relation-ship might well be constant or vary in a constant’fashion. It was imperative that any fitting sys-tem used either automatically incorporate thisconsideration or allow the researcher to incor:porate it manually.
A second vitally important considerationwas that of flexibility of the fitting system. Ex-perience indicated that, for the variables to be-reported, several different relationshipsobtained. The fitting system had to be equallyeffective against all alternatives. It may havebeen possible to find a class of equations (e.g.,polynomials in age), that fit a particular relation-ship better that splines. However, a systeminvolving several or many types of equations has,at least three disadvantages: (1) Far more humanintervention would have been necessary, therebyreducing objectivity. (2) A far greater expendi-ture of human and computer resources wouldhave been necessary to ensure that the best fitwas achieved for each chart. (3) The characteris-tics of the results would have been variable, de-pending on the type of equation used. For thepurposes of this paper then, a fitting systeminvolving a single type of equation was farpreferable to one that used multiple types.
Finally, but Ie$s importantly, there wereadvantages to. using a system that “resulted inequations that were of a type familiar to mostusers. It is expected that the results reportedhere will be usefnI to persons of very differentmathematical backgrounds, so simplicity isessential. It is also hoped that this simplicity willgive independent researchers the maximum free-dom in evaluating these results and their applica--bility to other populations or subpopulationsi
These considerations did not singularlydicthte the use bf the spline method. In fact, ah
71

,., !, ,,
10)4’ I IO ’85 90 95
I I I I I I I I I I I100 105 110 115 120 125 130 135 140 145 150
STATURE IN CENTIMETERS
Figure XX. Smoothed percentiles of weight by ststure for prepubescent males 2-11.5 years: Data and statistics from National Center foiHealth Statistics.
72
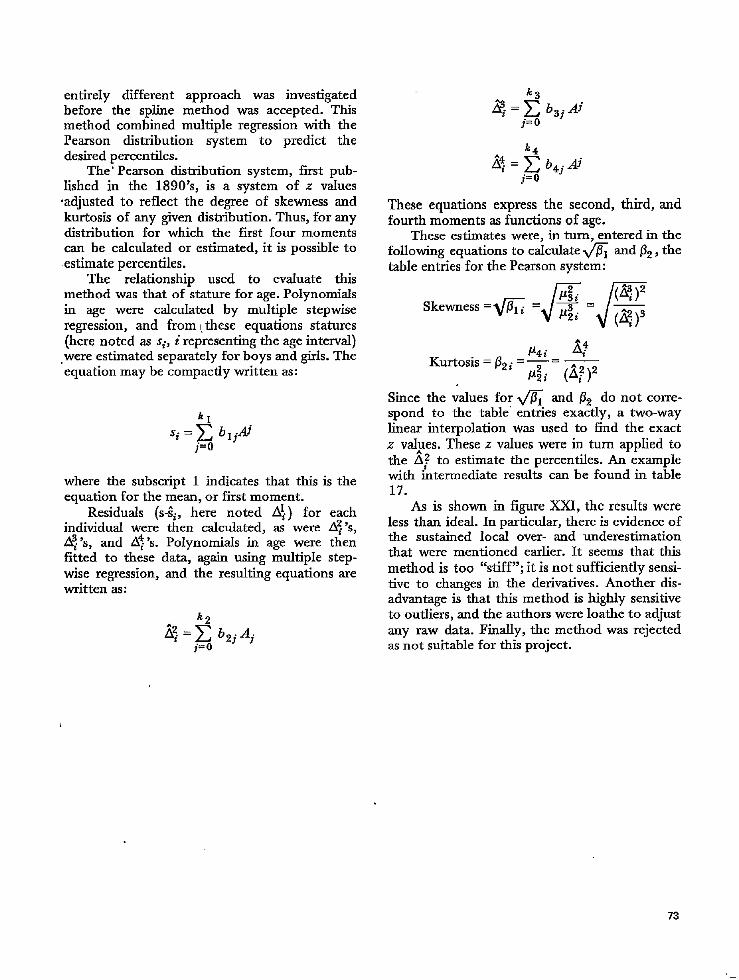
entirely different approach was investigatedbefore the spline method was accepted. Thismethod combined multiple regression with thePearson distribution system to predict thedesired percentiles.
The’ Pearson distribution system, first pub-lished in the 1890’s, is a system of z vafues‘adjusted to reflect the degree of skewness andkurtosis of any given distribution. Thus, for anydistribution for which the first four momentscan be calculated or estimated, it is possible toestimate percentiles.
The relationship used to evaluate thismethod was that of stature for age. Polynomialsin age were calculated by multiple stepwiseregression, and from t,these equations statures(here noted as s,, i representing the age interval)were estimated separately for boys and girls. Theequation may be compactly written as:
where the subscript 1 indicates that this is theequation for the mean, or first moment.
Residuals (s-ti, here noted A;) for eachindividual were then calculated, as were A? ‘s,A? ‘s, and A! ‘s. Polynomials in age were thenfitted to these data, again using multiple step-
wise regression, and the resulting equations arewritten as:
k2
ii:. = ~ b2j Ajj= o
k.
j=o .
These equations express the second, third, andfourth moments as functions of age.
These estimates were, in turn, entered in thefollowing equations to calculate fi and 62, thetable entries for the Pearson system:
Since the values for fi and & do not corre-spond to the table’ enties exactly, a two-waylinem interpolation was used to find the exactz w+ses. These z values were in turn applied tothe A; to estimate the percentiles. An examplewith intermediate results can be found in table17.
As is shown in figure XXI, the results wereless than ideal. In particular, there is evidence ofthe sustained Iocaf over- and underestimationthat were mentioned earlier. It seems that thismethod is too “stiff”; it is not sufficiently sensi-tive to changes in the derivatives. Another dis-advantage is that this method is highly sensitiveto outliers, and the authors were loathe to adjustany raw data. Finally, the method was rejectedas not suitable for this project.
73

— Observed
— --- Smoothed
/’
)100
L, 1 I I I I I I 1 I I I I 1
0 678910 11 12 13 14 15 16 17 18
AGE IN YEARS
Figure XX 1. Observed and smoothed percentiles (using the Pearson ckribution system} of stature for males 6-18 vears. by age: Unitedstates.
“
.+ U S. GOVERNMENT PRINTING OFFICE 1977—Z60.93237
74

VITAL AND HEALTH STATISTICS PUBLICATIONS SERIES
Formerly hblic Heulth Service publication No. i 000
Sm”es 1.
Sen”es 2.
series 3.
Sts+es 4.
programs and Collection Procedures. -Reports whkh descriie the general programs of the NationalCenter for Health Statistics and its offkes and divisions, data collection methods used, definitiona, andother matesial necessary for understanding the data.
Data Evaluation and Methods Resersrch.-3tudies of new statistical methodology rncluding experimentaltests of new survey methods, studies of vital statistics collection methods, new analytical techniques,objective evaluations of reliability of collected data, contributions to statistical theory.
Analytical Studies. –Reports presenting analytical or interpretive studies based on vital arrd berdtbstatistics, carrying the analysis frnther thau the expository types of reports in the other series.
Documents and Committee Reports. –Fmal reports of maior committees concerned with vital andhealth statistics, and documen& such as recoin-mended model vitrd registration laws and revised birthand death ccrtifkztes.
Series 10. Data from the Health rnte?view Survey. -Statistics on illness; accidental injuries; disability; use ofhospital, medical, dental, and other services; and other health-related topics, based on datacollected ina continuing national household iriterview snrvey.
Szries 11. Data from the Health Examination Suruey.–Data from direct exaruination, testing, and measurementof national samples of the civilian, norriustitutionalized population provide the basis for two types ofreporttx (1) estimates of the medically defined prevrdence of ipecific diseases in the United States andtbe d~trihutions of the population with respect to physicrd, physiological, and psychological cbarac-tenstics; and (2) analysis of relationships among the various measurements witbout reference to auexplicit finite urdverze of persons.
Series 12. Data from the Institutionalized Population Surue’ys.-Discontinued effective 1975. Future reports fromthese surveys wiJl be in Series 13.
Series 13. Data on Health Resources Utilisation. -Statistics on the utilization of herdtb manpower and facilitiesproviding long-tam czre, ambulatory care, hospital care, and family planning services.
Series 14. Data on Health Resources: Manpowev and Facilities. -Statistics on the numbers, geographic distrib-ution, and characteristics of health rceources inchrding physicians, dentists, nurses, other health occu-pations, hospitals, nursirrghomes, and outpatient facilities.
Seriis 20. Data on Mortality. -Various statistics ou mortality other than as iuchrded in reguisr annual or monthlyreports. Special amdyscs by cause pf death, age, and other demographic variables; geographic and thueseries analyses; and statistics on characteristics of deaths not available from the vital records, based onsample surveys of those records.
Series 21. Data on ~atality, Marriage, and Diuorce.–Various statistics on natality, marriage, and divorce other ‘-than as iucluded in regnlar annual or monthly reports. Special analyses by demographic variables;geographic and time series analyses; studies of fertility; arrd statistics on characteristics of births notavailable from the vital records, based on sample surveys of those records.
Series 22. Data porn the National Morr%li@ and Natality Smvey$. –Discontinued effective 1975. Future reportstlom these sample smveys baaed on vitrd records will be included in Series 20 and 21, respectively.
.%ries 23. Data from the National Survey of Family Growth.-Statistics on fertility, family formation and disso-lution, family planning, and related maternal and iufant health topics derived from a blenuial survey ofa nationwide probability sample of ever-manied women 15-44years of age.
For a Iiit of titles of reports published in thcee scriez, write to: Scientitlc sud Technical Iuforruation BranchNational Center for Herdtb .%ztisticsPublic Health ServiceHyattsville, Md. 207S2