Embed Size (px)
Citation preview

NE Process Industry Productivity Benchmark 2009
10th March 2010

Companies Involved

Benchmark Process
• Word Models
• Performance “Change” Since 2006
• Personal Interviews

Sectors Covered
Co
mm
od
ity
Ch
emic
als
Fin
e o
r S
pec
ialit
y
Bio
pro
cess
ing
Pri
mar
y P
har
mac
euti
cals
Sec
on
dar
y P
har
mac
euti
cals
Pla
stic
s o
r R
ub
ber
Co
atin
gs
Aesica X
Avecia X
Baker Petrolite X
Croda X
GSK X
Huntsman Pigments X
Huntsman PU X
International Paint X
Johnson Matthey Cats X
Lucite International X
Lucite Resins X X
MSD X
Piramal Healthcare X
Sanofi-Aventis X
Shasun X X

Areas Investigated
• Unit Cost• Energy Cost• OEE• Quality Performance• Engineering
Productivity
• Safety Performance• OTIF• Stock Turns• Supplier OTIF

Orientation !

Outputs
• Word Model Pie Chart• Performance … Box and Whisker Plot
MedianUpper Quartile Lower Quartile
MinimumMaximum
0
1
2
3
4
5
6
7
8
9
0 5 10 15 20 25 30 35 40 45 50 55 60
% Improvement
Fre
quen
cy

Unit Cost PerformanceA Unit cost is not used as a metric by the
business to improve the total cost of manufacture.
B Unit cost is calculated and tracked by Accounts department but not widely available or used.
C Management track unit cost and use the metric to align all departments. Emphasis is on achieving the correct balance between cost and plant performance.
D All employees understand the concept of Unit Cost and are actively involved in activities that are focused on total control of manufacture.
A7%
B27%
C53%
D13%

Unit Cost Performance
100.0% maximum 42.000
75.0% quartile 16.000
50.0% median 0.000
25.0% quartile 0.000
0.0% minimum 0.000
0123456789
10
0 5 10 15 20 25 30 35 40 45 50
% Improvement
Fre
qu
en
cy

Energy Cost PerformanceA The company has informal systems to
monitor energy usage. Ad hoc monitoring occurs usually in response to high / low values often flagged up by Accounts Group.
B The company actively manages its energy usages and takes steps to minimise losses at all levels of manufacture.
C The company can demonstrate an ‘Energy Balance’ approach to the use of energy with usages fully identified and measured.
D The company works both with Suppliers and Customers to reduce the overall environmental impact of the Supply Chain by optimising energy usage and recycling materials. Evidence of shop floor led teams leading energy reduction activities.
A7%
B46%
C40%
D7%
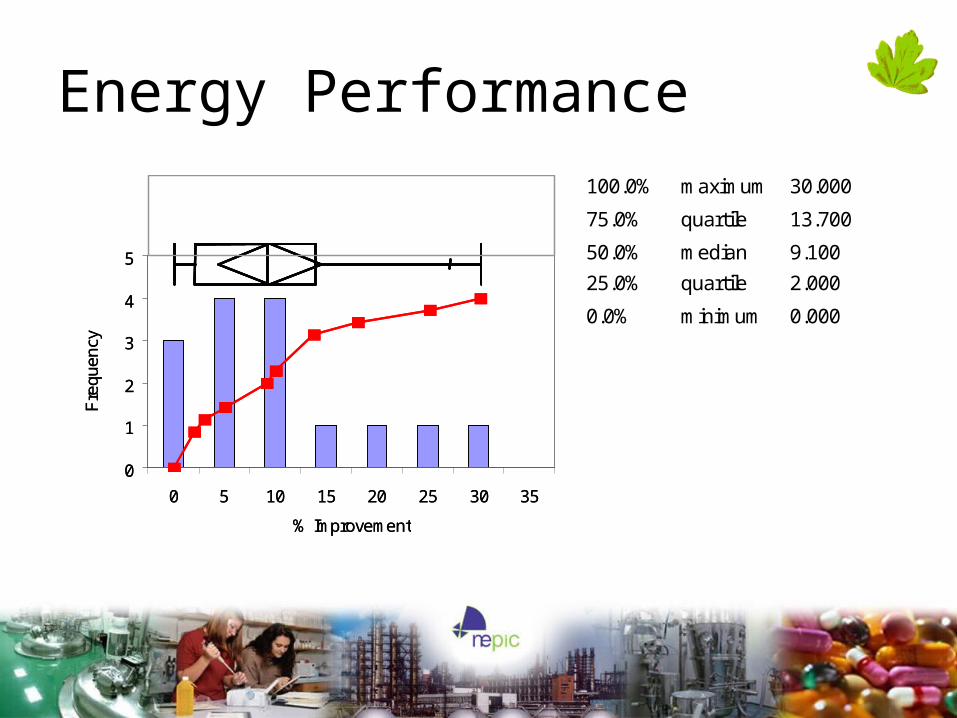
Energy Performance100.0% maximum 30.000
75.0% quartile 13.700
50.0% median 9.100
25.0% quartile 2.000
0.0% minimum 0.000
0
1
2
3
4
5
0 5 10 15 20 25 30 35
% Improvement
Fre
quen
cy
0
1
2
3
4
5
0 5 10 15 20 25 30 35
% Improvement
Fre
quen
cy

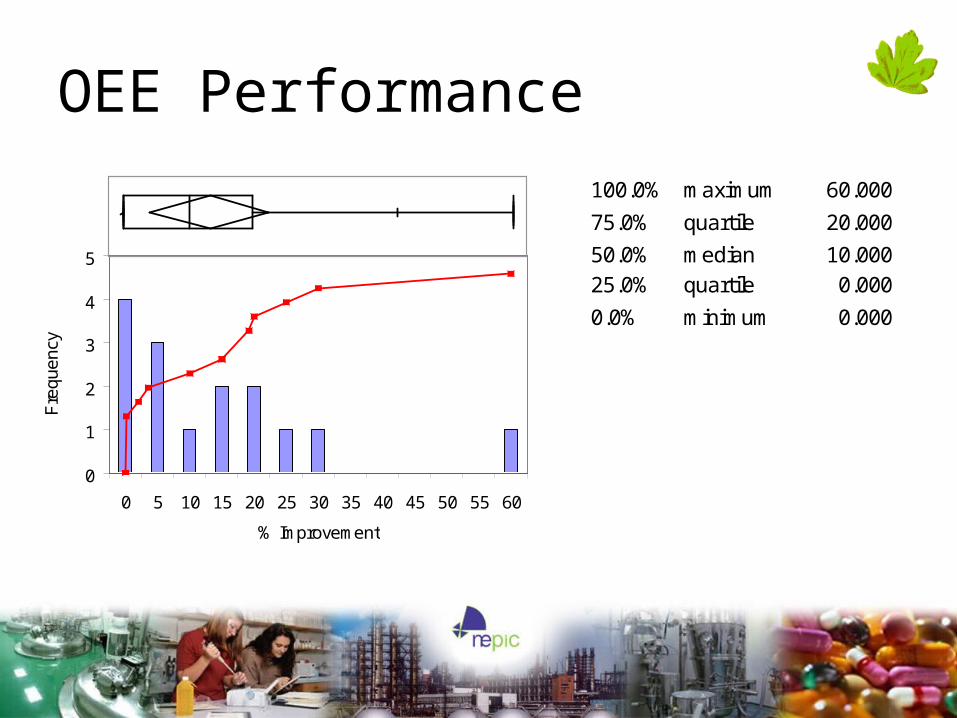
OEE PerformanceA There is limited formal monitoring of the key
plant performance against “Best Achieved”
B There is formal monitoring of the key plant performance metrics but the information is not widely circulated or briefed within the plant.
C The formal data is monitored and circulated within the plant and is used by management to identify opportunities to take the business forward in line with the business strategy.
D The data is generated and owned by the shop floor teams, displayed at their workstations and used by them to improve plant performance and eliminate defects in line with the business strategy.
A7%
B20%
C40%
D33%
OEE Performance
100.0% maximum 60.000
75.0% quartile 20.000
50.0% median 10.000
25.0% quartile 0.000
0.0% minimum 0.000
0
1
2
3
4
5
0 5 10 15 20 25 30 35 40 45 50 55 60
% Improvement
Fre
quen
cy

Quality PerformanceA No formal systems are used to monitor
supplied quality rate. Ad-hoc monitoring occurs usually in response to customer issues.
B There is a formal quality procedure is used for monitoring quality.
C A quality system with regular external auditing is used for capturing issues and uses internal management review and action plans.
D The business uses an appropriate quality system with regular external auditing as part of its business strategy. The operation uses appropriate tools with work groups capturing and using data and information to improve performance.
A0%
B7%
C33%
D60%

Quality Performance100.0% maximum 50.000
75.0% quartile 25.000
50.0% median 8.000
25.0% quartile 2.250
0.0% minimum 0.000
0
1
2
3
4
5
0 5 10 15 20 25 30 35 40 45 50
% Improvement
Fre
quen
cy

Safety Performance 2009/2008
0
1
2
3
4
5
6
0 1 2 3 4 5 6 7
Reportable Injuries 2008 + 2009
Fre
qu
en
cy

Engineering Productivity
• Positives– Measurement and
control– Alliance and Gain
share contracts– In-house Teams– Commitment to
improve
• Negatives– Getting worse– Poor investment at
planning stage– Poor quality leadership
and supervision– Skills shortage (still)

Others
• OTIF
• Stock Turn
• Supplier OTIF
– 80% uptake. – Little differentiation
– Low in Speciality and Pharma Sector
– NPIs skew data
– 20% uptake– Improves when
measured

Engagement with the Public Sector
• 70% productivity support
• 40% energy support
+ Engagement leads to Improvement!
- Resource …

Overall Performance
0
50
100
150
200
250C
ompa
ny 1
Com
pany
2
Com
pany
3
Com
pany
4
Com
pany
5
Com
pany
6
Com
pany
7
Com
pany
8
Com
pany
9
Com
pany
10
Com
pany
11
Com
pany
12
Com
pany
13
Com
pany
14
Com
pany
15
Sc
ore
Word Model Score

Overall Performance
0
50
100
150
200
250C
ompa
ny 1
Com
pany
2
Com
pany
3
Com
pany
4
Com
pany
5
Com
pany
6
Com
pany
7
Com
pany
8
Com
pany
9
Com
pany
10
Com
pany
11
Com
pany
12
Com
pany
13
Com
pany
14
Com
pany
15
Sc
ore
Word Model Score "Total Score"

Conclusions - Strengths• Technical competence
• Tough cost control
• Improvement orientation
• Resource Management
• Uptake of NEPA and ERE support

• Technical competence
• Tough cost control
• Improvement orientation
• Resource Management
• Uptake of NEPA and ERE support
• Wide variation in performance
• Pressure at White Collar level
• Shallow understanding of processes
• No common understanding of best in class performance
• No measurement of supplier performance
Conclusions - Weakness

• Technical competence
• Tough cost control
• Improvement orientation
• Resource Management
• Uptake of NEPA and ERE support
• Wide variation in performance
• Pressure at White Collar level
• Shallow understanding of processes
•No common understanding of best in class performance
• No measurement of supplier performance
• MAS NE Resource Efficiency & Productivity
• NEPIC Manufacturing Team
• Best practice and collaborative work
• £60 million inward investment into the region
Conclusions - Opportunities

• Technical competence
• Improvement orientation
• Tough cost control
• Resource Management
• Uptake of NEPA and ERE support
• Wide variation in performance
• Pressure at White Collar level
• Shallow understanding of processes
• No common understanding of best in class performance
• No measurement of supplier performance
• MAS NE Resource Efficiency & Productivity
• NEPIC Manufacturing Team
• Best practice and collaborative work
• £60 million inward investment into the region
• Low cost economies
• Lack of investment/Payback
• Dis-integration of process industry in the region
• Limited understanding of the value of a CI culture
Conclusions - Threats

Next Steps
• Workshops …