Embed Size (px)
Citation preview
SCHOOL OF EDUCATION
NEALE ANALYSIS OF READING ABILITY FOR READERS WITH LOW VISION
A SUPPLEMENTARY MANUAL TO AID THE ASSESSMENT OF PARTIALLY SIGHTED PUPIL’S
READING USING THE NEALE ANALYSIS OF READING ABILITY (NARA)
Eileen Hill, Rachel Long, Graeme Douglas, Michael Tobin, and Mick Grimley
VISUAL IMPAIRMENT CENTRE FOR TEACHING AND RESEARCH
2005
CONTENTS ACKNOWLEDGEMENTS .........................................................................................................................1 SUMMARY ............................................................................................................................................2
SECTION 1 – ADMINISTRATION OF THE NARA TO PUPILS WITH LOW VISION.............3
OVERVIEW............................................................................................................................................3 INTRODUCTION.....................................................................................................................................3 TEST ADMINISTRATION GUIDELINES....................................................................................................5
SECTION 2 - INTERPRETING PUPIL’S READING SCORES ......................................................9
OVERVIEW............................................................................................................................................9 LOOKING UP SCORES AND GENERAL TRENDS ........................................................................................9 CONSIDERING OTHER FACTORS WHEN INTERPRETING SCORES ............................................................12 SUMMARY OF SCORE INTERPRETATION ..............................................................................................15
SECTION 3 – THE DEVELOPMENT OF THE MANUAL............................................................16
OVERVIEW..........................................................................................................................................16 DATA COLLECTION METHOD .............................................................................................................16 NORMALISATION OF NARA II READING SCORES FOR THE PARTIALLY SIGHTED USER ........................17 CONSIDERING OTHER FACTORS THAT AFFECT READING PERFORMANCE .............................................19 RESULTS AND DISCUSSION .................................................................................................................20 IMPLICATIONS FOR THE READING ASSESSMENT OF PUPILS WITH A VISUAL IMPAIRMENT.....................25
SECTION 4 - RAW SCORE TO READING AGE CONVERSION TABLES...............................27
FORM 1 - ACCURACY..........................................................................................................................27 FORM 1 - COMPREHENSION ................................................................................................................28 FORM 1 - SPEED..................................................................................................................................29 FORM 2 – ACCURACY .........................................................................................................................30 FORM 2 – COMPREHENSION ................................................................................................................31 FORM 2 – SPEED .................................................................................................................................32
REFERENCES .....................................................................................................................................33
ACKNOWLEDGEMENTS The authors wish to thank the RNIB for funding this project, and in particular Louise Clunies-Ross for her encouragement and support. The team are extremely grateful to all the pupils, teachers, schools, and services for being so welcoming and helpful throughout this project. Some of the data was collected by teachers training to be qualified teachers of the visually impaired at the University of Birmingham: Susan Boden, Rowena Curley, Claudia Evans, Suzanne Harris, Sue Kemmer, Sue McKinlay, Paul Miller, Jenny Moss, Chris Rhodes, Lesley Sleeman, and Vernon Webb. As well as the valuable data they contributed, all helped shape this research through fascinating discussions and excellent dissertations. Also thanks to Dr John Greaney for his general advice, particularly regarding statistics. We would also extend our gratitude to Marie Neale for contributing such a useful reading assessment to the field.
NARA for Pupils with Low Vision 1
SUMMARY
This manual is designed to be used in conjunction with the Neale Analysis of Reading Ability (NARA) user manual. While the NARA aims to assess the reading ability of normally sighted readers, this manual provides additional information for assessing the reading of pupils with low vision. The manual enables the user to:
• compare pupil’s reading performance with their visually impaired peers • compare pupil’s reading performance with their normally sighted peers • identify and analyse reading difficulties associated with low vision (‘a
diagnostic tool’) Section 1 of this manual provides information on how to use the NARA with pupils with low vision. Section 2 gives guidance on how to interpret the reading scores and discusses factors that might be considered when assessing a pupil’s reading performance. Evidence demonstrates that pupils with low vision tend to lag behind their sighted peers in all aspects of reading and this lag tends to increase with age. It is argued that the effects of a combination of test accessibility and pupils’ reading development cause this. Section 3 describes how the research was carried out. This section provides technical information about methods and statistical analysis. Section 4 provides tables of normalised reading ages for pupils with low vision. These are used to convert the accuracy, comprehension and speed raw scores obtained when administering the NARA to readers with low vision. The tables provide reading ages for pupils with low vision as well as for normally sighted readers.
NARA for Pupils with Low Vision 2
SECTION 1 – ADMINISTRATION OF THE NARA TO PUPILS
WITH LOW VISION
OVERVIEW
Section 1 provides a short introduction and background to the development of this manual and provides test administration guidelines. INTRODUCTION The Neale Analysis of Reading Ability – Second Edition (NARA II) is a comprehensive assessment of reading ability aimed for use with pupils aged 6 to 12 years. The test is designed to assess oral reading ability in terms of reading rate, accuracy and comprehension, as well as to be used as a diagnostic assessment tool. The Neale Analysis of Reading Ability provides national reading standards for normally sighted individuals. Greaney, Hill and Tobin (1998) published a braille version of the NARA in which they produced norms for the braille reader. To date no version is available for pupils with partial sight; therefore a low vision version including norms is long overdue. The NARA was chosen because it is widely used in the UK, and it allows reading speed, accuracy and comprehension to be measured simultaneously. This document sets out how to use the Neale Analysis of Reading Ability with pupils who have low vision and gives norms so that reading comparisons can be made. Additionally, the document addresses some of the issues that may arise when assessing the reading of partially sighted individuals. Background and Aims The ability to read is fundamental to curriculum access for pupils. It is therefore essential to assess ability and progress in pupil’s reading. Reading tests (with associated standard scores) have been devised to support this process. In this general regard, the education of pupils with a visual impairment does not differ from normally sighted pupils. However, pupils with low vision face particular challenges accessing print materials that may affect the speed and accuracy of their reading. For example, Tobin (1993) found that pupils with low vision (N=51) performed reading tasks more slowly than their sighted peers. Tobin (1998) reported a similar effect when pupils (N=257) carried out speed of information processing tasks (finding target numbers in a list). Strategies involving the modification of print itself such as enlarging (see Keeffe, 2001) and the use of magnifiers e.g. Closed Circuit Televisions and low vision aids (see Tobin, 1993) do not appear to compensate fully for this difficulty of access. While these strategies may enable access which would otherwise be impossible, it is generally recognised that the reading speed of a child with a visual impairment is, on average, slower than that of sighted peers of the same age.
NARA for Pupils with Low Vision 3
The impact of visual impairment upon reading speed and accuracy has many causes which are discussed in greater detail later in this section. However, it is also important to recognise that specific causes and their implications will vary with different visual impairments and between individuals. Additionally, reduced reading speed and accuracy may in turn have a negative impact upon reading comprehension. Again, the causes and nature of this impact will vary from child to child, as discussed later in this section. In spite of these implications of visual impairment upon reading no standardised test of reading ability exists for pupils with low vision. In spring 1999, as part of a research project funded by RNIB, researchers at the Research Centre for the Education of the Visually Handicapped (RCEVH – now the Visual Impairment Centre for Teaching and Research, VICTAR) started to test the reading ability of pupils with low vision with an aim of generating standardised scores. Therefore, the research aimed to enable teachers to:
• compare pupil’s reading performance with their visually impaired peers • compare pupil’s reading performance with their normally sighted peers • identify and analyse reading difficulties associated with low vision (‘a
diagnostic tool’) The Neale Analysis of Reading Ability (NARA) The NARA was designed to assess the reading of fully sighted pupils between the ages of 6 and 12. It consists of six passages of increasing difficulty. The child reads each passage aloud in turn and the test administrator notes reading errors, responses to standard comprehension questions, and time taken. The test is complete when the child has either read all six passages, or finds it too difficult to continue (determined by the number of reading errors made). There are two parallel versions of the test (‘forms’ one and two) which permits the same child to be re-tested without the child remembering a previous test and thereby altering the score. The child’s scores are converted into reading ages for accuracy, comprehension and speed. The NARA classifies reading errors into six categories; mispronunciations, substitutions, refusals, additions, omissions and reversals. When a child makes more than 12 errors in a passage a decision can be made to stop testing. When a child makes more than 16 errors in any one passage the test is discontinued immediately. Comprehension is measured by asking the child a number of set questions concerning the passage they have just read. One point is given for each correct answer. Reading speed is measured by timing the passages read and converting this into words per minute over the total number of passages read.
NARA for Pupils with Low Vision 4
TEST ADMINISTRATION GUIDELINES Overview Administration of the NARA for readers with low vision should be carried out in the same manner as with normally sighted pupils. The basic process is outlined below and will attempt to include a guide of possible differences in administration and pitfalls to avoid when administering the test to pupils with low vision. These issues are summarised in boxes for ease of reference. However, the test must be carried out using the Neale Analysis of Reading Ability-Manual for Schools as a guide. The guidelines may also be useful in other assessment of teaching contexts. Conditions for Testing It is imperative that the conditions are optimal when testing reading ability. Pupils should be tested in a quiet and comfortable room with distractions and interruptions kept to a minimum. Lighting. Lighting should be optimised for the individual needs of each pupil. This may involve the use of additional light sources, e.g. low wattage Anglepoise lamp. Particular attention should be taken regarding the relative position of windows and careful use of blinds and curtains. This is especially important for pupils whose visual impairment includes photophobia. Equipment. Pupils should use any usual reading equipment. This might include reading stands (copyholders), typoscopes, or various types of Low Vision Aid (LVA). Additionally, the opinion of the child being assessed should always be sought. However, care should be taken because it is common for pupils to accept poor reading conditions because they are unable to evaluate their needs accurately or simply because they are trying to be helpful. Essential Equipment When administering the NARA the following equipment is essential: • A stopwatch or timing device to enable the timing in seconds. • The NARA Reader – the test materials. • The individual record form, for the assessor to record timings, errors and any other
results. • A pen or pencil. • The NARA-Manual for Schools in order to read any standardised instructions that
should be given to the pupil. • Ideally a tape recorder to enable a recording of the assessment to be made. A
recording allows for greater accuracy because it is possible to listen to the child’s reading at a later date. This is particularly important for assessors who may be relatively unfamiliar with this complex test procedure.
NARA for Pupils with Low Vision 5
• Any LVA normally used by the pupil. • A ruler can be useful for measuring reading distance. This should be carried out
in between the formal reading activities so as not to distract the child. Having a record of reading distances can be useful for diagnostic purposes. For example, reading distance may vary as the child tires, between different font sizes, or between different test sessions. It may also provide additional information regarding the severity of the visual impairment.
Opening Discussion, Introduction to the Test and Practice Passage The assessor should put the pupil at ease before beginning the test. Engaging in conversation with the pupil regarding interests and pastimes may achieve this. It is important that the pupil knows what to expect in the assessment and that they are familiar with the structure of the assessment process. The reader should be introduced using the words given in the schools’ manual and the appropriate practice passage should be administered so that the pupil can become familiar with the materials and what is expected of them. There is a choice of two practice passages, X (for pupils up to approximately seven years of age) and Y (for those over approximately seven years of age). Administering the Test Passages Having decided which test form is to be used, the assessor should turn to passage one and read the instructions given in the NARA-Manual for Schools. Choice of starting passage. When testing a child with a visual impairment always start on Level One of the NARA. The NARA-Manual for Schools advises starting at Level Two or Three for older pupils – and the process of establishing the ‘basal-level’. However, for a variety of reasons it is better to start at Level One with this population: primarily because starting testing at later levels assumes that pupils will have gained full scores on earlier passages. The data gathered in this research demonstrates that, on average, the reading ability of a visually impaired child lags behind that of a normally sighted child of the same age. Therefore, the starting level chosen in the NARA-Manual for Schools is inappropriate for the partially sighted population. Additionally, information gathered at every level of the test provides valuable information about the child’s reading, and the potential impact of their visual impairment. Nevertheless, the early levels of the test will be very easy for older and more able pupils – in which case they will require reassurance that what they are doing is important and necessary. In line with the instructions in the NARA-Manual for Schools, the pupil should look at the picture to give a context for the passage before attempting to read it. Examination of pictures. It is important to recognise that pupils with low vision may find it difficult, or even fail to comprehend the picture fully, due to issues of access or experience. It may be necessary to give a pupil extra time to interpret the picture fully. Do not describe the picture to the pupil, but make notes of any difficulties or errors they make. These notes are important when interpreting the results of the reading assessment, as well as considering the general functional vision of the pupil. Examples of difficulties observed during the research include:
NARA for Pupils with Low Vision 6
• Misinterpretation. e.g. the child carrying a box was interpreted as a child reading a book (Form 2, Level 2), the dragon’s wing was interpreted as an umbrella (Form 2, Level 4), some pupils had difficulty interpreting the number of bicycles (Form 1, Level 2), the shark was interpreted as a fish (Form 1, Level 4), and some pupils were not able to interpret the picture at all.
• Omission. e.g. not seeing the bars on the lion’s cage (Form 2, Level 3), not seeing the climbers on the mountain (Form 2, Level 6).
Stopping the Testing As the levels become higher and the difficulty of each passage increases, the test should be terminated when the number of errors reaches 16, or 20 for level 6. The timing and comprehension should be scored for pupils making up to 16 errors (or 20 in level 6) but should not be recorded if more than 16 errors (or 20 in level 6) are made. Sometimes assessment must be stopped because the pupil becomes tired/fatigued or simply cannot access the text (e.g. it is too small). This should be recorded. Finally, the session should be rounded off with another informal discussion about the test. This may be a good opportunity to establish if there were any aspects of the test that were particularly challenging for the pupil that were not related to reading ability, such as any aspect of their disability that may have affected the testing. Recording Comprehension Comprehension scores should be recorded on the scoring sheet provided. The comprehension questions should be asked as soon as the pupil has finished reading the passage keeping to the exact wording of the questions. It is important to understand that the child may refer to the original passage when answering comprehension questions. Particular attention should be paid to whether the child with low vision refers back to the text when answering the comprehension questions, and if so, with how much success. Observations made during this research revealed that pupils who did refer back to the text sometimes had difficulty scanning the text to identify the answers. This resulted in greater time being taken to answer questions, and some pupils gave up. Recording Timings The time taken for the pupil to read a particular passage, in seconds, should be recorded in the appropriate place on the scoring sheet. The timing should begin when the child says the first word of the passage and should end when they say the last word.
NARA for Pupils with Low Vision 7
Recording Errors Errors may be written correctly beside the relevant word during testing and the categorisation of errors entered on the scoring sheet following testing. The section in the schools’ manual on categorising and correcting errors should be read carefully to ensure accurate categorisation. Use of a tape recorder to record the assessment is particularly helpful in the subsequent categorisation of errors. Raw Scores All raw scores are calculated using the methods given in the NARA II – Teachers’ manual. • The accuracy score is calculated out of a possible total of 100. • The comprehension score is calculated out of a possible total of 44 points. • The raw score for speed is measured in words per minute and has no maximum
value. In order to interpret the raw scores for each reading ability category, the raw score should be converted to an age equivalent score (reading age) using the conversion tables provided at the back of this booklet (Section 4).
NARA for Pupils with Low Vision 8
SECTION 2 - INTERPRETING PUPIL’S READING SCORES
OVERVIEW
Section 2 is concerned with interpreting scores and observations generated when using the NARA with pupil who have low vision. Firstly, the process of using the conversion tables (presented in Section 4) is described. Secondly, other factors that should be considered when interpreting partially sighted pupil’s reading scores are described (including reading distance and limitations of the assessment). Finally, a summary of score interpretation is presented for quick reference. LOOKING UP SCORES AND GENERAL TRENDS
Looking up reading scores in the reading age conversion tables Having tested a pupil and calculated the raw reading scores following the procedures described in Section One above, the next step is to convert these scores to reading ages. Reading ages are useful because they enable the teacher rapidly to appraise how well the pupil is reading for their chronological age, as well as facilitating comparisons with the pupil’s peers. The procedure is as follows: 1. Find the appropriate table in Section Four. Forms 1 and 2 have separate tables as
do each of the different aspects of the reading assessment (accuracy, comprehension, and speed).
2. Look for the raw score in the left-hand column of the table. Associated with the raw score are three other figures: • VI reading age: based upon this research data, pupil with a visual impairment
of this age would, on average, perform at this level. • Normally sighted reading age: based upon the NARA data, pupil with normal
sight of this age would, on average, perform at this level. • 95% confidence band: based upon this research data, we can say with
confidence that a pupil with a visual impairment performing at this level will have a reading age between the two ages.
For example, if we test a 10:0-year old pupil who has a visual impairment on Form 1 and s/he achieves an accuracy score of 52. We look up on table ‘Form 1 – Accuracy’ in Section Four and find the following:
Figure 1. Part of the raw score to reading age conversion tables (accuracy) Raw
Score VI Reading Age
Normally Sighted Reading Age
95% Confidence Band
Raw Score
VI Reading Age
Normally Sighted Reading Age
95% Confidence Band
15 5:1 6:4 4:4 to 6:1 51 11:2 9:0 9:7 to 13:4
16 5:3 6:4 4:6 to 6:4 52 11:4 9:1 9:8 to 13:6
17 5:5 6:5 4:8 to 6:6 53 11:6 9:2 9:10 to 13:9
We can say that this pupil has a normally sighted reading age of 9:1. Therefore, her reading ability is not as good as might be expected and we need to seek explanations for this. However, when comparisons are made with her visually impaired peers, her reading age is 11:4. Therefore, in the context of her visual impairment, her reading age is one year and four months ahead of her chronological age.
NARA for Pupils with Low Vision 9
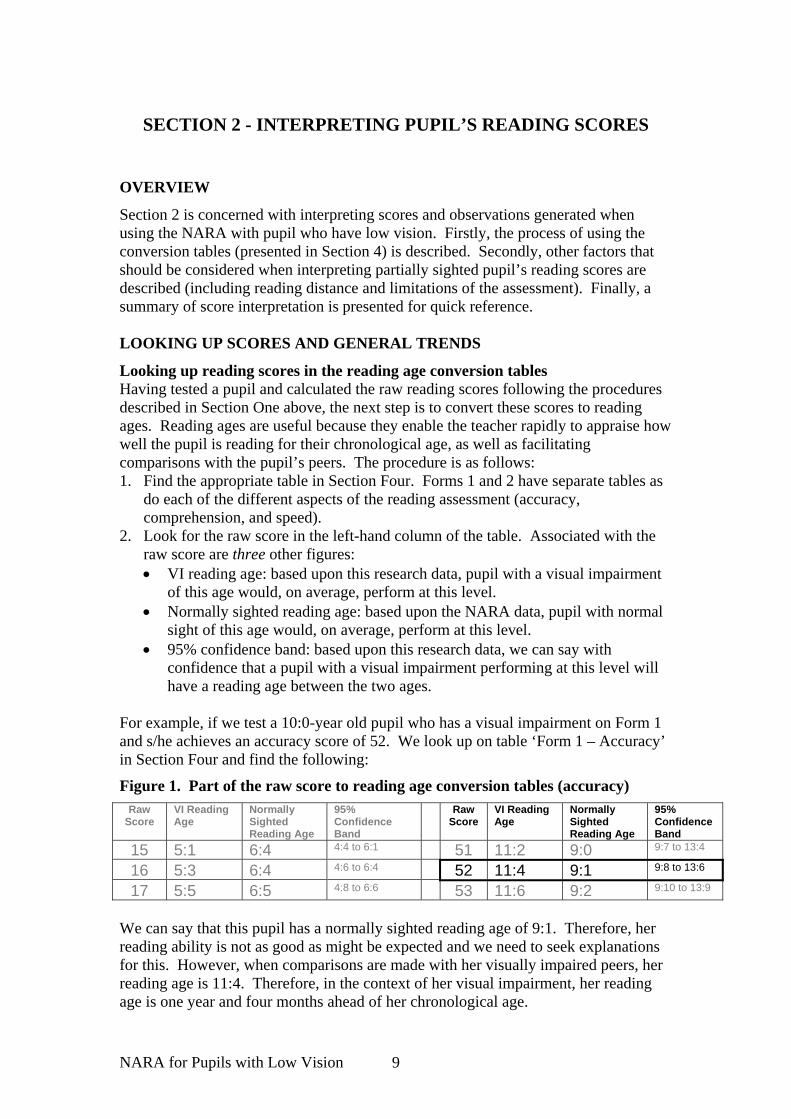
The impact of visual impairment on reading: overview The tables in Section Four demonstrate that pupil with a visual impairment tend to lag behind their sighted peers in all aspects of reading. It is useful to present these apparent differences graphically to help identify general patterns.
Chronological Age in Years
12.0011.0010.009.008.007.006.00
Raw
Acc
urac
y S
core
80
70
60
50
40
30
20
10
Low Vision
Normal Vision
Figure 2. Average reading accuracy scores for normally sighted and visually impaired pupil (Form One)
Chronological Age in Years
12.0011.0010.009.008.007.006.00
Raw
Com
preh
ensi
on S
core
40
30
20
10
0
Low Vision
Normal Vision
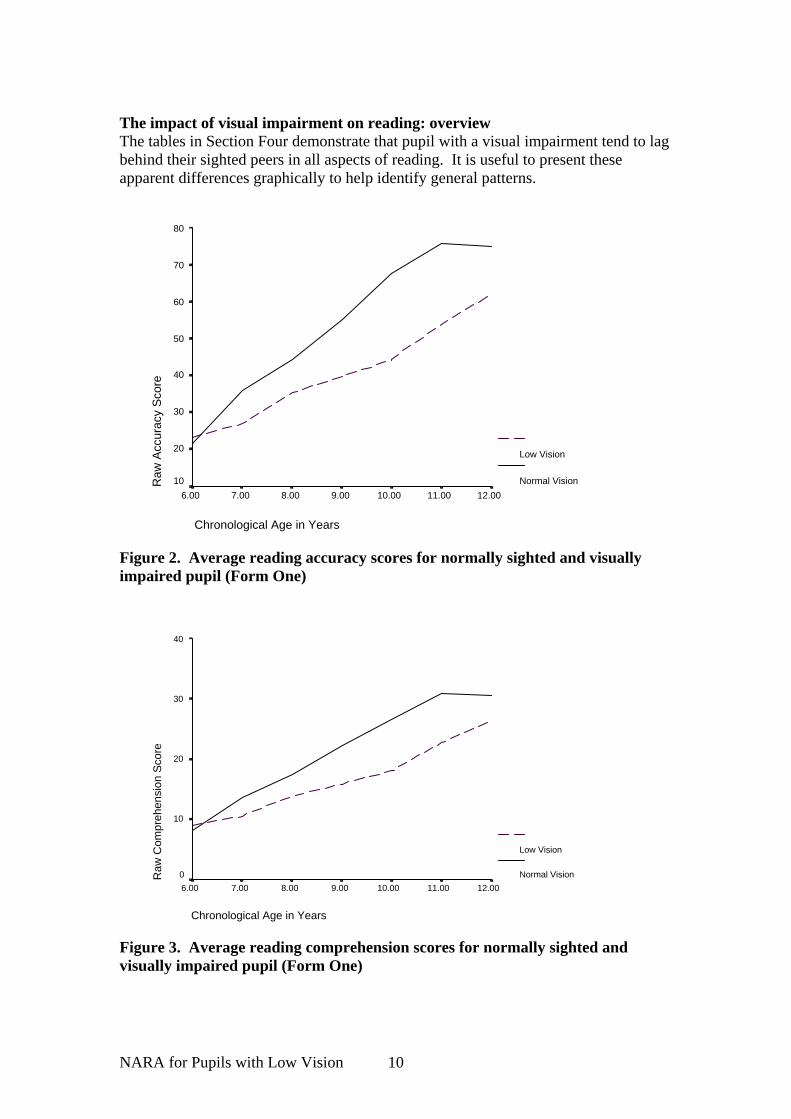
Figure 3. Average reading comprehension scores for normally sighted and visually impaired pupil (Form One)
NARA for Pupils with Low Vision 10
Chronological Age in Years
12.0011.0010.009.008.007.006.00
Raw
Spe
ed S
core
100
90
80
70
60
50
40
30
Low Vision
Normal Vision
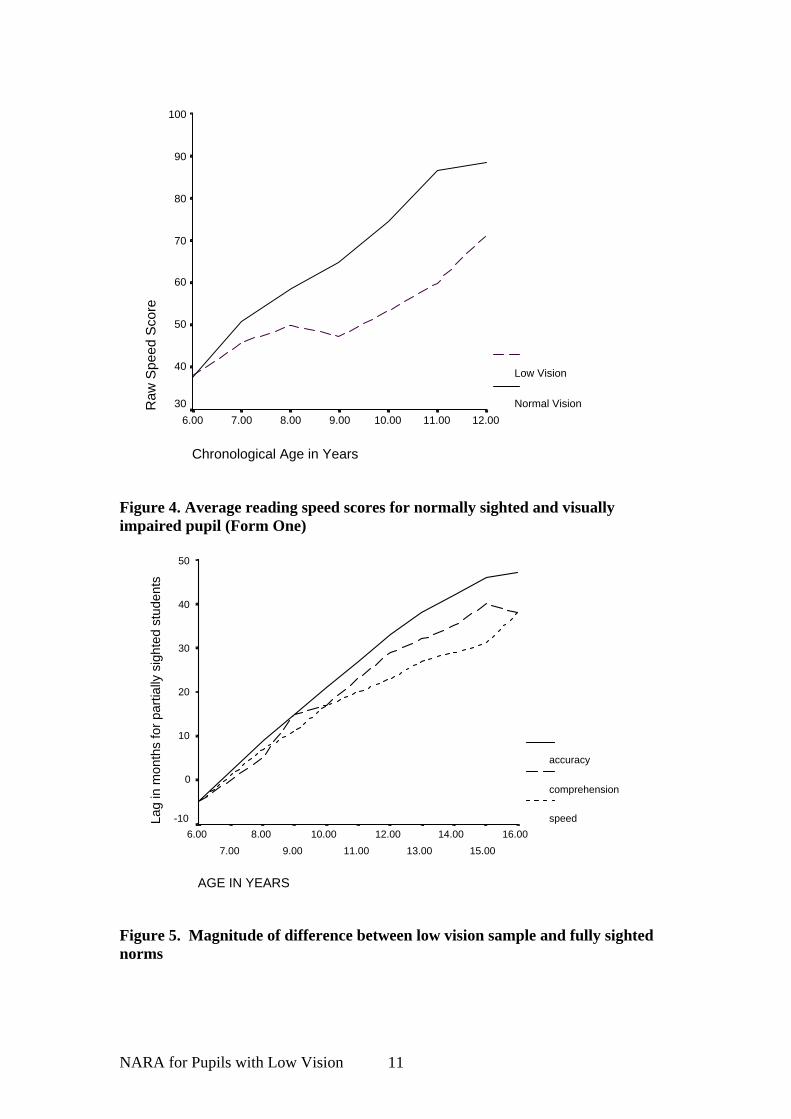
Figure 4. Average reading speed scores for normally sighted and visually impaired pupil (Form One)
AGE IN YEARS
16.0015.00
14.0013.00
12.0011.00
10.009.00
8.007.00
6.00
Lag
in m
onth
s fo
r par
tially
sig
hted
stu
dent
s
50
40
30
20
10
0
-10
accuracy
comprehension
speed
Figure 5. Magnitude of difference between low vision sample and fully sighted norms
NARA for Pupils with Low Vision 11
Figure 2, Figure 3, and Figure 4 appear to show that the average reading scores for the sample of pupils with low vision are below the scores of fully sighted pupils of the same age. This is true for reading accuracy, comprehension and speed. Importantly, the extent of this difference appears to increase with age. This finding is in keeping with general observations of teachers and existing literature, particularly regarding reading speed (Tobin, 1993). The data also shows a similar differential (or lag) for reading accuracy and comprehension. Figure 5, however, illustrates the lag with age on all three aspects of reading (calculations based upon standardised scores). It appears that up to the age of approximately 7 years, the reading performance of pupils with low vision is in line with sighted peers but then begins to fall behind. However, it is possible that the NARA is not sensitive enough to capture subtle differences in early reading and ‘reading readiness’ between the two groups. This is explained in the following sections referring to Limitations of the NARA. CONSIDERING OTHER FACTORS WHEN INTERPRETING SCORES
The purpose of any reading assessment is to help the user gain a greater understanding of the pupil’s reading ability. The standardised scores for pupils with low vision further enhance the usefulness of the NARA for this population. Nevertheless, there are limitations which should be considered when interpreting the results. These can be considered in three areas: • Limitations of the NARA • Limitations of the low vision standardised scores • Reading distance Limitations of the NARA The NARA considers the construct of reading ability to be made of three orthogonal (independent)dimensions – reading speed, comprehension, and accuracy. Inevitably, the way the test is designed means that these different dimensions can, in some circumstances, have an impact upon one another. In fact, reading accuracy is the dimension which dictates when the test ends. Therefore testing may stop before the pupil has reached a ceiling for comprehension. Similarly, the point at which the pupil stops the test can have an impact upon reading speed, which is based upon the average reading rate for the levels completed. Therefore it is possible for a pupil to slowly struggle through a level and therefore bring down their overall reading speed; whereas if they had failed to complete the level, their overall speed would remain higher. This can be illustrated by comparing two pupils (taken from the data) as an example.
NARA for Pupils with Low Vision 12
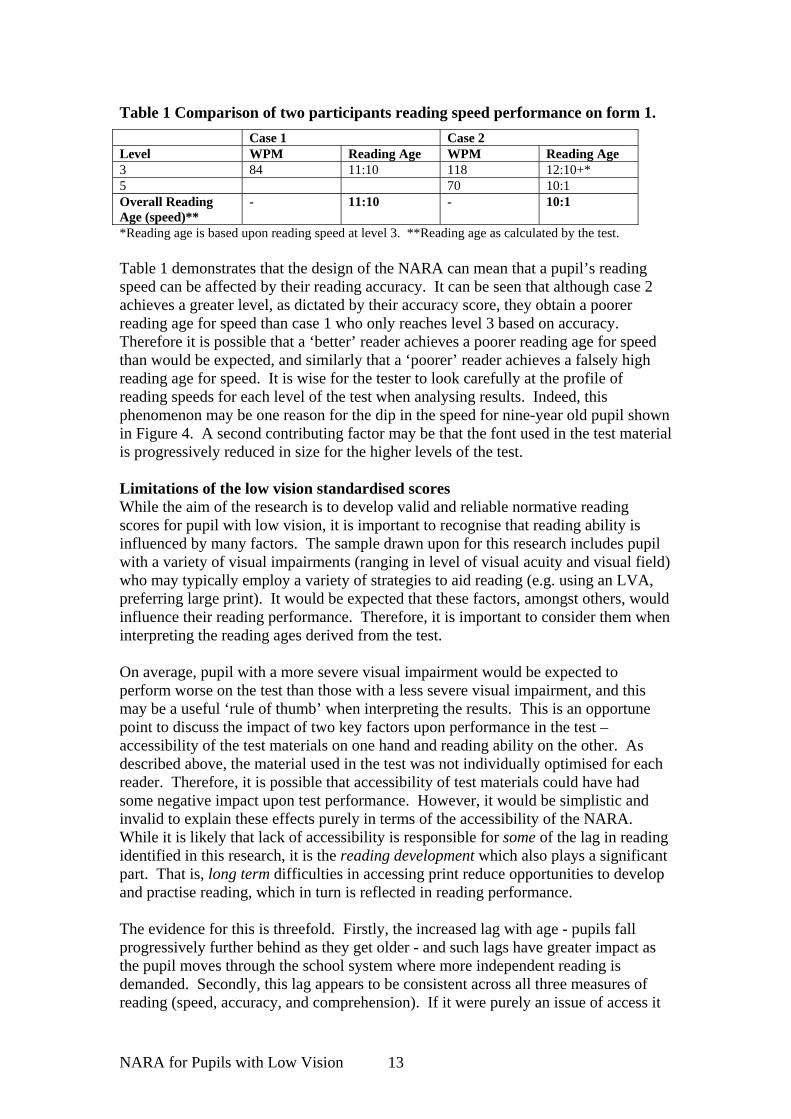
Table 1 Comparison of two participants reading speed performance on form 1. Case 1 Case 2 Level WPM Reading Age WPM Reading Age 3 84 11:10 118 12:10+* 5 70 10:1 Overall Reading Age (speed)**
- 11:10 - 10:1
*Reading age is based upon reading speed at level 3. **Reading age as calculated by the test. Table 1 demonstrates that the design of the NARA can mean that a pupil’s reading speed can be affected by their reading accuracy. It can be seen that although case 2 achieves a greater level, as dictated by their accuracy score, they obtain a poorer reading age for speed than case 1 who only reaches level 3 based on accuracy. Therefore it is possible that a ‘better’ reader achieves a poorer reading age for speed than would be expected, and similarly that a ‘poorer’ reader achieves a falsely high reading age for speed. It is wise for the tester to look carefully at the profile of reading speeds for each level of the test when analysing results. Indeed, this phenomenon may be one reason for the dip in the speed for nine-year old pupil shown in Figure 4. A second contributing factor may be that the font used in the test material is progressively reduced in size for the higher levels of the test. Limitations of the low vision standardised scores While the aim of the research is to develop valid and reliable normative reading scores for pupil with low vision, it is important to recognise that reading ability is influenced by many factors. The sample drawn upon for this research includes pupil with a variety of visual impairments (ranging in level of visual acuity and visual field) who may typically employ a variety of strategies to aid reading (e.g. using an LVA, preferring large print). It would be expected that these factors, amongst others, would influence their reading performance. Therefore, it is important to consider them when interpreting the reading ages derived from the test. On average, pupil with a more severe visual impairment would be expected to perform worse on the test than those with a less severe visual impairment, and this may be a useful ‘rule of thumb’ when interpreting the results. This is an opportune point to discuss the impact of two key factors upon performance in the test – accessibility of the test materials on one hand and reading ability on the other. As described above, the material used in the test was not individually optimised for each reader. Therefore, it is possible that accessibility of test materials could have had some negative impact upon test performance. However, it would be simplistic and invalid to explain these effects purely in terms of the accessibility of the NARA. While it is likely that lack of accessibility is responsible for some of the lag in reading identified in this research, it is the reading development which also plays a significant part. That is, long term difficulties in accessing print reduce opportunities to develop and practise reading, which in turn is reflected in reading performance. The evidence for this is threefold. Firstly, the increased lag with age - pupils fall progressively further behind as they get older - and such lags have greater impact as the pupil moves through the school system where more independent reading is demanded. Secondly, this lag appears to be consistent across all three measures of reading (speed, accuracy, and comprehension). If it were purely an issue of access it
NARA for Pupils with Low Vision 13
would be expected to be most marked for speed. Thirdly, evidence can be found in a parallel study reported in Long, Douglas, Hill, and Cross (2002) which compared reading performance of 20 pupils with a visual impairment when tested using standard NARA print and enlarged print materials (Arial 18 point, bold). Importantly, the pupil’s teachers predicted that all the pupil would benefit from the enlarged print. Nevertheless, there was found to be no significant differences across the two reading conditions for the group. This suggests that enlargement of text (a method of improving access) does not necessarily improve test performance for all. However, when looking at individual scores, while the print size made little difference for the majority, two participants’ scores were dramatically higher when reading from enlarged print. This demonstrates that for those two pupils the accessibility of the test was an issue, while for the other 18 it was less so for this task. Irrespective of the implications for this study, perhaps a clearer recommendation is that wholesale enlargement of text for all pupils with a visual impairment is counterproductive. For the teacher using the NARA to assess the reading ability of a pupil with low vision it is vital to consider the pupil’s visual impairment very carefully, but this should not mask the ultimate goal of the assessment – to understand the pupil’s reading ability. Reading Distance
It was hypothesised that the nature of a person’s visual impairment would affect reading development. Thus, a crude indicator of the nature and severity of visual impairment is the distance from the page they adopt when reading (reading distance). This may be explained by the fact that reading distance is correlated with visual acuity, thus providing an estimate of the extent of the pupil’s low vision. Therefore, reading ability (Reading accuracy, comprehension and speed) can be partially predicted by reading distance. Consequently, it was possible to carry out analyses to test the relationship between reading distance and reading ability. This analysis showed that small reading distances were associated with poor reading which indicated that the reading ability of pupils with more severe visual impairments tended to lag even further. This is particularly the case for reading speed. It should be noted that this is based upon averages and a pupil reading close to the text will not necessarily be a poor reader. Similarly, a reader reading at the normal distance from the text will not necessarily be a good reader. It should be remembered that the best predictor of reading performance is age. In summary, when assessing reading it is useful to measure reading distance, and consider how it differs from the average reading distance for pupils with partial sight (in this sample the average reading distance on level 1 of the test was 19 cm): • Pupils with a reading distance less than 19cm are likely to have a reading age
lower than predicted in the norm table in Section 4 • Pupils with a reading distance greater than 19cm are likely to have a reading age
higher than predicted in the norm table in Section 4 • These trends are greater for reading speed.
NARA for Pupils with Low Vision 14
SUMMARY OF SCORE INTERPRETATION
Step 1 – Compare the reading scores of the partially sighted reader to sighted reading norms. If the pupil is reading below national reading averages, consider how this might be affecting their educational progress, as well as self esteem. Step 2 – Compare the reading of the partially sighted reader to that of their partially sighted reading norms. If the pupil is reading approximately in line with, or above, expected low vision norms for their age, then it suggests that their reading is developing relatively well in spite of their visual impairment. If their reading is below expected low vision norms for their age, then it suggests that other reading difficulties may be present. In such a case, the pupils’ reading ability is likely to be greatly below that of many of their peers and is likely to result in difficulty in being included in many classroom activities. Step 3 – Consider the pupil’s vision. If the pupil has a small reading distance (less than 20cm when reading level 1), their reading ability is more likely to be lower than predicted by the low vision norms. The smaller the reading distance the more likely it is that the pupil will lag. This is likely to be particularly the case for speed of reading. If the pupil has a larger reading distance (greater than 20cm) and also is below expected low vision norms for their age it suggests that other reading difficulties may be present. The use of reading distances is a useful ‘rule of thumb’, but an assessment of reading should always consider in detail the nature of the pupil’s visual impairment and the impact it is likely to have upon accessing text. Step 4 – Consider differences across the different reading measures (accuracy, comprehension, and speed) – i.e. the pupil’s reading profile. It can be very revealing to consider particular aspects of reading ability. It is often reported that low vision may have a particular impact upon speed of reading. Alternatively, pupils may read quickly and accurately but have very low comprehension. The reading profile of the pupil will have an impact upon any planned intervention. Step 5 – Consider differences in speed across different levels of the assessment. Some pupil’s reading speed can drop enormously on passages later in the assessment. This is partly caused by the more difficult text taking longer to decode, but also by the reduced size of the text in the test material. However, if the pupil is generally slow then this might reflect a different kind of reading difficulty.
NARA for Pupils with Low Vision 15
SECTION 3 – THE DEVELOPMENT OF THE MANUAL
OVERVIEW
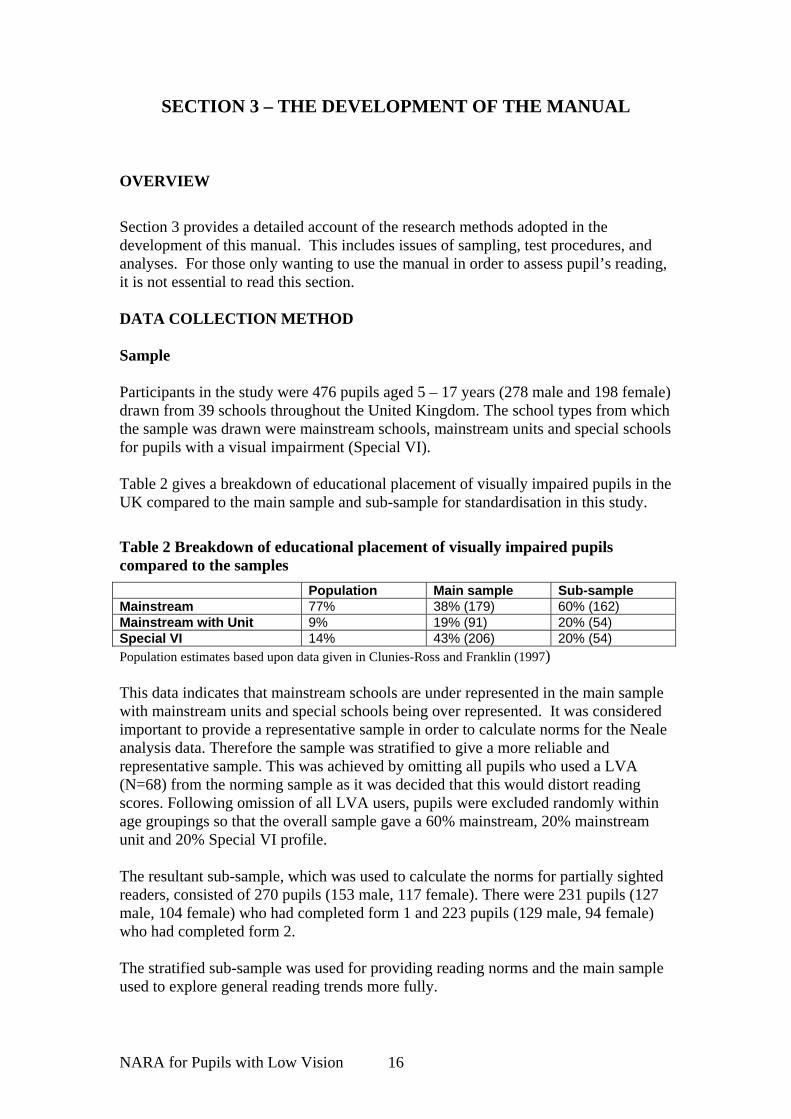
Section 3 provides a detailed account of the research methods adopted in the development of this manual. This includes issues of sampling, test procedures, and analyses. For those only wanting to use the manual in order to assess pupil’s reading, it is not essential to read this section. DATA COLLECTION METHOD Sample Participants in the study were 476 pupils aged 5 – 17 years (278 male and 198 female) drawn from 39 schools throughout the United Kingdom. The school types from which the sample was drawn were mainstream schools, mainstream units and special schools for pupils with a visual impairment (Special VI). Table 2 gives a breakdown of educational placement of visually impaired pupils in the UK compared to the main sample and sub-sample for standardisation in this study.
Table 2 Breakdown of educational placement of visually impaired pupils compared to the samples Population Main sample Sub-sample Mainstream 77% 38% (179) 60% (162) Mainstream with Unit 9% 19% (91) 20% (54) Special VI 14% 43% (206) 20% (54) Population estimates based upon data given in Clunies-Ross and Franklin (1997) This data indicates that mainstream schools are under represented in the main sample with mainstream units and special schools being over represented. It was considered important to provide a representative sample in order to calculate norms for the Neale analysis data. Therefore the sample was stratified to give a more reliable and representative sample. This was achieved by omitting all pupils who used a LVA (N=68) from the norming sample as it was decided that this would distort reading scores. Following omission of all LVA users, pupils were excluded randomly within age groupings so that the overall sample gave a 60% mainstream, 20% mainstream unit and 20% Special VI profile. The resultant sub-sample, which was used to calculate the norms for partially sighted readers, consisted of 270 pupils (153 male, 117 female). There were 231 pupils (127 male, 104 female) who had completed form 1 and 223 pupils (129 male, 94 female) who had completed form 2. The stratified sub-sample was used for providing reading norms and the main sample used to explore general reading trends more fully.
NARA for Pupils with Low Vision 16
Materials The NARA II Revised Version 1997 was used. It was decided not to modify printed test materials for two reasons. Firstly, this would make comparisons with sighted norms more difficult. Secondly, optimum modification varies amongst pupils, therefore no single modification would be appropriate. Pupils were allowed to use LVAs if they wished. A stopwatch was used to time the passages read, and the pupil’s oral reading was recorded using a Dictaphone recorder which allowed checking. Distance from page was measured using a 30-cm ruler. The researchers used NARA score sheets to record the pupil’s scores. Two further information sheets were used to record additional details concerning visual impairment and details of procedure such as position the book was held and any difficulties or comments concerning the individual. Procedure Each pupil was tested individually, in a quiet corner or room within the pupil’s own school. The researcher ensured that the pupil was at ease (emphasising that they were helping with research rather than being tested for their ability), that they had necessary glasses or LVAs, and that lighting and seating conditions were comfortable. The NARA was conducted according to the instruction manual, with some additional procedures. • Pupils were tested on all passages they were able to read (even more skilled
readers were required to read the easiest passages). • If time permitted the pupils were tested using both versions of the test. • Reading distance was measured on all passages on completion of the test (the
pupil was asked to read the first line of each passage again). Measures for inter-form correlation for reading rate, reading accuracy and reading comprehension were all high (whole main sample: 0:91, 0:99, 0:97 respectively; stratified sub-sample 0.95,0.99 and 0.97 respectively). NORMALISATION OF NARA II READING SCORES FOR THE
PARTIALLY SIGHTED USER
Raw scores for the partially sighted sample were converted into age norms using a linear regression technique in order to smooth out the data. It was necessary to use a regression model because a norming procedure using age group means was not satisfactory due to small cell sizes across the age groups which would have resulted in spurious data that was hard to interpret. Several curvilinear models were explored and it was found that the best fitting model for the overall data was the quadratic model. However, because this model only accounted for 1% more variance compared to the linear model and tended to fit the lower age groups (6-12yrs) less well, a linear model was preferred.
NARA for Pupils with Low Vision 17
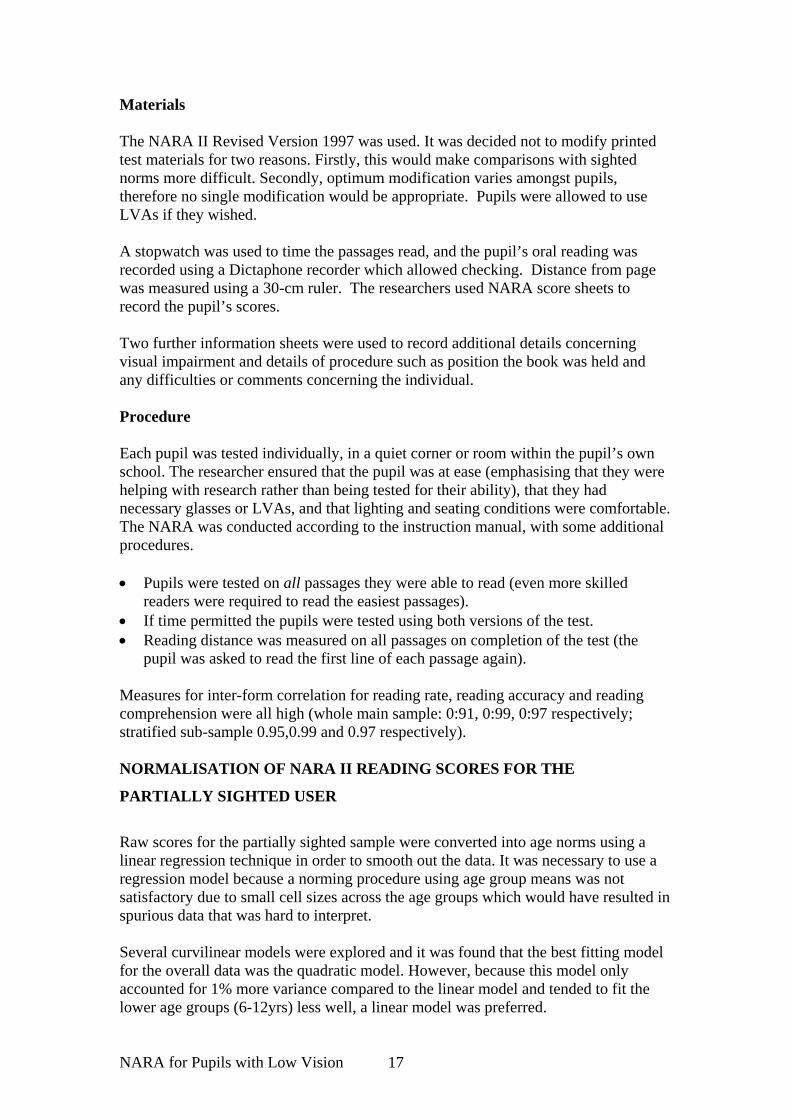
Results of the linear regressions for form 1 and form 2 accuracy, comprehension and speed are given in Table 3 below. Figure 6 shows the regression graph for form 1-accuracy. Similar graphs could be drawn for comprehension and speed (on forms 1 and 2). The smooth line graphs from which the standardised scores are drawn can be compared to the uneven graph based upon means (Figure 2, Figure 3 and Figure 4).
Table 3 Regression Statistics for Form 1 and Form 2 Reading Scores FORM 1 FORM 2 Regression
Statistic Accuracy Comprehension Speed Accuracy Comprehension Speed Constant -12.83 -0.82 -1.22 -15.38 -7.15 -14.36 Age 0.47 0.22 0.50 0.50 0.21 0.59 R 0.62 0.63 0.53 0.63 0.63 0.59 R Squared 0.38 0.40 0.28 0.39 0.39 0.35 F 142.69** 153.26** 90.81** 144.27** 143.55** 117.95** Notes: **p<0.0001
READING AGE IN YEARS
12.0011.0010.009.008.007.006.00
Raw
Acc
urac
y S
core
90
80
70
60
50
40
30
20
10
Low vision
Normal vision
Figure 6. Reading accuracy scores for normally sighted and visually impaired pupil (Form One) based upon linear regression analysis. Table 9 to Table 14 (Section 4) are provided to give the conversion from the raw score to the normalised reading age. The tables also give a 95% confidence interval, thus giving an upper limit and lower limit for the reading age and a comparison with normally sighted readers.
NARA for Pupils with Low Vision 18
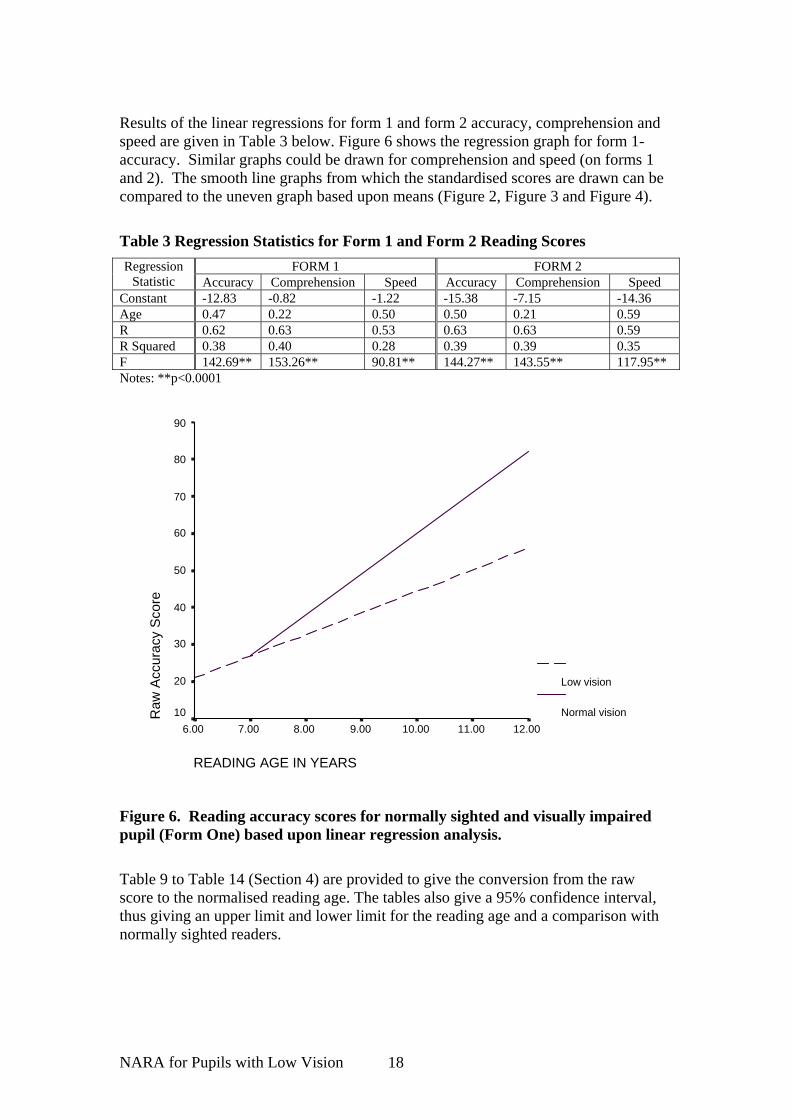
CONSIDERING OTHER FACTORS THAT AFFECT READING PERFORMANCE Participants Participants in the study were 476 pupils aged 5 – 17 years (278 male and 198 female) drawn from 39 schools throughout the United Kingdom. The school types from which the sample was drawn were mainstream schools, mainstream units and special schools for pupils with a visual impairment (special VI). Table 4 shows a breakdown of the sample in terms of type of school, age of pupils and gender.
Table 4 Showing Breakdown of Sample into Numbers of Each Age Range for the Different Types of School and Gender Age Range
(Yrs:Months)
Mainstream Mainstream Unit VI Special Total Number of Pupils
Male Female Male Female Male Female 5:0-5:11 2 2 0 0 1 1 6 6:0-6:11 15 6 1 1 3 1 27 7:0-7:11 19 6 2 4 2 6 39 8:0-8:11 10 13 4 3 7 7 44 9:0-9:11 9 10 1 3 7 8 38
10:0-10:11 11 9 7 7 8 7 49 11:0-11:11 10 6 6 5 14 15 56 12:0-12:11 8 8 7 2 13 9 47 13:0-13:11 12 4 9 5 13 3 46 14:0-14:11 6 2 8 2 21 8 47 15:0-15:11 4 4 3 7 22 14 54 16:0-16:11 1 2 3 1 6 2 15 17:0-17:11 0 0 0 0 4 4 8
Total 107 72 51 40 121 85 476 Total 179 91 206 476 Visual inspection of the sample data shows that numbers of participants are low for the upper and lower age ranges (5:0-5:11 and 16:0-17:11). Males outnumber females (59% to 41%) for all school types and certain age ranges show an imbalance of gender. Additionally, the breakdown of numbers of participants in the sample shows that there were significantly fewer participants sampled from mainstream units compared to the other two school types. Consideration of other factors affecting reading ability In order to help the educator understand a visually impaired pupil’s reading ability as much as possible it is important to consider what other factors might impact upon their test performance. In addition to age, what other factors for which data was collected might affect reading?
NARA for Pupils with Low Vision 19
(1) Nature and severity of the visual impairment. Figure 2 to Figure 5, which compare reading performance of pupil with a visual impairment to their fully sighted peers, illustrates the impact of visual impairment upon reading ability. Nevertheless, these graphs are based upon the average of all those tested. It is important to look more carefully at the variable ‘visual impairment’ to assess whether the nature and severity of the visual impairment influences reading performance. However, limited data was available. Data collected included: • Visual Acuity. It was predicted that as visual acuity decreases reading processes
would be detrimentally affected. This measurement was obtained from the pupil’s educational establishment prior to testing. However, data was not collected for all pupils. No data regarding visual field was collected.
• Reading distance. The distance that the pupil was from the text when reading was judged to be a measure that included a mixture of a pupil’s visual acuity, strategies used when reading text and ergonomic factors e.g. reading posture etc. Again, it was predicted that as reading distance decreased reading processes would be detrimentally affected.
• Use of low vision aids. Pupils who use low vision aids were expected to have a more severe visual impairment than those who did not. It was predicted that pupils using a low vision aids were likely to have poorer reading performance than those who did not.
(2) English as an additional language. Pupils with English as an additional language would be expected to perform worse than pupils with English as their first language due to the added processing load placed upon them. RESULTS AND DISCUSSION
As an initial analysis of the impact of these factors it was decided to carry out a multiple regression. The following factors were included as predictors in a stepwise multiple regression analyses for each of the dependant variables (accuracy, comprehension, speed): age, English as an additional language, and reading distance. It was thought that these variables might predict reading ability. The reason reading distance was chosen as a measure of the nature and severity of the visual impairment was because more data was available for this variable. Additionally the use of LVAs could not be reasonably used in the same analysis because the two variable are confounded (i.e. use of LVA impacts upon reading distance). Additionally, other variables were excluded from the analysis for two reasons. Firstly it they were not predicted to influence reading performance (e.g. gender). Secondly, if they were not pupil-related characteristics/factors (e.g. school setting). Summary of the Multiple Regression Analyses
A stepwise multiple regression analyses for each of the dependant variables (accuracy, comprehension, speed for both forms) using age, English as an additional language, and reading distance as predictors was performed. Therefore six analyses in total were carried out. The analyses showed a consistent pattern. Age and reading distance were found to predict reading ability. English as an additional language was not found to predict reading ability.
NARA for Pupils with Low Vision 20
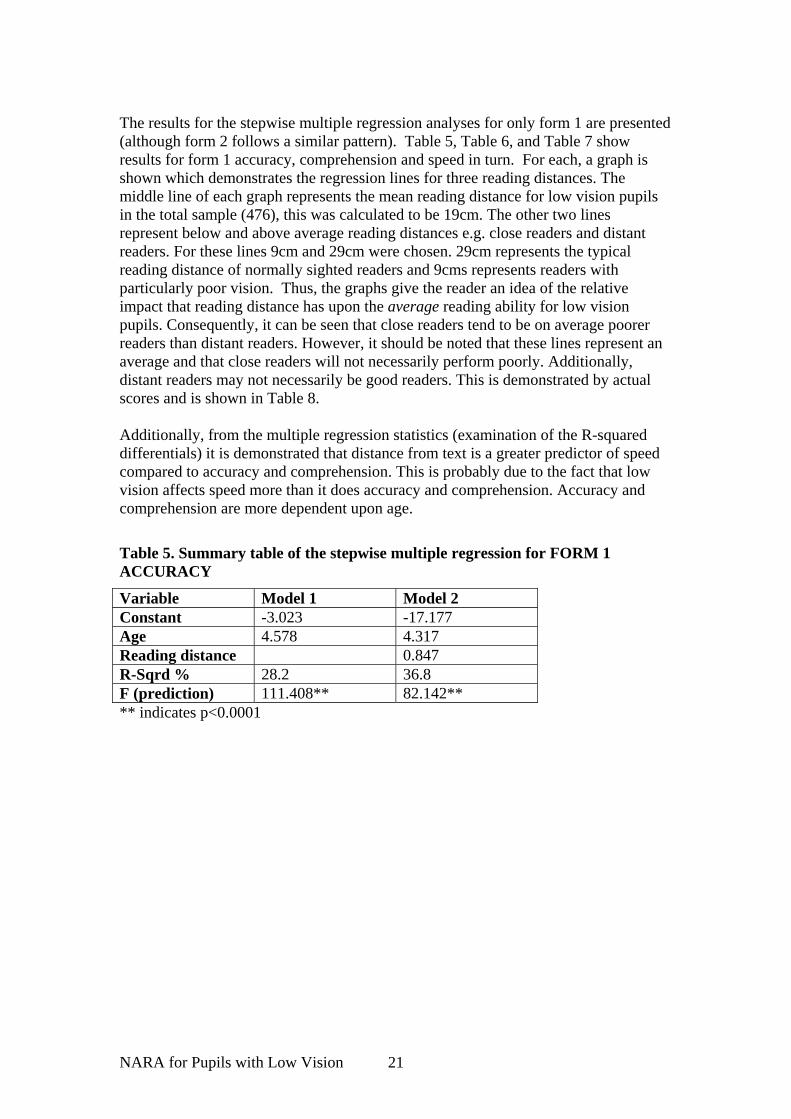
The results for the stepwise multiple regression analyses for only form 1 are presented (although form 2 follows a similar pattern). Table 5, Table 6, and Table 7 show results for form 1 accuracy, comprehension and speed in turn. For each, a graph is shown which demonstrates the regression lines for three reading distances. The middle line of each graph represents the mean reading distance for low vision pupils in the total sample (476), this was calculated to be 19cm. The other two lines represent below and above average reading distances e.g. close readers and distant readers. For these lines 9cm and 29cm were chosen. 29cm represents the typical reading distance of normally sighted readers and 9cms represents readers with particularly poor vision. Thus, the graphs give the reader an idea of the relative impact that reading distance has upon the average reading ability for low vision pupils. Consequently, it can be seen that close readers tend to be on average poorer readers than distant readers. However, it should be noted that these lines represent an average and that close readers will not necessarily perform poorly. Additionally, distant readers may not necessarily be good readers. This is demonstrated by actual scores and is shown in Table 8. Additionally, from the multiple regression statistics (examination of the R-squared differentials) it is demonstrated that distance from text is a greater predictor of speed compared to accuracy and comprehension. This is probably due to the fact that low vision affects speed more than it does accuracy and comprehension. Accuracy and comprehension are more dependent upon age.
Table 5. Summary table of the stepwise multiple regression for FORM 1 ACCURACY
Variable Model 1 Model 2 Constant -3.023 -17.177 Age 4.578 4.317 Reading distance 0.847 R-Sqrd % 28.2 36.8 F (prediction) 111.408** 82.142** ** indicates p<0.0001
NARA for Pupils with Low Vision 21
AGE IN YEARS
16.0015.00
14.0013.00
12.0011.00
10.009.00
8.007.00
6.00
Acc
urac
y S
core
80
70
60
50
40
30
20
10
average distance
from text (19cm)
9cm from text
29cm from text
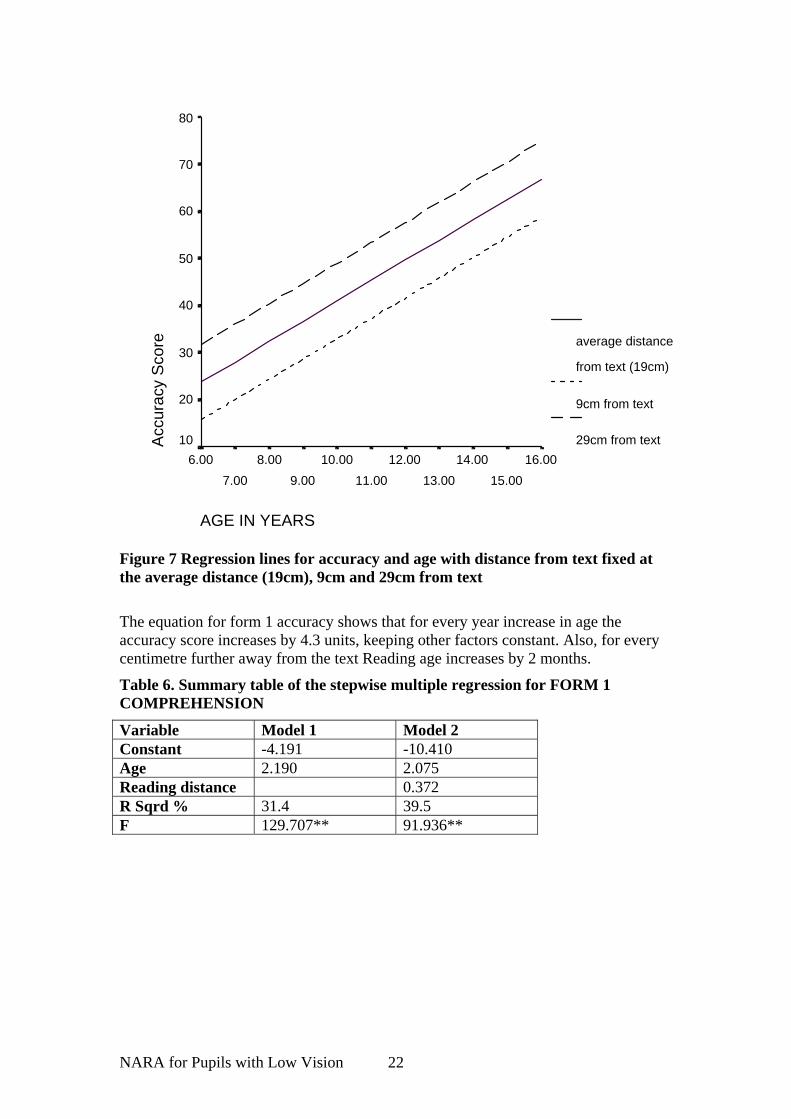
Figure 7 Regression lines for accuracy and age with distance from text fixed at the average distance (19cm), 9cm and 29cm from text The equation for form 1 accuracy shows that for every year increase in age the accuracy score increases by 4.3 units, keeping other factors constant. Also, for every centimetre further away from the text Reading age increases by 2 months.
Table 6. Summary table of the stepwise multiple regression for FORM 1 COMPREHENSION
Variable Model 1 Model 2 Constant -4.191 -10.410 Age 2.190 2.075 Reading distance 0.372 R Sqrd % 31.4 39.5 F 129.707** 91.936**
NARA for Pupils with Low Vision 22
AGE IN YEARS
16.0015.00
14.0013.00
12.0011.00
10.009.00
8.007.00
6.00
Com
preh
ensi
on s
core
40
30
20
10
0
average distance
from text (19cm)
9cm from text
29cm from text
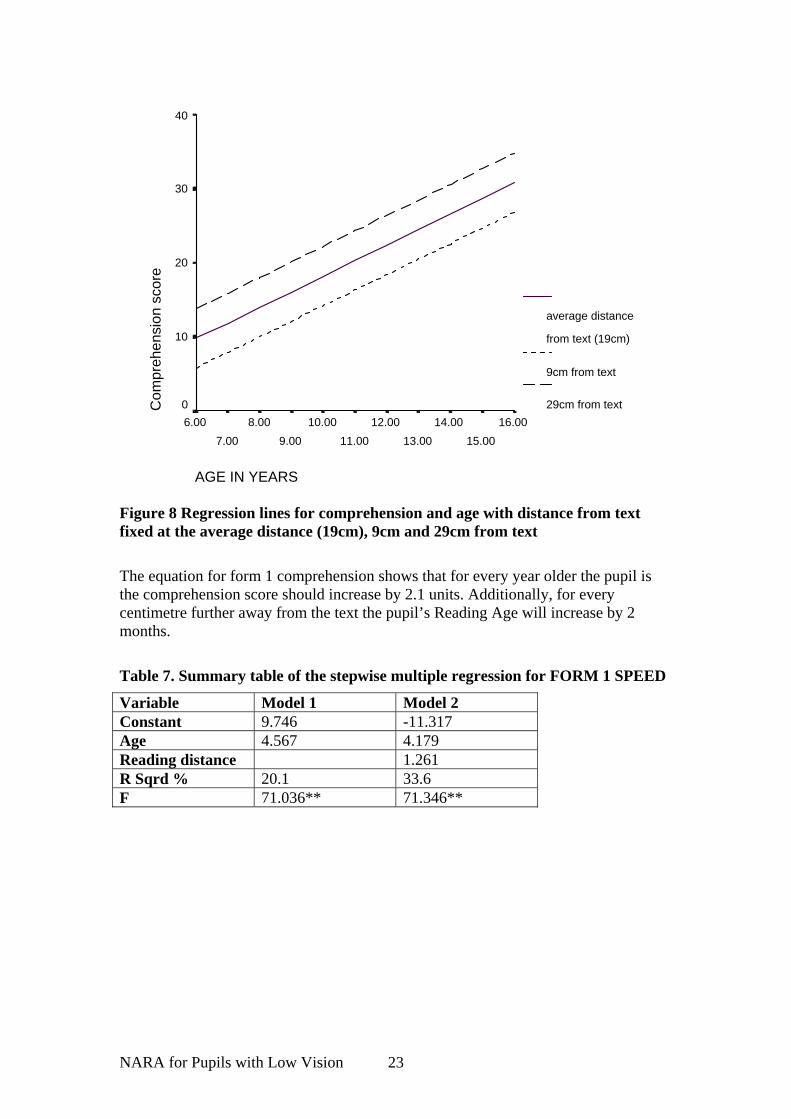
Figure 8 Regression lines for comprehension and age with distance from text fixed at the average distance (19cm), 9cm and 29cm from text The equation for form 1 comprehension shows that for every year older the pupil is the comprehension score should increase by 2.1 units. Additionally, for every centimetre further away from the text the pupil’s Reading Age will increase by 2 months.
Table 7. Summary table of the stepwise multiple regression for FORM 1 SPEED
Variable Model 1 Model 2 Constant 9.746 -11.317 Age 4.567 4.179 Reading distance 1.261 R Sqrd % 20.1 33.6 F 71.036** 71.346**
NARA for Pupils with Low Vision 23
AGE IN YEARS
16.0015.00
14.0013.00
12.0011.00
10.009.00
8.007.00
6.00
Spe
ed S
core
100
80
60
40
20
average distance
from text (19cm)
9cm from text
29cm from text
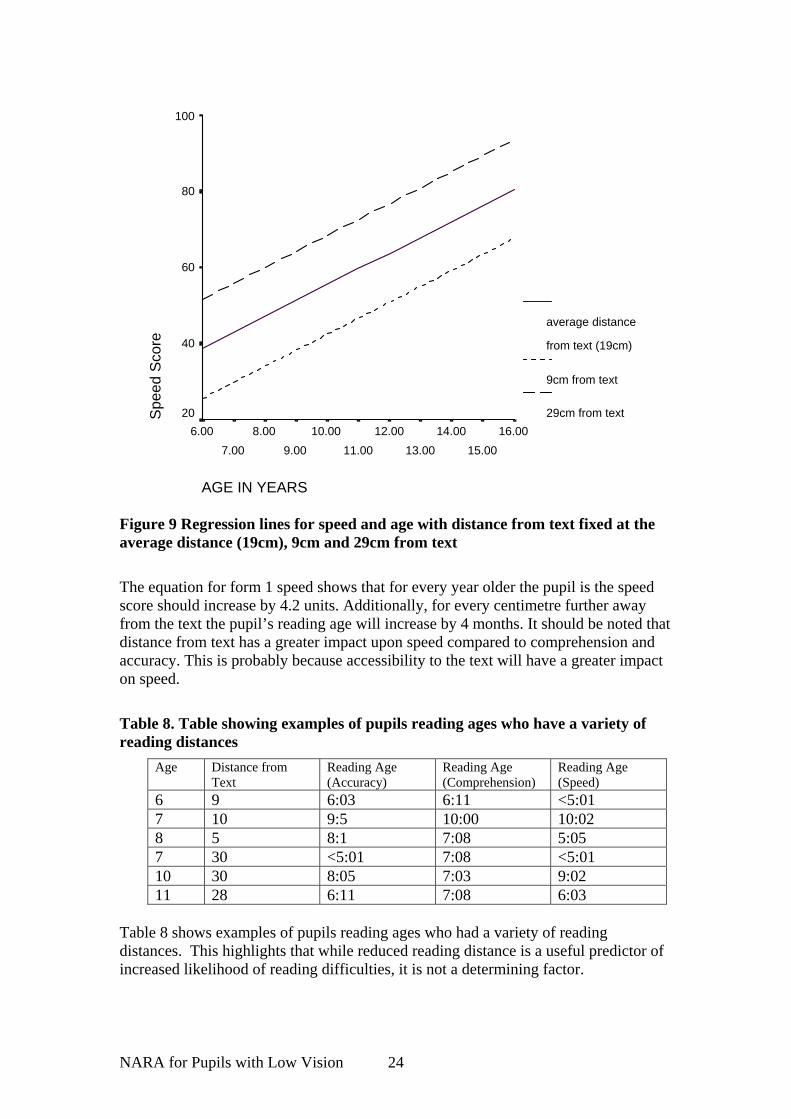
Figure 9 Regression lines for speed and age with distance from text fixed at the average distance (19cm), 9cm and 29cm from text The equation for form 1 speed shows that for every year older the pupil is the speed score should increase by 4.2 units. Additionally, for every centimetre further away from the text the pupil’s reading age will increase by 4 months. It should be noted that distance from text has a greater impact upon speed compared to comprehension and accuracy. This is probably because accessibility to the text will have a greater impact on speed.
Table 8. Table showing examples of pupils reading ages who have a variety of reading distances
Age Distance from Text
Reading Age (Accuracy)
Reading Age (Comprehension)
Reading Age (Speed)
6 9 6:03 6:11 <5:01 7 10 9:5 10:00 10:02 8 5 8:1 7:08 5:05 7 30 <5:01 7:08 <5:01 10 30 8:05 7:03 9:02 11 28 6:11 7:08 6:03
Table 8 shows examples of pupils reading ages who had a variety of reading distances. This highlights that while reduced reading distance is a useful predictor of increased likelihood of reading difficulties, it is not a determining factor.
NARA for Pupils with Low Vision 24
Postscript on Analysis
Although this manual recommends that pupils should be encouraged to use LVAs if they would normally use them, the analyses do not include them as variables. LVA users were a small group within the total sample. Additionally, it was difficult to include them in any analysis due to the confounding of other factors associated with the use of LVAs. The normalised scores in section 4 are based upon non LVA users. Consequently, more exploration is needed to establish what impact LVAs have on reading performance of pupils with low vision. IMPLICATIONS FOR THE READING ASSESSMENT OF PUPIL WITH A
VISUAL IMPAIRMENT
Reading distance is a useful predictor of a pupil’s ability to access the text. A good estimation of the severity of the pupil’s vision can be obtained by observing the distance the reader is from the text when reading. The average distance from the text for low vision readers was calculated to be 19cm. The regression equation, which includes age and distance from text, enables a calculation of reading ability at different ages to be calculated for different distances from the text. It can therefore be demonstrated from Figure 7, Figure 8 and Figure 9 that distances closer than this produce poorer reading scores, but distances further than this produce better reading scores. Therefore, an assessment of reading distance can tell the tester whether the reader should fall above or below the average regression line. The average line is the line that most closely resembles the norm tables; therefore if a reader is below the line it could be due to them being a close reader (<19cm) in other words they may have poorer vision than the average reader with low vision. It should be noted however that these regression lines are averages, and the examples presented in Table 8 demonstrate that pupils often deviate from these averages. Age is the most important predictor of a pupil’s reading ability. This is because chronological age gives the best reflection of reading development. The use of normalised reading ages enable teachers to establish whether a pupil is developing his/her reading skills normally. In other words reading age reflects whether the pupil of a particular chronological age has reached the national average for that particular reading test (in this case the NARA). If they are average readers their chronological age should match the reading age displayed in the appropriate tables. However, it is important to recognise that other factors apart from reading development may impinge upon reading ability. Clearly, if a pupil has low vision this may impede their development because it will be much harder for those pupils to access the text. Consequently, it is important to base reading norms for low vision readers on data collected from the reading of low vision pupils rather than normal readers. The norms presented in this document are based on the reading of low vision pupils. However, it is also important to understand that due to the nature and diversity of low vision it is extremely difficult to predict reading ability for low vision pupils as a homogeneous group. Clearly, pupils with nystagmus will show different problems to those pupils with myopia. English as an additional language was expected to be an important predictor of reading ability. However it was found not to be a significant predictor of reading ability suggesting that the impact of visual impairments mask effects of some other
NARA for Pupils with Low Vision 25
less important factors. Clearly, reading development measured by chronological age and text accessibility measured by distance from text are the main factors to consider when assessing the reading performance of low vision pupils.
NARA for Pupils with Low Vision 26
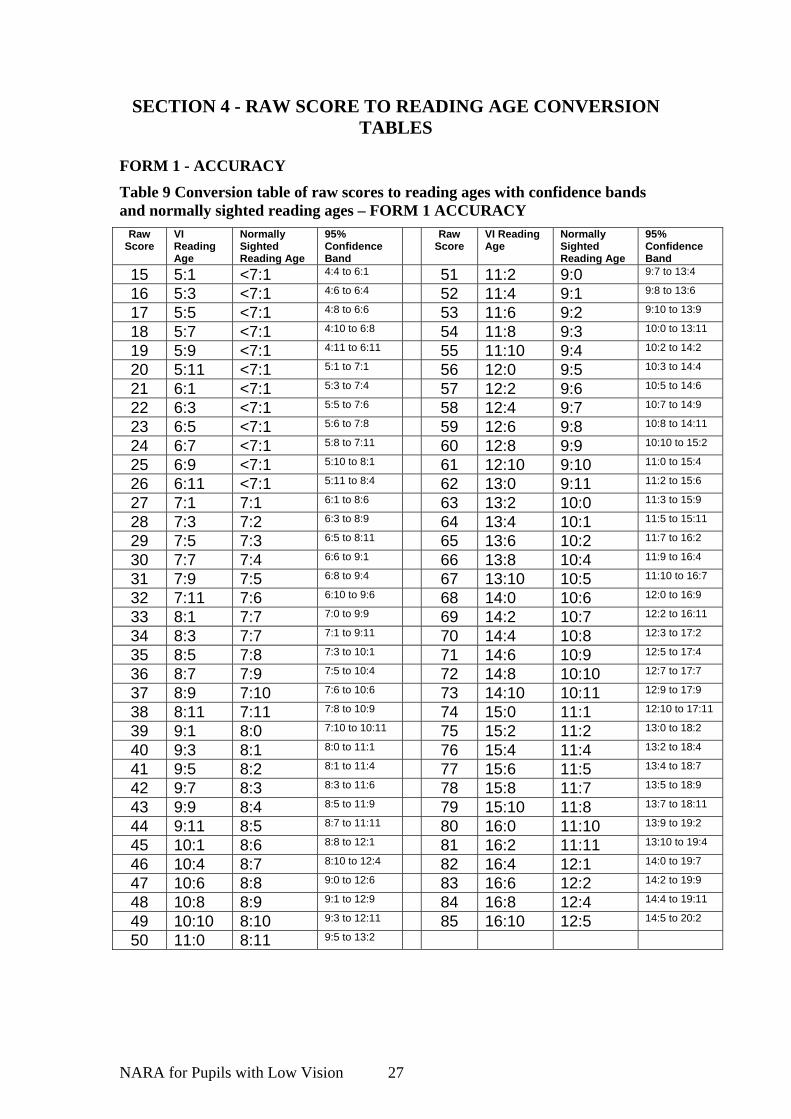
SECTION 4 - RAW SCORE TO READING AGE CONVERSION TABLES
FORM 1 - ACCURACY
Table 9 Conversion table of raw scores to reading ages with confidence bands and normally sighted reading ages – FORM 1 ACCURACY
Raw Score
VI Reading Age
Normally Sighted Reading Age
95% Confidence Band
Raw Score
VI Reading Age
Normally Sighted Reading Age
95% Confidence Band
15 5:1 <7:1 4:4 to 6:1 51 11:2 9:0 9:7 to 13:4
16 5:3 <7:1 4:6 to 6:4 52 11:4 9:1 9:8 to 13:6
17 5:5 <7:1 4:8 to 6:6 53 11:6 9:2 9:10 to 13:9
18 5:7 <7:1 4:10 to 6:8 54 11:8 9:3 10:0 to 13:11
19 5:9 <7:1 4:11 to 6:11 55 11:10 9:4 10:2 to 14:2
20 5:11 <7:1 5:1 to 7:1 56 12:0 9:5 10:3 to 14:4
21 6:1 <7:1 5:3 to 7:4 57 12:2 9:6 10:5 to 14:6
22 6:3 <7:1 5:5 to 7:6 58 12:4 9:7 10:7 to 14:9
23 6:5 <7:1 5:6 to 7:8 59 12:6 9:8 10:8 to 14:11
24 6:7 <7:1 5:8 to 7:11 60 12:8 9:9 10:10 to 15:2
25 6:9 <7:1 5:10 to 8:1 61 12:10 9:10 11:0 to 15:4
26 6:11 <7:1 5:11 to 8:4 62 13:0 9:11 11:2 to 15:6
27 7:1 7:1 6:1 to 8:6 63 13:2 10:0 11:3 to 15:9
28 7:3 7:2 6:3 to 8:9 64 13:4 10:1 11:5 to 15:11
29 7:5 7:3 6:5 to 8:11 65 13:6 10:2 11:7 to 16:2
30 7:7 7:4 6:6 to 9:1 66 13:8 10:4 11:9 to 16:4
31 7:9 7:5 6:8 to 9:4 67 13:10 10:5 11:10 to 16:7
32 7:11 7:6 6:10 to 9:6 68 14:0 10:6 12:0 to 16:9
33 8:1 7:7 7:0 to 9:9 69 14:2 10:7 12:2 to 16:11
34 8:3 7:7 7:1 to 9:11 70 14:4 10:8 12:3 to 17:2
35 8:5 7:8 7:3 to 10:1 71 14:6 10:9 12:5 to 17:4
36 8:7 7:9 7:5 to 10:4 72 14:8 10:10 12:7 to 17:7
37 8:9 7:10 7:6 to 10:6 73 14:10 10:11 12:9 to 17:9
38 8:11 7:11 7:8 to 10:9 74 15:0 11:1 12:10 to 17:11
39 9:1 8:0 7:10 to 10:11 75 15:2 11:2 13:0 to 18:2
40 9:3 8:1 8:0 to 11:1 76 15:4 11:4 13:2 to 18:4
41 9:5 8:2 8:1 to 11:4 77 15:6 11:5 13:4 to 18:7
42 9:7 8:3 8:3 to 11:6 78 15:8 11:7 13:5 to 18:9
43 9:9 8:4 8:5 to 11:9 79 15:10 11:8 13:7 to 18:11
44 9:11 8:5 8:7 to 11:11 80 16:0 11:10 13:9 to 19:2
45 10:1 8:6 8:8 to 12:1 81 16:2 11:11 13:10 to 19:4
46 10:4 8:7 8:10 to 12:4 82 16:4 12:1 14:0 to 19:7
47 10:6 8:8 9:0 to 12:6 83 16:6 12:2 14:2 to 19:9
48 10:8 8:9 9:1 to 12:9 84 16:8 12:4 14:4 to 19:11
49 10:10 8:10 9:3 to 12:11 85 16:10 12:5 14:5 to 20:2
50 11:0 8:11 9:5 to 13:2
NARA for Pupils with Low Vision 27
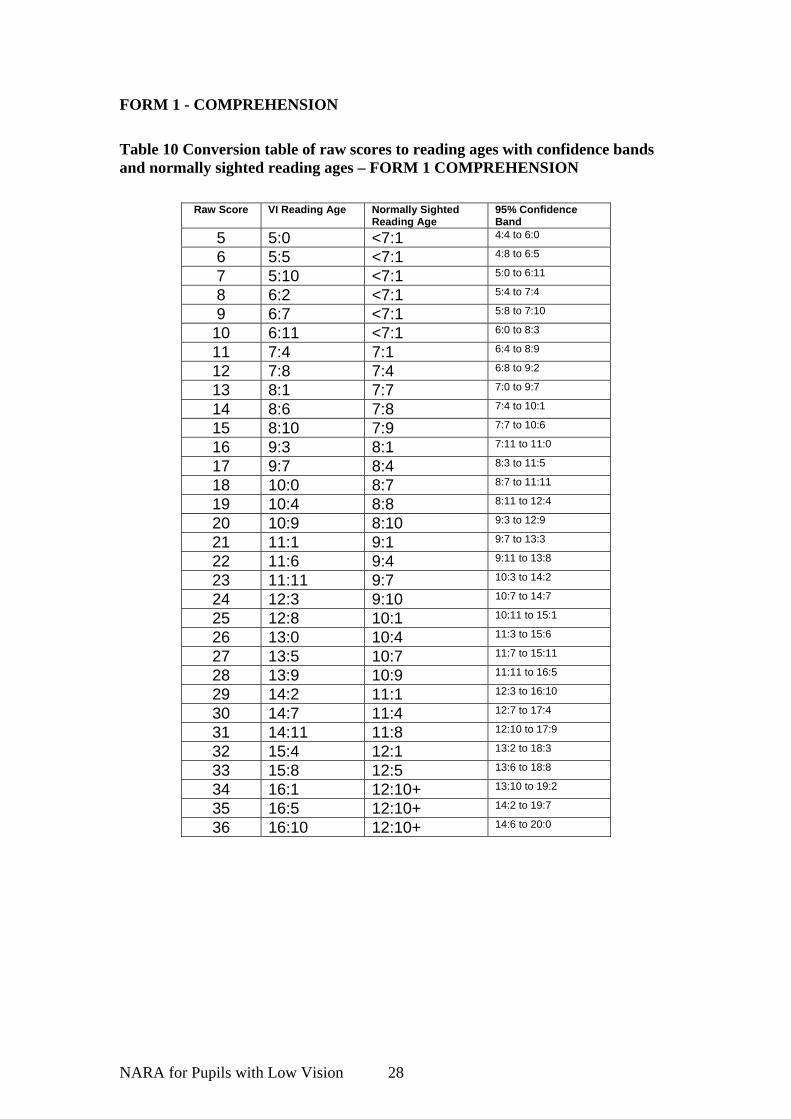
FORM 1 - COMPREHENSION
Table 10 Conversion table of raw scores to reading ages with confidence bands and normally sighted reading ages – FORM 1 COMPREHENSION
Raw Score VI Reading Age Normally Sighted Reading Age
95% Confidence Band
5 5:0 <7:1 4:4 to 6:0
6 5:5 <7:1 4:8 to 6:5
7 5:10 <7:1 5:0 to 6:11
8 6:2 <7:1 5:4 to 7:4
9 6:7 <7:1 5:8 to 7:10
10 6:11 <7:1 6:0 to 8:3
11 7:4 7:1 6:4 to 8:9
12 7:8 7:4 6:8 to 9:2
13 8:1 7:7 7:0 to 9:7
14 8:6 7:8 7:4 to 10:1
15 8:10 7:9 7:7 to 10:6
16 9:3 8:1 7:11 to 11:0
17 9:7 8:4 8:3 to 11:5
18 10:0 8:7 8:7 to 11:11
19 10:4 8:8 8:11 to 12:4
20 10:9 8:10 9:3 to 12:9
21 11:1 9:1 9:7 to 13:3
22 11:6 9:4 9:11 to 13:8
23 11:11 9:7 10:3 to 14:2
24 12:3 9:10 10:7 to 14:7
25 12:8 10:1 10:11 to 15:1
26 13:0 10:4 11:3 to 15:6
27 13:5 10:7 11:7 to 15:11
28 13:9 10:9 11:11 to 16:5
29 14:2 11:1 12:3 to 16:10
30 14:7 11:4 12:7 to 17:4
31 14:11 11:8 12:10 to 17:9
32 15:4 12:1 13:2 to 18:3
33 15:8 12:5 13:6 to 18:8
34 16:1 12:10+ 13:10 to 19:2
35 16:5 12:10+ 14:2 to 19:7
36 16:10 12:10+ 14:6 to 20:0
NARA for Pupils with Low Vision 28
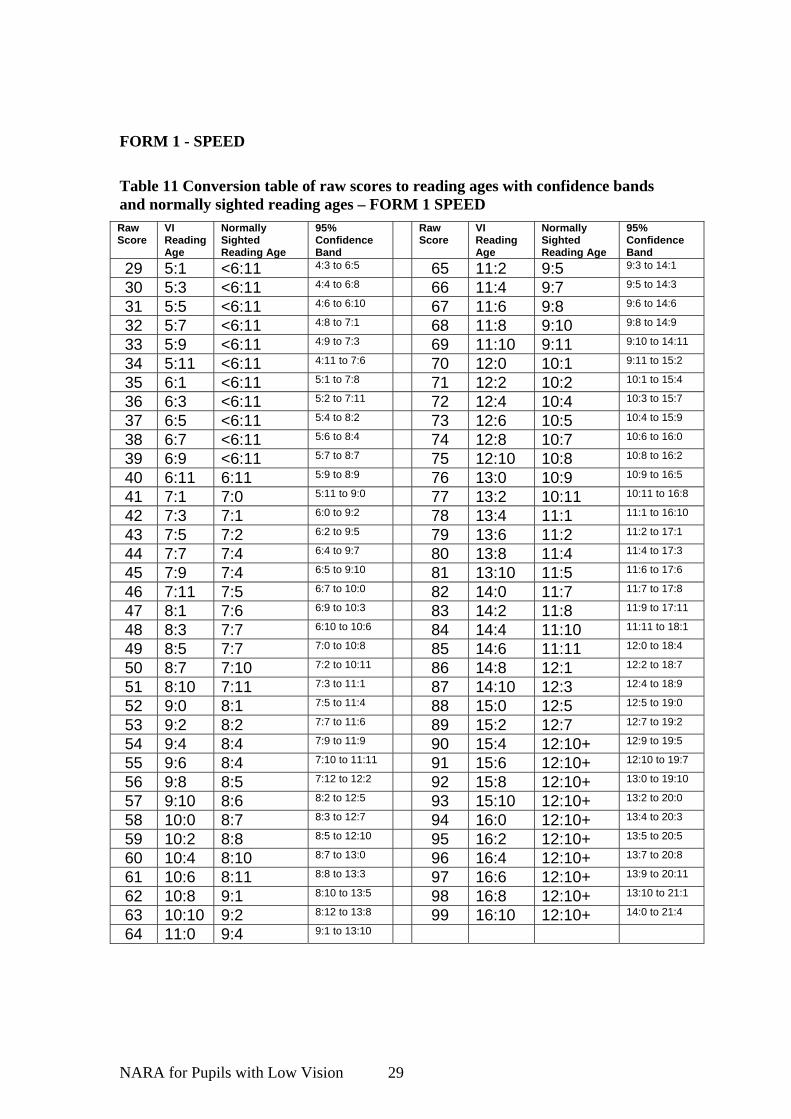
FORM 1 - SPEED
Table 11 Conversion table of raw scores to reading ages with confidence bands and normally sighted reading ages – FORM 1 SPEED Raw Score
VI Reading Age
Normally Sighted Reading Age
95% Confidence Band
Raw Score
VI Reading Age
Normally Sighted Reading Age
95% Confidence Band
29 5:1 <6:11 4:3 to 6:5 65 11:2 9:5 9:3 to 14:1
30 5:3 <6:11 4:4 to 6:8 66 11:4 9:7 9:5 to 14:3
31 5:5 <6:11 4:6 to 6:10 67 11:6 9:8 9:6 to 14:6
32 5:7 <6:11 4:8 to 7:1 68 11:8 9:10 9:8 to 14:9
33 5:9 <6:11 4:9 to 7:3 69 11:10 9:11 9:10 to 14:11
34 5:11 <6:11 4:11 to 7:6 70 12:0 10:1 9:11 to 15:2
35 6:1 <6:11 5:1 to 7:8 71 12:2 10:2 10:1 to 15:4
36 6:3 <6:11 5:2 to 7:11 72 12:4 10:4 10:3 to 15:7
37 6:5 <6:11 5:4 to 8:2 73 12:6 10:5 10:4 to 15:9
38 6:7 <6:11 5:6 to 8:4 74 12:8 10:7 10:6 to 16:0
39 6:9 <6:11 5:7 to 8:7 75 12:10 10:8 10:8 to 16:2
40 6:11 6:11 5:9 to 8:9 76 13:0 10:9 10:9 to 16:5
41 7:1 7:0 5:11 to 9:0 77 13:2 10:11 10:11 to 16:8
42 7:3 7:1 6:0 to 9:2 78 13:4 11:1 11:1 to 16:10
43 7:5 7:2 6:2 to 9:5 79 13:6 11:2 11:2 to 17:1
44 7:7 7:4 6:4 to 9:7 80 13:8 11:4 11:4 to 17:3
45 7:9 7:4 6:5 to 9:10 81 13:10 11:5 11:6 to 17:6
46 7:11 7:5 6:7 to 10:0 82 14:0 11:7 11:7 to 17:8
47 8:1 7:6 6:9 to 10:3 83 14:2 11:8 11:9 to 17:11
48 8:3 7:7 6:10 to 10:6 84 14:4 11:10 11:11 to 18:1
49 8:5 7:7 7:0 to 10:8 85 14:6 11:11 12:0 to 18:4
50 8:7 7:10 7:2 to 10:11 86 14:8 12:1 12:2 to 18:7
51 8:10 7:11 7:3 to 11:1 87 14:10 12:3 12:4 to 18:9
52 9:0 8:1 7:5 to 11:4 88 15:0 12:5 12:5 to 19:0
53 9:2 8:2 7:7 to 11:6 89 15:2 12:7 12:7 to 19:2
54 9:4 8:4 7:9 to 11:9 90 15:4 12:10+ 12:9 to 19:5
55 9:6 8:4 7:10 to 11:11 91 15:6 12:10+ 12:10 to 19:7
56 9:8 8:5 7:12 to 12:2 92 15:8 12:10+ 13:0 to 19:10
57 9:10 8:6 8:2 to 12:5 93 15:10 12:10+ 13:2 to 20:0
58 10:0 8:7 8:3 to 12:7 94 16:0 12:10+ 13:4 to 20:3
59 10:2 8:8 8:5 to 12:10 95 16:2 12:10+ 13:5 to 20:5
60 10:4 8:10 8:7 to 13:0 96 16:4 12:10+ 13:7 to 20:8
61 10:6 8:11 8:8 to 13:3 97 16:6 12:10+ 13:9 to 20:11
62 10:8 9:1 8:10 to 13:5 98 16:8 12:10+ 13:10 to 21:1
63 10:10 9:2 8:12 to 13:8 99 16:10 12:10+ 14:0 to 21:4
64 11:0 9:4 9:1 to 13:10
NARA for Pupils with Low Vision 29
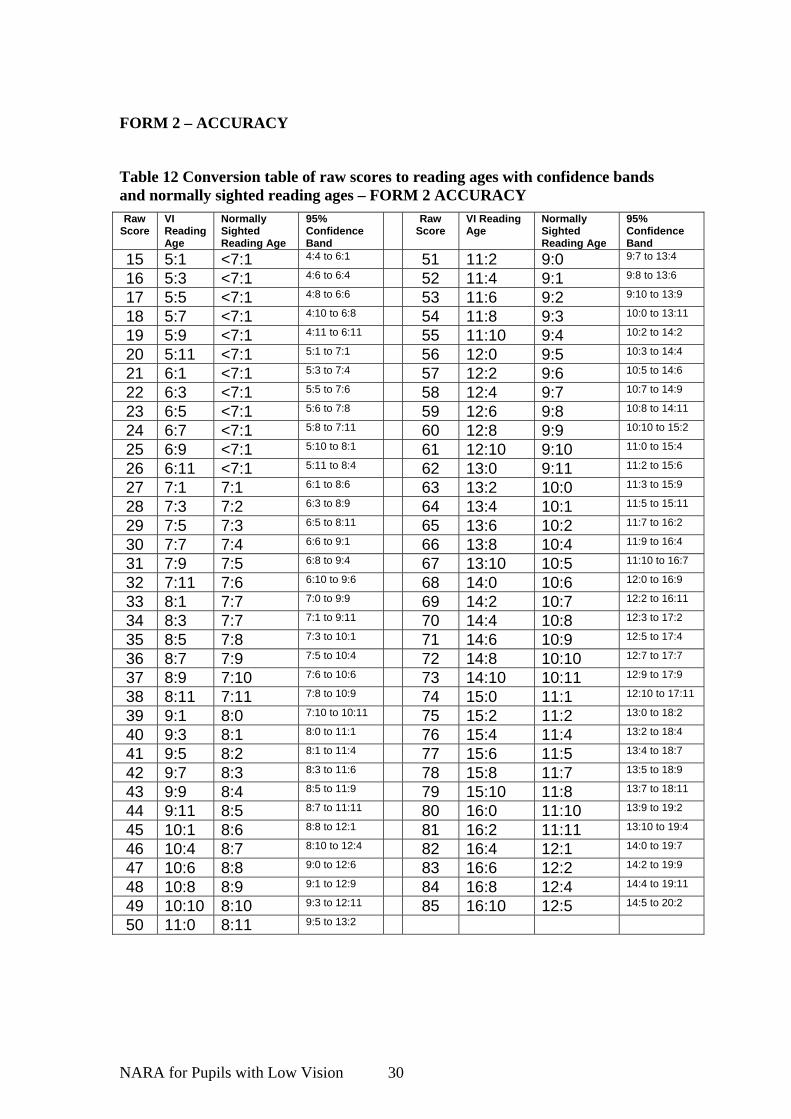
FORM 2 – ACCURACY
Table 12 Conversion table of raw scores to reading ages with confidence bands and normally sighted reading ages – FORM 2 ACCURACY Raw
Score VI Reading Age
Normally Sighted Reading Age
95% Confidence Band
Raw Score
VI Reading Age
Normally Sighted Reading Age
95% Confidence Band
15 5:1 <7:1 4:4 to 6:1 51 11:2 9:0 9:7 to 13:4
16 5:3 <7:1 4:6 to 6:4 52 11:4 9:1 9:8 to 13:6
17 5:5 <7:1 4:8 to 6:6 53 11:6 9:2 9:10 to 13:9
18 5:7 <7:1 4:10 to 6:8 54 11:8 9:3 10:0 to 13:11
19 5:9 <7:1 4:11 to 6:11 55 11:10 9:4 10:2 to 14:2
20 5:11 <7:1 5:1 to 7:1 56 12:0 9:5 10:3 to 14:4
21 6:1 <7:1 5:3 to 7:4 57 12:2 9:6 10:5 to 14:6
22 6:3 <7:1 5:5 to 7:6 58 12:4 9:7 10:7 to 14:9
23 6:5 <7:1 5:6 to 7:8 59 12:6 9:8 10:8 to 14:11
24 6:7 <7:1 5:8 to 7:11 60 12:8 9:9 10:10 to 15:2
25 6:9 <7:1 5:10 to 8:1 61 12:10 9:10 11:0 to 15:4
26 6:11 <7:1 5:11 to 8:4 62 13:0 9:11 11:2 to 15:6
27 7:1 7:1 6:1 to 8:6 63 13:2 10:0 11:3 to 15:9
28 7:3 7:2 6:3 to 8:9 64 13:4 10:1 11:5 to 15:11
29 7:5 7:3 6:5 to 8:11 65 13:6 10:2 11:7 to 16:2
30 7:7 7:4 6:6 to 9:1 66 13:8 10:4 11:9 to 16:4
31 7:9 7:5 6:8 to 9:4 67 13:10 10:5 11:10 to 16:7
32 7:11 7:6 6:10 to 9:6 68 14:0 10:6 12:0 to 16:9
33 8:1 7:7 7:0 to 9:9 69 14:2 10:7 12:2 to 16:11
34 8:3 7:7 7:1 to 9:11 70 14:4 10:8 12:3 to 17:2
35 8:5 7:8 7:3 to 10:1 71 14:6 10:9 12:5 to 17:4
36 8:7 7:9 7:5 to 10:4 72 14:8 10:10 12:7 to 17:7
37 8:9 7:10 7:6 to 10:6 73 14:10 10:11 12:9 to 17:9
38 8:11 7:11 7:8 to 10:9 74 15:0 11:1 12:10 to 17:11
39 9:1 8:0 7:10 to 10:11 75 15:2 11:2 13:0 to 18:2
40 9:3 8:1 8:0 to 11:1 76 15:4 11:4 13:2 to 18:4
41 9:5 8:2 8:1 to 11:4 77 15:6 11:5 13:4 to 18:7
42 9:7 8:3 8:3 to 11:6 78 15:8 11:7 13:5 to 18:9
43 9:9 8:4 8:5 to 11:9 79 15:10 11:8 13:7 to 18:11
44 9:11 8:5 8:7 to 11:11 80 16:0 11:10 13:9 to 19:2
45 10:1 8:6 8:8 to 12:1 81 16:2 11:11 13:10 to 19:4
46 10:4 8:7 8:10 to 12:4 82 16:4 12:1 14:0 to 19:7
47 10:6 8:8 9:0 to 12:6 83 16:6 12:2 14:2 to 19:9
48 10:8 8:9 9:1 to 12:9 84 16:8 12:4 14:4 to 19:11
49 10:10 8:10 9:3 to 12:11 85 16:10 12:5 14:5 to 20:2
50 11:0 8:11 9:5 to 13:2
NARA for Pupils with Low Vision 30
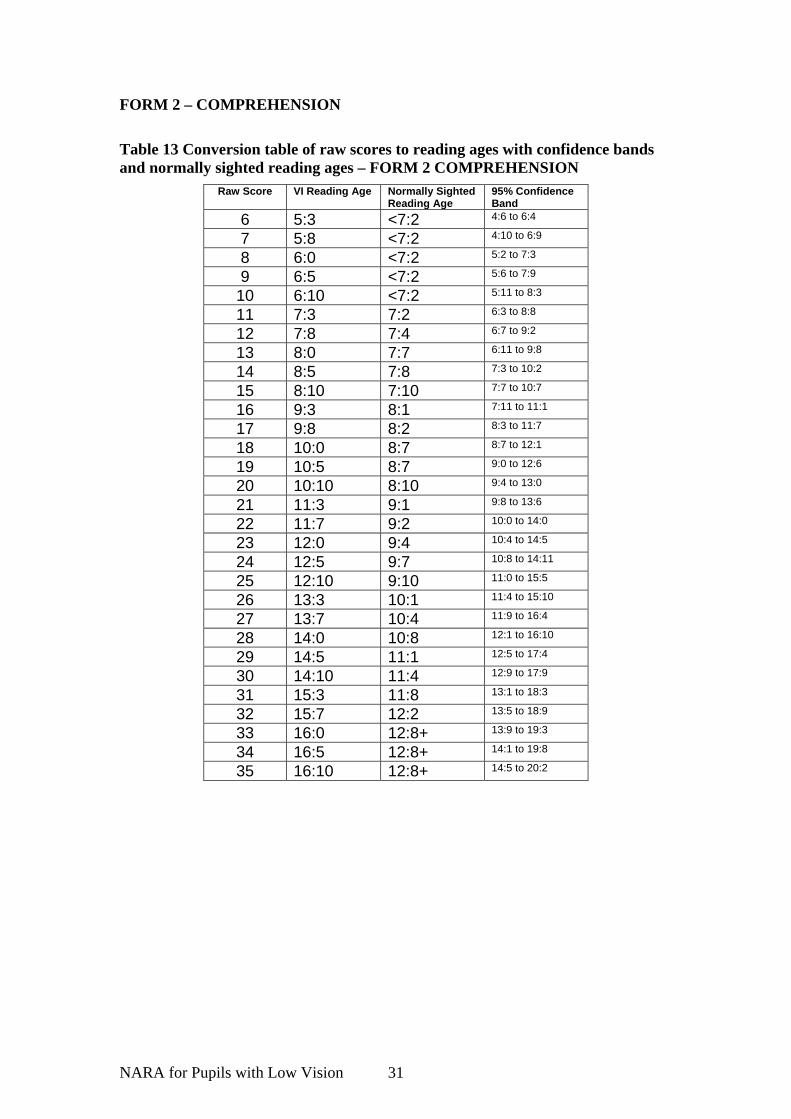
FORM 2 – COMPREHENSION
Table 13 Conversion table of raw scores to reading ages with confidence bands and normally sighted reading ages – FORM 2 COMPREHENSION
Raw Score VI Reading Age Normally Sighted Reading Age
95% Confidence Band
6 5:3 <7:2 4:6 to 6:4
7 5:8 <7:2 4:10 to 6:9
8 6:0 <7:2 5:2 to 7:3
9 6:5 <7:2 5:6 to 7:9
10 6:10 <7:2 5:11 to 8:3
11 7:3 7:2 6:3 to 8:8
12 7:8 7:4 6:7 to 9:2
13 8:0 7:7 6:11 to 9:8
14 8:5 7:8 7:3 to 10:2
15 8:10 7:10 7:7 to 10:7
16 9:3 8:1 7:11 to 11:1
17 9:8 8:2 8:3 to 11:7
18 10:0 8:7 8:7 to 12:1
19 10:5 8:7 9:0 to 12:6
20 10:10 8:10 9:4 to 13:0
21 11:3 9:1 9:8 to 13:6
22 11:7 9:2 10:0 to 14:0
23 12:0 9:4 10:4 to 14:5
24 12:5 9:7 10:8 to 14:11
25 12:10 9:10 11:0 to 15:5
26 13:3 10:1 11:4 to 15:10
27 13:7 10:4 11:9 to 16:4
28 14:0 10:8 12:1 to 16:10
29 14:5 11:1 12:5 to 17:4
30 14:10 11:4 12:9 to 17:9
31 15:3 11:8 13:1 to 18:3
32 15:7 12:2 13:5 to 18:9
33 16:0 12:8+ 13:9 to 19:3
34 16:5 12:8+ 14:1 to 19:8
35 16:10 12:8+ 14:5 to 20:2
NARA for Pupils with Low Vision 31
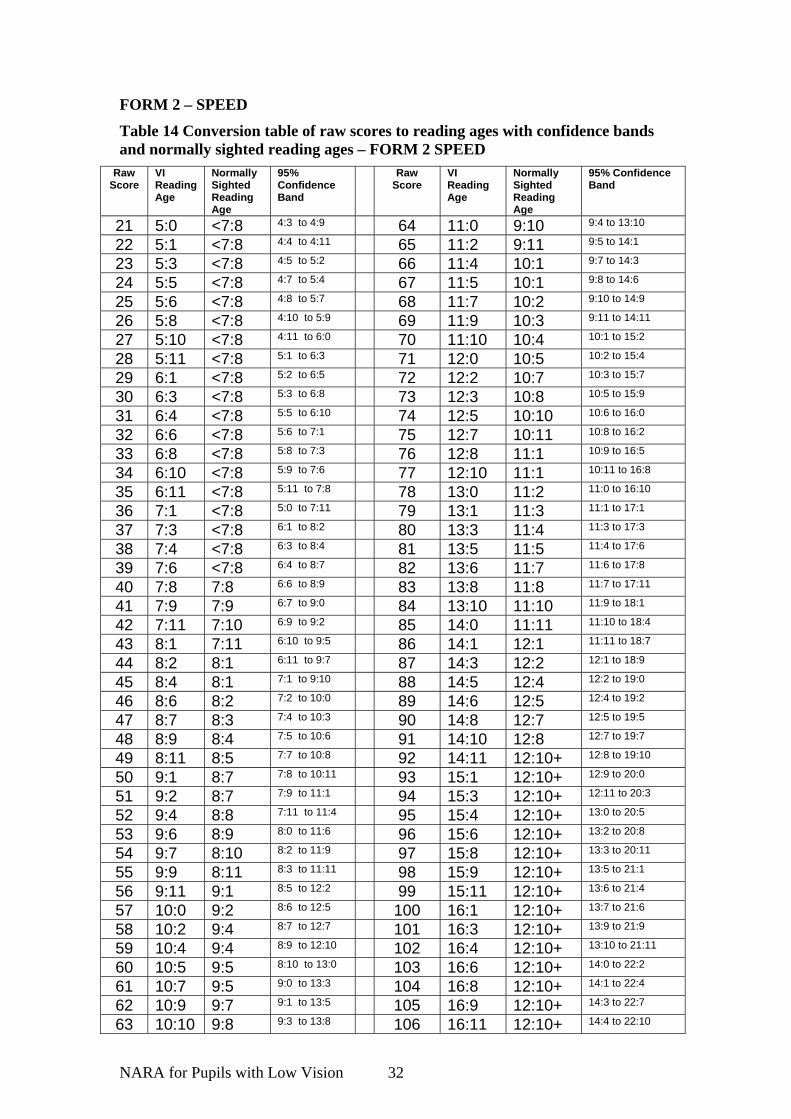
FORM 2 – SPEED
Table 14 Conversion table of raw scores to reading ages with confidence bands and normally sighted reading ages – FORM 2 SPEED
Raw Score
VI Reading Age
Normally Sighted Reading Age
95% Confidence Band
Raw Score
VI Reading Age
Normally Sighted Reading Age
95% Confidence Band
21 5:0 <7:8 4:3 to 4:9 64 11:0 9:10 9:4 to 13:10
22 5:1 <7:8 4:4 to 4:11 65 11:2 9:11 9:5 to 14:1
23 5:3 <7:8 4:5 to 5:2 66 11:4 10:1 9:7 to 14:3
24 5:5 <7:8 4:7 to 5:4 67 11:5 10:1 9:8 to 14:6
25 5:6 <7:8 4:8 to 5:7 68 11:7 10:2 9:10 to 14:9
26 5:8 <7:8 4:10 to 5:9 69 11:9 10:3 9:11 to 14:11
27 5:10 <7:8 4:11 to 6:0 70 11:10 10:4 10:1 to 15:2
28 5:11 <7:8 5:1 to 6:3 71 12:0 10:5 10:2 to 15:4
29 6:1 <7:8 5:2 to 6:5 72 12:2 10:7 10:3 to 15:7
30 6:3 <7:8 5:3 to 6:8 73 12:3 10:8 10:5 to 15:9
31 6:4 <7:8 5:5 to 6:10 74 12:5 10:10 10:6 to 16:0
32 6:6 <7:8 5:6 to 7:1 75 12:7 10:11 10:8 to 16:2
33 6:8 <7:8 5:8 to 7:3 76 12:8 11:1 10:9 to 16:5
34 6:10 <7:8 5:9 to 7:6 77 12:10 11:1 10:11 to 16:8
35 6:11 <7:8 5:11 to 7:8 78 13:0 11:2 11:0 to 16:10
36 7:1 <7:8 5:0 to 7:11 79 13:1 11:3 11:1 to 17:1
37 7:3 <7:8 6:1 to 8:2 80 13:3 11:4 11:3 to 17:3
38 7:4 <7:8 6:3 to 8:4 81 13:5 11:5 11:4 to 17:6
39 7:6 <7:8 6:4 to 8:7 82 13:6 11:7 11:6 to 17:8
40 7:8 7:8 6:6 to 8:9 83 13:8 11:8 11:7 to 17:11
41 7:9 7:9 6:7 to 9:0 84 13:10 11:10 11:9 to 18:1
42 7:11 7:10 6:9 to 9:2 85 14:0 11:11 11:10 to 18:4
43 8:1 7:11 6:10 to 9:5 86 14:1 12:1 11:11 to 18:7
44 8:2 8:1 6:11 to 9:7 87 14:3 12:2 12:1 to 18:9
45 8:4 8:1 7:1 to 9:10 88 14:5 12:4 12:2 to 19:0
46 8:6 8:2 7:2 to 10:0 89 14:6 12:5 12:4 to 19:2
47 8:7 8:3 7:4 to 10:3 90 14:8 12:7 12:5 to 19:5
48 8:9 8:4 7:5 to 10:6 91 14:10 12:8 12:7 to 19:7
49 8:11 8:5 7:7 to 10:8 92 14:11 12:10+ 12:8 to 19:10
50 9:1 8:7 7:8 to 10:11 93 15:1 12:10+ 12:9 to 20:0
51 9:2 8:7 7:9 to 11:1 94 15:3 12:10+ 12:11 to 20:3
52 9:4 8:8 7:11 to 11:4 95 15:4 12:10+ 13:0 to 20:5
53 9:6 8:9 8:0 to 11:6 96 15:6 12:10+ 13:2 to 20:8
54 9:7 8:10 8:2 to 11:9 97 15:8 12:10+ 13:3 to 20:11
55 9:9 8:11 8:3 to 11:11 98 15:9 12:10+ 13:5 to 21:1
56 9:11 9:1 8:5 to 12:2 99 15:11 12:10+ 13:6 to 21:4
57 10:0 9:2 8:6 to 12:5 100 16:1 12:10+ 13:7 to 21:6
58 10:2 9:4 8:7 to 12:7 101 16:3 12:10+ 13:9 to 21:9
59 10:4 9:4 8:9 to 12:10 102 16:4 12:10+ 13:10 to 21:11
60 10:5 9:5 8:10 to 13:0 103 16:6 12:10+ 14:0 to 22:2
61 10:7 9:5 9:0 to 13:3 104 16:8 12:10+ 14:1 to 22:4
62 10:9 9:7 9:1 to 13:5 105 16:9 12:10+ 14:3 to 22:7
63 10:10 9:8 9:3 to 13:8 106 16:11 12:10+ 14:4 to 22:10
NARA for Pupils with Low Vision 32
REFERENCES
Clunies-Ross, L. and Franklin, A. (1997). Where Have All the children Gone? An analysis of new statistical data on visual impairment amongst pupil in England, Scotland, and Wales. British Journal of Visual Impairment, 15, 2, 48-53.
Greaney, J., Hill, E and Tobin, M (1998) Neale Analysis of Reading Ability:
University of Birmingham, Users’ Manual. Royal National Institute for the Blind NFER/Nelson Publishing Company Ltd, Windsor.
Keeffe, J. (2001). What size print is best? Journal of South Pacific Educators in
Vision Impairment, 2, 1, 17-20. Long, R., Douglas, G., Hill, E., and Cross, M. (2002). Choosing font size when
testing reading - Bigger isn’t necessarily better. VICTAR Research Paper, University of Birmingham.
Neale, M. D. (1997) Neale Analysis of Reading Ability – Revised: Manual for
Schools. NFER-Nelson, Windsor. Tobin, M. J. (1993). The Educational Implications of Visual Impairment. In: A. R.
Fielder, A. B. Best, and M. C. O. Bax (Eds.) The Management of Visual Impairment in Childhood. London: Mac Keith Press, 143-149.
Tobin, M. J. (1998). Is Blindness A Handicap? Inaugural Lecture, 19th February,
1998. School of Education, University of Birmingham.
NARA for Pupils with Low Vision 33
Un
VISUAL IMPAIRM
B
Email: vWeb: www.ed
NARA for Pupils with Low Vi
ISBN: 0704425165
iversity of Birmingham School of Education ENT CENTRE FOR TEACHING AND
RESEARCH Edgbaston
irmingham B15 2TT
Tel: 0121 414 6733 [email protected]/research/victar
sion 34


![[ NATASHA NEALE ] [ ALICE BAI ]](https://img.pdfslide.net/doc/110x75/5896fd0f1a28abf03a8c3fdb/-natasha-neale-alice-bai-.jpg)