Embed Size (px)
Citation preview
20152015Regional Overview of Food Insecurity
Near East and North Africa
Strengthening Regional Collaboration
to Build Resilience for Food Security and Nutrition
Regional Overview of Food Insecurity
Near East and North AfricaKey messages
J Fifteen countries out of 19 in the Near East and North Africa region have met the MDG hunger target. However, the region as a whole has witnessed a significant setback in the fight against hunger due to conflicts and protracted crises.
J The region is becoming increasingly dependent on food imports, because of demographic pressure, rapid urbanization, water scarcity and climate change.
J Rebalancing regional trade requires a renewed focus on the region’s comparative advantage in high-value crops and realizing its potential in intraregional trade.
J Improving nutrition, strengthening safety nets, reducing food losses and waste and promoting sustainable water management and agricultural productivity should be at the top of the food security and nutrition agenda in the region.
J Regional collaboration is critical to address the multiple threats and risks to food security and nutrition and to build resilience in the NENA region.
I4644E/1/05.15
ISBN 978-92-5-108787-9
9 7 8 9 2 5 1 0 8 7 8 7 9

2015
Regional Overview of Food InsecurityNear East and North Africa
Strengthening Regional Collaboration
to Build Resilience for Food Security and Nutrition
FOOd and agRIcultuRe ORganIzatIOn OF the unIted natIOns
2015
Required citation:
FaO. 2015. Regional Overview of Food Insecurity - near east and north africa:strengthening Regional collaboration to Build Resilience for Food security and nutrition, cairo, egypt, FaO.
The designations employed and the presentation of material in this informationproduct do not imply the expression of any opinion whatsoever on the part of theFood and Agriculture Organization of the United Nations (FAO) concerning the legalor development status of any country, territory, city or area or of its authorities, orconcerning the delimitation of its frontiers or boundaries. The mention of specificcompanies or products of manufacturers, whether or not these have been patented,does not imply that these have been endorsed or recommended by FAO in preferenceto others of a similar nature that are not mentioned.
ISBN 978-92-5-108787-9
FAO encourages the use, reproduction and dissemination of material in this informationproduct. Except where otherwise indicated, material may be copied, downloaded andprinted for private study, research and teaching purposes, or for use in non-commercialproducts or services, provided that appropriate acknowledgement of FAO as the sourceand copyright holder is given and that FAO’s endorsement of users’ views, products orservices is not implied in any way.
All requests for translation and adaptation rights, and for resale and other commercialuse rights should be made via www.fao.org/contact-us/licence-request or addressed [email protected].
FAO information products are available on the FAO website (www.fao.org/publications)and can be purchased through [email protected].
© FAO 2015
iv Foreword v Acknowledgements vi Abbreviations and Acronyms vii List of Figures and Tables
1 Part I Progress towards the Achievement of the Millennium
Development Goals and World Food Summit Hunger Targets
4 Part II NENA’s Food Security Situation along the Four Dimensions:
Availability, Access, Utilization and Stability
20 Bibliography
C O N T E N T S
iv
This year, the world takes stock of progress made towards achieving the 2000–2015 Millennium development goals (Mdgs). In concert with this milestone and, for the first time, the Food and agriculture Organization of the united nations publishes a Regional Overview of Food Insecurity in its near east and north africa
(nena) region. the goal of the Panorama is to give an overview of nena’s progress towards the achievement of the Mdg and World Food summit report hunger targets, using data from the 2015 edition of FaO’s state of Food Insecurity in the World. It also provides an in-depth analysis of the current situation in the region, viewed through the four dimensions of food security: availability, access, utilization and stability.
the food security and nutrition picture emerging from the Panorama Overview is a mixed one. the region as a whole has witnessed a serious setback in its fight against hunger. It is the only region that has seen an increase in the prevalence of hunger and a doubling in the number of hungry people, which now stands at 33 million. the vast majority of the people affected by food insecurity live in Iraq, sudan, syria and Yemen as well as in the West Bank and the gaza strip. conflicts and protracted crises are the main drivers of food insecurity in the region.
Yet, as disappointing as that may be, the global regional picture should not overshadow the substantial progress made by several countries in the region in their fight against hunger and malnutrition. a large majority of the countries, more precisely 15 out of 19, have achieved the Mdg hunger target of halving the prevalence of undernourishment by 2015 or maintained their undernourishment rates below 5 percent. Of these, two countries, the state of Kuwait and the sultanate of Oman, have also achieved the more ambitious World Food summit target of halving the number of hungry people.
these achievements reflect years of determined actions on several fronts. countries in the region have long prioritized food security on their agendas. they have increased their agriculture production, significantly improved their food exports and implemented large-scale social protection programmes. these policies have translated into increased availability of food, and contributed to improving food access and reducing extreme poverty, in both urban and rural areas.
In analysing some of the major challenges that the region is facing in achieving its food security objectives, the report shows that the region’s rapidly shrinking freshwater resources, exacerbated by climate change, pose major constraints for all dimensions of food security, notably for availability and stability but even for food utilization, hygiene and safety. Water scarcity has also driven up the region’s cereal import needs and heightened its exposure to the volatility of international markets. the report underscores the imperative of establishing sound and effective policies for sustainable water management, and it argues that there is room for improving levels and sustainability of agricultural production. countries , the report argues, should prioritize agricultural productivity, tap into their comparative advantage in high-value crops and harness the potential of the fisheries sector, whenever possible.
the report also highlights how progress in availability of and access to food has not always translated into similar progress on the nutrition front. Most countries in the region face a triple burden of malnutrition with moderate rates of chronic hunger, high rates of malnutrition and anaemia among children and high overall rates of overweight and obesity.
the Panorama Overview calls for strengthened regional collaboration to address the multiple threats and risks to food insecurity and malnutrition in the region. It calls on countries to develop and implement comprehensive and consultative food security agendas and to put nutrition, social protection, agricultural productivity, food losses and waste and sustainable water management at the top of their policy agenda.
FaO, working together with its regional and international partners, remains committed to providing the best of its technical support in this endeavour.
Abdessalam Ould AhmedAssistant Director-General/Regional Representative Regional Office for the Near East and North Africa
F O R E W O R D
v
T his Regional Overview of Food Insecurity in the near east and north africa region is the result of a collaborative effort between the Food and agriculture Organization of the united nations’ (FaO) Regional Office for the near east and north africa (Rne) in cairo and the statistics division of the economic and social development department
at FaO headquarters in Rome, under the overall guidance of abdessalam Ould ahmed, FaO assistant director-general and Regional Representative for the near east and north africa.
several FaO staff members from the region contributed to the report. these include, in alphabetical order, ciro Fiorillo, Fatima hachem, Fawzi Karajeh, hala hafez, Isin tellioglu, Jennifer smolak, Maha zaki, Malika Martini, Mamoon al alawi, Markos tibbo, Maurice saade, Mohamed aw-dahir, Mohamed Barre, Mohamed lemine hamouny, nasredin hag elamin, Pasquale steduto, Paula anton, and tatjana Popovic-Manenti. areej Jafari, Filippo gheri, Joseph schmidhuber, Kostas stamoulis, lori curtis, Piero conforti and sachiko tsuji from FaO headquarters also made contributions to various sections of the report.
Magdi latif from Rne, assisted by Mariam hassanien and ashraf said, coordinated the publishing process, with valuable support from Raschad alKhafaji from the Office of the director-general, and Mario lubetkin and Patricia Pascau in the Office for corporate communication at headquarters and their colleagues. copy editing and proofreading of an earlier version of the report was provided by nancy eleanor hart.
A c k n o w l e d g e m e n t s
vi
Abbreviations and Acronyms
aMu arab Maghreb unionastI agricultural science and technology Indicatorscaeu council for arab economic unitycRc commission for controlling desert locust in the central Region (FaO)clcPRO commission for controlling desert locust in the Western Region (FaO) dl desert locustdRR disaster risk reductionescWa (united nations) economic and social commission for Western asia FlW Food loss and wasteFMd Foot-and-mouth diseasegcc gulf cooperation councilgdP gross domestic producthPaI highly pathogenic avian influenzaldc least developed countryIMF International Monetary Fundlsd lumpy skin diseaseMdg Millennium development goalnena near east and north africanPl national Poverty lineOIe World Organisation for animal healthPPP Purchasing power parity PPR Peste des petits ruminantsR&d Research and developmentsgP sheep and goat poxsOFI state of Food Insecurity in the Worldtad transboundary animal diseasesWFP World Food Programme (un)WFs World Food summitWRI World Resources InstituteWhO World health OrganizationWtO World trade Organization
A b b r e v i a t i o n s a n d A c r o n y m s
vii
List of Figures
Figure 1: undernourished people in the world and nena region, 1990–92 to 2014–16 1Figure 2: Prevalence of undernourishment in nena subregions in different periods 1Figure 3: undernourished people in nena subregions in different periods 2Figure 4: dietary energy supply for the world and nena subregions 2Figure 5: nena’s rising trade deficit for food and agricultural products 3Figure 6: evolution of cereal production and imports in the nena region 3Figure 7: land and water availability in nena and the world 4Figure 8: Food production and apparent consumption trends, nena, 1980–2011 5Figure 9: cereal yields in lIdFcs, the world and nena 6Figure 10: Reported landings of capture fisheries by source in the near east and north africa 7Figure 11: aquaculture production in the near east and north africa, 1980-2013 8Figure 12: evolution of fish imports, exports and net trade in nena region, 1980–2011 8Figure 13: Projected increase in per-capita demand for livestock products by 2030 9Figure 14: egypt, rapidly rising exports of fruit and vegetables 9Figure 15: structure of nena’s agricultural trade, 2013 10Figure 16: gInI index (1990s and 2000s) 11Figure 17: cost-benefit ratio for the poorest quintile: poverty gap reduction obtained for each usd 1
spent in social protection programmes 12Figure 18: trends of female active population in the nena region 13Figure 19: Prevalence of stunting among children under five years of age in nena countries 13Figure 20: Prevalence of obesity among adults (15 +) in nena countries by gender, 2010 13Figure 21: Prevalence of anaemia among children under five years of age in nena countries 14Figure 22: current account deficit and import cereal dependency 15Figure 23: annual tads and zoonoses outbreaks in the nena region, 2005-2014 19
List of Tables
table 1: nena countries’ progress in achieving WFs and Mdg hunger targets 1table 2: agricultural R&d indicators in public institutions for selected nena 6table 3: estimates of food losses in selected fruit and vegetables, in selected nena countries 7table 4: Poverty headcount ratio at the usd 1.25/day and at the nPl 11table 5: syria key economic indicators before and after the conflict 15
L i s t o f F i g u r e s a n d T a b l e s

1
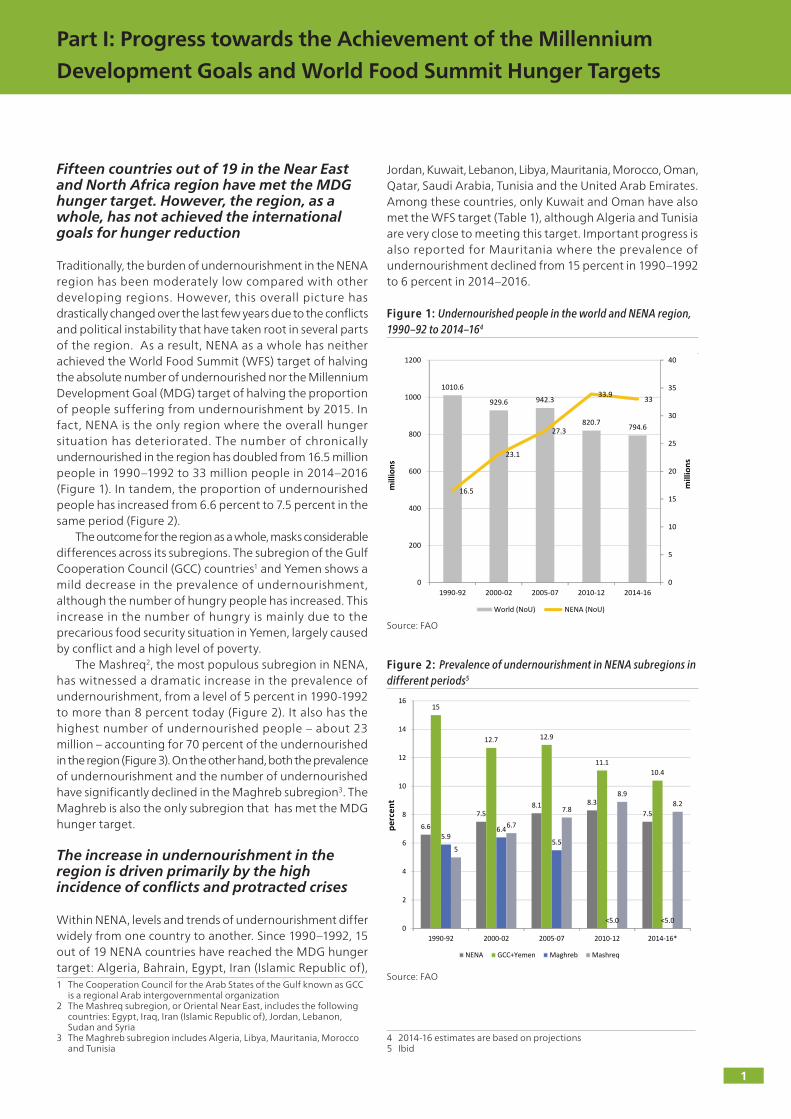
Fifteen countries out of 19 in the Near East and North Africa region have met the MDG hunger target. However, the region, as a whole, has not achieved the international goals for hunger reduction
Traditionally, the burden of undernourishment in the NENA region has been moderately low compared with other developing regions. However, this overall picture has drastically changed over the last few years due to the conflicts and political instability that have taken root in several parts of the region. As a result, NENA as a whole has neither achieved the World Food Summit (WFS) target of halving the absolute number of undernourished nor the Millennium Development Goal (MDG) target of halving the proportion of people suffering from undernourishment by 2015. In fact, NENA is the only region where the overall hunger situation has deteriorated. The number of chronically undernourished in the region has doubled from 16.5 million people in 1990–1992 to 33 million people in 2014–2016
same period (Figure 2).The outcome for the region as a whole, masks considerable
differences across its subregions. The subregion of the Gulf Cooperation Council (GCC) countries1 and Yemen shows a mild decrease in the prevalence of undernourishment, although the number of hungry people has increased. This increase in the number of hungry is mainly due to the precarious food security situation in Yemen, largely caused by conflict and a high level of poverty.
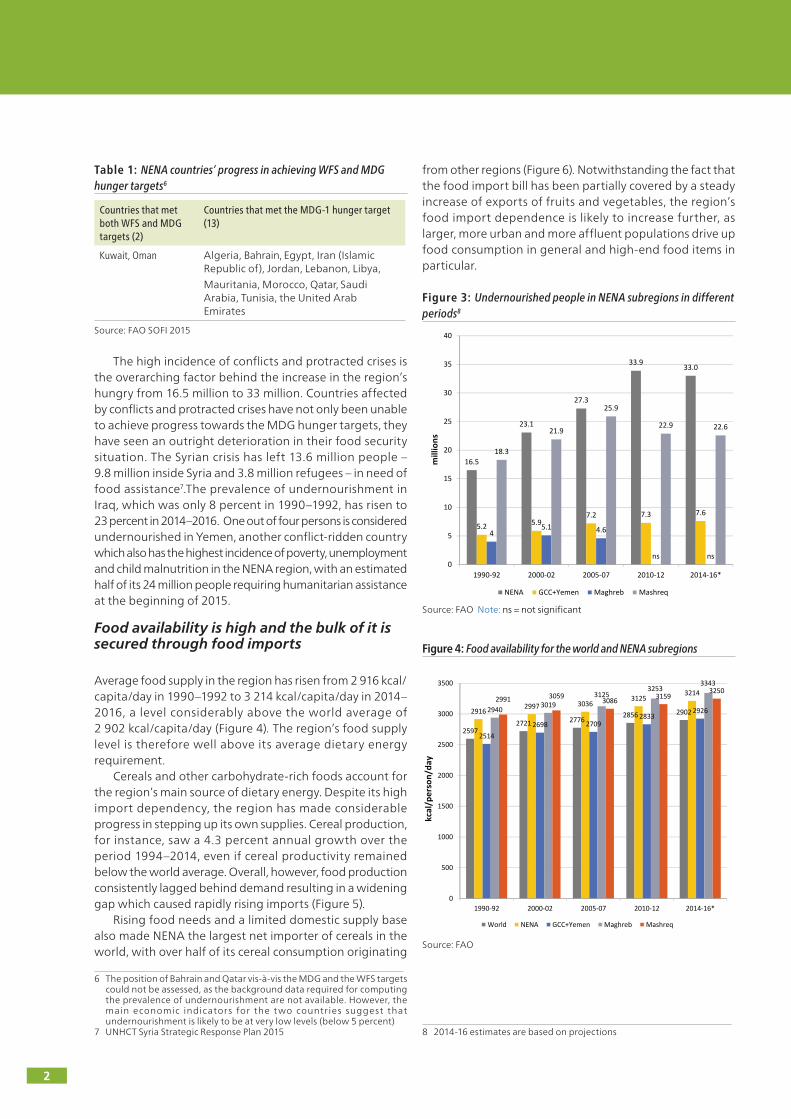
The Mashreq2, the most populous subregion in NENA, has witnessed a dramatic increase in the prevalence of undernourishment, from a level of 5 percent in 1990-1992 to more than 8 percent today (Figure 2). It also has the highest number of undernourished people – about 23 million – accounting for 70 percent of the undernourished in the region (Figure 3). On the other hand, both the prevalence of undernourishment and the number of undernourished have significantly declined in the Maghreb subregion3. The Maghreb is also the only subregion that has met the MDG hunger target.
The increase in undernourishment in the region is driven primarily by the high incidence of conflicts and protracted crises
Within NENA, levels and trends of undernourishment differ widely from one country to another. Since 1990–1992, 15 out of 19 NENA countries have reached the MDG hunger target: Algeria, Bahrain, Egypt, Iran (Islamic Republic of), 1 The Cooperation Council for the Arab States of the Gulf known as GCC
is a regional Arab intergovernmental organization2 The Mashreq subregion, or Oriental Near East, includes the following
countries: Egypt, Iraq, Iran (Islamic Republic of), Jordan, Lebanon, Sudan and Syria
3 The Maghreb subregion includes Algeria, Libya, Mauritania, Morocco and Tunisia
Jordan, Kuwait, Lebanon, Libya, Mauritania, Morocco, Oman, Qatar, Saudi Arabia, Tunisia and the United Arab Emirates. Among these countries, only Kuwait and Oman have also met the WFS target (Table 1), although Algeria and Tunisia are very close to meeting this target. Important progress is also reported for Mauritania where the prevalence of undernourishment declined from 15 percent in 1990–1992 to 6 percent in 2014–2016.
Figure 1: Undernourished people in the world and NENA region, 1990–92 to 2014–164
Source: FAO
Figure 2: Prevalence of undernourishment in NENA subregions in different periods5
Source: FAO
4 2014-16 estimates are based on projections5 Ibid
1010.6
929.6 942.3
820.7 794.6
16.5
23.1
27.3
33.9 33
0
5
10
15
20
25
30
35
40
0
200
400
600
800
1000
1200
1990-92 2000-02 2005-07 2010-12 2014-16
mill
ions
mill
ions
World (NoU) NENA (NoU)
6.6
7.58.1 8.3
7.5
15
12.7 12.9
11.110.4
5.96.4
5.5
<5.0 <5.0
5
6.7
7.8
8.98.2
0
2
4
6
8
10
12
14
16
1990-92 2000-02 2005-07 2010-12 2014-16*
perc
ent
NENA GCC+Yemen Maghreb Mashreq
Part I: Progress towards the Achievement of the Millennium
Development Goals and World Food Summit Hunger Targets
2
Table 1: NENA countries’ progress in achieving WFS and MDG hunger targets6
the high incidence of conflicts and protracted crises is the overarching factor behind the increase in the region’s hungry from 16.5 million to 33 million. countries affected by conflicts and protracted crises have not only been unable to achieve progress towards the Mdg hunger targets, they have seen an outright deterioration in their food security situation. the syrian crisis has left 13.6 million people – 9.8 million inside syria and 3.8 million refugees – in need of food assistance7.the prevalence of undernourishment in Iraq, which was only 8 percent in 1990–1992, has risen to 23 percent in 2014–2016. One out of four persons is considered undernourished in Yemen, another conflict-ridden country which also has the highest incidence of poverty, unemployment and child malnutrition in the nena region, with an estimated half of its 24 million people requiring humanitarian assistance at the beginning of 2015.
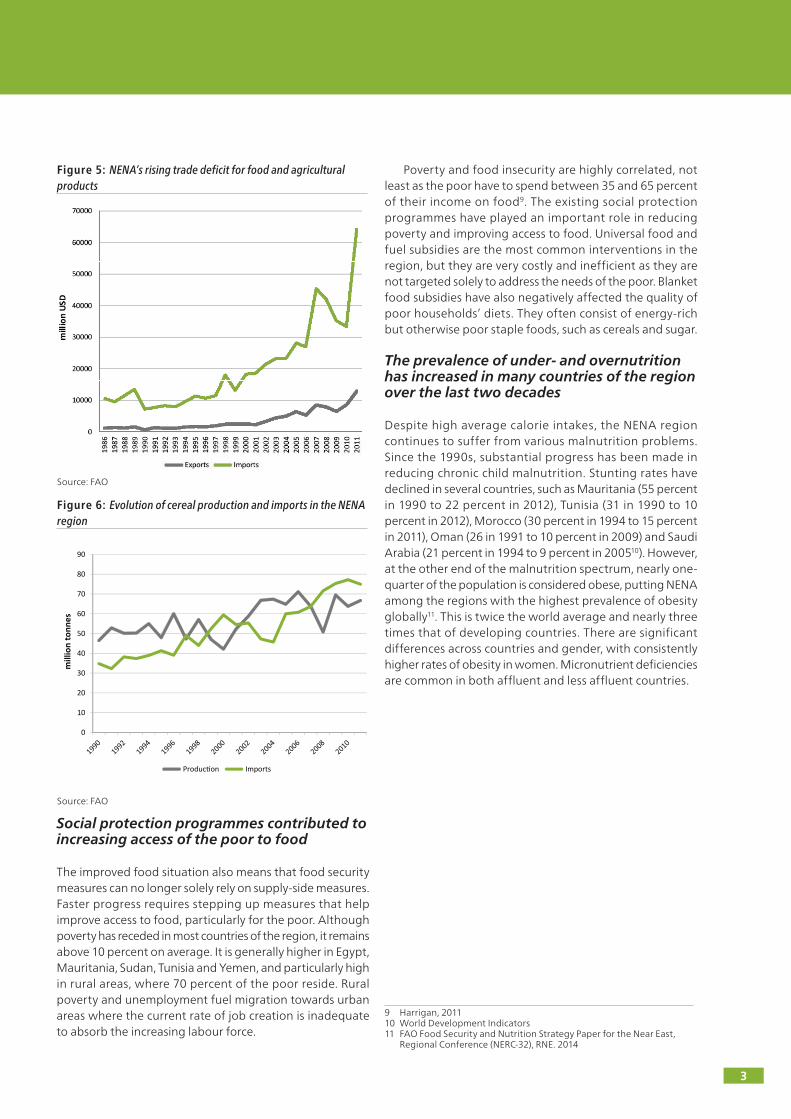
Food availability is high and the bulk of it is secured through food imports
average food supply in the region has risen from 2 916 kcal/capita/day in 1990–1992 to 3 214 kcal/capita/day in 2014–2016, a level considerably above the world average of 2 902 kcal/capita/day (Figure 4). the region’s food supply level is therefore well above its average dietary energy requirement.
cereals and other carbohydrate-rich foods account for the region’s main source of dietary energy. despite its high import dependency, the region has made considerable progress in stepping up its own supplies. cereal production, for instance, saw a 4.3 percent annual growth over the period 1994–2014, even if cereal productivity remained below the world average. Overall, however, food production consistently lagged behind demand resulting in a widening gap which caused rapidly rising imports (Figure 5).
Rising food needs and a limited domestic supply base also made nena the largest net importer of cereals in the world, with over half of its cereal consumption originating
6 the position of Bahrain and Qatar vis-à-vis the Mdg and the WFs targets could not be assessed, as the background data required for computing the prevalence of undernourishment are not available. however, the main economic indicators for the t wo countries suggest that undernourishment is likely to be at very low levels (below 5 percent)
7 unhct syria strategic Response Plan 2015
from other regions (Figure 6). notwithstanding the fact that the food import bill has been partially covered by a steady increase of exports of fruits and vegetables, the region’s food import dependence is likely to increase further, as larger, more urban and more affluent populations drive up food consumption in general and high-end food items in particular.
Figure 3: Undernourished people in NENA subregions in different periods8
source: FaO note: ns = not significant
Figure 4: Food availability for the world and NENA subregions
source: FaO
8 2014-16 estimates are based on projections
25972721 2776
2856 290229162997 3036
31253214
25142698 2709
283329262940
30193125
32533343
2991 3059 3086 31593250
0
500
1000
1500
2000
2500
3000
3500
1990-92 2000-02 2005-07 2010-12 2014-16*
kcal
/per
son/
day
World NENA GCC+Yemen Maghreb Mashreq
16.5
23.1
27.3
33.9 33.0
5.2 5.97.2 7.3 7.6
45.1 4.6
ns ns
18.3
21.9
25.9
22.9 22.6
0
5
10
15
20
25
30
35
40
1990-92 2000-02 2005-07 2010-12 2014-16*
mill
ions
NENA GCC+Yemen Maghreb Mashreq
Countries that met both WFS and MDG targets (2)
Countries that met the MDG-1 hunger target (13)
Kuwait, Oman algeria, Bahrain, egypt, Iran (Islamic Republic of), Jordan, lebanon, libya,
Mauritania, Morocco, Qatar, saudi arabia, tunisia, the united arab emirates
source: FaO sOFI 2015
3
Social protection programmes contributed to increasing access of the poor to food
the improved food situation also means that food security measures can no longer solely rely on supply-side measures. Faster progress requires stepping up measures that help improve access to food, particularly for the poor. although poverty has receded in most countries of the region, it remains above 10 percent on average. It is generally higher in egypt, Mauritania, sudan, tunisia and Yemen, and particularly high in rural areas, where 70 percent of the poor reside. Rural poverty and unemployment fuel migration towards urban areas where the current rate of job creation is inadequate to absorb the increasing labour force.
Poverty and food insecurity are highly correlated, not least as the poor have to spend between 35 and 65 percent of their income on food9. the existing social protection programmes have played an important role in reducing poverty and improving access to food. universal food and fuel subsidies are the most common interventions in the region, but they are very costly and inefficient as they are not targeted solely to address the needs of the poor. Blanket food subsidies have also negatively affected the quality of poor households’ diets. they often consist of energy-rich but otherwise poor staple foods, such as cereals and sugar.
The prevalence of under- and overnutrition has increased in many countries of the region over the last two decades
despite high average calorie intakes, the nena region continues to suffer from various malnutrition problems. since the 1990s, substantial progress has been made in reducing chronic child malnutrition. stunting rates have declined in several countries, such as Mauritania (55 percent in 1990 to 22 percent in 2012), tunisia (31 in 1990 to 10 percent in 2012), Morocco (30 percent in 1994 to 15 percent in 2011), Oman (26 in 1991 to 10 percent in 2009) and saudi arabia (21 percent in 1994 to 9 percent in 200510). however, at the other end of the malnutrition spectrum, nearly one-quarter of the population is considered obese, putting nena among the regions with the highest prevalence of obesity globally11. this is twice the world average and nearly three times that of developing countries. there are significant differences across countries and gender, with consistently higher rates of obesity in women. Micronutrient deficiencies are common in both affluent and less affluent countries.
9 harrigan, 201110 World development Indicators11 FaO Food security and nutrition strategy Paper for the near east,
Regional conference (neRc-32), Rne. 2014
Figure 5: NENA’s rising trade deficit for food and agricultural products
Figure 6: Evolution of cereal production and imports in the NENA region
source: FaO
source: FaO
0
10
20
30
40
50
60
70
80
90
mill
ion
tonn
es
Production Imports
4
Food Availability: The Challenge of Increasing Food Supply and Sustainably Managing the Water Resources
trends in production, consumption and trade of food suggest an increasing dependence of the nena region on external sources for its basic food supplies. the major challenges in closing this widening import gap include the need to address the demographic pressures; sustainably managing the water resources; enhancing crop productivity in all areas, including crops, livestock and fisheries; reducing food losses; and managing food imports.
Due to natural resource constraints and demographic pressure, the region will continue to be a major food importer in the foreseeable future
Managing continuous population growth
the nena region is characterized by a high population growth rate of about 2 percent per annum, compared with a world average of 1.2 percent in 2010–2015. the region’s population, currently estimated at about 400 million, is expected to reach 600 million by 205012. Population growth, along with increasing urbanization and changing consumption patterns, will lead to an increasing demand for food and reduced land and water available for agriculture.
Managing the demographic pressures, primarily through education, is a priority. Family planning policies are expected to be the most effective measure towards slower population growth and eventual improvements in the socio-economic status of the households. such measures have proved to be effective in some nena countries, such as algeria, egypt, Iran (Islamic Republic of), lebanon, libya, Morocco, syria and tunisia. at present, nearly one-third of the population in the region is under 15 years of age. skill development and job generation are crucial. In rural areas, access to land, credit and technology is critical for all, notably for the otherwise disadvantaged rural youth and women.
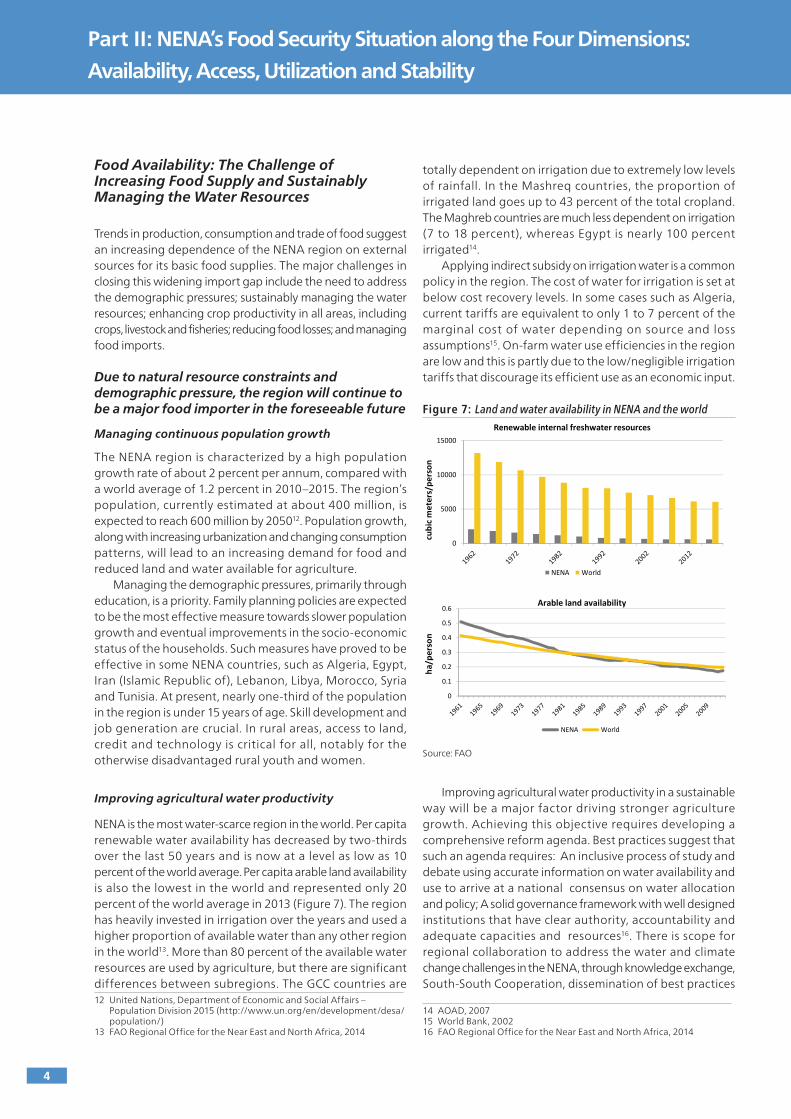
Improving agricultural water productivity
nena is the most water-scarce region in the world. Per capita renewable water availability has decreased by two-thirds over the last 50 years and is now at a level as low as 10 percent of the world average. Per capita arable land availability is also the lowest in the world and represented only 20 percent of the world average in 2013 (Figure 7). the region has heavily invested in irrigation over the years and used a higher proportion of available water than any other region in the world13. More than 80 percent of the available water resources are used by agriculture, but there are significant differences between subregions. the gcc countries are 12 united nations, department of economic and social affairs –
Population division 2015 (http://www.un.org/en/development/desa/population/)
13 FaO Regional Office for the near east and north africa, 2014
totally dependent on irrigation due to extremely low levels of rainfall. In the Mashreq countries, the proportion of irrigated land goes up to 43 percent of the total cropland. the Maghreb countries are much less dependent on irrigation (7 to 18 percent), whereas egypt is nearly 100 percent irrigated14.
applying indirect subsidy on irrigation water is a common policy in the region. the cost of water for irrigation is set at below cost recovery levels. In some cases such as algeria, current tariffs are equivalent to only 1 to 7 percent of the marginal cost of water depending on source and loss assumptions15. On-farm water use efficiencies in the region are low and this is partly due to the low/negligible irrigation tariffs that discourage its efficient use as an economic input.
Figure 7: Land and water availability in NENA and the world
source: FaO
Improving agricultural water productivity in a sustainable way will be a major factor driving stronger agriculture growth. achieving this objective requires developing a comprehensive reform agenda. Best practices suggest that such an agenda requires: an inclusive process of study and debate using accurate information on water availability and use to arrive at a national consensus on water allocation and policy; a solid governance framework with well designed institutions that have clear authority, accountability and adequate capacities and resources16. there is scope for regional collaboration to address the water and climate change challenges in the nena, through knowledge exchange, south-south cooperation, dissemination of best practices
14 aOad, 200715 World Bank, 200216 FaO Regional Office for the near east and north africa, 2014
Part II: NENA’s Food Security Situation along the Four Dimensions:
Availability, Access, Utilization and Stability
0
5000
10000
15000
cubi
c m
eter
s/pe
rson
Renewable internal freshwater resources
NENA World
0
0.1
0.2
0.3
0.4
0.5
0.6
ha/p
erso
n
Arable land availability
NENA World
5
and joint research and development programmes. areas for regional collaboration include agriculture water productivity, governance and institutions including water users association, integrated water resource management, groundwater governance, unconventional water resources, climate change and droughts managment.
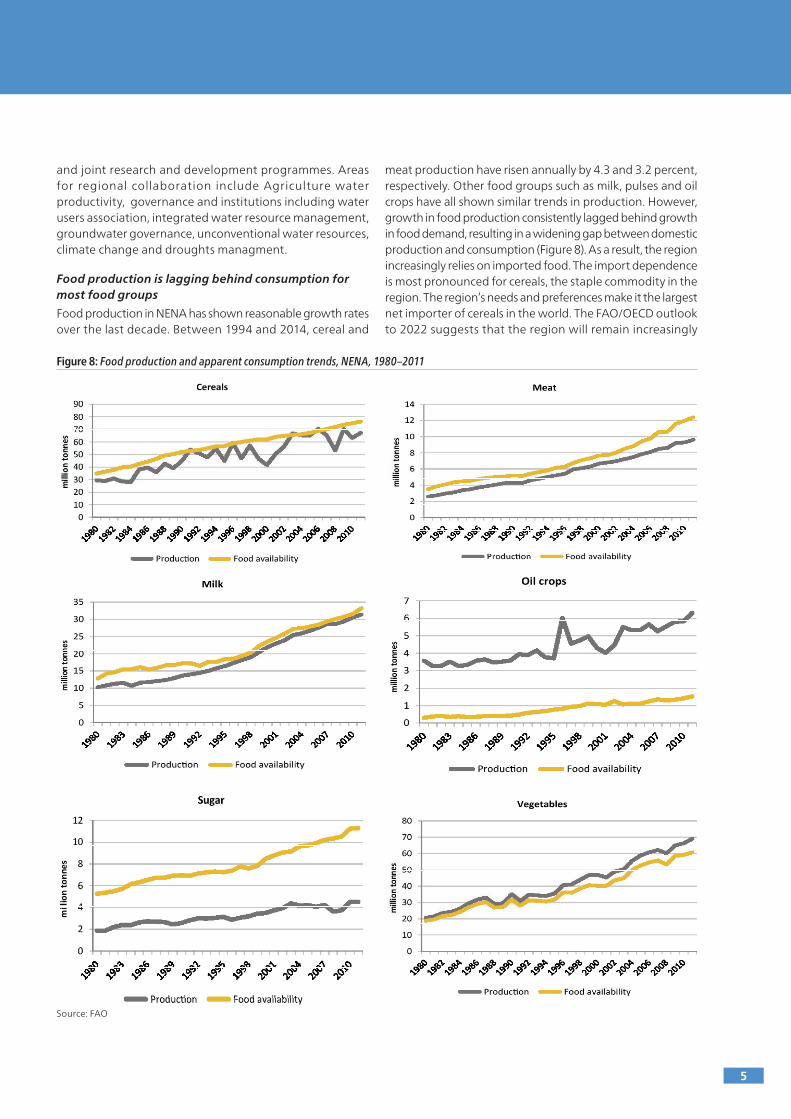
Food production is lagging behind consumption for most food groups
Food production in nena has shown reasonable growth rates over the last decade. Between 1994 and 2014, cereal and
meat production have risen annually by 4.3 and 3.2 percent, respectively. Other food groups such as milk, pulses and oil crops have all shown similar trends in production. however, growth in food production consistently lagged behind growth in food demand, resulting in a widening gap between domestic production and consumption (Figure 8). as a result, the region increasingly relies on imported food. the import dependence is most pronounced for cereals, the staple commodity in the region. the region’s needs and preferences make it the largest net importer of cereals in the world. the FaO/Oecd outlook to 2022 suggests that the region will remain increasingly
Figure 8: Food production and apparent consumption trends, NENA, 1980–2011
source: FaO
6
dependent on the world market for most of its basic foodstuffs. Fruit and vegetables are major exceptions in this regard, with production rising at a fast pace, contributing positively to employment, the trade balance, as well as higher incomes and better nutrition of local populations.
Sustainable increase in food availability requires policy actions that improve food production along the food chain
With virtually no spare land and water left for agriculture expansion, except in very few countries in the region17, growth in agriculture production will be primarily driven by increases in agriculture productivity, increases in value addition and reduction in food losses.
Increasing productivity, especially by smallholders
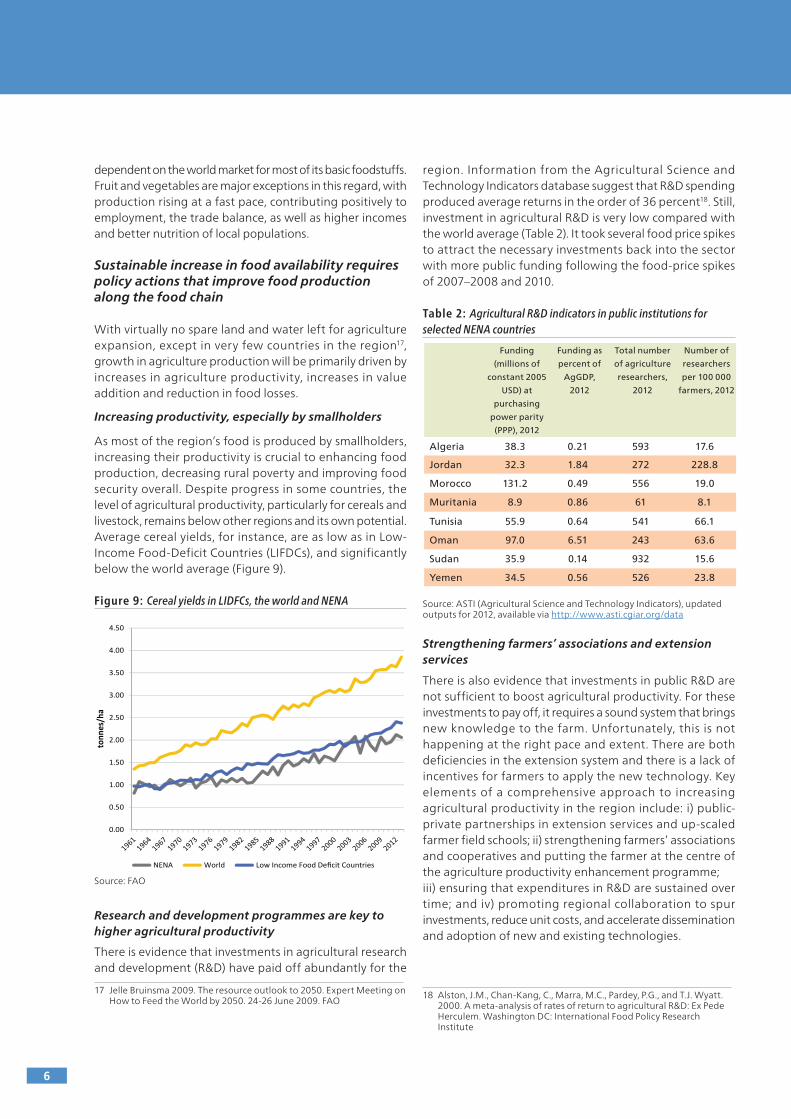
as most of the region’s food is produced by smallholders, increasing their productivity is crucial to enhancing food production, decreasing rural poverty and improving food security overall. despite progress in some countries, the level of agricultural productivity, particularly for cereals and livestock, remains below other regions and its own potential. average cereal yields, for instance, are as low as in low-Income Food-deficit countries (lIFdcs), and significantly below the world average (Figure 9).
Figure 9: Cereal yields in LIDFCs, the world and NENA
source: FaO
Research and development programmes are key to higher agricultural productivity
there is evidence that investments in agricultural research and development (R&d) have paid off abundantly for the
17 Jelle Bruinsma 2009. the resource outlook to 2050. expert Meeting on how to Feed the World by 2050. 24-26 June 2009. FaO
region. Information from the agricultural science and technology Indicators database suggest that R&d spending produced average returns in the order of 36 percent18. still, investment in agricultural R&d is very low compared with the world average (table 2). It took several food price spikes to attract the necessary investments back into the sector with more public funding following the food-price spikes of 2007–2008 and 2010.
Table 2: Agricultural R&D indicators in public institutions for selected NENA countries
source: astI (agricultural science and technology Indicators), updated outputs for 2012, available via http://www.asti.cgiar.org/data
Strengthening farmers’ associations and extension services
there is also evidence that investments in public R&d are not sufficient to boost agricultural productivity. For these investments to pay off, it requires a sound system that brings new knowledge to the farm. unfortunately, this is not happening at the right pace and extent. there are both deficiencies in the extension system and there is a lack of incentives for farmers to apply the new technology. Key elements of a comprehensive approach to increasing agricultural productivity in the region include: i) public-private partnerships in extension services and up-scaled farmer field schools; ii) strengthening farmers’ associations and cooperatives and putting the farmer at the centre of the agriculture productivity enhancement programme; iii) ensuring that expenditures in R&d are sustained over time; and iv) promoting regional collaboration to spur investments, reduce unit costs, and accelerate dissemination and adoption of new and existing technologies.
18 alston, J.M., chan-Kang, c., Marra, M.c., Pardey, P.g., and t.J. Wyatt. 2000. a meta-analysis of rates of return to agricultural R&d: ex Pede herculem. Washington dc: International Food Policy Research Institute
0.00
0.50
1.00
1.50
2.00
2.50
3.00
3.50
4.00
4.50
tonn
es/h
a
NENA World Low Income Food Deficit Countries
Funding
(millions of
constant 2005
USD) at
purchasing
power parity
(PPP), 2012
Funding as
percent of
AgGDP,
2012
Total number
of agriculture
researchers,
2012
Number of
researchers
per 100 000
farmers, 2012
Algeria 38.3 0.21 593 17.6
Jordan 32.3 1.84 272 228.8
Morocco 131.2 0.49 556 19.0
Muritania 8.9 0.86 61 8.1
Tunisia 55.9 0.64 541 66.1
Oman 97.0 6.51 243 63.6
Sudan 35.9 0.14 932 15.6
Yemen 34.5 0.56 526 23.8
7
Reducing food losses and waste
an estimated 34 percent of food supplies suitable for human consumption are being lost or wasted in the region19. In a region that is so dependent on the international markets to meet its food needs, such levels of food loss and waste (FlW) are unexpected. In view of the region’s scarce resource base and low food productivity, high food losses are not only uneconomical, but also ecologically detrimental and possibly even detrimental to food security.
Reducing FlW however would require substantial additional investments in the region’s limited storage capacity. dry storage in general and capacity to handle cereals in particular are at the heart of this problem. In several countries of the region the majority of farmers still store their grains under traditional conditions, with rodents, insects and birds being responsible for the bulk of cereal losses. For instance, egypt loses 13-15 percent of the available cereals between harvesting and final consumption. higher losses and waste of relatively more perishable fruit and vegetables limit the region’s capacity to create and exportable surplus (table 3).
Table 3: Estimates of food losses in selected fruit and vegetables, in selected NENA countries
source: FaO, Report of the expert consultation Meeting on Food losses and Waste Reduction in the near east Region: towards a Regional comprehensive strategy, FaO Regional Office for near east and north africa, cairo, 2013
Five strategic areas for action have been identified and endorsed by nena countries for a coherent and evidence-based approach to FlW reduction: i) undertake data gathering, research and knowledge generation to underpin any efforts to develop policies, priorities and evidence-based programmes for FlW reduction; ii) raise awareness of the impact of FlW and promote good practices from farmer to consumer and
19 FaO. 2011. global food losses and food waste - extent, causes and prevention. Rome. available at http://www.fao.org/docrep/014/mb060e/mb060e.pdf
every actor in between; iii) mainstream FlW issues in national and regional strategies and policies; iv) stimulate the private sector as the front-line actors in FlW reduction; and v) promote investment for sustainable, scale-appropriate solutions to FlW reduction.
Spurring the growth of the fisheries sector to increase food availability
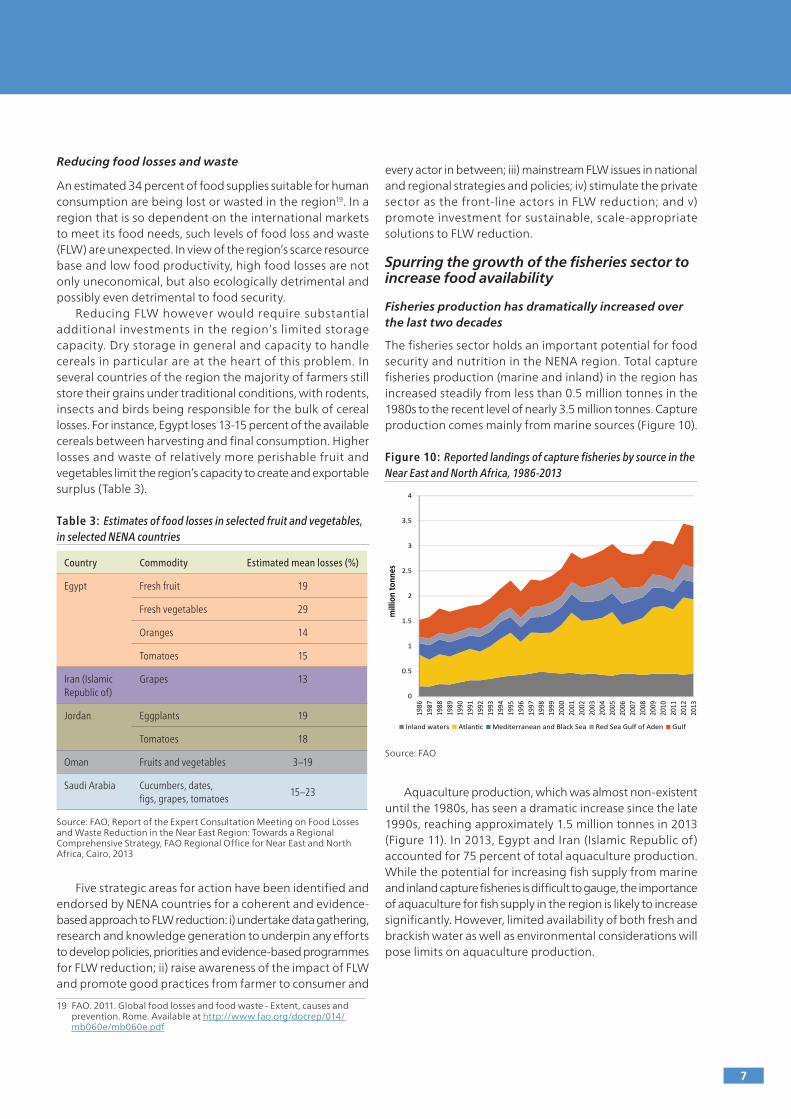
Fisheries production has dramatically increased over the last two decades
the fisheries sector holds an important potential for food security and nutrition in the nena region. total capture fisheries production (marine and inland) in the region has increased steadily from less than 0.5 million tonnes in the 1980s to the recent level of nearly 3.5 million tonnes. capture production comes mainly from marine sources (Figure 10).
Figure 10: Reported landings of capture fisheries by source in the Near East and North Africa, 1986-2013
source: FaO
aquaculture production, which was almost non-existent until the 1980s, has seen a dramatic increase since the late 1990s, reaching approximately 1.5 million tonnes in 2013 (Figure 11). In 2013, egypt and Iran (Islamic Republic of) accounted for 75 percent of total aquaculture production. While the potential for increasing fish supply from marine and inland capture fisheries is difficult to gauge, the importance of aquaculture for fish supply in the region is likely to increase significantly. however, limited availability of both fresh and brackish water as well as environmental considerations will pose limits on aquaculture production.
Country Commodity Estimated mean losses (%)
Egypt
Fresh fruit 19
Fresh vegetables 29
Oranges 14
Tomatoes 15
Iran (Islamic Republic of)
Grapes 13
Jordan Eggplants 19
Tomatoes 18
Oman Fruits and vegetables 3–19
Saudi Arabia Cucumbers, dates, figs, grapes, tomatoes
15–23
0
0.5
1
1.5
2
2.5
3
3.5
4
1986
1987
1988
1989
1990
1991
1992
1993
1994
1995
1996
1997
1998
1999
2000
2001
2002
2003
2004
2005
2006
2007
2008
2009
2010
2011
2012
2013
mill
ion
tonn
es
Inland waters Atlantic Mediterranean and Black Sea Red Sea Gulf of Aden Gulf
8
The region has a positive fish trade balance
despite the importance of the fisheries sector, fish consumption remains low by international standards. the average fish consumption in the region stands at 10.3 kg in 2011 while the world average was 18.9 kg. in 201120.
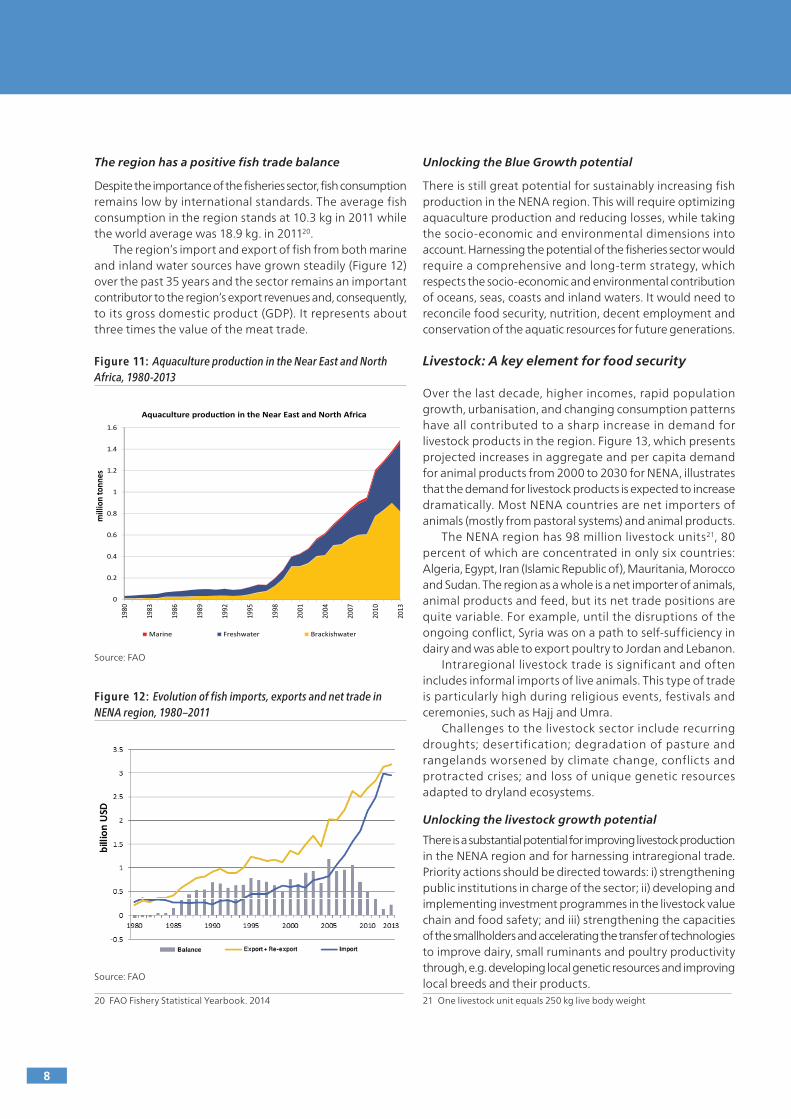
the region’s import and export of fish from both marine and inland water sources have grown steadily (Figure 12) over the past 35 years and the sector remains an important contributor to the region’s export revenues and, consequently, to its gross domestic product (gdP). It represents about three times the value of the meat trade.
Figure 11: Aquaculture production in the Near East and North Africa, 1980-2013
source: FaO
Figure 12: Evolution of fish imports, exports and net trade in NENA region, 1980–2011
source: FaO
20 FaO Fishery statistical Yearbook. 2014
Unlocking the Blue Growth potential
there is still great potential for sustainably increasing fish production in the nena region. this will require optimizing aquaculture production and reducing losses, while taking the socio-economic and environmental dimensions into account. harnessing the potential of the fisheries sector would require a comprehensive and long-term strategy, which respects the socio-economic and environmental contribution of oceans, seas, coasts and inland waters. It would need to reconcile food security, nutrition, decent employment and conservation of the aquatic resources for future generations.
Livestock: A key element for food security
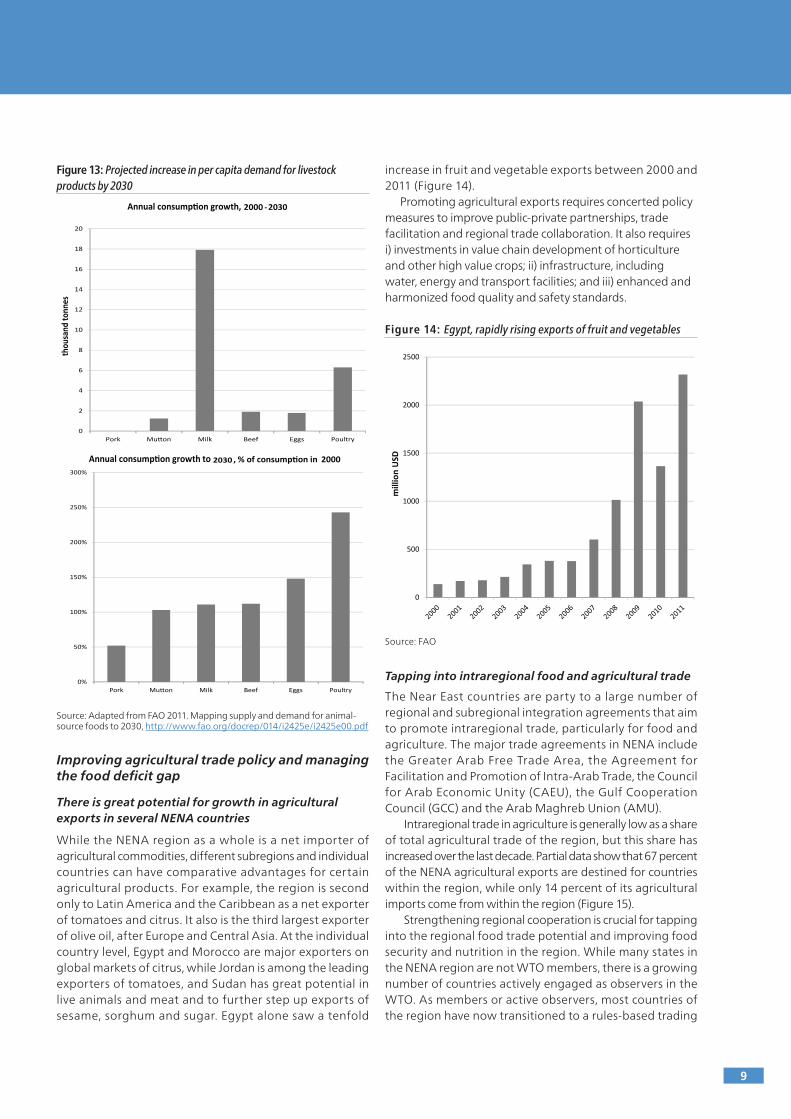
Over the last decade, higher incomes, rapid population growth, urbanisation, and changing consumption patterns have all contributed to a sharp increase in demand for livestock products in the region. Figure 13, which presents projected increases in aggregate and per capita demand for animal products from 2000 to 2030 for nena, illustrates that the demand for livestock products is expected to increase dramatically. Most nena countries are net importers of animals (mostly from pastoral systems) and animal products.
the nena region has 98 million livestock units21, 80 percent of which are concentrated in only six countries: algeria, egypt, Iran (Islamic Republic of), Mauritania, Morocco and sudan. the region as a whole is a net importer of animals, animal products and feed, but its net trade positions are quite variable. For example, until the disruptions of the ongoing conflict, syria was on a path to self-sufficiency in dairy and was able to export poultry to Jordan and lebanon.
Intraregional livestock trade is significant and often includes informal imports of live animals. this type of trade is particularly high during religious events, festivals and ceremonies, such as hajj and umra.
challenges to the livestock sector include recurring droughts; desertification; degradation of pasture and rangelands worsened by climate change, conflicts and protracted crises; and loss of unique genetic resources adapted to dryland ecosystems.
Unlocking the livestock growth potential
there is a substantial potential for improving livestock production in the nena region and for harnessing intraregional trade. Priority actions should be directed towards: i) strengthening public institutions in charge of the sector; ii) developing and implementing investment programmes in the livestock value chain and food safety; and iii) strengthening the capacities of the smallholders and accelerating the transfer of technologies to improve dairy, small ruminants and poultry productivity through, e.g. developing local genetic resources and improving local breeds and their products.21 One livestock unit equals 250 kg live body weight
0
0.2
0.4
0.6
0.8
1
1.2
1.4
1.6
1980
1983
1986
1989
1992
1995
1998
2001
2004
2007
2010
2013
mill
ion
tonn
es
Aquaculture production in the Near East and North Africa
Marine Freshwater Brackishwater
9
Figure 13: Projected increase in per capita demand for livestock products by 2030
source: adapted from FaO 2011. Mapping supply and demand for animal-source foods to 2030, http://www.fao.org/docrep/014/i2425e/i2425e00.pdf
Improving agricultural trade policy and managing the food deficit gap
There is great potential for growth in agricultural exports in several NENA countries
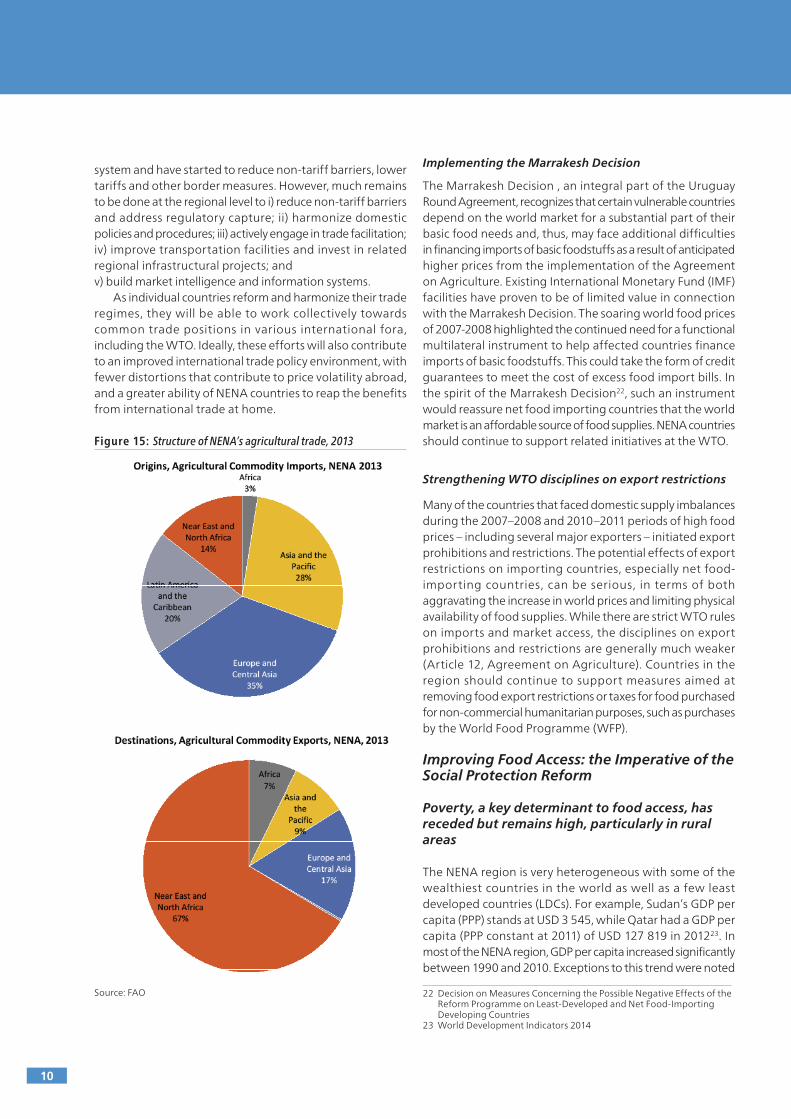
While the nena region as a whole is a net importer of agricultural commodities, different subregions and individual countries can have comparative advantages for certain agricultural products. For example, the region is second only to latin america and the caribbean as a net exporter of tomatoes and citrus. It also is the third largest exporter of olive oil, after europe and central asia. at the individual country level, egypt and Morocco are major exporters on global markets of citrus, while Jordan is among the leading exporters of tomatoes, and sudan has great potential in live animals and meat and to further step up exports of sesame, sorghum and sugar. egypt alone saw a tenfold
increase in fruit and vegetable exports between 2000 and 2011 (Figure 14).
Promoting agricultural exports requires concerted policy measures to improve public-private partnerships, trade facilitation and regional trade collaboration. It also requires i) investments in value chain development of horticulture and other high value crops; ii) infrastructure, including water, energy and transport facilities; and iii) enhanced and harmonized food quality and safety standards.
Figure 14: Egypt, rapidly rising exports of fruit and vegetables
source: FaO
Tapping into intraregional food and agricultural trade
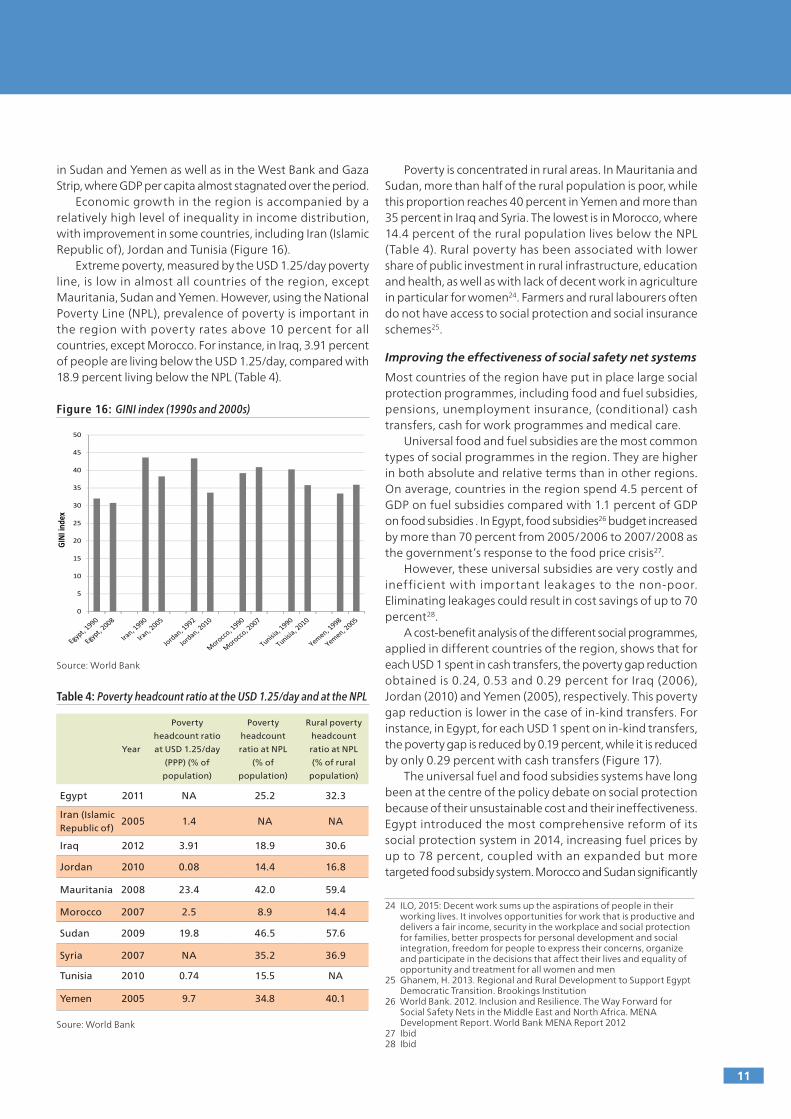
the near east countries are party to a large number of regional and subregional integration agreements that aim to promote intraregional trade, particularly for food and agriculture. the major trade agreements in nena include the greater arab Free trade area, the agreement for Facilitation and Promotion of Intra-arab trade, the council for arab economic unity (caeu), the gulf cooperation council (gcc) and the arab Maghreb union (aMu).
Intraregional trade in agriculture is generally low as a share of total agricultural trade of the region, but this share has increased over the last decade. Partial data show that 67 percent of the nena agricultural exports are destined for countries within the region, while only 14 percent of its agricultural imports come from within the region (Figure 15).
strengthening regional cooperation is crucial for tapping into the regional food trade potential and improving food security and nutrition in the region. While many states in the nena region are not WtO members, there is a growing number of countries actively engaged as observers in the WtO. as members or active observers, most countries of the region have now transitioned to a rules-based trading
0
500
1000
1500
2000
2500
mill
ion
USD
0
2
4
6
8
10
12
14
16
18
20
Pork Mutton Milk Beef Eggs Poultry
thou
sand
tonn
es
Annual consumption growth, 2000 -2030
0%
50%
100%
150%
200%
250%
300%
Pork Mutton Milk Beef Eggs Poultry
Annual consumption growth to 2030 , % of consumption in 2000
10
system and have started to reduce non-tariff barriers, lower tariffs and other border measures. however, much remains to be done at the regional level to i) reduce non-tariff barriers and address regulatory capture; ii) harmonize domestic policies and procedures; iii) actively engage in trade facilitation; iv) improve transportation facilities and invest in related regional infrastructural projects; and v) build market intelligence and information systems.
as individual countries reform and harmonize their trade regimes, they will be able to work collectively towards common trade positions in various international fora, including the WtO. Ideally, these efforts will also contribute to an improved international trade policy environment, with fewer distortions that contribute to price volatility abroad, and a greater ability of nena countries to reap the benefits from international trade at home.
Figure 15: Structure of NENA’s agricultural trade, 2013
source: FaO
Implementing the Marrakesh Decision
the Marrakesh decision , an integral part of the uruguay Round agreement, recognizes that certain vulnerable countries depend on the world market for a substantial part of their basic food needs and, thus, may face additional difficulties in financing imports of basic foodstuffs as a result of anticipated higher prices from the implementation of the agreement on agriculture. existing International Monetary Fund (IMF) facilities have proven to be of limited value in connection with the Marrakesh decision. the soaring world food prices of 2007-2008 highlighted the continued need for a functional multilateral instrument to help affected countries finance imports of basic foodstuffs. this could take the form of credit guarantees to meet the cost of excess food import bills. In the spirit of the Marrakesh decision22, such an instrument would reassure net food importing countries that the world market is an affordable source of food supplies. nena countries should continue to support related initiatives at the WtO.
Strengthening WTO disciplines on export restrictions
Many of the countries that faced domestic supply imbalances during the 2007–2008 and 2010–2011 periods of high food prices – including several major exporters – initiated export prohibitions and restrictions. the potential effects of export restrictions on importing countries, especially net food-importing countries, can be serious, in terms of both aggravating the increase in world prices and limiting physical availability of food supplies. While there are strict WtO rules on imports and market access, the disciplines on export prohibitions and restrictions are generally much weaker (article 12, agreement on agriculture). countries in the region should continue to support measures aimed at removing food export restrictions or taxes for food purchased for non-commercial humanitarian purposes, such as purchases by the World Food Programme (WFP).
Improving Food Access: the Imperative of the Social Protection Reform
Poverty, a key determinant to food access, has receded but remains high, particularly in rural areas
the nena region is very heterogeneous with some of the wealthiest countries in the world as well as a few least developed countries (ldcs). For example, sudan’s gdP per capita (PPP) stands at usd 3 545, while Qatar had a gdP per capita (PPP constant at 2011) of usd 127 819 in 201223. In most of the nena region, gdP per capita increased significantly between 1990 and 2010. exceptions to this trend were noted
22 decision on Measures concerning the Possible negative effects of the Reform Programme on least-developed and net Food-Importing developing countries
23 World development Indicators 2014
11
in sudan and Yemen as well as in the West Bank and gaza strip, where gdP per capita almost stagnated over the period.
economic growth in the region is accompanied by a relatively high level of inequality in income distribution, with improvement in some countries, including Iran (Islamic Republic of), Jordan and tunisia (Figure 16).
extreme poverty, measured by the usd 1.25/day poverty line, is low in almost all countries of the region, except Mauritania, sudan and Yemen. however, using the national Poverty line (nPl), prevalence of poverty is important in the region with poverty rates above 10 percent for all countries, except Morocco. For instance, in Iraq, 3.91 percent of people are living below the usd 1.25/day, compared with 18.9 percent living below the nPl (table 4).
Figure 16: GINI index (1990s and 2000s)
source: World Bank
Table 4: Poverty headcount ratio at the USD 1.25/day and at the NPL
soure: World Bank
Poverty is concentrated in rural areas. In Mauritania and sudan, more than half of the rural population is poor, while this proportion reaches 40 percent in Yemen and more than 35 percent in Iraq and syria. the lowest is in Morocco, where 14.4 percent of the rural population lives below the nPl (table 4). Rural poverty has been associated with lower share of public investment in rural infrastructure, education and health, as well as with lack of decent work in agriculture in particular for women24. Farmers and rural labourers often do not have access to social protection and social insurance schemes25.
Improving the effectiveness of social safety net systems
Most countries of the region have put in place large social protection programmes, including food and fuel subsidies, pensions, unemployment insurance, (conditional) cash transfers, cash for work programmes and medical care.
universal food and fuel subsidies are the most common types of social programmes in the region. they are higher in both absolute and relative terms than in other regions. On average, countries in the region spend 4.5 percent of gdP on fuel subsidies compared with 1.1 percent of gdP on food subsidies . In egypt, food subsidies26 budget increased by more than 70 percent from 2005/2006 to 2007/2008 as the government’s response to the food price crisis27.
however, these universal subsidies are very costly and inefficient with important leakages to the non-poor. eliminating leakages could result in cost savings of up to 70 percent28.
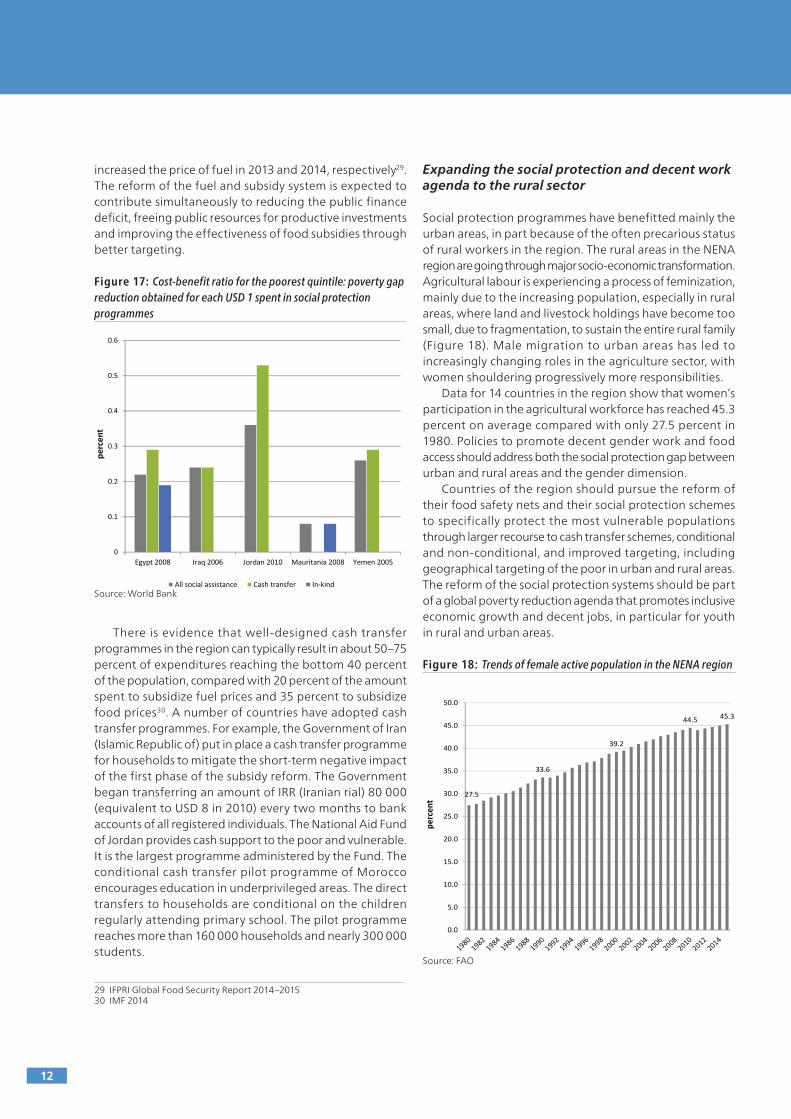
a cost-benefit analysis of the different social programmes, applied in different countries of the region, shows that for each usd 1 spent in cash transfers, the poverty gap reduction obtained is 0.24, 0.53 and 0.29 percent for Iraq (2006), Jordan (2010) and Yemen (2005), respectively. this poverty gap reduction is lower in the case of in-kind transfers. For instance, in egypt, for each usd 1 spent on in-kind transfers, the poverty gap is reduced by 0.19 percent, while it is reduced by only 0.29 percent with cash transfers (Figure 17).
the universal fuel and food subsidies systems have long been at the centre of the policy debate on social protection because of their unsustainable cost and their ineffectiveness. egypt introduced the most comprehensive reform of its social protection system in 2014, increasing fuel prices by up to 78 percent, coupled with an expanded but more targeted food subsidy system. Morocco and sudan significantly
24 IlO, 2015: decent work sums up the aspirations of people in their working lives. It involves opportunities for work that is productive and delivers a fair income, security in the workplace and social protection for families, better prospects for personal development and social integration, freedom for people to express their concerns, organize and participate in the decisions that affect their lives and equality of opportunity and treatment for all women and men
25 ghanem, h. 2013. Regional and Rural development to support egypt democratic transition. Brookings Institution
26 World Bank. 2012. Inclusion and Resilience. the Way Forward for social safety nets in the Middle east and north africa. Mena development Report. World Bank Mena Report 2012
27 Ibid28 Ibid
0
5
10
15
20
25
30
35
40
45
50
GINI
inde
x
Year
Poverty
headcount ratio
at USD 1.25/day
(PPP) (% of
population)
Poverty
headcount
ratio at NPL
(% of
population)
Rural poverty
headcount
ratio at NPL
(% of rural
population)
Egypt 2011 NA 25.2 32.3
Iran (Islamic Republic of)
2005 1.4 NA NA
Iraq 2012 3.91 18.9 30.6
Jordan 2010 0.08 14.4 16.8
Mauritania 2008 23.4 42.0 59.4
Morocco 2007 2.5 8.9 14.4
Sudan 2009 19.8 46.5 57.6
Syria 2007 NA 35.2 36.9
Tunisia 2010 0.74 15.5 NA
Yemen 2005 9.7 34.8 40.1
12
increased the price of fuel in 2013 and 2014, respectively29. the reform of the fuel and subsidy system is expected to contribute simultaneously to reducing the public finance deficit, freeing public resources for productive investments and improving the effectiveness of food subsidies through better targeting.
Figure 17: Cost-benefit ratio for the poorest quintile: poverty gap reduction obtained for each USD 1 spent in social protection programmes
source: World Bank
there is evidence that well-designed cash transfer programmes in the region can typically result in about 50–75 percent of expenditures reaching the bottom 40 percent of the population, compared with 20 percent of the amount spent to subsidize fuel prices and 35 percent to subsidize food prices30. a number of countries have adopted cash transfer programmes. For example, the government of Iran (Islamic Republic of) put in place a cash transfer programme for households to mitigate the short-term negative impact of the first phase of the subsidy reform. the government began transferring an amount of IRR (Iranian rial) 80 000 (equivalent to usd 8 in 2010) every two months to bank accounts of all registered individuals. the national aid Fund of Jordan provides cash support to the poor and vulnerable. It is the largest programme administered by the Fund. the conditional cash transfer pilot programme of Morocco encourages education in underprivileged areas. the direct transfers to households are conditional on the children regularly attending primary school. the pilot programme reaches more than 160 000 households and nearly 300 000 students.
29 IFPRI global Food security Report 2014–201530 IMF 2014
Expanding the social protection and decent work agenda to the rural sector
social protection programmes have benefitted mainly the urban areas, in part because of the often precarious status of rural workers in the region. the rural areas in the nena region are going through major socio-economic transformation. agricultural labour is experiencing a process of feminization, mainly due to the increasing population, especially in rural areas, where land and livestock holdings have become too small, due to fragmentation, to sustain the entire rural family (Figure 18). Male migration to urban areas has led to increasingly changing roles in the agriculture sector, with women shouldering progressively more responsibilities.
data for 14 countries in the region show that women’s participation in the agricultural workforce has reached 45.3 percent on average compared with only 27.5 percent in 1980. Policies to promote decent gender work and food access should address both the social protection gap between urban and rural areas and the gender dimension.
countries of the region should pursue the reform of their food safety nets and their social protection schemes to specifically protect the most vulnerable populations through larger recourse to cash transfer schemes, conditional and non-conditional, and improved targeting, including geographical targeting of the poor in urban and rural areas. the reform of the social protection systems should be part of a global poverty reduction agenda that promotes inclusive economic growth and decent jobs, in particular for youth in rural and urban areas.
Figure 18: Trends of female active population in the NENA region
source: FaO
27.5
33.6
39.2
44.5 45.3
0.0
5.0
10.0
15.0
20.0
25.0
30.0
35.0
40.0
45.0
50.0
perc
ent
0
0.1
0.2
0.3
0.4
0.5
0.6
Egypt 2008 Iraq 2006 Jordan 2010 Mauritania 2008 Yemen 2005
perc
ent
All social assistance Cash transfer In-kind
13
Food Utilization: Addressing the Triple Burden of Malnutrition
as noted earlier, food availability in the nena region has witnessed remarkable improvements in the last 20 years. nonetheless, nutrition has not registered comparable improvements in the majority of the countries. as in many other parts of the world, countries in the region have been passing through a difficult transition in their agriculture and food systems as well as in the nutritional and health status of the population. the result is the “triple burden of malnutrition”, where undernutrition coexists with overnutrition and micronutrient deficiencies.
Malnutrition among children has decreased but remains high
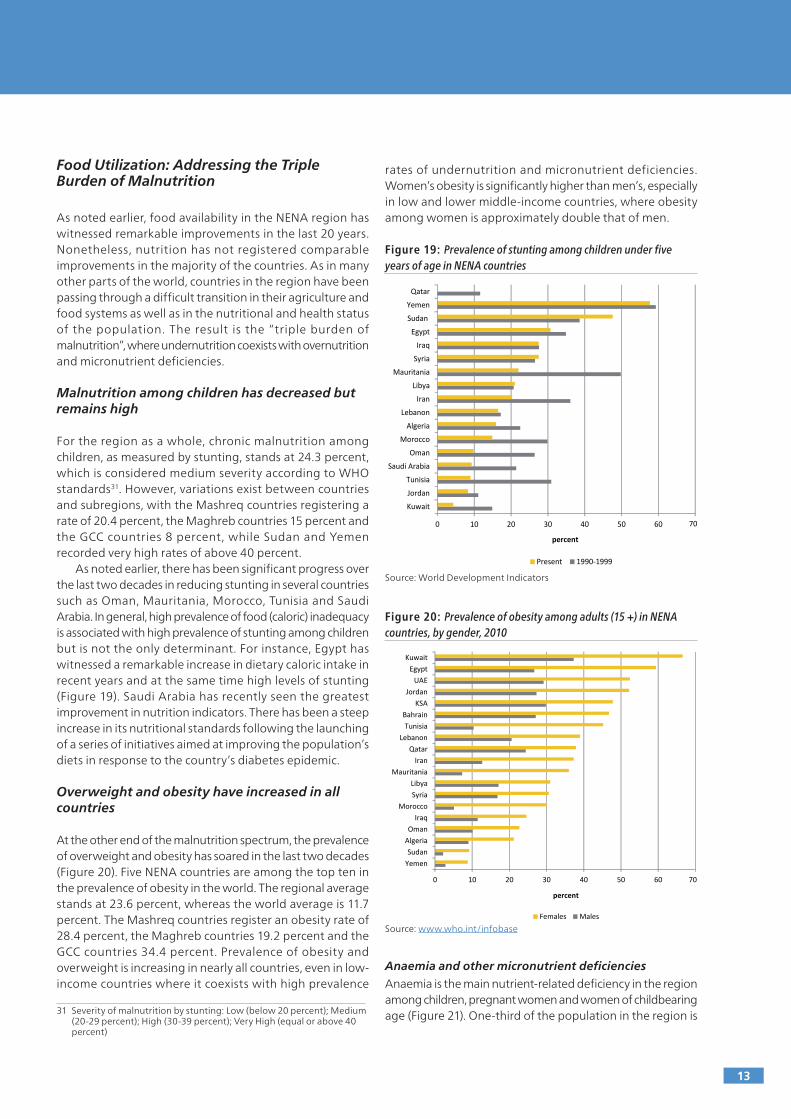
For the region as a whole, chronic malnutrition among children, as measured by stunting, stands at 24.3 percent, which is considered medium severity according to WhO standards31. however, variations exist between countries and subregions, with the Mashreq countries registering a rate of 20.4 percent, the Maghreb countries 15 percent and the gcc countries 8 percent, while sudan and Yemen recorded very high rates of above 40 percent.
as noted earlier, there has been significant progress over the last two decades in reducing stunting in several countries such as Oman, Mauritania, Morocco, tunisia and saudi arabia. In general, high prevalence of food (caloric) inadequacy is associated with high prevalence of stunting among children but is not the only determinant. For instance, egypt has witnessed a remarkable increase in dietary caloric intake in recent years and at the same time high levels of stunting (Figure 19). saudi arabia has recently seen the greatest improvement in nutrition indicators. there has been a steep increase in its nutritional standards following the launching of a series of initiatives aimed at improving the population’s diets in response to the country’s diabetes epidemic.
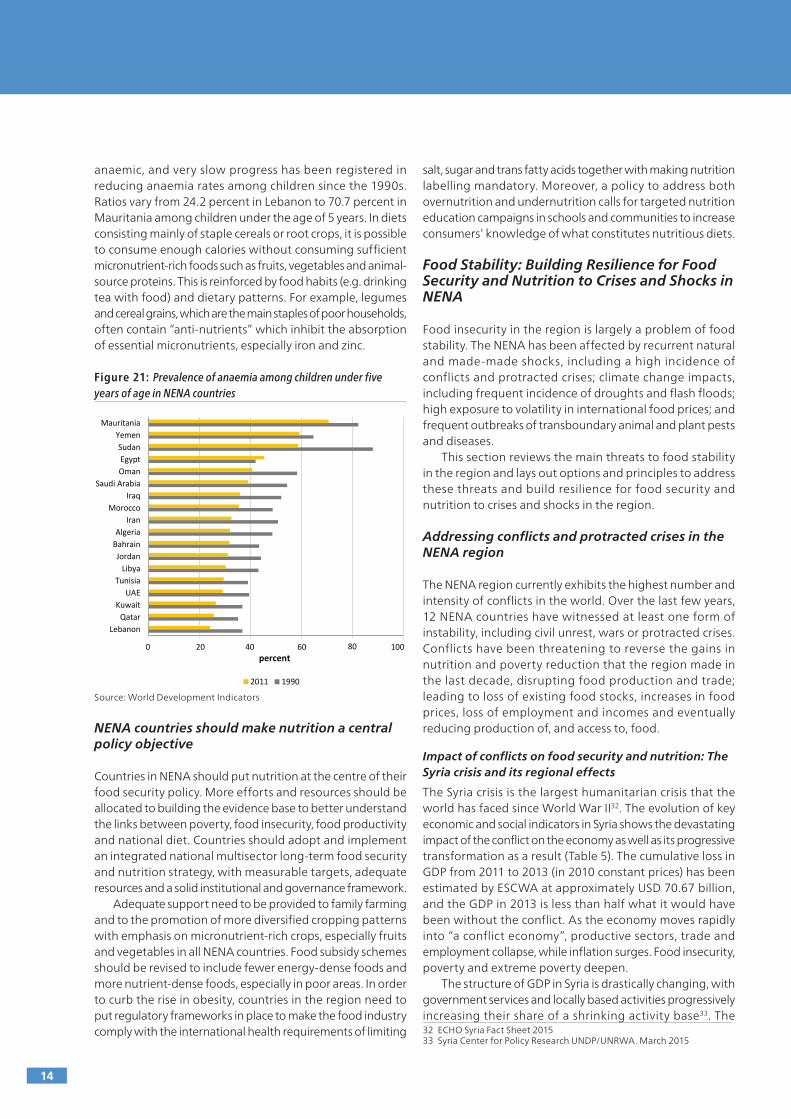
Overweight and obesity have increased in all countries
at the other end of the malnutrition spectrum, the prevalence of overweight and obesity has soared in the last two decades (Figure 20). Five nena countries are among the top ten in the prevalence of obesity in the world. the regional average stands at 23.6 percent, whereas the world average is 11.7 percent. the Mashreq countries register an obesity rate of 28.4 percent, the Maghreb countries 19.2 percent and the gcc countries 34.4 percent. Prevalence of obesity and overweight is increasing in nearly all countries, even in low-income countries where it coexists with high prevalence
31 severity of malnutrition by stunting: low (below 20 percent); Medium (20-29 percent); high (30-39 percent); Very high (equal or above 40 percent)
rates of undernutrition and micronutrient deficiencies. Women’s obesity is significantly higher than men’s, especially in low and lower middle-income countries, where obesity among women is approximately double that of men.
Figure 19: Prevalence of stunting among children under five years of age in NENA countries
source: World development Indicators
Figure 20: Prevalence of obesity among adults (15 +) in NENA countries, by gender, 2010
source: www.who.int/infobase
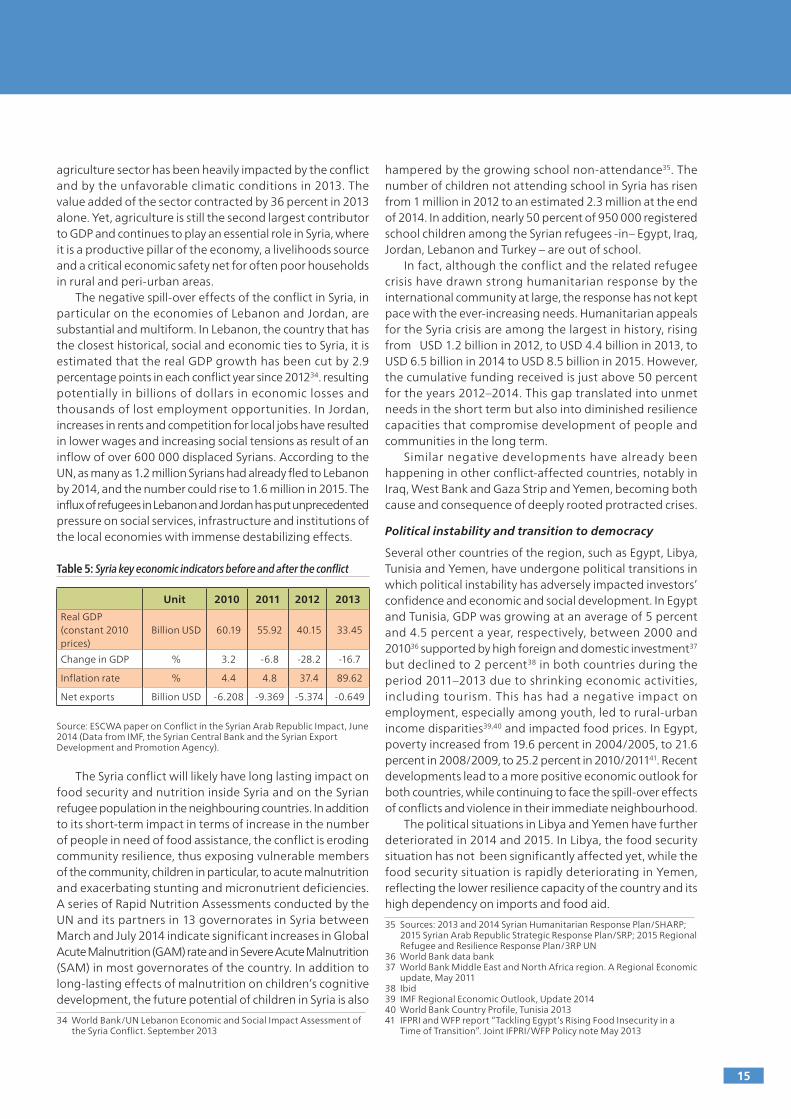
Anaemia and other micronutrient deficiencies
anaemia is the main nutrient-related deficiency in the region among children, pregnant women and women of childbearing age (Figure 21). One-third of the population in the region is
0 10 20 30 40 50 60 70
Kuwait
Jordan
Tunisia
Saudi Arabia
Oman
Morocco
Algeria
Lebanon
Iran
Libya
Mauritania
Syria
Iraq
Egypt
Sudan
Yemen
Qatar
percent
Present 1990-1999
0 10 20 30 40 50 60 70
YemenSudan
AlgeriaOman
IraqMorocco
SyriaLibya
MauritaniaIran
QatarLebanon
TunisiaBahrain
KSAJordan
UAEEgypt
Kuwait
percent
Females Males
14
anaemic, and very slow progress has been registered in reducing anaemia rates among children since the 1990s. Ratios vary from 24.2 percent in lebanon to 70.7 percent in Mauritania among children under the age of 5 years. In diets consisting mainly of staple cereals or root crops, it is possible to consume enough calories without consuming sufficient micronutrient-rich foods such as fruits, vegetables and animal-source proteins. this is reinforced by food habits (e.g. drinking tea with food) and dietary patterns. For example, legumes and cereal grains, which are the main staples of poor households, often contain “anti-nutrients” which inhibit the absorption of essential micronutrients, especially iron and zinc.
Figure 21: Prevalence of anaemia among children under five years of age in NENA countries
source: World development Indicators
NENA countries should make nutrition a central policy objective
countries in nena should put nutrition at the centre of their food security policy. More efforts and resources should be allocated to building the evidence base to better understand the links between poverty, food insecurity, food productivity and national diet. countries should adopt and implement an integrated national multisector long-term food security and nutrition strategy, with measurable targets, adequate resources and a solid institutional and governance framework.
adequate support need to be provided to family farming and to the promotion of more diversified cropping patterns with emphasis on micronutrient-rich crops, especially fruits and vegetables in all nena countries. Food subsidy schemes should be revised to include fewer energy-dense foods and more nutrient-dense foods, especially in poor areas. In order to curb the rise in obesity, countries in the region need to put regulatory frameworks in place to make the food industry comply with the international health requirements of limiting
salt, sugar and trans fatty acids together with making nutrition labelling mandatory. Moreover, a policy to address both overnutrition and undernutrition calls for targeted nutrition education campaigns in schools and communities to increase consumers’ knowledge of what constitutes nutritious diets.
Food Stability: Building Resilience for Food Security and Nutrition to Crises and Shocks in NENA
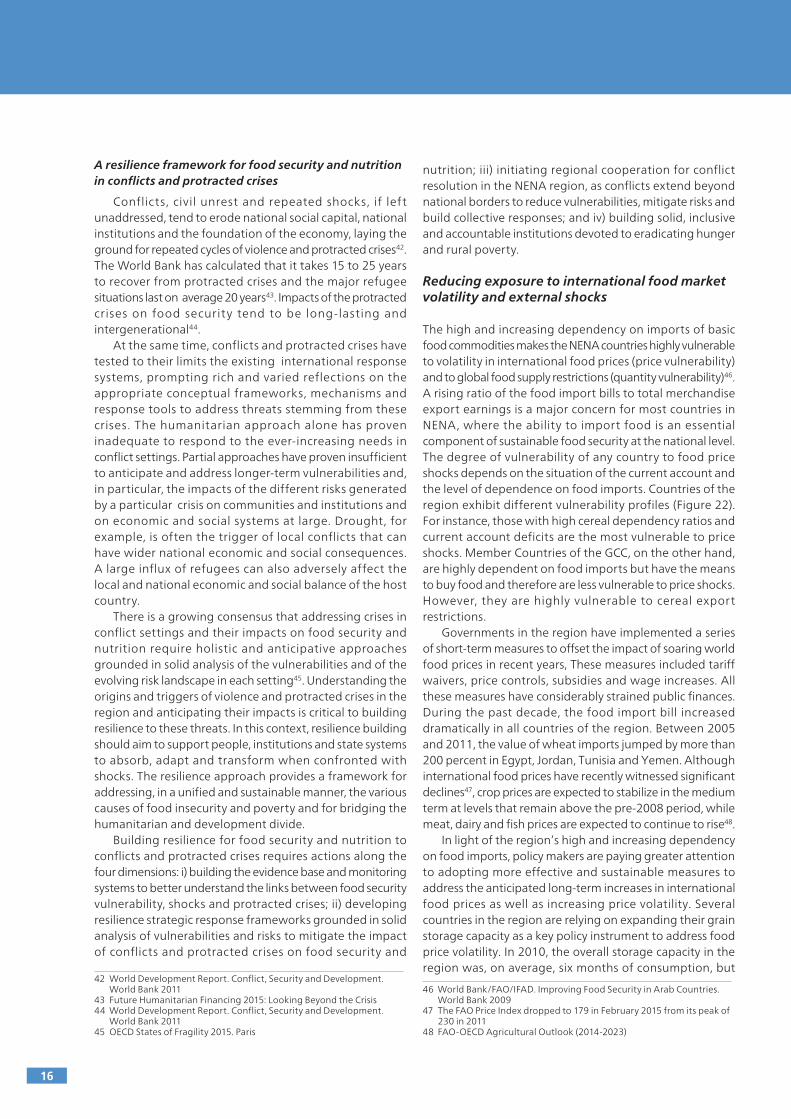
Food insecurity in the region is largely a problem of food stability. the nena has been affected by recurrent natural and made-made shocks, including a high incidence of conflicts and protracted crises; climate change impacts, including frequent incidence of droughts and flash floods; high exposure to volatility in international food prices; and frequent outbreaks of transboundary animal and plant pests and diseases.
this section reviews the main threats to food stability in the region and lays out options and principles to address these threats and build resilience for food security and nutrition to crises and shocks in the region.
Addressing conflicts and protracted crises in the NENA region
the nena region currently exhibits the highest number and intensity of conflicts in the world. Over the last few years, 12 nena countries have witnessed at least one form of instability, including civil unrest, wars or protracted crises. conflicts have been threatening to reverse the gains in nutrition and poverty reduction that the region made in the last decade, disrupting food production and trade; leading to loss of existing food stocks, increases in food prices, loss of employment and incomes and eventually reducing production of, and access to, food.
Impact of conflicts on food security and nutrition: The Syria crisis and its regional effects
the syria crisis is the largest humanitarian crisis that the world has faced since World War II32. the evolution of key economic and social indicators in syria shows the devastating impact of the conflict on the economy as well as its progressive transformation as a result (table 5). the cumulative loss in gdP from 2011 to 2013 (in 2010 constant prices) has been estimated by escWa at approximately usd 70.67 billion, and the gdP in 2013 is less than half what it would have been without the conflict. as the economy moves rapidly into “a conflict economy”, productive sectors, trade and employment collapse, while inflation surges. Food insecurity, poverty and extreme poverty deepen.
the structure of gdP in syria is drastically changing, with government services and locally based activities progressively increasing their share of a shrinking activity base33. the 32 echO syria Fact sheet 201533 syria center for Policy Research undP/unRWa. March 2015
0 20 40 60 80 100
LebanonQatar
KuwaitUAE
TunisiaLibya
JordanBahrainAlgeria
IranMorocco
IraqSaudi Arabia
OmanEgypt
SudanYemen
Mauritania
percent
2011 1990
15
agriculture sector has been heavily impacted by the conflict and by the unfavorable climatic conditions in 2013. the value added of the sector contracted by 36 percent in 2013 alone. Yet, agriculture is still the second largest contributor to gdP and continues to play an essential role in syria, where it is a productive pillar of the economy, a livelihoods source and a critical economic safety net for often poor households in rural and peri-urban areas.
the negative spill-over effects of the conflict in syria, in particular on the economies of lebanon and Jordan, are substantial and multiform. In lebanon, the country that has the closest historical, social and economic ties to syria, it is estimated that the real gdP growth has been cut by 2.9 percentage points in each conflict year since 201234. resulting potentially in billions of dollars in economic losses and thousands of lost employment opportunities. In Jordan, increases in rents and competition for local jobs have resulted in lower wages and increasing social tensions as result of an inflow of over 600 000 displaced syrians. according to the un, as many as 1.2 million syrians had already fled to lebanon by 2014, and the number could rise to 1.6 million in 2015. the influx of refugees in lebanon and Jordan has put unprecedented pressure on social services, infrastructure and institutions of the local economies with immense destabilizing effects.
Table 5: Syria key economic indicators before and after the conflict
source: escWa paper on conflict in the syrian arab Republic Impact, June 2014 (data from IMF, the syrian central Bank and the syrian export development and Promotion agency).
the syria conflict will likely have long lasting impact on food security and nutrition inside syria and on the syrian refugee population in the neighbouring countries. In addition to its short-term impact in terms of increase in the number of people in need of food assistance, the conflict is eroding community resilience, thus exposing vulnerable members of the community, children in particular, to acute malnutrition and exacerbating stunting and micronutrient deficiencies. a series of Rapid nutrition assessments conducted by the un and its partners in 13 governorates in syria between March and July 2014 indicate significant increases in global acute Malnutrition (gaM) rate and in severe acute Malnutrition (saM) in most governorates of the country. In addition to long-lasting effects of malnutrition on children’s cognitive development, the future potential of children in syria is also
34 World Bank/un lebanon economic and social Impact assessment of the syria conflict. september 2013
hampered by the growing school non-attendance35. the number of children not attending school in syria has risen from 1 million in 2012 to an estimated 2.3 million at the end of 2014. In addition, nearly 50 percent of 950 000 registered school children among the syrian refugees -in– egypt, Iraq, Jordan, lebanon and turkey – are out of school.
In fact, although the conflict and the related refugee crisis have drawn strong humanitarian response by the international community at large, the response has not kept pace with the ever-increasing needs. humanitarian appeals for the syria crisis are among the largest in history, rising from usd 1.2 billion in 2012, to usd 4.4 billion in 2013, to usd 6.5 billion in 2014 to usd 8.5 billion in 2015. however, the cumulative funding received is just above 50 percent for the years 2012–2014. this gap translated into unmet needs in the short term but also into diminished resilience capacities that compromise development of people and communities in the long term.
similar negative developments have already been happening in other conflict-affected countries, notably in Iraq, West Bank and gaza strip and Yemen, becoming both cause and consequence of deeply rooted protracted crises.
Political instability and transition to democracy
several other countries of the region, such as egypt, libya, tunisia and Yemen, have undergone political transitions in which political instability has adversely impacted investors’ confidence and economic and social development. In egypt and tunisia, gdP was growing at an average of 5 percent and 4.5 percent a year, respectively, between 2000 and 201036 supported by high foreign and domestic investment37 but declined to 2 percent38 in both countries during the period 2011–2013 due to shrinking economic activities, including tourism. this has had a negative impact on employment, especially among youth, led to rural-urban income disparities39,40 and impacted food prices. In egypt, poverty increased from 19.6 percent in 2004/2005, to 21.6 percent in 2008/2009, to 25.2 percent in 2010/201141. Recent developments lead to a more positive economic outlook for both countries, while continuing to face the spill-over effects of conflicts and violence in their immediate neighbourhood.
the political situations in libya and Yemen have further deteriorated in 2014 and 2015. In libya, the food security situation has not been significantly affected yet, while the food security situation is rapidly deteriorating in Yemen, reflecting the lower resilience capacity of the country and its high dependency on imports and food aid.
35 sources: 2013 and 2014 syrian humanitarian Response Plan/shaRP; 2015 syrian arab Republic strategic Response Plan/sRP; 2015 Regional Refugee and Resilience Response Plan/3RP un
36 World Bank data bank37 World Bank Middle east and north africa region. a Regional economic
update, May 201138 Ibid39 IMF Regional economic Outlook, update 201440 World Bank country Profile, tunisia 2013 41 IFPRI and WFP report “tackling egypt’s Rising Food Insecurity in a
time of transition”. Joint IFPRI/WFP Policy note May 2013
Unit 2010 2011 2012 2013
Real gdP (constant 2010 prices)
Billion usd 60.19 55.92 40.15 33.45
change in gdP % 3.2 -6.8 -28.2 -16.7
Inflation rate % 4.4 4.8 37.4 89.62
net exports Billion usd -6.208 -9.369 -5.374 -0.649
16
A resilience framework for food security and nutrition in conflicts and protracted crises
conflicts, civil unrest and repeated shocks, if left unaddressed, tend to erode national social capital, national institutions and the foundation of the economy, laying the ground for repeated cycles of violence and protracted crises42. the World Bank has calculated that it takes 15 to 25 years to recover from protracted crises and the major refugee situations last on average 20 years43. Impacts of the protracted crises on food security tend to be long-lasting and intergenerational44.
at the same time, conflicts and protracted crises have tested to their limits the existing international response systems, prompting rich and varied reflections on the appropriate conceptual frameworks, mechanisms and response tools to address threats stemming from these crises. the humanitarian approach alone has proven inadequate to respond to the ever-increasing needs in conflict settings. Partial approaches have proven insufficient to anticipate and address longer-term vulnerabilities and, in particular, the impacts of the different risks generated by a particular crisis on communities and institutions and on economic and social systems at large. drought, for example, is often the trigger of local conflicts that can have wider national economic and social consequences. a large influx of refugees can also adversely affect the local and national economic and social balance of the host country.
there is a growing consensus that addressing crises in conflict settings and their impacts on food security and nutrition require holistic and anticipative approaches grounded in solid analysis of the vulnerabilities and of the evolving risk landscape in each setting45. understanding the origins and triggers of violence and protracted crises in the region and anticipating their impacts is critical to building resilience to these threats. In this context, resilience building should aim to support people, institutions and state systems to absorb, adapt and transform when confronted with shocks. the resilience approach provides a framework for addressing, in a unified and sustainable manner, the various causes of food insecurity and poverty and for bridging the humanitarian and development divide.
Building resilience for food security and nutrition to conflicts and protracted crises requires actions along the four dimensions: i) building the evidence base and monitoring systems to better understand the links between food security vulnerability, shocks and protracted crises; ii) developing resilience strategic response frameworks grounded in solid analysis of vulnerabilities and risks to mitigate the impact of conflicts and protracted crises on food security and
42 World development Report. conflict, security and development. World Bank 2011
43 Future humanitarian Financing 2015: looking Beyond the crisis44 World development Report. conflict, security and development.
World Bank 201145 Oecd states of Fragility 2015. Paris
nutrition; iii) initiating regional cooperation for conflict resolution in the nena region, as conflicts extend beyond national borders to reduce vulnerabilities, mitigate risks and build collective responses; and iv) building solid, inclusive and accountable institutions devoted to eradicating hunger and rural poverty.
Reducing exposure to international food market volatility and external shocks
the high and increasing dependency on imports of basic food commodities makes the nena countries highly vulnerable to volatility in international food prices (price vulnerability) and to global food supply restrictions (quantity vulnerability)46.a rising ratio of the food import bills to total merchandise export earnings is a major concern for most countries in nena, where the ability to import food is an essential component of sustainable food security at the national level. the degree of vulnerability of any country to food price shocks depends on the situation of the current account and the level of dependence on food imports. countries of the region exhibit different vulnerability profiles (Figure 22). For instance, those with high cereal dependency ratios and current account deficits are the most vulnerable to price shocks. Member countries of the gcc, on the other hand, are highly dependent on food imports but have the means to buy food and therefore are less vulnerable to price shocks. however, they are highly vulnerable to cereal export restrictions.
governments in the region have implemented a series of short-term measures to offset the impact of soaring world food prices in recent years, these measures included tariff waivers, price controls, subsidies and wage increases. all these measures have considerably strained public finances. during the past decade, the food import bill increased dramatically in all countries of the region. Between 2005 and 2011, the value of wheat imports jumped by more than 200 percent in egypt, Jordan, tunisia and Yemen. although international food prices have recently witnessed significant declines47, crop prices are expected to stabilize in the medium term at levels that remain above the pre-2008 period, while meat, dairy and fish prices are expected to continue to rise48.
In light of the region’s high and increasing dependency on food imports, policy makers are paying greater attention to adopting more effective and sustainable measures to address the anticipated long-term increases in international food prices as well as increasing price volatility. several countries in the region are relying on expanding their grain storage capacity as a key policy instrument to address food price volatility. In 2010, the overall storage capacity in the region was, on average, six months of consumption, but
46 World Bank/FaO/IFad. Improving Food security in arab countries. World Bank 2009
47 the FaO Price Index dropped to 179 in February 2015 from its peak of 230 in 2011
48 FaO-Oecd agricultural Outlook (2014-2023)
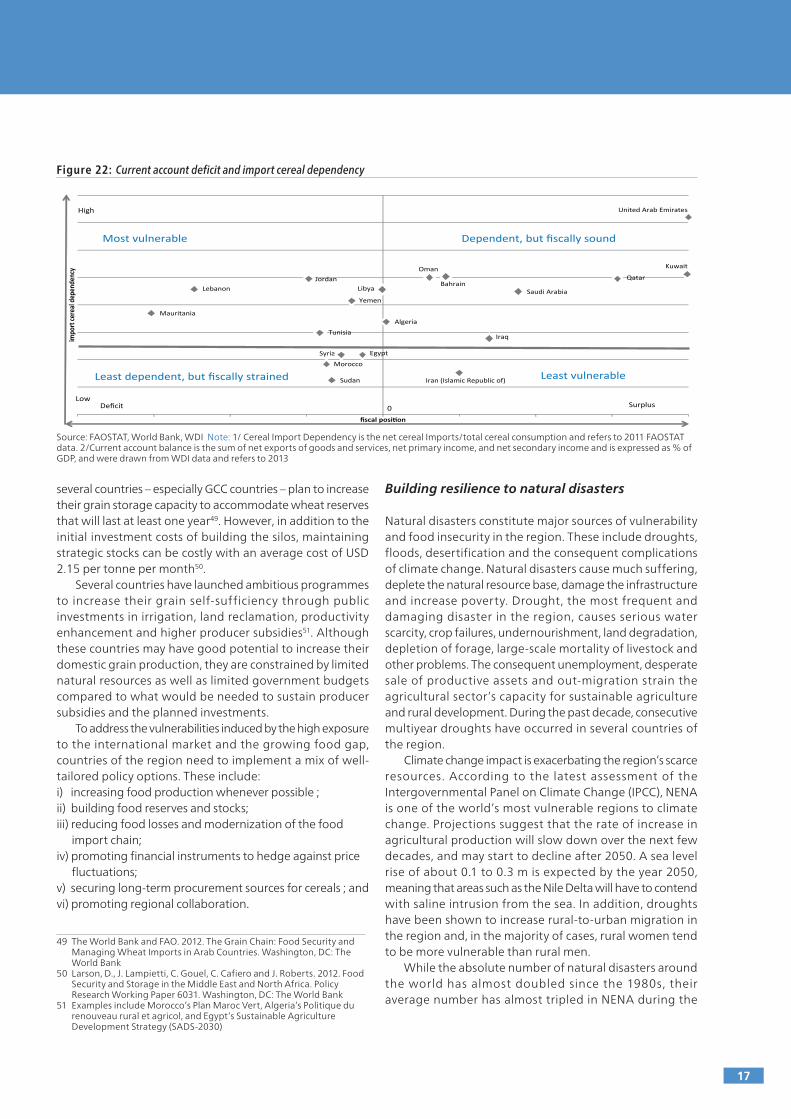
17
several countries – especially gcc countries – plan to increase their grain storage capacity to accommodate wheat reserves that will last at least one year49. however, in addition to the initial investment costs of building the silos, maintaining strategic stocks can be costly with an average cost of usd 2.15 per tonne per month50.
several countries have launched ambitious programmes to increase their grain self-sufficiency through public investments in irrigation, land reclamation, productivity enhancement and higher producer subsidies51. although these countries may have good potential to increase their domestic grain production, they are constrained by limited natural resources as well as limited government budgets compared to what would be needed to sustain producer subsidies and the planned investments.
to address the vulnerabilities induced by the high exposure to the international market and the growing food gap, countries of the region need to implement a mix of well-tailored policy options. these include: i) increasing food production whenever possible ; ii) building food reserves and stocks; iii) reducing food losses and modernization of the food
import chain; iv) promoting financial instruments to hedge against price
fluctuations; v) securing long-term procurement sources for cereals ; andvi) promoting regional collaboration.
49 the World Bank and FaO. 2012. the grain chain: Food security and Managing Wheat Imports in arab countries. Washington, dc: the World Bank
50 larson, d., J. lampietti, c. gouel, c. cafiero and J. Roberts. 2012. Food security and storage in the Middle east and north africa. Policy Research Working Paper 6031. Washington, dc: the World Bank
51 examples include Morocco’s Plan Maroc Vert, algeria’s Politique du renouveau rural et agricol, and egypt’s sustainable agriculture development strategy (sads-2030)
Building resilience to natural disasters
natural disasters constitute major sources of vulnerability and food insecurity in the region. these include droughts, floods, desertification and the consequent complications of climate change. natural disasters cause much suffering, deplete the natural resource base, damage the infrastructure and increase poverty. drought, the most frequent and damaging disaster in the region, causes serious water scarcity, crop failures, undernourishment, land degradation, depletion of forage, large-scale mortality of livestock and other problems. the consequent unemployment, desperate sale of productive assets and out-migration strain the agricultural sector’s capacity for sustainable agriculture and rural development. during the past decade, consecutive multiyear droughts have occurred in several countries of the region.
climate change impact is exacerbating the region’s scarce resources. according to the latest assessment of the Intergovernmental Panel on climate change (IPcc), nena is one of the world’s most vulnerable regions to climate change. Projections suggest that the rate of increase in agricultural production will slow down over the next few decades, and may start to decline after 2050. a sea level rise of about 0.1 to 0.3 m is expected by the year 2050, meaning that areas such as the nile delta will have to contend with saline intrusion from the sea. In addition, droughts have been shown to increase rural-to-urban migration in the region and, in the majority of cases, rural women tend to be more vulnerable than rural men.
While the absolute number of natural disasters around the world has almost doubled since the 1980s, their average number has almost tripled in nena during the
source: FaOstat, World Bank, WdI note: 1/ cereal Import dependency is the net cereal Imports/total cereal consumption and refers to 2011 FaOstat data. 2/current account balance is the sum of net exports of goods and services, net primary income, and net secondary income and is expressed as % of gdP, and were drawn from WdI data and refers to 2013
Mauritania
LebanonJordan
Tunisia
Morocco
Syria
Sudan
Yemen
Egypt
Libya
United Arab Emirates
Kuwait
Qatar
Saudi Arabia
Iraq
Iran (Islamic Republic of)
Oman
Bahrain
Algeria
impo
rt ce
real
depe
nden
cy
fiscal position
High
0Low
Deficit Surplus
Least vulnerable
Dependent, but fiscally soundMost vulnerable
Least dependent, but fiscally strained
Figure 22: Current account deficit and import cereal dependency

18
same period52. droughts recurrently hit the region, bringing significant water shortages, economic losses and adverse social consequences. Floods have been the most recurrent disaster recorded during the last 30 years (1981–2011), accounting for around 53 percent of the total number of disasters.
With more than 70 percent of the nena total area being desert and arid lands, disasters are accelerating the process of land degradation and desertification. More than 50 percent of the total land area of the region is in danger of being wholly or partially lost due to desertification or land degradation. Irrigation has contributed to the degradation of a large percentage of irrigated land through secondary salinization.
the league of arab states has adopted a disaster risk reduction (dRR) strategy and launched the regional platform for dRR. such a platform will benefit from advances in space technology (e.g. satellite remote sensing), climate modelling and risk assessment methodologies. these are being used to develop a monitoring and early warning system to serve the countries in their preparedness and response to cope with natural disasters. countries need to adopt national dRR frameworks, build reliable early warning systems, strengthen the response capacity of the institutions in charge of the dRR and implement long-term mitigation and adaption measures to disasters. Priority should be given in this regard to drought risk management and to implementing climate-smart agriculture programmes.
Building resilience to food chain crises
transboundary animal, plant and zoonotic pests and diseases and food safety events have long affected livestock and crop production in the nena region, reducing the availability of food and affecting quality. historically, animal diseases and plant pests – including their introduction, establishment, re-emergence and outbreaks – have resulted in major food problems either directly through yield reductions of food crops and loss of animals (or spill-over to humans) or indirectly through the reduction of yields of cash crops, inefficient feed conversion and loss of consumer confidence. climate change factors have further aggravated the situation.
Plant pests and diseases: The successful experience of the regional Desert Locust commissions
the nena region is prone to a number of plant pests and diseases, such as wheat rust, fruit flies and the tomato borer. among these, the desert locust (dl) is one of the most destructive locust species and can invade an area extending from africa’s atlantic coast to the Indo-Pakistani border, and from the Mediterranean to the equator. It poses an immediate threat to agricultural crop production, food and
52 World Bank 2014
nutrition security and the livelihoods of the populations. the locust-affected countries in the region include algeria, egypt, Mauritania, Morocco, Oman, saudi arabia, sudan, tunisia and Yemen.
Risk management and preparedness, through investments in early warning systems, capacity building of national institutions, contingency planning and regional collaboration are crucial. this is the aim of the two FaO Regional locust commissions: the FaO commission for controlling desert locust in the central Region (cRc)53 and the FaO commission for controlling desert locust in the Western Region (clcPRO)54.
the positive impact of regional collaboration for dl risk management and preparedness is illustrated by the differentiated response costs in the central Region and northwest africa during a dl upsurge in 2003-2005. In the central Region, where the preparedness efforts were well engaged, the cost of the response amounted to usd 7 million. In contrast, and in the absence of prevention systems, the total cost of the response in Western region was estimated at over usd 400 million. noting that the estimated annual cost of preventive control measures is usd 3.3 million, the expenses incurred for controlling the 2003-2005 major upsurge in the Western Region could have financed more than 100 years of prevention costs.
Addressing transboundary animal diseases and zoonoses
transboundary animal diseases (tads) and zoonoses result in serious food chain crises through reduced productivity and the death of animals, and disruption in the trade of animals and their products. spill-over into humans, sometimes with serious international public health consequences, is also a risk. loss of consumer confidence results in a long-term impact on the sector, because it reduces market access and the availability of food of animal origin. analysis of tads and zoonoses - which have become endemic in certain nena countries - reported officially by nena countries to the World Organisation for animal health (OIe) in the last decade include: foot-and-mouth disease (FMd), peste des petits ruminants (PPR), sheep and goat pox (sgP), brucellosis, bluetongue, highly pathogenic avian influenza (hPaI) and lumpy skin disease (lsd) (Figure 23). tads and zoonoses outbreaks occur frequently in the region, and are usually underreported. conflicts, protracted crises and unrest in some nena countries are severely affecting the veterinary services and disease control programmes. these problems, plus the uncontrolled movement of animals and products due to weak quarantine systems and border controls are facilitating the spread of tads and the emergence of zoonoses.
53 cRc covers djibouti, egypt, eritrea, ethiopia, Oman, saudi arabia, somalia, sudan and Yemen
54 clcPRO covers algeria, Burkina Faso, chad, libya, Mali, Morocco, Mauritania, niger, senegal and tunisia
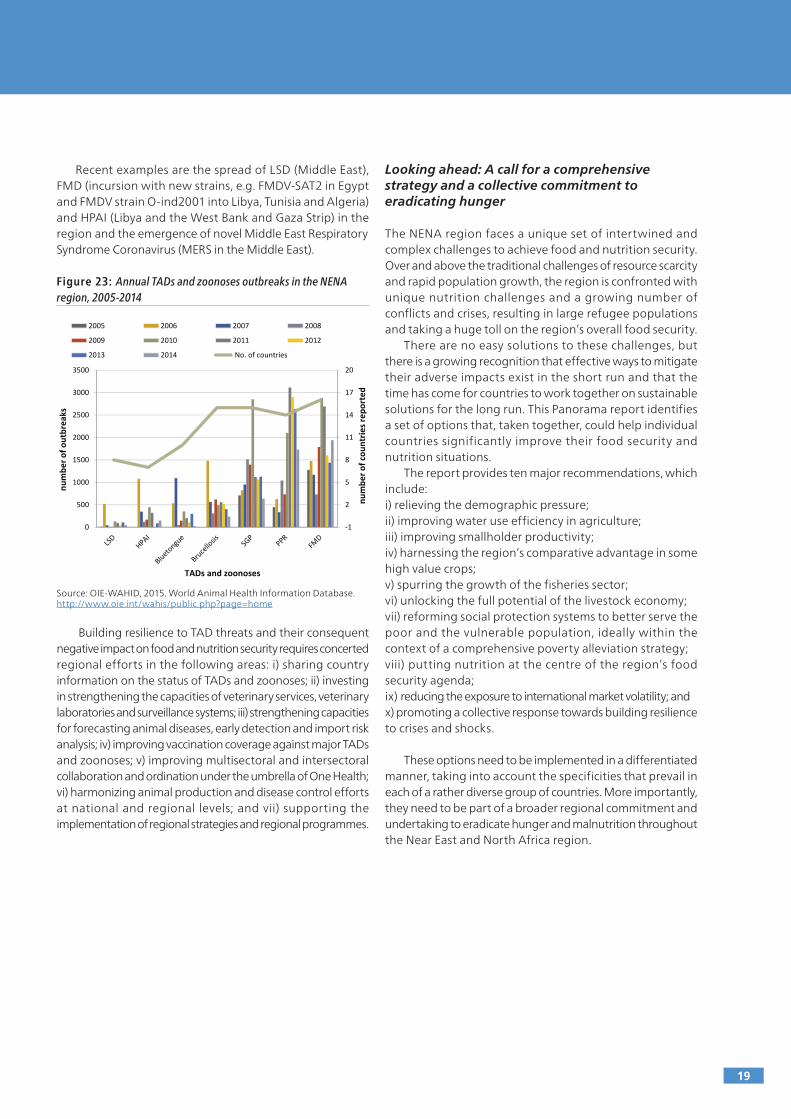
19
Recent examples are the spread of lsd (Middle east), FMd (incursion with new strains, e.g. FMdV-sat2 in egypt and FMdV strain O-ind2001 into libya, tunisia and algeria) and hPaI (libya and the West Bank and gaza strip) in the region and the emergence of novel Middle east Respiratory syndrome coronavirus (MeRs in the Middle east).
Figure 23: Annual TADs and zoonoses outbreaks in the NENA region, 2005-2014
source: OIe-WahId, 2015. World animal health Information database. http://www.oie.int/wahis/public.php?page=home
Building resilience to tad threats and their consequent negative impact on food and nutrition security requires concerted regional efforts in the following areas: i) sharing country information on the status of tads and zoonoses; ii) investing in strengthening the capacities of veterinary services, veterinary laboratories and surveillance systems; iii) strengthening capacities for forecasting animal diseases, early detection and import risk analysis; iv) improving vaccination coverage against major tads and zoonoses; v) improving multisectoral and intersectoral collaboration and ordination under the umbrella of One health; vi) harmonizing animal production and disease control efforts at national and regional levels; and vii) supporting the implementation of regional strategies and regional programmes.
Looking ahead: A call for a comprehensive strategy and a collective commitment to eradicating hunger
the nena region faces a unique set of intertwined and complex challenges to achieve food and nutrition security. Over and above the traditional challenges of resource scarcity and rapid population growth, the region is confronted with unique nutrition challenges and a growing number of conflicts and crises, resulting in large refugee populations and taking a huge toll on the region’s overall food security.
there are no easy solutions to these challenges, but there is a growing recognition that effective ways to mitigate their adverse impacts exist in the short run and that the time has come for countries to work together on sustainable solutions for the long run. this Panorama report identifies a set of options that, taken together, could help individual countries significantly improve their food security and nutrition situations.
the report provides ten major recommendations, which include: i) relieving the demographic pressure; ii) improving water use efficiency in agriculture; iii) improving smallholder productivity; iv) harnessing the region’s comparative advantage in some high value crops; v) spurring the growth of the fisheries sector;vi) unlocking the full potential of the livestock economy; vii) reforming social protection systems to better serve the poor and the vulnerable population, ideally within the context of a comprehensive poverty alleviation strategy; viii) putting nutrition at the centre of the region’s food security agenda; ix) reducing the exposure to international market volatility; and x) promoting a collective response towards building resilience to crises and shocks.
these options need to be implemented in a differentiated manner, taking into account the specificities that prevail in each of a rather diverse group of countries. More importantly, they need to be part of a broader regional commitment and undertaking to eradicate hunger and malnutrition throughout the near east and north africa region.
-1
2
5
8
11
14
17
20
0
500
1000
1500
2000
2500
3000
3500nu
mbe
r of c
ount
ries r
epor
ted
num
ber o
f out
brea
ks
TADs and zoonoses
2005 2006 2007 2008
2009 2010 2011 2012
2013 2014 No. of countries

20
1. alston, J.M., chan-Kang, c., Marra, M.c., Pardey, P.g., and Wyatt, t.J. 2000. a meta-analysis of rates of return to agricultural R&d: ex Pede herculem. Washington, d.c.: International Food Policy Research Institute.
2. aOad (arab Organization for agricultural development). 2007. arab agricultural statistical Yearbook. Khartoum, sudan: arab Organization for agricultural development.
3. echO. 2015. syria crisis Fact sheet.4. FaO. 2011. global food losses and food waste - extent, causes and prevention. Rome. available at http://www.fao.org/
docrep/014/mb060e/mb060e.pdf5. FaO 2011. Mapping supply and demand for animal-source foods to 2030, http://www.fao.org/docrep/014/i2425e/
i2425e00.pdf6. FaO Fishery statistical Yearbook. 2014.7. FaO. nena Regional Water scarcity Initiative: towards a collaborative regional strategy on sustainable agriculture
management for food security and nutrition. FaO Regional Office for the near east and north africa. 2014.8. FaO. Rome 2014. state of Food Insecurity in the World (sOFI). 9. FaO statistic. 2014.10. FaO Regional Office for the near east and north africa. 2014. Food security and nutrition strategy Paper for the near
east Regional conference (neRc-32).11. FaO. Rome 2015 (forthcoming). state of Food Insecurity in the World (sOFI). 12. Future humanitarian Financing 2015: looking Beyond the crisis.13. ghanem, h. 2013. Regional and Rural development to support egypt’s democratic transition. Brookings Institution. 14. harrigan, J. 2011. Food security in the Middle east and north africa (Mena) and sub-saharan africa: a comparative
analysis. technical Report.15. IFPRI (International Food Policy Research Institute). 2014-2015 global Food Policy Report”. http://www.ifpri.org/sites/
default/files/gfpr/2015/index.html16. IFPRI and WFP. May 2013. tackling egypt’s Rising Food Insecurity in a time of transition. Joint IFPRI/WFP Policy note.17. IlO, decent Work Programme for Promoting decent Work for all. 2015. http://www.ilo.org/global/topics/decent-work/
lang--en/index.htm18. IMF (International Monetary Fund). 2014. subsidy Reform in the Middle east and north africa: Recent Progress and
challenges ahead. Washington, d.c.19. IMF. 2014. Regional economic Outlook, update.20. the lancet series. http:// www.thelancet.com/series/maternal-and-child-nutrition21. larson, d., lampietti, J., gouel, c., cafiero c. and Roberts, J. 2012. Food security and storage in the Middle east and north
africa. Policy Research Working Paper 6031. Washington, d.c.: the World Bank.22. Oecd-FaO. 2014. agricultural Outlook 2014-2023.23. Oecd states of Fragility 2015.24. OIe-WahId. 2015. World animal health Information database. http://www.oie.int/wahis/public.php?page=home25. undP/unRWa - syria center for Policy Research. March 2015. alienation and Violence - Impact of syria crisis Report
2014. 26. un syrian humanitarian Response Plan/shaRP 2013 and 2014. 27. un syrian arab Republic strategic Response Plan/sRP 2015. 28. un Regional Refugee and Resilience Response Plan/3RP 2015.29. World Bank. 2002. Reducing Vulnerability and Increasing Opportunity: social Protection in the Middle east and north
africa. Washington, d.c.30. World Bank/FaO/IFad. 2009. Improving Food security in arab countries.31. World Bank. 2011. World development Report. conflict, security and development.32. World Bank Middle east and north africa Region. May 2011. a Regional economic update.33. World Bank. 2012. Inclusion and Resilience. the Way Forward for social safety nets in the Middle east and north africa.
Mena development Report. World Bank Mena Report 2012.34. World Bank and FaO. 2012. the grain chain: Food security and Managing Wheat Imports in arab countries. Washington,
d.c.: the World Bank.35. World Bank/un lebanon. september 2013. economic and social Impact assessment of the syria conflict. 36. World Bank. 2013. country Profile, tunisia.37. World Bank. 2014. natural disasters in the Middle east and north africa: a Regional Overview. 38. World Bank. 2014. World development Indicators database .
B i b l i o g r a p h y

2015 Regional Overview of Food Insecurity
Near East and North AfricaKey messages
Fifteen countries out of 19 in the Near East and North Africa region have met the MDG hunger target. However, the region as a whole has witnessed a significant setback in the fight against hunger due to conflicts and protracted crises.
The region is becoming increasingly dependent on food imports, because of demographic pressure, rapid urbanization, water scarcity and climate change.
Rebalancing regional trade requires a renewed focus on the region’s comparative advantage in high-value crops and realizing its potential in intraregional trade.
Improving nutrition, strengthening safety nets, reducing food losses and waste and promoting sustainable water management and agricultural productivity should be at the top of the food security and nutrition agenda in the region.
Regional collaboration is critical to address the multiple threats and risks to food security and nutrition and to build resilience in the NENA region.
14644E/2/04.16
ISBN 978-92-5-108787-9
9 7 8 9 2 5 1 0 8 7 8 7 9