Embed Size (px)
Citation preview
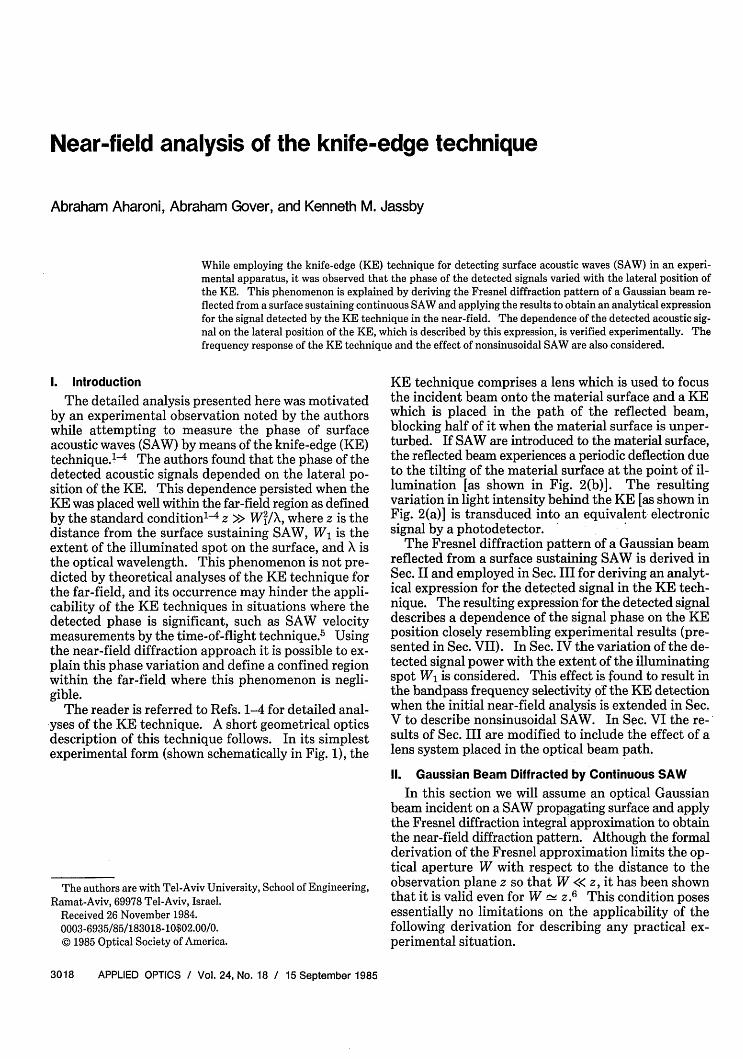
Near-field analysis of the knife-edge technique
Abraham Aharoni, Abraham Gover, and Kenneth M. Jassby
While employing the knife-edge (KE) technique for detecting surface acoustic waves (SAW) in an experi-mental apparatus, it was observed that the phase of the detected signals varied with the lateral position ofthe KE. This phenomenon is explained by deriving the Fresnel diffraction pattern of a Gaussian beam re-flected from a surface sustaining continuous SAW and applying the results to obtain an analytical expressionfor the signal detected by the KE technique in the near-field. The dependence of the detected acoustic sig-nal on the lateral position of the KE, which is described by this expression, is verified experimentally. Thefrequency response of the KE technique and the effect of nonsinusoidal SAW are also considered.
1. Introduction
The detailed analysis presented here was motivatedby an experimental observation noted by the authorswhile attempting to measure the phase of surfaceacoustic waves (SAW) by means of the knife-edge (KE)technique.14 The authors found that the phase of thedetected acoustic signals depended on the lateral po-sition of the KE. This dependence persisted when theKE was placed well within the far-field region as definedby the standard conditionl" z >> W/X, where z is thedistance from the surface sustaining SAW, W1 is theextent of the illuminated spot on the surface, and X isthe optical wavelength. This phenomenon is not pre-dicted by theoretical analyses of the KE technique forthe far-field, and its occurrence may hinder the appli-cability of the KE techniques in situations where thedetected phase is significant, such as SAW velocitymeasurements by the time-of-flight technique.5 Usingthe near-field diffraction approach it is possible to ex-plain this phase variation and define a confined regionwithin the far-field where this phenomenon is negli-gible.
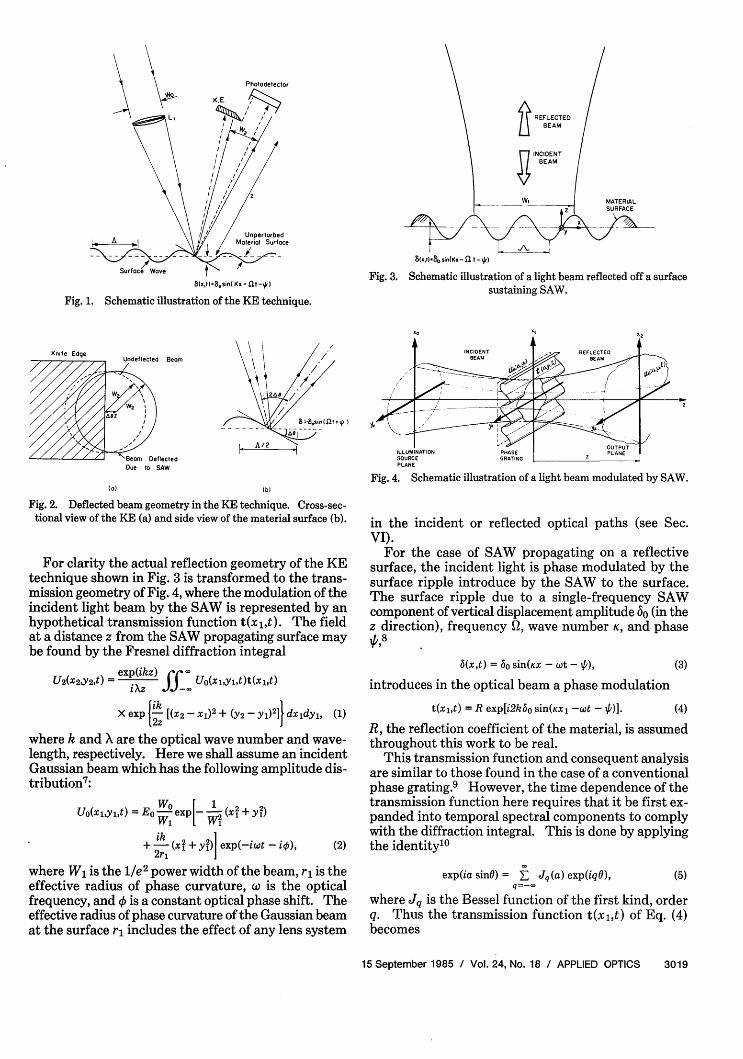
The reader is referred to Refs. 1-4 for detailed anal-yses of the KE technique. A short geometrical opticsdescription of this technique follows. In its simplestexperimental form (shown schematically in Fig. 1), the
The authors are with Tel-Aviv University, School of Engineering,Ramat-Aviv, 69978 Tel-Aviv, Israel.
Received 26 November 1984.0003-6935/85/183018-10$02.00/0.© 1985 Optical Society of America.
KE technique comprises a lens which is used to focusthe incident beam onto the material surface and a KEwhich is placed in the path of the reflected beam,blocking half of it when the material surface is unper-turbed. If SAW are introduced to the material surface,the reflected beam experiences a periodic deflection dueto the tilting of the material surface at the point of il-lumination [as shown in Fig. 2(b)]. The resultingvariation in light intensity behind the KE [as shown inFig. 2(a)] is transduced into an equivalent electronicsignal by a photodetector.
The Fresnel diffraction pattern of a Gaussian beamreflected from a surface sustaining SAW is derived inSec. II and employed in Sec. III for deriving an analyt-ical expression for the detected signal in the KE tech-nique. The resulting expression for the detected signaldescribes a dependence of the signal phase on the KEposition closely resembling experimental results (pre-sented in Sec. VII). In Sec. IV the variation of the de-tected signal power with the extent of the illuminatingspot W1 is considered. This effect is found to result inthe bandpass frequency selectivity of the KE detectionwhen the initial near-field analysis is extended in Sec.V to describe nonsinusoidal SAW. In Sec. VI the re-sults of Sec. III are modified to include the effect of alens system placed in the optical beam path.
11. Gaussian Beam Diffracted by Continuous SAW
In this section we will assume an optical Gaussianbeam incident on a SAW propagating surface and applythe Fresnel diffraction integral approximation to obtainthe near-field diffraction pattern. Although the formalderivation of the Fresnel approximation limits the op-tical aperture W with respect to the distance to theobservation plane z so that W << z, it has been shownthat it is valid even for W nz. 6 This condition posesessentially no limitations on the applicability of thefollowing derivation for describing any practical ex-perimental situation.
3018 APPLIED OPTICS / Vol. 24, No. 18 / 15 September 1985
REFLECTEDBEAM
_ INCIDENTBEAM
MATERIALSURFACE
8(x,t8.sin( K.- at -q
Fig. 1. Schematic illustration of the KE technique.
Knife Edge Undeflected Beam
AGZ I
Beam DeflectedDue to SAW
Ia)
)
- A/2
(b)
Fig. 2. Deflected beam geometry in the KE technique. Cross-sec-tional view of the KE (a) and side view of the material surface (b).
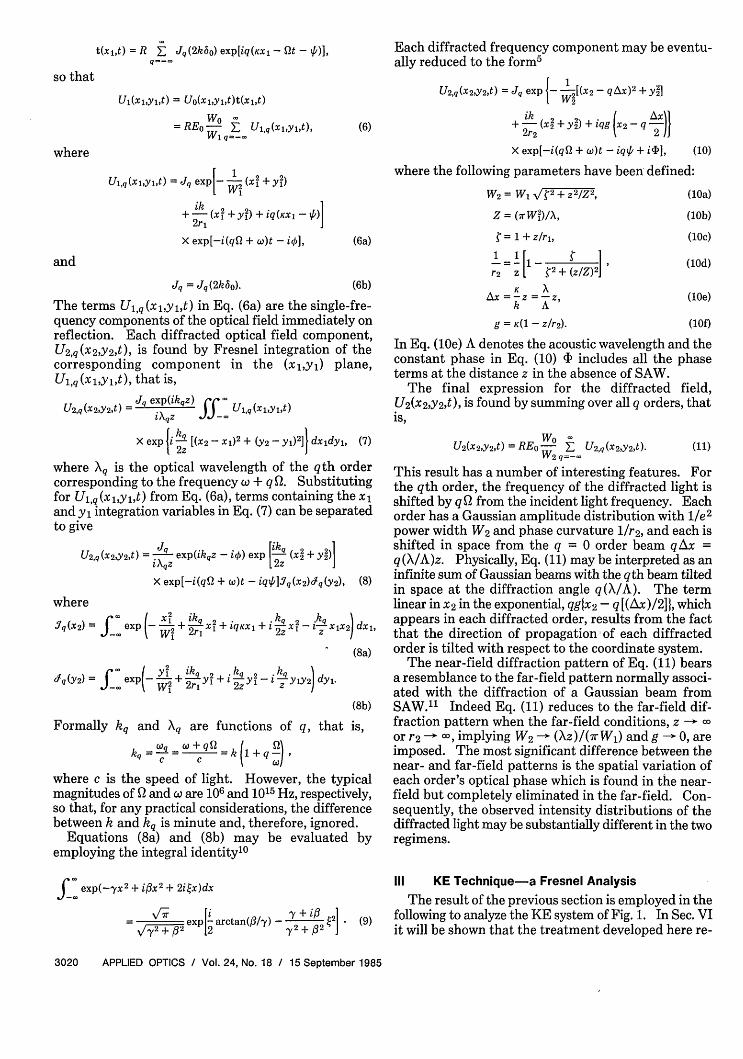
For clarity the actual reflection geometry of the KEtechnique shown in Fig. 3 is transformed to the trans-mission geometry of Fig. 4, where the modulation of theincident light beam by the SAW is represented by anhypothetical transmission function t(xj,t). The fieldat a distance z from the SAW propagating surface maybe found by the Fresnel diffraction integral
U2(x2,y2,t) = exP(ikz)j Uo(x,y 1,t)t(x 1,t)
X exp ik [(X2 - x1)2 + (Y2 - yl)2]} dxldyl, (1)12zI
where k and X are the optical wave number and wave-length, respectively. Here we shall assume an incidentGaussian beam which has the following amplitude dis-tribution7 :
Uo(x,yi,t) = Eo W exp - - (X2 + y2)Wi I- W
+ 2 (Xl + 2) exp(-it - i), (2)2rl
where W, is the 1/e2 power width of the beam, r1 is theeffective radius of phase curvature, w is the opticalfrequency, and , is a constant optical phase shift. Theeffective radius of phase curvature of the Gaussian beamat the surface r, includes the effect of any lens system
8x ,ff.8 sie(Ka-S a t - )
Fig. 3. Schematic illustration of a light beam reflected off a surfacesustaining SAW.
ILLUMINATION PASE PLANE lSOURCE GRATING ________
PLANE
Fig. 4. Schematic illustration of a light beam modulated by SAW.
in the incident or reflected optical paths (see Sec.VI).
For the case of SAW propagating on a reflectivesurface, the incident light is phase modulated by thesurface ripple introduce by the SAW to the surface.The surface ripple due to a single-frequency SAWcomponent of vertical displacement amplitude 50 (in thez direction), frequency Q, wave number K, and phaselp8
6(x,t) = o sin(Kx - Wt - ),
introduces in the optical beam a phase modulation
t(xl,t) = R exp[i2kbo sin(Kxl -Wt - 41)].
(3)
(4)
R, the reflection coefficient of the material, is assumedthroughout this work to be real.
This transmission function and consequent analysisare similar to those found in the case of a conventionalphase grating.9 However, the time dependence of thetransmission function here requires that it be first ex-panded into temporal spectral components to complywith the diffraction integral. This is done by applyingthe identity'0
exp(ia sinO) = J(a) exp(iqO),q=--
(5)
where Jq is the Bessel function of the first kind, orderq. Thus the transmission function t(x1 ,t) of Eq. (4)becomes
15 September 1985 / Vol. 24, No. 18 / APPLIED OPTICS 3019
t(xl,t) = R i Jq(2kbo) exp[iq(KxI - Ot - )],q=st
so that
U1(x1,y1,t) = Uo(x,y,t)t(x 1 ,t)
Wo E= RE- F_ U,q(X1,Y1,t), (6)
where
Each diffracted frequency component may be eventu-ally reduced to the form5
U2,q(X2,Y2,t) = Jq exp {- -[(X2 - qAx)2 + y2]
+ik(X2+y2)+iqg . X2-q Ax)2r2 f 2
X exp[-i(qQl + wo)t - iq4' + i], (10)
Jq = Jq(2kbo).
where the following parameters have been defined:
(6a)
(6b)
The terms U1,q(xiyi,t) in Eq. (6a) are the single-fre-quency components of the optical field immediately onreflection. Each diffracted optical field component,U2,q(X2,Y2,t), is found by Fresnel integration of thecorresponding component in the (xl,yl) plane,U1,q(XiYi,t), that is,U2,q(X2,Y2,) -Jq exp(ikqZ) f ~U1,q(X1,YI,t)
ixqz J!;
X exp i q [(X2 - Xj) 2 + (Y2 - y)21} dxldyl, (7)
where q is the optical wavelength of the qth ordercorresponding to the frequency cw + q Q. Substitutingfor U1,q(x,yi,t) from Eq. (6a), terms containing the x1and yj integration variables in Eq. (7) can be separatedto give
U2,q(X2,Y2,t) = q exp(ikqZ - i) exp [ik (X2 + Y2)]ExqZ 2zI
X exp[-i(qQ + w)t - iq4'Vyq(X2)dq(y2), (8)
where
Jq(x2) =Jexp (- X + + iqKX+ + i 2xi 1xX2) dx,
(8a)
=, exp{ + iq 2 +ikq 2-q .k dyl.Oq(Y2) JexP 2+ rY Y EjzY' E YY2)d .
(8b)
Formally kq and q are functions of q, that is,
k =cq=w+q0=k +q Q
where c is the speed of light. However, the typicalmagnitudes of Q and w are 106 and 1015 Hz, respectively,so that, for any practical considerations, the differencebetween k and kq is minute and, therefore, ignored.
Equations (8a) and (8b) may be evaluated byemploying the integral identity' 0
(10a)
(lOb)
(lOc)
W2 = WI Vf--2 + z2/Z 2,
Z = (7rW )/X,
r = 1 + zrl,
K X=kZ =-Z,k A
g = K(l - z/r2).
(lOd)
(lOe)
(lOf)
In Eq. (lOe) A denotes the acoustic wavelength and theconstant phase in Eq. (10) 4 includes all the phaseterms at the distance z in the absence of SAW.
The final expression for the diffracted field,U2(x 2,y2,t), is found by summing over all q orders, thatis,
Wo U2 (X2,Y2,t) = RE - Z_ U2,q(X2,Y2,t). (11)
This result has a number of interesting features. Forthe qth order, the frequency of the diffracted light isshifted by q Q from the incident light frequency. Eachorder has a Gaussian amplitude distribution with 1/e2
power width W2 and phase curvature 1/r2, and each isshifted in space from the q = 0 order beam qx =q(X/A)z. Physically, Eq. (11) may be interpreted as aninfinite sum of Gaussian beams with the qth beam tiltedin space at the diffraction angle q (X/A). The termlinear in x2 in the exponential, qgIx 2 - q [(Ax)/2]}, whichappears in each diffracted order, results from the factthat the direction of propagation of each diffractedorder is tilted with respect to the coordinate system.
The near-field diffraction pattern of Eq. (11) bearsa resemblance to the far-field pattern normally associ-ated with the diffraction of a Gaussian beam fromSAW." Indeed Eq. (11) reduces to the far-field dif-fraction pattern when the far-field conditions, z - -or r2 - c, implying W2 - (z)/(7rW,) and g - 0, areimposed. The most significant difference between thenear- and far-field patterns is the spatial variation ofeach order's optical phase which is found in the near-field but completely eliminated in the far-field. Con-sequently, the observed intensity distributions of thediffracted light may be substantially different in the tworegimens.
J exp(-,yx2 + iX2 + 2itx)dx
= V/ 7r = exp i-arctan(l/-y) Y + t2 ' 2 ' 2 2 + 032(9)
III KE Technique-a Fresnel Analysis
The result of the previous section is employed in thefollowing to analyze the KE system of Fig. 1. In Sec. VIit will be shown that the treatment developed here re-
3020 APPLIED OPTICS / Vol. 24, No. 18 / 15 September 1985
Ul,q(xi,yi,t) = Jq exp- W2 (Xl + Y
i 1+ - (Xl2 + y2) + iq(KXI - )]
2x1 I I I
X exp[-i(qQ + w)t - ]
and
02)
0 ORDER
1 ORDER\ -n
X2
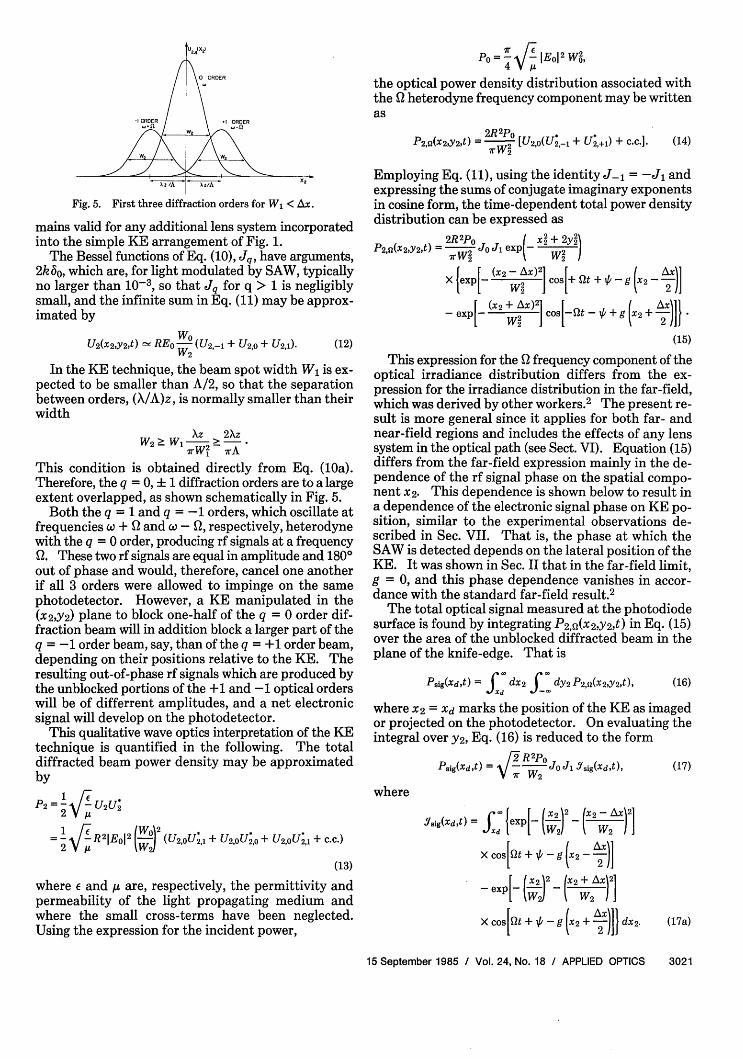
Fig. 5. First three diffraction orders for W1 < Ax.
mains valid for any additional lens system incorporatedinto the simple KE arrangement of Fig. 1.
The Bessel functions of Eq. (10), Jq, have arguments,2kbo, which are, for light modulated by SAW, typicallyno larger than 10-3, so that Jq for q > 1 is negligiblysmall, and the infinite sum in Eq. (11) may be approx-imated by
U2 (x2,y 2,t) REo W (U2 ,-1 + U2 ,0 + U2 ,1). (12)
In the KE technique, the beam spot width W1 is ex-pected to be smaller than A/2, so that the separationbetween orders, (X/A)z, is normally smaller than theirwidth
W2 W Xz 2 \z-7rW2 - iA
This condition is obtained directly from Eq. (lOa).Therefore, the q = 0, ± 1 diffraction orders are to a largeextent overlapped, as shown schematically in Fig. 5.
Both the q = 1 and q = -1 orders, which oscillate atfrequencies w + Q and c - Q, respectively, heterodynewith the q = 0 order, producing rf signals at a frequencyQ. These two rf signals are equal in amplitude and 1800out of phase and would, therefore, cancel one anotherif all 3 orders were allowed to impinge on the samephotodetector. However, a KE manipulated in the(x2 ,y2) plane to block one-half of the q = 0 order dif-fraction beam will in addition block a larger part of theq = -1 order beam, say, than of the q = +1 order beam,depending on their positions relative to the KE. Theresulting out-of-phase rf signals which are produced bythe unblocked portions of the +1 and -1 optical orderswill be of differrent amplitudes, and a net electronicsignal will develop on the photodetector.
This qualitative wave optics interpretation of the KEtechnique is quantified in the following. The totaldiffracted beam power density may be approximatedby
P2 = 2 V U2U,
= -V 11R~I~oI'2 tW- (U2 ,0U2, + U2,0U2,0 + U2,0U;,1 + c-c)
(13)
where E and A are, respectively, the permittivity andpermeability of the light propagating medium andwhere the small cross-terms have been neglected.Using the expression for the incident power,
PO= I IEoI2 W2,
the optical power density distribution associated withthe Q heterodyne frequency component may be writtenas
P2 ,Q(X2Y2,t) = 2 [U2 ,o(U2,-1 + U2,+1 ) + C.c.]. (14)irW 2
Employing Eq. (11), using the identity J-1 = -J, andexpressing the sums of conjugate imaginary exponentsin cosine form, the time-dependent total power densitydistribution can be expressed as
2R 2P0 Jo ( exp 2+ 2Y2P2 (x2,y 2,t) = 7rW2 JoJ2exp-2rW2
[(X2 + AX)21 ( xx-exp - < cos-|+tt'+-g X2+--2)|j- exp[ 2 ]COS-t- + g X2 +- AX}
(15)
This expression for the Q frequency component of theoptical irradiance distribution differs from the ex-pression for the irradiance distribution in the far-field,which was derived by other workers.2 The present re-sult is more general since it applies for both far- andnear-field regions and includes the effects of any lenssystem in the optical path (see Sect. VI). Equation (15)differs from the far-field expression mainly in the de-pendence of the rf signal phase on the spatial compo-nent X2. This dependence is shown below to result ina dependence of the electronic signal phase on KE po-sition, similar to the experimental observations de-scribed in Sec. VII. That is, the phase at which theSAW is detected depends on the lateral position of theKE. It was shown in Sec. II that in the far-field limit,g = 0, and this phase dependence vanishes in accor-dance with the standard far-field result.2
The total optical signal measured at the photodiodesurface is found by integrating P2,S(x2,y2,t) in Eq. (15)over the area of the unblocked diffracted beam in theplane of the knife-edge. That is
Peig(Xdt) = 3d dx 2 E dy2 P2Q(x2,y2,, (16)
where X2 = Xd marks the position of the KE as imagedor projected on the photodetector. On evaluating theintegral over Y2, Eq. (16) is reduced to the form
Psig(Xd,t) = JO Ji Ysig(Xd t) (17)
where
. ig(Xdt) = 3' {exp[-( )2 - (x2 x)2]
X os t + h - g X2 All
.-ex _ X2 ~2 X2 + A~ 21- exp (W2 - W2+)
Xcos[Qt+t'-g x2 +-- )I} dX2- (17a)
15 September 1985 / Vol. 24, No. 18 / APPLIED OPTICS 3021
ORS
06
104
02
0
KE POSITION ,
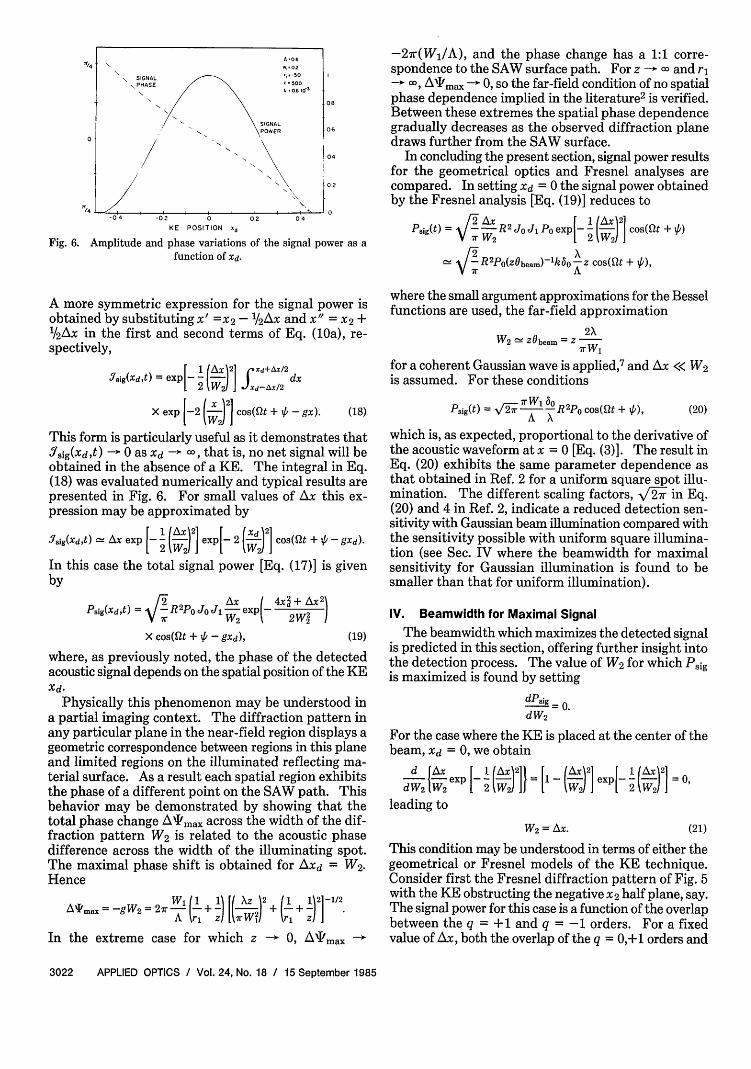
Fig. 6. Amplitude and phase variations of the signal power as afunction of xd.
A more symmetric expression for the signal power isobtained by substituting x' =x2 - /2Ax and x" = x2 +1/2Ax in the first and second terms of Eq. (Oa), re-spectively,
,7ig(xdt) = expi 112 fxd) ] dxL 2 PV 2)j Xd-Ax/2
X exp [-2 (X-21 cos(Qt + 46-gx). (18)
This form is particularly useful as it demonstrates thatYsig(Xd,t) - 0 as Xd - a, that is, no net signal will beobtained in the absence of a KE. The integral in Eq.(18) was evaluated numerically and typical results arepresented in Fig. 6. For small values of Ax this ex-pression may be approximated by
Jsig~d,t) -_ Ax exp -_ - I-I~ I exp I- 2 I-Il1 C0s(Qt + IP - gxd).[ 2 W 2 [ W 21J
In this case the total signal power [Eq. (17)] is givenby
Psig(xdt) = R2poJoJ W exp - 2 )
X cos(Qt + 9-gxd), (19)
where, as previously noted, the phase of the detectedacoustic signal depends on the spatial position of the KEXd.
Physically this phenomenon may be understood ina partial imaging context. The diffraction pattern inany particular plane in the near-field region displays ageometric correspondence between regions in this planeand limited regions on the illuminated reflecting ma-terial surface. As a result each spatial region exhibitsthe phase of a different point on the SAW path. Thisbehavior may be demonstrated by showing that thetotal phase change A'Imax across the width of the dif-fraction pattern W2 is related to the acoustic phasedifference across the width of the illuminating spot.The maximal phase shift is obtained for Axd = W2.Hence
A*I'ax = -gW 2 = 2ir W1 (I + ) [Xz)2 + (I1 + 2112A r z z 0, z)]
In the extreme case for which z 0, A\tmax
-2ir(Wj/A), and the phase change has a 1:1 corre-spondence to the SAW surface path. For z -- and ri
- al A'Tmax - 0, so the far-field condition of no spatialphase dependence implied in the literature2 is verified.Between these extremes the spatial phase dependencegradually decreases as the observed diffraction planedraws further from the SAW surface.
In concluding the present section, signal power resultsfor the geometrical optics and Fresnel analyses arecompared. In setting xd = 0 the signal power obtainedby the Fresnel analysis [Eq. (19)] reduces to
Psjg(t) -- AR2 J 1 Po exp- I (-)l] cos(Qt + )
~ 'R2PO(ZObeam)-1k6Oz cos(Ut + ),7r ~A
where the small argument approximations for the Besselfunctions are used, the far-field approximation
W2 Zbeam = Z2XrWl
for a coherent Gaussian wave is applied,7 and Ax << W2is assumed. For these conditions
Psig(t) = / -A R 2Po cos(Qt + ),A X
(20)
which is, as expected, proportional to the derivative ofthe acoustic waveform at x = 0 [Eq. (3)]. The result inEq. (20) exhibits the same parameter dependence asthat obtained in Ref. 2 for a uniform square spot illu-mination. The different scaling factors, e in Eq.(20) and 4 in Ref. 2, indicate a reduced detection sen-sitivity with Gaussian beam illumination compared withthe sensitivity possible with uniform square illumina-tion (see Sec. IV where the beamwidth for maximalsensitivity for Gaussian illumination is found to besmaller than that for uniform illumination).
IV. Beamwidth for Maximal Signal
The beamwidth which maximizes the detected signalis predicted in this section, offering further insight intothe detection process. The value of W2 for which Psigis maximized is found by setting
dPsig 0
dW2
For the case where the KE is placed at the center of thebeam, Xd = 0, we obtain
d{[Ax F 1 (Ax \211 [(Ax\21 [ 1Ax2ld [Ax exp I--I-- (. = Il-I-Il expl--I21 =0,ding FW2 2 tW 2o1J[W 2 2 V 2 j
leading to
W2 = Ax. (21)
This condition may be understood in terms of either thegeometrical or Fresnel models of the KE technique.Consider first the Fresnel diffraction pattern of Fig. 5with the KE obstructing the negative x2 half plane, say.The signal power for this case is a function of the overlapbetween the q = +1 and q = -1 orders. For a fixedvalue of Ax, both the overlap of the q = 0,+1 orders and
3022 APPLIED OPTICS / Vol. 24, No. 18 / 15 September 1985
that of the q = +1,-i orders are error functions Of W 2.
The q = +1,-1 order overlap is, however, offset by 2Ax,and consequently the signal power is maximized for W 2
=Ax.The geometrical interpretation is best described when
the far-field approximation of W2 [derived from Eq.(10a)],
W2=
and the expression for Ax = X/Az are both substitutedin Eq. (21). A new condition for maximal signal powerin terms of the beamwidth on the surface given by
(21a)
is thereby obtained. This result may be interpreted inthe following way. If the beam spot width W1 weredivided into small elements, the far-field electrical fieldmay be regarded as the superposition of the electricalfield amplitudes of each element. Condition (21a) in-dicates that as long as W, < A/r, the contribution of allthe elements add in-phase, whereas, if W1 > A/r, someof the elements produce out-of-phase electronic fieldamplitudes reducing the overall signal power.
Intuitively one might expect the limiting spot widthfor in-phase electrical field amplitude addition to be W,' A/2, because the surface tilt throughout half of awavelength has the same sign. Indeed this is the con-dition obtained for a uniformly illuminated square spoton the surface.2 The somewhat reduced limiting widthof Eq. (21a) is attributed to the gradual decay of theoptical power in Gaussian spot in contrast to the sharplydefined boundary of the uniform square spot.
V. KE Technique for Nonsinusoidal SAW
The diffraction pattern derived in Sec. II assumes aninfinite surface corrugation, which is associated withcontinuous single-frequency acoustic wavesforms.However, in many practical applications SAW pulsesare employed. It is the purpose of the present sectionto consider the effect of nonsinusoidal SAW on the de-tected signal in the KE technique.
An arbitrary surface acoustic waveform, 6(x,t), maybe represented as a Fourier series in spectral compo-nents,
U2,,,NI)
a q~o
6(x,t) = a a3m sin[m(Kpx - Qpt- m)I, (22)m=1
where 3 m is the amplitude of the m Qp frequency com-ponent. Normally Qp refers to the pulsed repetitionrate (PRF) in a multiple pulsed system or, alternatively,to the reciprocal of the pulse duration Tp if only onepulse is present, that is, Qp = 27r/Tp. Similarly, Kp =
2wr/Xp, where Xp is the spatial period or spatial pulseduration for the same instances, respectively. Thephase ripple modulation introduced in a beam reflectedfrom such perturbations may be represented by
t(x,t) = R II expli2kbm sin[m(KPx - pt - 4m)]I. (23)m=1
Applying identity (5) yields
t(x,t) = R fi E Jqm(2kbm) exp[imqm(Kpx - pt -Pm). (24)m=1 q,=-X
Equation (24) may be multiplied out term by termproducing qm terms, which, as shown in Ref. 12, may bewritten as an infinite sum over a new index M. It wouldthen be possible to perform the Fresnel integration oneach of these terms to obtain an expression for the re-sulting near-field diffraction pattern.5 Alternatively,the analysis may be considerably simplified if the Besselfunctions of orders q > 1 and their multiples are ne-glected, as before, reducing Eq. (24) to
t(x,t) = R a a J(2kbm) exp[imq(Kpx - Qpt-m)] (25)q=-1 m=1
Following a derivation similar to that which previouslyled from Eq. (6) to the final result of Eq. (11) for eachterm of the transmission function in Eq. (25), we obtainthe approximate expression
U ( ' W 1 U2(X2 ,Y2 ,t) = RE - Z_ U2,q,m (X2,Y2,t),
2q=-l .=I(26)
where
U2,q,m(x2,y2,t) = Jq(2k6m) exp {- [(X2 - mqAx) 2 + y2]
ik ( 2 xy2) + imqg X2-mq Ax)2r2 2 2 2 +
X exp[-i(mqQ2, + w)t - imq4i'm + il. (26a)
1m-I
q -I, .-n
q -I, --
.n, -
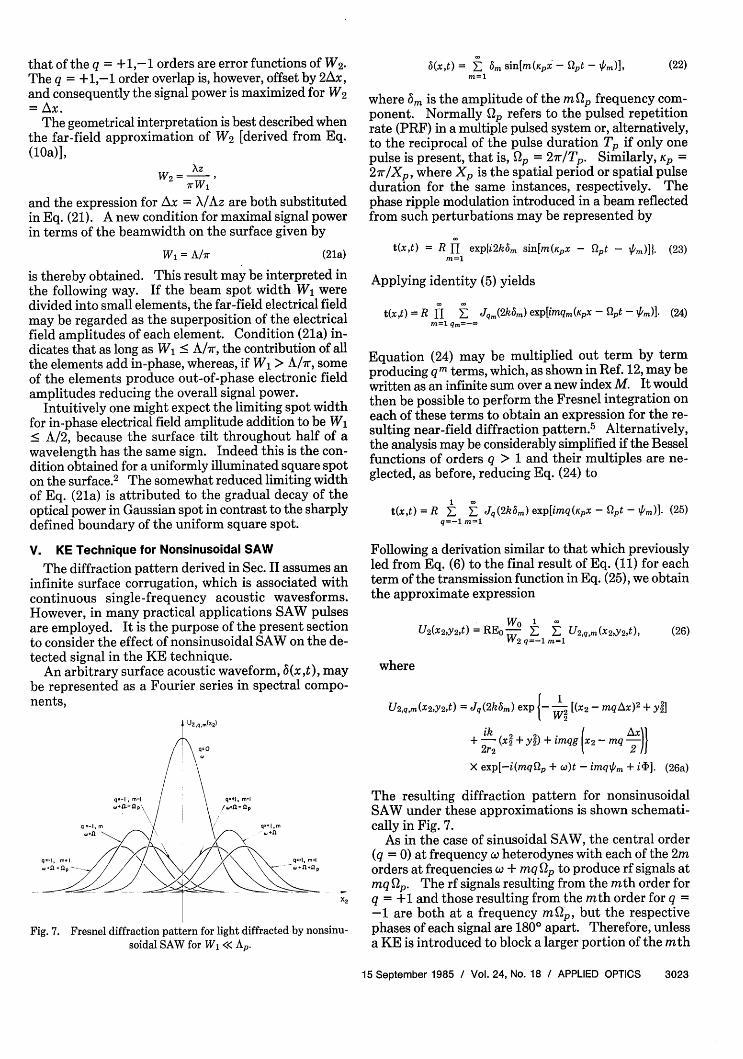
Fig. 7. Fresnel diffraction pattern for light diffracted by nonsinu-soidal SAW for W1 << AP.
The resulting diffraction pattern for nonsinusoidalSAW under these approximations is shown schemati-cally in Fig. 7.
As in the case of sinusoidal SAW, the central order(q = 0) at frequency co heterodynes with each of the 2morders at frequencies w + mq Up to produce rf signals atmq Qp. The rf signals resulting from the mth order forq = +1 and those resulting from the mth order for q =-1 are both at a frequency mQp, but the respectivephases of each signal are 1800 apart. Therefore, unlessa KE is introduced to block a larger portion of the mth
15 September 1985 / Vol. 24, No. 18 / APPLIED OPTICS 3023
W = A/r
(a)
SAW '
(b)
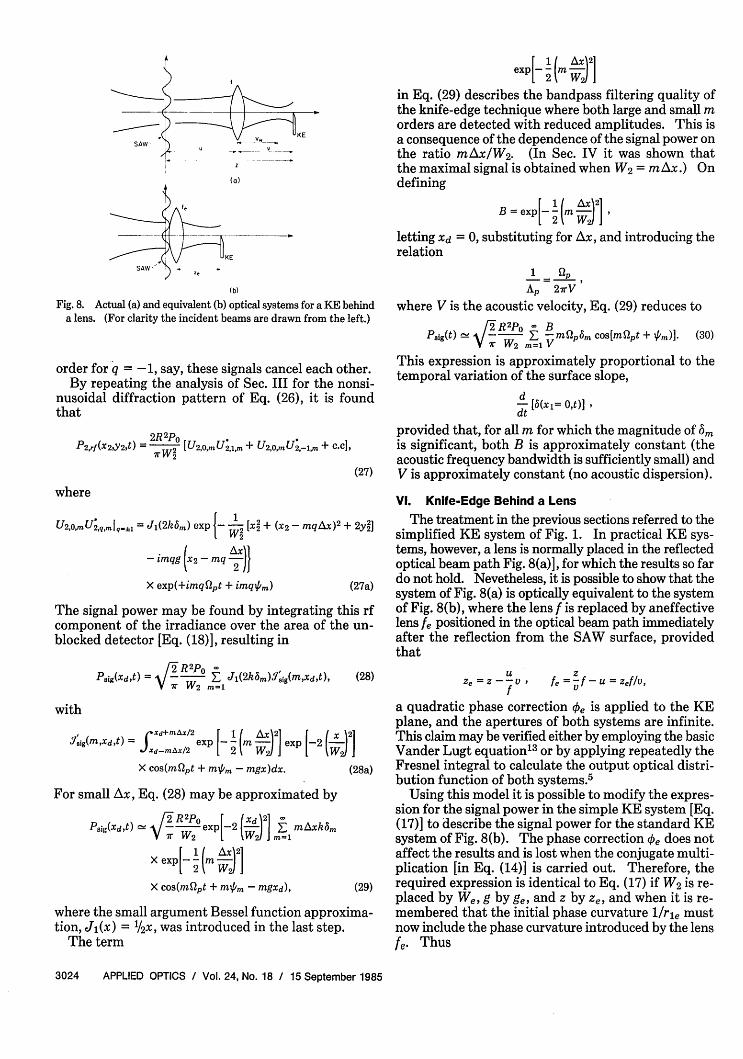
Fig. 8. Actual (a) and equivalent (b) optical systems for a KE behinda lens. (For clarity the incident beams are drawn from the left.)
order for q = -1, say, these signals cancel each other.By repeating the analysis of Sec. III for the nonsi-
nusoidal diffraction pattern of Eq. (26), it is foundthat
P2,,f(X2,Y2,t) = 2R2Po [U2,0,mU;,ir + U2,0,U2,1.m + c.c],
(27)
where
U2,0,mU2,q,mq..l = Jl(2kb3m) exp {- j [x2 + (x2 - mqAx) 2 + 2y2]
- imqg 2 - q Avx]
X exp(+imqQpt + imq6m) (27a)
The signal power may be found by integrating this rfcomponent of the irradiance over the area of the un-blocked detector [Eq. (18)], resulting in
Psig(Xdt) = 4 22 E J(2k6m)Y7'ig(mXdt), (28)
with
f rxd+mAx/2 - 1 21 Ix\21.7/sg(m,xd,t) = J. x x/2 1 (ml exp 1-2 lwJ
Xd-mAx/2 [2 WJ[W JX cos(mfpt + mV/m - mgx)dx. (28a)
For small Ax, Eq. (28) may be approximated by
Psig(Xd,t) / 2 poexp[ 2 (Xd)2] ] mAxkEm
X exp[- !( x2[2 WS
X cos(mipt + m/m - mgxd), (29)
where the small argument Bessel function approxima-tion, J1 (x) = 1/2x, was introduced in the last step.
The term
[! (m Ax2]
in Eq. (29) describes the bandpass filtering quality ofthe knife-edge technique where both large and small morders are detected with reduced amplitudes. This isa consequence of the dependence of the signal power onthe ratio mAx/W2. (In Sec. IV it was shown thatthe maximal signal is obtained when W2 = mAx.) Ondefining
[2 i WS letting Xd = 0, substituting for Ax, and introducing therelation
1 -up
AP 2rV
where V is the acoustic velocity, Eq. (29) reduces to/_2R2po B
Psig(t) -W j L -mQp3 cos[mQpt + 'm)]. (30)ir W 2 M=1V
This expression is approximately proportional to thetemporal variation of the surface slope,
dt [6(x1= O't)],dt
provided that, for all m for which the magnitude of bmis significant, both B is approximately constant (theacoustic frequency bandwidth is sufficiently small) andV is approximately constant (no acoustic dispersion).
VI. Knife-Edge Behind a Lens
The treatment in the previous sections referred to thesimplified KE system of Fig. 1. In practical KE sys-tems, however, a lens is normally placed in the reflectedoptical beam path Fig. 8(a)], for which the results so fardo not hold. Nevetheless, it is possible to show that thesystem of Fig. 8(a) is optically equivalent to the systemof Fig. 8(b), where the lens f is replaced by aneffectivelens fe positioned in the optical beam path immediatelyafter the reflection from the SAW surface, providedthat
uZe = Z - - V
fZ
fe= jf L ZJV'
a quadratic phase correction e is applied to the KEplane, and the apertures of both systems are infinite.This claim may be verified either by employing the basicVander Lugt equation1 3 or by applying repeatedly theFresnel integral to calculate the output optical distri-bution function of both systems.5
Using this model it is possible to modify the expres-sion for the signal power in the simple KE system [Eq.(17)] to describe the signal power for the standard KEsystem of Fig. 8(b). The phase correction qe does notaffect the results and is lost when the conjugate multi-plication [in Eq. (14)] is carried out. Therefore, therequired expression is identical to Eq. (17) if W 2 is re-placed by We, g by ge, and z by Ze, and when it is re-membered that the initial phase curvature 1/r1e mustnow include the phase curvature introduced by the lensfe. Thus
3024 APPLIED OPTICS / Vol. 24, No. 18 / 15 September 1985
Psig(Xdt) f1 Jo J R 2PO exp [ I (AWe)2
Xd+tXe/2 X2W
Xd-Ax/2 dxexp-2 ( e2X cos(Qt + - gex),
XXe = Ze,
A
We = W1 A/ e +4Z 2e
te = 1 + ZeIrle,
Z = (rW )/,
(31) ef
CH.2t(31a)
(31b)
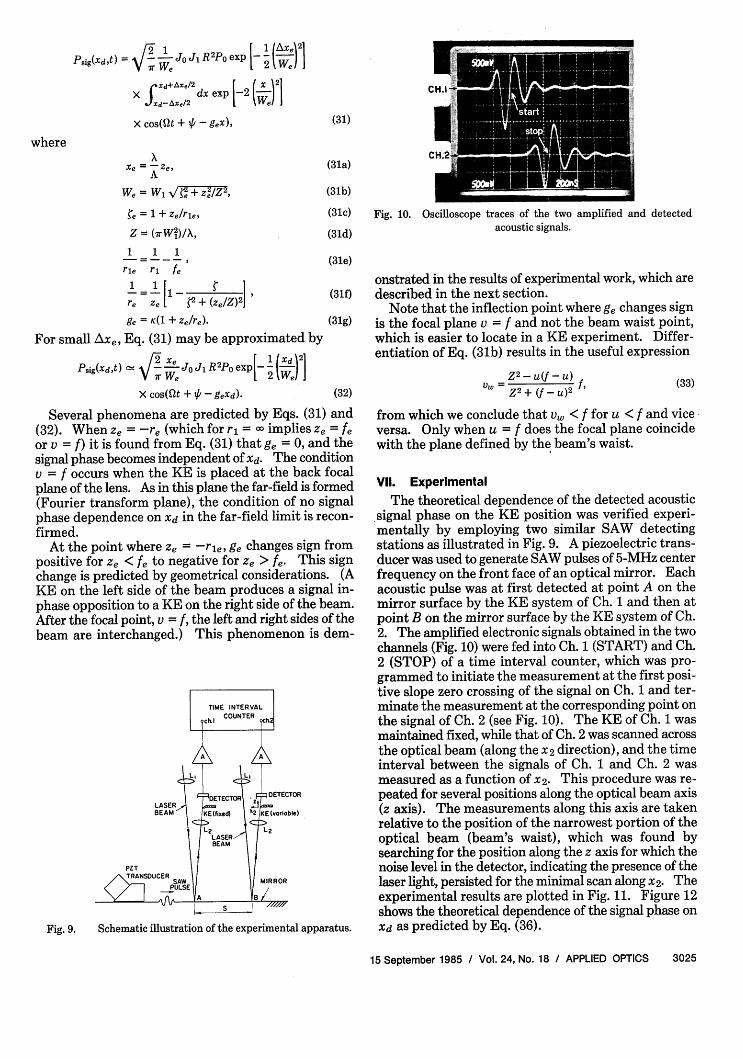
(31c) Fig. 10. Oscilloscope
(31d)
traces of the two amplified and detectedacoustic signals.
1 1 1-=--X (31e)
rle ri fe
reZe [1 + (ze/z)2I (31f)ge = K(1 + Ze/re). (31g)
For small Axe, Eq. (31) may be approximated by
Psig(Xd,t) \ O jJo J RPo exp 2 1W )I
X cos(Ot + 4 - geXd). (32)
Several phenomena are predicted by Eqs. (31) and(32). When Ze = -re (which for r, = implies Ze = fe
or v = f) it is found from Eq. (31) that ge = 0, and thesignal phase becomes independent of Xd. The conditionv = f occurs when the KE is placed at the back focalplane of the lens. As in this plane the far-field is formed(Fourier transform plane), the condition of no signalphase dependence on xd in the far-field limit is recon-firmed.
At the point where Ze = -rle, ge changes sign frompositive for Ze < fe to negative for Ze > fe. This signchange is predicted by geometrical considerations. (AKE on the left side of the beam produces a signal in-phase opposition to a KE on the right side of the beam.After the focal point, v = f, the left and right sides of thebeam are interchanged.) This phenomenon is dem-
Fig. 9. Schematic illustration of the experimental apparatus.
onstrated in the results of experimental work, which aredescribed in the next section.
Note that the inflection point where ge changes signis the focal plane v = f and not the beam waist point,which is easier to locate in a KE experiment. Differ-entiation of Eq. (31b) results in the useful expression
Z2 -U(V f U)Z 2 + (f - U)2 (33)
from which we conclude that v. < f for u < f and viceversa. Only when u = f does the focal plane coincidewith the plane defined by the beam's waist.
Vl. ExperimentalThe theoretical dependence of the detected acoustic
signal phase on the KE position was verified experi-mentally by employing two similar SAW detectingstations as illustrated in Fig. 9. A piezoelectric trans-ducer was used to generate SAW pulses of 5-MHz centerfrequency on the front face of an optical mirror. Eachacoustic pulse was at first detected at point A on themirror surface by the KE system of Ch. 1 and then atpoint B on the mirror surface by the KE system of Ch.2. The amplified electronic signals obtained in the twochannels (Fig. 10) were fed into Ch. 1 (START) and Ch.2 (STOP) of a time interval counter, which was pro-grammed to initiate the measurement at the first posi-tive slope zero crossing of the signal on Ch. 1 and ter-minate the measurement at the corresponding point onthe signal of Ch. 2 (see Fig. 10). The KE of Ch. 1 wasmaintained fixed, while that of Ch. 2 was scanned acrossthe optical beam (along the x 2 direction), and the timeinterval between the signals of Ch. 1 and Ch. 2 wasmeasured as a function of x2 . This procedure was re-peated for several positions along the optical beam axis(z axis). The measurements along this axis are takenrelative to the position of the narrowest portion of theoptical beam (beam's waist), which was found bysearching for the position along the z axis for which thenoise level in the detector, indicating the presence of thelaser light, persisted for the minimal scan along x2. Theexperimental results are plotted in Fig. 11. Figure 12shows the theoretical dependence of the signal phase onxd as predicted by Eq. (36).
15 September 1985 / Vol. 24, No. 18 / APPLIED OPTICS 3025
where
-03-02
04 , 0 30 2
X 01
-01
Z -04
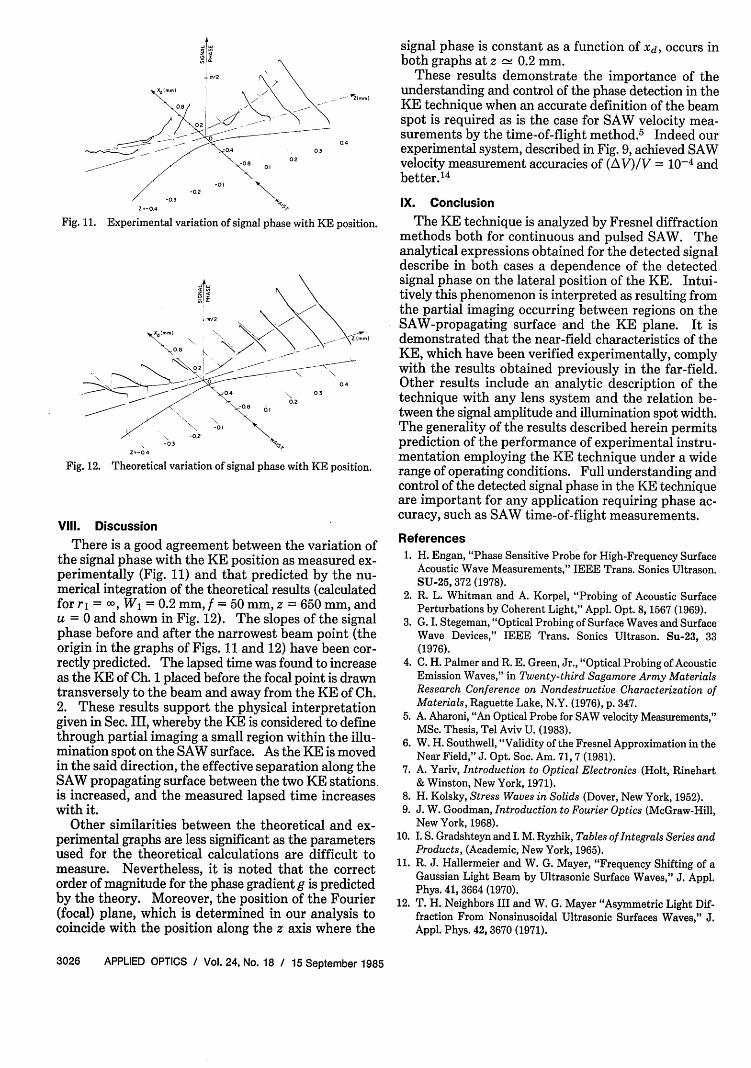
Fig. 11. Experimental variation of signal phase with KE position.
./2
02
0 ~~~~~~~~~~040.2
-08
-0.2
-03
Z.-04
Fig. 12. Theoretical variation of signal phase with KE position.
Vill. Discussion
There is a good agreement between the variation ofthe signal phase with the KE position as measured ex-perimentally (Fig. 11) and that predicted by the nu-merical integration of the theoretical results (calculatedfor r = , W1 = 0.2 mm, f = 50 mm, z = 650 mm, andu = 0 and shown in Fig. 12). The slopes of the signalphase before and after the narrowest beam point (theorigin in the graphs of Figs. 11 and 12) have been cor-rectly predicted. The lapsed time was found to increaseas the KE of Ch. 1 placed before the focal point is drawntransversely to the beam and away from the KE of Ch.2. These results support the physical interpretationgiven in Sec. III, whereby the KE is considered to definethrough partial imaging a small region within the illu-mination spot on the SAW surface. As the KE is movedin the said direction, the effective separation along theSAW propagating surface between the two KE stationsis increased, and the measured lapsed time increaseswith it.
Other similarities between the theoretical and ex-perimental graphs are less significant as the parametersused for the theoretical calculations are difficult tomeasure. Nevertheless, it is noted that the correctorder of magnitude for the phase gradient g is predictedby the theory. Moreover, the position of the Fourier(focal) plane, which is determined in our analysis tocoincide with the position along the z axis where the
signal phase is constant as a function of Xd, occurs inboth graphs at z 0.2 mm.
These results demonstrate the importance of theunderstanding and control of the phase detection in theKE technique when an accurate definition of the beamspot is required as is the case for SAW velocity mea-surements by the time-of-flight method.5 Indeed ourexperimental system, described in Fig. 9, achieved SAWvelocity measurement accuracies of (A V)/V = 10-4 andbetter. 1 4
IX. Conclusion
The KE technique is analyzed by Fresnel diffractionmethods both for continuous and pulsed SAW. Theanalytical expressions obtained for the detected signaldescribe in both cases a dependence of the detectedsignal phase on the lateral position of the KE. Intui-tively this phenomenon is interpreted as resulting fromthe partial imaging occurring between regions on theSAW-propagating surface and the KE plane. It isdemonstrated that the near-field characteristics of theKE, which have been verified experimentally, complywith the results obtained previously in the far-field.Other results include an analytic description of thetechnique with any lens system and the relation be-tween the signal amplitude and illumination spot width.The generality of the results described herein permitsprediction of the performance of experimental instru-mentation employing the KE technique under a widerange of operating conditions. Full understanding andcontrol of the detected signal phase in the KE techniqueare important for any application requiring phase ac-curacy, such as SAW time-of-flight measurements.
References1. H. Engan, "Phase Sensitive Probe for High-Frequency Surface
Acoustic Wave Measurements," IEEE Trans. Sonics Ultrason.SU-25, 372 (1978).
2. R. L. Whitman and A. Korpel, "Probing of Acoustic SurfacePerturbations by Coherent Light," Appl. Opt. 8, 1567 (1969).
3. G. I. Stegeman, "Optical Probing of Surface Waves and SurfaceWave Devices," IEEE Trans. Sonics Ultrason. Su-23, 33(1976).
4. C. H. Palmer and R. E. Green, Jr., "Optical Probing of AcousticEmission Waves," in Twenty-third Sagamore Army MaterialsResearch Conference on Nondestructive Characterization ofMaterials, Raguette Lake, N.Y. (1976), p. 347.
5. A. Aharoni, "An Optical Probe for SAW velocity Measurements,"MSc. Thesis, Tel Aviv U. (1983).
6. W. H. Southwell, "Validity of the Fresnel Approximation in theNear Field," J. Opt. Soc. Am. 71, 7 (1981).
7. A. Yariv, Introduction to Optical Electronics (Holt, Rinehart& Winston, New York, 1971).
8. H. Kolsky, Stress Waves in Solids (Dover, New York, 1952).9. J. W. Goodman, Introduction to Fourier Optics (McGraw-Hill,
New York, 1968).10. I. S. Gradshteyn and I. M. Ryzhik, Tables of Integrals Series and
Products, (Academic, New York, 1965).11. R. J. Hallermeier and W. G. Mayer, "Frequency Shifting of a
Gaussian Light Beam by Ultrasonic Surface Waves," J. Appl.Phys. 41, 3664 (1970).
12. T. H. Neighbors III and W. G. Mayer "Asymmetric Light Dif-fraction From Nonsinusoidal Ultrasonic Surfaces Waves," J.Appl. Phys. 42, 3670 (1971).
3026 APPLIED OPTICS / Vol. 24, No. 18 / 15 September 1985
13. A. VanderLugt, "Operational Notation for the Analysis and
Synthesis of Optical Data-Processing Systems," Proc. IEEE 54,1055 (1966).
14. A. Aharoni and K. M. Jassby, "Monitoring Surface Properties
of Solids by Laser based SAW Time of Flight Measurements,"
accepted for publication, IEEE Trans. Sonics Ultrason. (June1985).
0c
rA0CL
2
I-z
(A
zM
(3
z
20U
O °
-JLU
0C-
0
INTERNATIONAL
SYMPOSIUM ON
OPTO - ELECTRONICIMAGING
DECEMBER 2-5, 1985
GoIn
I-
L.
8
0
Sponsored by:Defence Research and
Development Establishment,INDIA
Organised by:Instruments Research E
Development Establishment,Dehra Dun, INDIA
15 September 1985 / Vol. 24, No. 18 / APPLIED OPTICS 3027
0
1_�