Embed Size (px)
Citation preview
ISSN 1063-7737, Astronomy Letters, 2008, Vol. 34, No. 5, pp. 353–356. c© Pleiades Publishing, Inc., 2008.Original Russian Text c© I.A. Maslov, A.E. Nadzhip, V.I. Shenavrin, 2008, published in Pis’ma v Astronomicheskiı Zhurnal, 2008, Vol. 34, No. 5, pp. 387–391.
Near-Infrared Observations of Comet C/2004 Q2 (Machholz)
I. A. Maslov1, 2*, A. E. Nadzhip1, and V. I. Shenavrin1
1Sternberg Astronomical Institute, Universitetskii pr. 13, Moscow, 119992 Russia2Space Research Institute, Russian Academy of Sciences, Profsoyuznaya ul. 84/32, Moscow, 117997 Russia
Received June 6, 2007
Abstract—Our observations of Comet C/2004 Q2 (Machholz) in the range from 1.2 to 4.8 µm indicatethat the material outflowed from the cometary surface in the form of fragments that separated into gas anddust under sublimation on time scales of the order of days. The albedo of these fragments in the range understudy was wavelength independent, while the dust was heated by the Sun to an equilibrium temperature ata cross section Qλ inversely proportional to the wavelength.
PACS numbers : 96.25.-fDOI: 10.1134/S1063773708050083
Key words: Solar system, comet, dust, infrared radiation.
OBSERVATIONS
From December 2004 through April 2005, weperformed photometric observations of CometC/2004 Q2 (Machholz) in five standard near-infraredbands (J , H , K, L, M ) with the 1.25-m telescope atthe Crimean Laboratory of the Sternberg Astronom-ical Institute. The observations were performed witha chopping InSb photometer (Nadzhip et al. 1986),which measured the flux difference between two skyfields 12′′ in diameter spaced 20′′–40′′ apart in rightascension. Bright stars with measured infrared fluxeswere used for calibration.
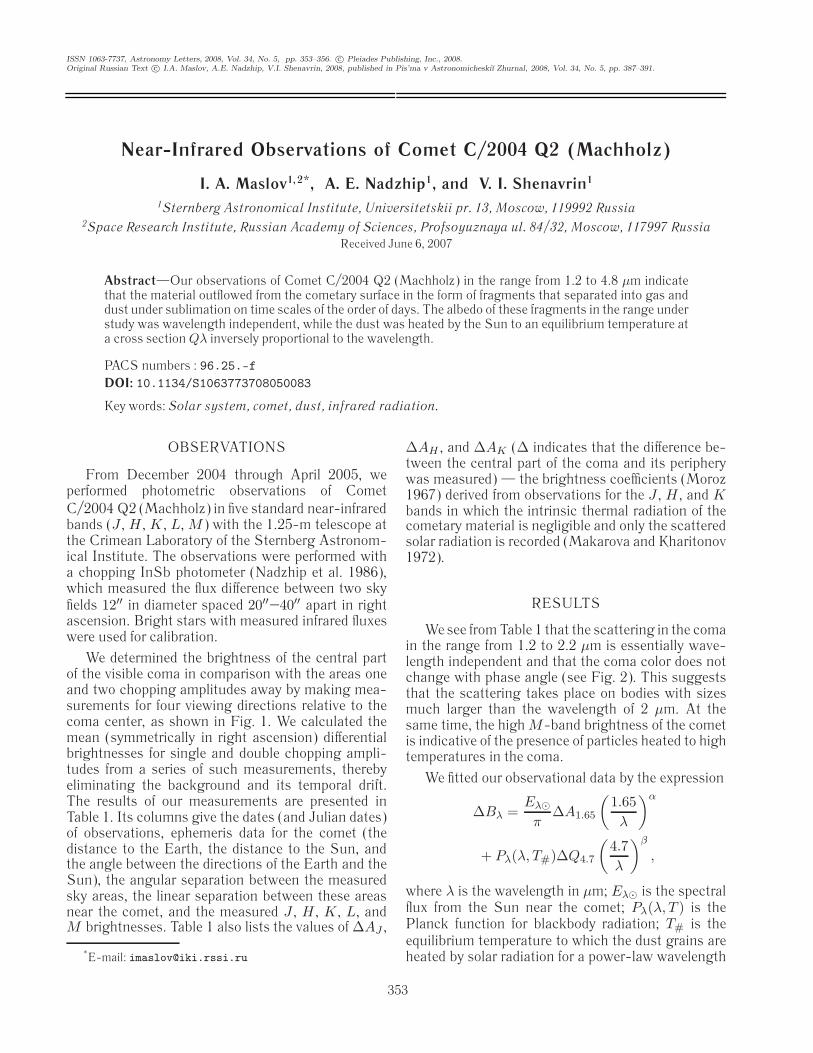
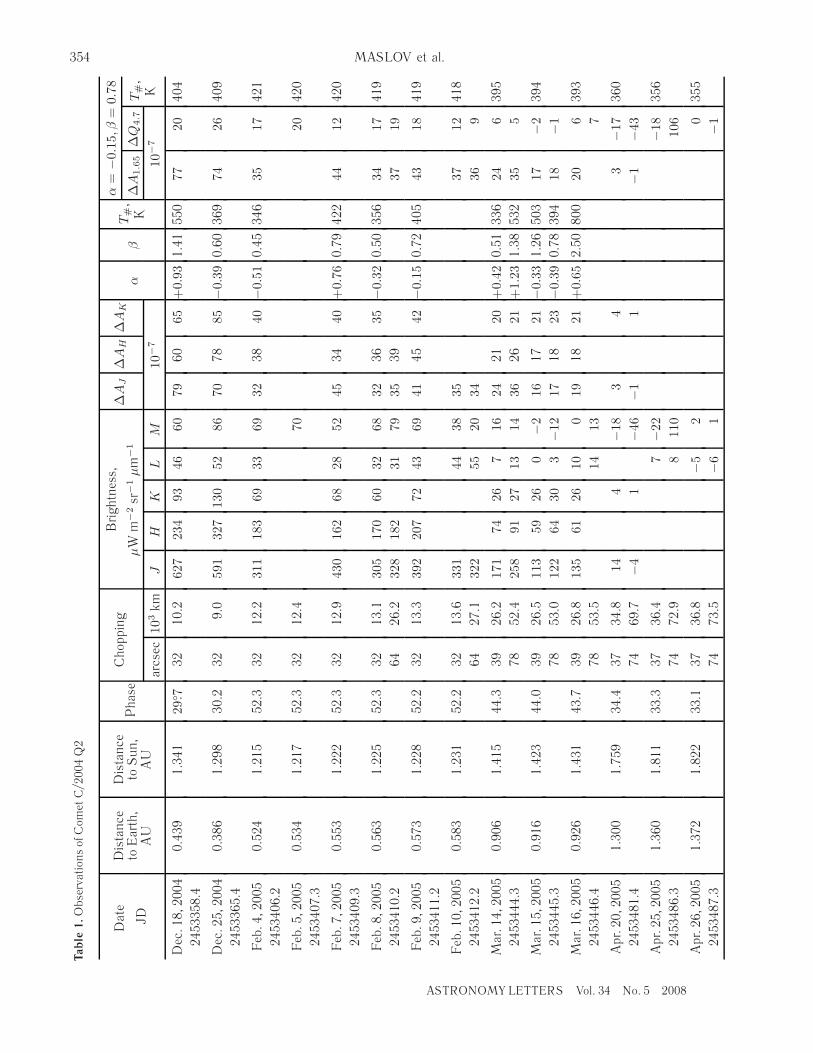
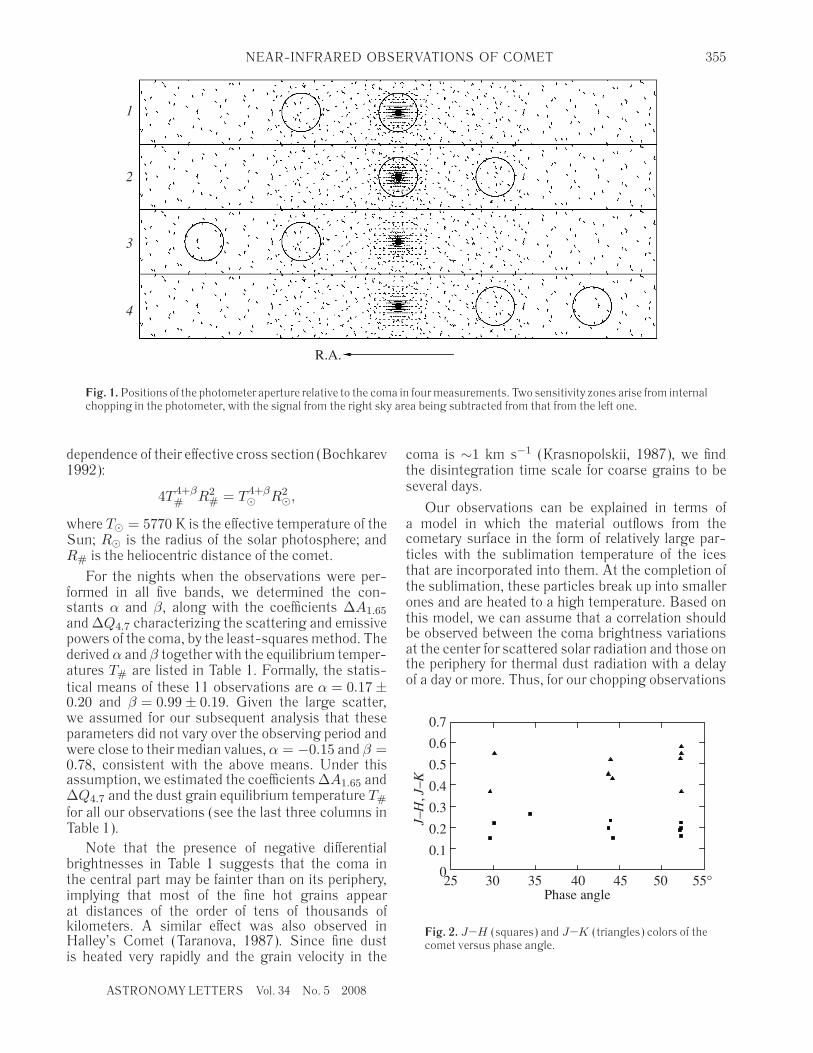
We determined the brightness of the central partof the visible coma in comparison with the areas oneand two chopping amplitudes away by making mea-surements for four viewing directions relative to thecoma center, as shown in Fig. 1. We calculated themean (symmetrically in right ascension) differentialbrightnesses for single and double chopping ampli-tudes from a series of such measurements, therebyeliminating the background and its temporal drift.The results of our measurements are presented inTable 1. Its columns give the dates (and Julian dates)of observations, ephemeris data for the comet (thedistance to the Earth, the distance to the Sun, andthe angle between the directions of the Earth and theSun), the angular separation between the measuredsky areas, the linear separation between these areasnear the comet, and the measured J , H , K, L, andM brightnesses. Table 1 also lists the values of ∆AJ ,
*E-mail: [email protected]
∆AH , and ∆AK (∆ indicates that the difference be-tween the central part of the coma and its peripherywas measured) — the brightness coefficients (Moroz1967) derived from observations for the J , H , and Kbands in which the intrinsic thermal radiation of thecometary material is negligible and only the scatteredsolar radiation is recorded (Makarova and Kharitonov1972).
RESULTS
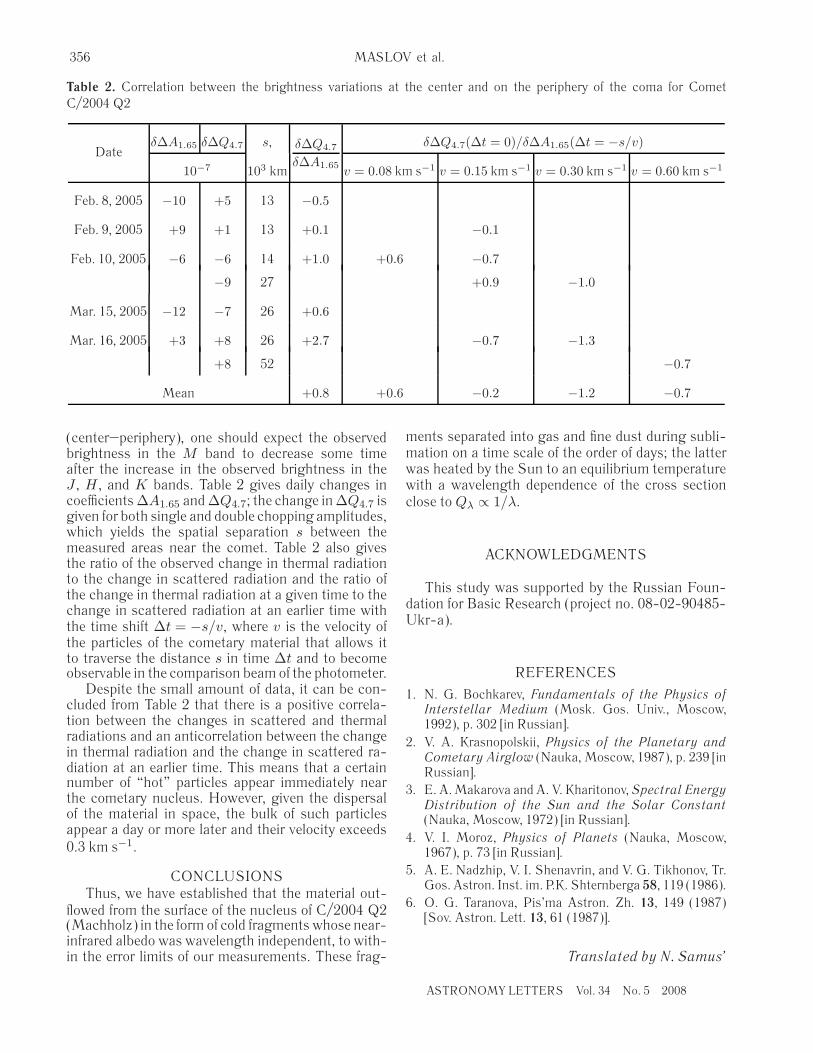
We see from Table 1 that the scattering in the comain the range from 1.2 to 2.2 µm is essentially wave-length independent and that the coma color does notchange with phase angle (see Fig. 2). This suggeststhat the scattering takes place on bodies with sizesmuch larger than the wavelength of 2 µm. At thesame time, the high M-band brightness of the cometis indicative of the presence of particles heated to hightemperatures in the coma.
We fitted our observational data by the expression
∆Bλ =Eλ�π
∆A1.65
(1.65λ
)α
+ Pλ(λ, T#)∆Q4.7
(4.7λ
)β
,
where λ is the wavelength in µm; Eλ� is the spectralflux from the Sun near the comet; Pλ(λ, T ) is thePlanck function for blackbody radiation; T# is theequilibrium temperature to which the dust grains areheated by solar radiation for a power-law wavelength
353
354 MASLOV et al.
Tabl
e1.
Obs
erva
tion
sof
Com
etC
/200
4Q
2
Dat
eD
ista
nce
toE
arth
,A
U
Dis
tanc
eto
Sun
,A
UP
hase
Cho
ppin
gB
righ
tnes
s,∆
AJ
∆A
H∆
AK
T#
,K
α=
−0.
15,β
=0.
78
JDµ
Wm
−2
sr−
1µ
m−
1α
β∆
A1.6
5∆
Q4.7
T#
,K
arcs
ec10
3km
JH
KL
M10
−7
10−
7
Dec
.18,
2004
0.43
91.
341
29◦ .7
3210
.262
723
493
4660
7960
65+
0.93
1.41
550
7720
404
2453
358.
4
Dec
.25,
2004
0.38
61.
298
30.2
329.
059
132
713
052
8670
7885
−0.
390.
6036
974
2640
924
5336
5.4
Feb
.4,2
005
0.52
41.
215
52.3
3212
.231
118
369
3369
3238
40−
0.51
0.45
346
3517
421
2453
406.
2
Feb
.5,2
005
0.53
41.
217
52.3
3212
.470
2042
024
5340
7.3
Feb
.7,2
005
0.55
31.
222
52.3
3212
.943
016
268
2852
4534
40+
0.76
0.79
422
4412
420
2453
409.
3
Feb
.8,2
005
0.56
31.
225
52.3
3213
.130
517
060
3268
3236
35−
0.32
0.50
356
3417
419
2453
410.
264
26.2
328
182
3179
3539
3719
Feb
.9,2
005
0.57
31.
228
52.2
3213
.339
220
772
4369
4145
42−
0.15
0.72
405
4318
419
2453
411.
2
Feb
.10,
2005
0.58
31.
231
52.2
3213
.633
144
3835
3712
418
2453
412.
264
27.1
322
5520
3436
9
Mar
.14,
2005
0.90
61.
415
44.3
3926
.217
174
267
1624
2120
+0.
420.
5133
624
639
524
5344
4.3
7852
.425
891
2713
1436
2621
+1.
231.
3853
235
5
Mar
.15,
2005
0.91
61.
423
44.0
3926
.511
359
260
−2
1617
21−
0.33
1.26
503
17−
239
424
5344
5.3
7853
.012
264
303
−12
1718
23−
0.39
0.78
394
18−
1
Mar
.16,
2005
0.92
61.
431
43.7
3926
.813
561
2610
019
1821
+0.
652.
5080
020
639
324
5344
6.4
7853
.514
137
Apr
.20,
2005
1.30
01.
759
34.4
3734
.814
4−
183
43
−17
360
2453
481.
474
69.7
−4
1−
46−
11
−1
−43
Apr
.25,
2005
1.36
01.
811
33.3
3736
.47
−22
−18
356
2453
486.
374
72.9
811
010
6
Apr
.26,
2005
1.37
21.
822
33.1
3736
.8−
52
035
524
5348
7.3
7473
.5−
61
−1
ASTRONOMY LETTERS Vol. 34 No. 5 2008
NEAR-INFRARED OBSERVATIONS OF COMET 355
1
2
3
4
R.A.
Fig. 1. Positions of the photometer aperture relative to the coma in four measurements. Two sensitivity zones arise from internalchopping in the photometer, with the signal from the right sky area being subtracted from that from the left one.
dependence of their effective cross section (Bochkarev1992):
4T 4+β# R2
# = T 4+β� R2
�,
where T� = 5770 K is the effective temperature of theSun; R� is the radius of the solar photosphere; andR# is the heliocentric distance of the comet.
For the nights when the observations were per-formed in all five bands, we determined the con-stants α and β, along with the coefficients ∆A1.65
and ∆Q4.7 characterizing the scattering and emissivepowers of the coma, by the least-squares method. Thederived α and β together with the equilibrium temper-atures T# are listed in Table 1. Formally, the statis-tical means of these 11 observations are α = 0.17 ±0.20 and β = 0.99 ± 0.19. Given the large scatter,we assumed for our subsequent analysis that theseparameters did not vary over the observing period andwere close to their median values, α = −0.15 and β =0.78, consistent with the above means. Under thisassumption, we estimated the coefficients ∆A1.65 and∆Q4.7 and the dust grain equilibrium temperature T#
for all our observations (see the last three columns inTable 1).
Note that the presence of negative differentialbrightnesses in Table 1 suggests that the coma inthe central part may be fainter than on its periphery,implying that most of the fine hot grains appearat distances of the order of tens of thousands ofkilometers. A similar effect was also observed inHalley’s Comet (Taranova, 1987). Since fine dustis heated very rapidly and the grain velocity in the
coma is ∼1 km s−1 (Krasnopolskii, 1987), we findthe disintegration time scale for coarse grains to beseveral days.
Our observations can be explained in terms ofa model in which the material outflows from thecometary surface in the form of relatively large par-ticles with the sublimation temperature of the icesthat are incorporated into them. At the completion ofthe sublimation, these particles break up into smallerones and are heated to a high temperature. Based onthis model, we can assume that a correlation shouldbe observed between the coma brightness variationsat the center for scattered solar radiation and those onthe periphery for thermal dust radiation with a delayof a day or more. Thus, for our chopping observations
0.7
0.6
0.5
0.4
0.3
0.2
0.1
025 30 35 40 45 50 55°
Phase angle
J
–
H
,
J
–
K
Fig. 2. J–H (squares) and J–K (triangles) colors of thecomet versus phase angle.
ASTRONOMY LETTERS Vol. 34 No. 5 2008
356 MASLOV et al.
Table 2. Correlation between the brightness variations at the center and on the periphery of the coma for CometC/2004 Q2
Dateδ∆A1.65 δ∆Q4.7 s, δ∆Q4.7
δ∆A1.65
δ∆Q4.7(∆t = 0)/δ∆A1.65(∆t = −s/v)
10−7 103 km v = 0.08 km s−1 v = 0.15 km s−1 v = 0.30 km s−1 v = 0.60 km s−1
Feb. 8, 2005 −10 +5 13 −0.5
Feb. 9, 2005 +9 +1 13 +0.1 −0.1
Feb. 10, 2005 −6 −6 14 +1.0 +0.6 −0.7
−9 27 +0.9 −1.0
Mar. 15, 2005 −12 −7 26 +0.6
Mar. 16, 2005 +3 +8 26 +2.7 −0.7 −1.3
+8 52 −0.7
Mean +0.8 +0.6 −0.2 −1.2 −0.7
(center–periphery), one should expect the observedbrightness in the M band to decrease some timeafter the increase in the observed brightness in theJ , H , and K bands. Table 2 gives daily changes incoefficients ∆A1.65 and ∆Q4.7; the change in ∆Q4.7 isgiven for both single and double chopping amplitudes,which yields the spatial separation s between themeasured areas near the comet. Table 2 also givesthe ratio of the observed change in thermal radiationto the change in scattered radiation and the ratio ofthe change in thermal radiation at a given time to thechange in scattered radiation at an earlier time withthe time shift ∆t = −s/v, where v is the velocity ofthe particles of the cometary material that allows itto traverse the distance s in time ∆t and to becomeobservable in the comparison beam of the photometer.
Despite the small amount of data, it can be con-cluded from Table 2 that there is a positive correla-tion between the changes in scattered and thermalradiations and an anticorrelation between the changein thermal radiation and the change in scattered ra-diation at an earlier time. This means that a certainnumber of “hot” particles appear immediately nearthe cometary nucleus. However, given the dispersalof the material in space, the bulk of such particlesappear a day or more later and their velocity exceeds0.3 km s−1.
CONCLUSIONSThus, we have established that the material out-
flowed from the surface of the nucleus of C/2004 Q2(Machholz) in the form of cold fragments whose near-infrared albedo was wavelength independent, to with-in the error limits of our measurements. These frag-
ments separated into gas and fine dust during subli-mation on a time scale of the order of days; the latterwas heated by the Sun to an equilibrium temperaturewith a wavelength dependence of the cross sectionclose to Qλ ∝ 1/λ.
ACKNOWLEDGMENTS
This study was supported by the Russian Foun-dation for Basic Research (project no. 08-02-90485-Ukr-a).
REFERENCES
1. N. G. Bochkarev, Fundamentals of the Physics ofInterstellar Medium (Mosk. Gos. Univ., Moscow,1992), p. 302 [in Russian].
2. V. A. Krasnopolskii, Physics of the Planetary andCometary Airglow (Nauka, Moscow, 1987), p. 239 [inRussian].
3. E. A. Makarova and A. V. Kharitonov, Spectral EnergyDistribution of the Sun and the Solar Constant(Nauka, Moscow, 1972) [in Russian].
4. V. I. Moroz, Physics of Planets (Nauka, Moscow,1967), p. 73 [in Russian].
5. A. E. Nadzhip, V. I. Shenavrin, and V. G. Tikhonov, Tr.Gos. Astron. Inst. im. P.K. Shternberga 58, 119 (1986).
6. O. G. Taranova, Pis’ma Astron. Zh. 13, 149 (1987)[Sov. Astron. Lett. 13, 61 (1987)].
Translated by N. Samus’
ASTRONOMY LETTERS Vol. 34 No. 5 2008