Embed Size (px)
Citation preview

Near Infrared spectroscopy,
a quality control tool for the different steps in the manufacture of
herbal medicinal products
by
Magali Laasonen
née Grata
Division of Pharmacognosy
Department of Pharmacy
Faculty of Science
University of Helsinki
ACADEMIC DISSERTATION
To be presented with the permission of the Faculty of Science of the University of
Helsinki, for public criticism in Auditorium 1041 of Biocenter Viikki,
on May 10th, 2003, at 10 o�clock.
HELSINKI 2003

Supervised byProf. Heikki Vuorela, Ph.D.Division of PharmacognosyDepartment of PharmacyUniversity of HelsinkiFinland
Dr. Tuulikki Harmia�PulkkinenPharmia Oy,TuusulaFinland
Reviewed by:Prof. Jouko Korppi�TommolaProfessor of Physical ChemistryDepartment of ChemistryUniversity of JyväskyläFinland
Dr. Jukka Rantanen Department of PharmacyPharmaceutical Technology DivisionUniversity of HelsinkiFinland
Opponent:Prof. Rudolph BauerInstitut für Pharmakognosie Karl-Franzens-UniversitätGrazAustria
© Magali Laasonen 2003ISBN 952-10-1027-4 (printed version)ISSN 1239-9469ISBN 952-10-1028-2 (pdf)http://ethesis.helsinki.fi/
Front cover: Echinacea purpurea and second derivative near infrared spectra of batchesof this herb. The Echinacea purpurea illustration is reproduced with the permission of theauthor Tristan Berlund, CA, USA (Tristan Berlund © 1999).
Gummerus Kirjapaino OySaarijärvi 2003

À Marko,
À mon grand-père Jacques

ABSTRACT
Near infrared (NIR) spectroscopy is an analytical tool that is still not fully integrated into
the pharmaceutical industrial environment. However, its advantages are potentially of
considerable benefit for the quality control of herbal medicinal products.
Four methods were developed to demonstrate the ability of NIR spectroscopy as a
quality control method in the different steps of the manufacturing process of herbal
medicinal products. Qualitative and quantitative methods were established to control the
quality of herbal and packaging raw material at reception, and to quantify the active
content in the final dosage form. NIR methods showed several clear benefits, such as
speed, low analysis costs and environmental friendliness compared to traditional
analytical tools. The information obtained from NIR analysis is, however, different to that
provided by separative methods such as high�performance liquid chromatography
(HPLC). Qualitative NIR techniques can only confirm whether the sample is of required
quality or not, and for quantitative measurements NIR intensities have to be calibrated for
the sample�s properties and do not give any information about any other property. The
most labor�intensive part of the NIR analysis is method development. The results of NIR
analysis are obtained in less than one minute for a single sample. In contrast, HPLC
analysis is time�consuming but very specific, and provides detailed results about the
presence or concentration of identity markers.
The use of chemometric tools and the study of factors affecting the spectra during
feasibility studies are highly informative. They were used to optimise the calibration set,
the regression model and the sample presentation mode, and were found to be critical
steps in the development of specific and robust NIR models.
Pharmaceutical guidelines that are currently in force or in preparation were used
and compared for the validation of the four NIR methods studied. The validation results
proved that the NIR methods were as reliable as the reference analysis methods.
NIR spectroscopy is therefore a very suitable analytical tool for the quality control
of herbal medicinal products.

I
TABLE OF CONTENTS
TABLE OF CONTENTS .................................................................................................. I
ACKNOWLEDGEMENTS ........................................................................................... III
LIST OF ORIGINAL PUBLICATIONS........................................................................V
ABBREVIATIONS......................................................................................................... VI
1. INTRODUCTION..........................................................................................................1
2. REVIEW OF THE LITERATURE .............................................................................2
2.1. HERBAL DRUGS, HERBAL DRUG PREPARATIONS AND HERBAL
MEDICINAL PRODUCTS ...........................................................................................2
2.1.1. Definitions .............................................................................................................2
2.1.2. Regulations applicable to herbal medicinal products ..........................................3
2.1.3. Process manufacturing and distribution...............................................................4
2.2. QUALITY CONTROL OF HERBAL MEDICINAL PRODUCTS ............................7
2.2.1. Quality control tests during the manufacturing of herbal medicinal products.....7
2.2.2. Traditional quality control tools ...........................................................................9
2.3. NEAR INFRARED (NIR) SPECTROSCOPY...........................................................10
2.3.1 Historical and physicochemical basis..................................................................10
2.3.2. NIR spectrophotometers......................................................................................13
2.3.3. Advantages and disadvantages of Fourier Transform spectrometric techniques
compared to traditional analytical methods .................................................................17
2.3.4. Use of chemometrics ...........................................................................................20
2.3.5. Applications of NIR spectroscopy in pharmaceutical technologies and in herbal
medicinal products ........................................................................................................25
2.3.6. Regulatory requirements for the use of NIR spectroscopy in pharmaceutical
industries .......................................................................................................................27
3. AIMS OF THE STUDY.............................................................................................30
4. EXPERIMENTAL.....................................................................................................31
4.1. MATERIAL................................................................................................................31
4.1.1. Plant material......................................................................................................31
II
4.1.2. Plastic raw material ............................................................................................31
4.1.3. Finished herbal medicinal product .....................................................................32
4.1.4. Computer programs ............................................................................................32
4.2. METHODS .................................................................................................................33
4.2.1. High Performance Liquid Chromatography.......................................................33
4.2.2. Characterization of the herbal drugs..................................................................34
4.2.3. NIR reflectance spectroscopy..............................................................................34
4.3. DATA ANALYSIS.....................................................................................................35
4.3.1. Second�derivative spectra ..................................................................................35
4.3.2. Hierarchical analysis ..........................................................................................35
4.3.3. Principal component analysis (PCA)..................................................................35
4.3.4. Pre�treatment options.........................................................................................36
4.3.5. Partial Least square (PLS) algorithm.................................................................36
5. RESULTS AND DISCUSSION ................................................................................38
5.1. NEW APPLICATIONS OF NIR SPECTROSCOPY.................................................38
5.2. WHAT ARE THE BENEFITS OF USING CHEMOMETRIC ANALYSIS DURING
FEASIBILITY STUDIES? ................................................................................................38
5.3. FACTORS AFFECTING THE ROBUSTNESS OF NIR ANALYSIS METHODS .41
5.4. COMPARISON BETWEEN NIR ANALYSIS AND HPLC OUTPUTS..................45
5.5. VALIDATION OF NIR METHODS .........................................................................47
5.5.1. Validation of qualitative NIR methods................................................................47
5.5.2. Validation of quantitative NIR methods..............................................................48
6. CONCLUSIONS ........................................................................................................53
7. REFERENCES...........................................................................................................55

III
ACKNOWLEDGEMENTS
The present work was carried out mainly at the Division of Pharmacognosy, Department
of Pharmacy, University of Helsinki, and partly at the Division of Pharmaceutical
Technology, Department of Pharmacy, and at the Department of Applied Chemistry and
Microbiology, University of Helsinki. The study was performed during the years 2000�
2003.
Several persons have directly or indirectly participated in my work. I would like to thank
them all, with special thanks to the following persons.
My academic supervisor, Professor Heikki Vuorela was a great support for me, with his
inspiration for new ideas, and fruitful encouragement during my years of study. I
particularly enjoyed our scientific and �non�scientific� discussions.
My industrial supervisor Tuulikki Harmia�Pulkkinen and her husband Kari Pulkkinen
from Pharmia Oy, who gave me the idea of starting a Ph.D. thesis. They provided me
with the NIR spectrometer used during this study and financial support during all these
years. I thank them, most of all, for their constant encouragement and their irreplaceable
friendship.
Professor Raimo Hiltunen, Head of the Pharmacognosy Division and Head of the
Department of Pharmacy, accepted me as a PhD student and provided me with excellent
facilities for my work.
My co�authors, Erik Michiels, Prof. Markku Räsänen, and Christine Simard gave me
precious expert spectroscopic advice and reviewed the articles before publication.
Professor Jouko Korppi�Tommola and Docent Jukka Rantanen have reviewed this
manuscript and helped me to improve the quality and clarity of the text. The latter is also
IV
especially thanked for introducing me to PCA analysis during the method development
for the identification of blistering films.
Dr. Niina Laihanen from Pharmia Oy and her assistant Maria Lindblad were of great
assistance during the production of laboratory�made caffeine tablets.
My colleague, Tero Wennberg M.Sc. (Pharm.) was of considerable help in the method
development of the HPLC analysis of Echinacea.
My colleagues and friends from Pharmia Oy and the Division of Pharmacognosy
provided me with help and encouragement whenever they were needed. They were more
than helpful.
Last, but not least, my husband Marko had this kind of unbreakable enthusiasm during all
these years and has tried his best to help me during this study. He even helped me to scan
samples during a busy weekend �Merci!
The financial support from the Finnish Pharmaceutical Society is gratefully
acknowledged.
Helsinki, April 2003

V
LIST OF ORIGINAL PUBLICATIONS
This dissertation is based on the following publications referred to in the text by their
Roman numeral (I�V). Some unpublished results were also included.
I Laasonen M., Rantanen J., Harmia�Pulkkinen T., Michiels E., Hiltunen R.,
Räsänen M. and Vuorela H. Near infrared reflectance spectroscopy for the fast
identification of PVC�based films, Analyst, 2001, 126: 1122�1128.
II Laasonen M., Wennberg T., Harmia�Pulkkinen T., and Vuorela H. Simultaneous
analysis of alkamides and caffeic acid derivatives for the identification of Echinacea
purpurea, Echinacea angustifolia, Echinacea pallida and Parthenium integrifolium roots.
Planta Med., 2002, 68: 568�572.
III Laasonen M., Harmia�Pulkkinen T., Simard C. L., Michiels E., Räsänen M. and
Vuorela H. Fast identification of Echinacea purpurea dried roots using near�infrared
spectroscopy, Anal. Chem., 2002, 74: 2493�2499.
IV Laasonen M., Harmia�Pulkkinen T., Simard C. L., Räsänen M. and Vuorela H.
Development and validation of a NIR method for the quantitation of caffeine in intact
single tablets. Anal. Chem., 2003, 75: 754�760.
V Laasonen M., Harmia�Pulkkinen T., Simard C. L., Räsänen M. and Vuorela H.
Determination of the thickness of plastic sheets used in blister packaging by near infrared
spectroscopy: development and validation of the method. Analyst, Submitted, December
2002.

VI
ABBREVIATIONS
EMEA European agency for the evaluation of medicinal products
ESCOP European scientific cooperative on phytotherapy
FT�NIR Fourier transform near infrared
FTS Fourier transform spectroscopy
GC gas chromatography
GMP good manufacturing practice
HMP herbal medicinal products
HMPWP herbal medicinal products working party
HPLC high performance liquid chromatography
LED light�emitting diode
LOQ limit of quantification
MSC multiplicative signal correction
NIR near infrared
OPD optical path difference
PC principal component
PCA principal components analysis
PLS partial least square
RP reversed phase
RSD residual standard deviation
SEP standard error of prediction
S/N signal�to�noise
SNV standard normal variate
ZPD zero path difference
1
1. INTRODUCTION
It was more than time�Slowly, but surely, the NIR (near infrared) spectroscopy,
previously called the �sleeping technique� (WETZEL 1983), is being accepted by the
pharmaceutical industry. Official instances such as the American Pharmacopea and the
European Pharmacopea have recently adopted monographs describing this technique
(USP 1998, EUROPEAN PHARMACOPOEIA 1997). A draft for the validation of NIR
methods is being processed at the European Pharmacopea1, and the number of NIR
pharmaceutical applications has not stopped increasing since the beginning of the 90´s.
It was about time, because NIR spectroscopy was an analytical tool already widely
used in the agricultural and food industries in the beginning of the 70´s (BLANCO et al.
1998). The main obstacle to the integration of this technique into the pharmaceutical
world has been the regulations governing the introduction of new techniques in quality
control laboratories. In contrast, the agricultural industries are not subjected to such strict
regulations. Thanks to the regulatory framework that is now being created around the
technique, the pharmaceutical industries will soon be able to fully enjoy the several
benefits of NIR - speed, flexibility and low running costs.
Herbal medicinal products (HMPs) represent a considerable part of the
pharmaceutical market in the world: Europeans are believed to spend more than seven
billion US dollars on herbal supplements, and the US market is estimated to grow at
about 15% per year (GLASER 1999). In the domain of herbal medicines, a large part of
the costs are attributed to quality testing. The wet chemical, spectroscopic and
chromatographic methods that are commonly used as quality control tools (SETTLE
1997) are time� and solvent�consuming. The use of NIR was recently investigated for
controlling e.g. the origin of the drug and quantifying its active or marker substances
(WOO et al. 2002, RAGER et al. 2002). It proved to be a very reliable tool compared to
traditional methods of analysis. NIR could be more widely used to monitor the complete
manufacturing process of the herbal product, i.e. from authentication of the plants to the
1 This draft was adopted in February 2003 (EMEA 2003) after the thesis was written.

2
quantification of active compounds in the final dosage form. However, the task still
remains to develop methods that fulfil pharmaceutical regulations for HMPs.
2. REVIEW OF THE LITERATURE
2.1. Herbal drugs, herbal drug preparations and herbal medicinal products
2.1.1. Definitions
Herbal medicinal products are medicinal products containing as active substance
exclusively herbal drugs or herbal drug preparations (EMEA 2001a, EUROPEAN
PHARMACOPEIA 2002).
Herbal drugs are mainly whole, fragmented or cut, plants, parts of plants, algae,
fungi or lichens in an unprocessed sate, usually in the dried form but sometimes fresh.
Certain exudates may also be considered as herbal drugs.
Herbal drug preparations are obtained when herbal drugs are subjected to treatment
such as extraction, distillation, expression, fractionation, purification, concentration or
fermentation. They include comminuted or powdered herbal drugs, tinctures, extracts,
essential oils, expressed juices and processed exudates (EUROPEAN PHARMACOPEIA
2002). In Europe, herbal drugs are described by monographs from the European
Pharmacopea created in 1964 (ARTIGES 1998). They describe general methods of
analysis and the appropriate method of storage. In Germany, �Commission E�
monographs� have been published by the health authorities since the beginning of the
80´s and describe more than 380 medicinal plants (BLUMENTHAL 1998). A third
source of monographs is the European Scientific Cooperative on Phytotherapy, ESCOP,
which publishes monographs on individual plant drugs. These monographs highlight the
clinical and pharmacological properties of the plants in order to represent a statement on
efficacy and safety of a medicinal plant and its preparations (STEINHOFF 1998). Finally,
the world Health Organisation (WHO) has also published useful monographs supporting
the demonstration of safety and efficacy of herbal medicinal products (EMEA 1999,
WHO 1999).

3
2.1.2. Regulations applicable to herbal medicinal products
During the last few years, European regulations concerning herbal medicinal products
have been submitted to various modifications, and it is worth mentioning the latest issues.
Herbal medicinal products (HMP) are, above all, medicines and therefore fall within the
scope of the recent European Economic Community Council directive 2001/83/EC
concerning medicinal products for human use, adopted in November 2001 (COUNCIL
AND EUROPEAN PARLIAMENT 2001). Directive 2001/83/EC prescribes that no
medicinal product may be placed on the market without having obtained a marketing
authorisation. Marketing authorisation as a herbal medicinal product is, in principle,
granted on the basis of a �full� dossier in terms of proof of quality, safety and efficacy in
all Member States, with the exception of Denmark and Finland. In these countries it is
only possible to use bibliographic applications for herbal medicinal products (AESPG
1999). In Finland, the National Agency of Medicines has defined herbal medicinal
products as products traditionally used for medicinal purposes. These products can be
derived from plants, animals, bacteria or minerals, and can contain herbal drugs or herbal
drug preparations, but not single purified substances (NAM 2002). In the United States,
herbal products are mostly registered as dietary supplements since the Food and Drug
Administration does not accept bibliographic evidence of effectiveness, but prefers
randomized controlled trials as evidence of efficacy (WHO 1998).
The legal framework concerning medicines, and especially directive 2001/83/EC, is
well applicable to certain herbal medicinal products (COMMISSION OF THE
EUROPEAN COMMUNITIES 2002), but is not as suitable for the so�called
�traditional� herbal medicinal products. These are herbal medicinal products that have
been in use for a long period in the European Community in the form of oral, external
and/or inhalation preparations, and are designed for use without the intervention of a
medical practitioner and in accordance with specified daily doses (EUROPEAN
PARLIAMENT 2002). The efficiency and safety of these traditional medicinal products
are plausible on the basis of long�term use. For these products, applying for a �full�
4
marketing authorisation would be irrelevant and too expensive for the pharmaceutical
industries. Therefore, in order to simplify the legislation for the traditional HMP, the
Commission adopted in January 2002 a proposal for a new directive amending directive
2001/83/EC with respect to traditional herbal medicinal products (COMMISSION OF
THE EUROPEAN COMMUNITIES 2002). The European Parliament gave a partial
agreement to a modified draft in November 2002. This new directive provides a
simplified procedure for the registration, and hence marketing, of certain traditional
herbal medicinal products. In other words, for the registration of a traditional HMP, it
will no longer be necessary to submit a file containing experimental evidence of the
pharmacodynamic, pharmacokinetic and toxicological aspects or clinical evidence
proving their therapeutic effects and tolerability in man. However, documentation will
have to be submitted providing evidence of quality, efficacy and safety on the basis of
experience gained from at least 30 years� traditional use (EUROPEAN PARLIAMENT
2002).
The group of herbal products that is not considered as herbal medicinal products
does not have to conform the legislation concerning medicines. These products
(BARNES 2002) can be sold as food supplements, as long as no medical claim is made,
and their control is in accordance with the food legislation (COUNCIL AND
EUROPEAN PARLIAMENT 1989). They are therefore outside the scope of this
dissertation.
2.1.3. Process manufacturing and distribution
Because HMP are medicinal products, their production must follow the Good
Manufacturing Practice (GMP), the principles and guidelines of which are laid down in
the European directive 91/356/EEC (COMMISSION DIRECTIVE 1991). A detailed
guideline for the manufacture of medicinal products in accordance with these principles
was also published recently (RULES GOVERNING MEDICINAL PRODUCTS IN THE
EUROPEAN UNION 1998). Moreover, good agricultural and collection practice (EMEA
2002) should be followed in the handling of starting material of herbal origin. This

5
document is a recent guideline based on a document proposed by the European Herb
Growers Association (EUROPAM). It addresses the specific concerns of growing,
collecting and primary processing of medicinal plants or herbal drugs. HMP manufacture
has different features depending on whether the active substance is in the form of a herbal
drug or herbal drug preparation. The basic steps in the most frequently used
manufacturing processes for capsule, tablet and liquid dosage forms are described in
Figure 1.
Figure 1 Basic steps in some of the most widely used manufacturing processes forherbal medicinal products. Manufacturing processes are depicted only for capsule,tablet and liquid forms.

6
Herbal drugs are obtained from cultivated or wild plants, and are produced by the
following operations: cultivation, harvesting, drying, fragmentation and storage
(EUROPEAN PHARMACOPEIA 2002). These operations must follow the guideline on
the manufacture of herbal medicinal products (RULES GOVERNING MEDICINAL
PRODUCTS IN THE EUROPEAN UNION 1998).
For the production of herbal drug preparations, herbal drugs are subjected to
treatments such as extraction, distillation, expression, fractionation, purification,
concentration or fermentation (EUROPEAN PHARMACOPEIA 2002). They can be in
liquid form (e.g., extracts, tinctures, and essential oils) or in powder form. Powdered
herbal drug preparations may be supplied in bulk form or as a sachet, e.g. for herbal teas,
prepared extemporaneously by the patient. They consist of one or more herbal drugs
prepared by means of infusion, decoction or maceration (EUROPEAN
PHARMACOPEIA 2002). Infusions are prepared by pouring boiling water over the dried
herbal drugs, in chopped form and, after being allowed to draw for 5�10 minutes, strained
(BISSET 1994). Decoctions are prepared by pouring cold water on the drug placed in a
saucepan, bringing it to the boil, simmering for about twenty minutes, and then sieving
the suspension (CHEVALLIER 1996). Maceration consists of pouring water onto the
herb and leaving it to stand overnight (CHEVALLIER 1996). HMPs are prepared with
herbal drugs or herbal drug preparation as active substances. Excipients are added to give
the finished product, as for any other medicinal product. The finished products are
usually in solid (i.e. tablet or capsule), liquid (i.e. oral solutions, drops), or semisolid (i.e.
gel, unguent or cream) forms. The dosage form of the 84 HMPs marketed in Finland
(NAM 2002) are shown in Figure 2. In Finland, HMPs are also called semi�medicinal
products because they are marketed with a simplified marketing authorisation based on
bibliographical application.
The retail sale of herbal medicinal products is usually restricted to pharmacies in
Belgium, France, Greece, Ireland, Italy, Luxembourg, Portugal and Spain, but it is also
permitted in other outlets � at least for certain HMPs � in Austria, Denmark, Finland,
Germany, the Netherlands, Sweden and the United Kingdom (AESPG 1999). In Finland,
44 % of the HMPs are sold only in pharmacies, the other 56% being distributed in
pharmacies and in general food stores (NAM 2002).

7
Figure 2 Distribution of the dosage forms of the 84 herbal medicinal productsmarketed in Finland.
2.2 Quality control of herbal medicinal products
2.2.1. Quality control tests during the manufacturing of herbal medicinal products
In May 1997, a Working Party on herbal medicinal products (HMPWP) was formed at
the EMEA to prepare guidance for the mutual recognition in marketing authorisations for
herbal medicinal products (EMEA 1999). These guidelines concern regulations, quality,
efficacy and safety of the herbal products, and were prepared because there were
assessment differences on these topics in the individual European Union countries. So
far, two guidelines under the topic of �Quality� have been adopted (EMEA 2001a and
2001b). They aim at providing a uniform set of specifications for herbal drugs and HMPs
to support marketing authorisations. The specifications consist of a list of tests and
acceptance criteria designed to verify the suitability of the herbal drug preparation or the
herbal medicinal product for its intended use (EMEA 2001a). They define the product
quality and are therefore useful in ensuring the safety and efficacy of HMPs. The general
monographs Herbal drug and Herbal drug preparation should be used to interpret the
specification requirements (EUROPEAN PHARMACOPOEIA 2002).
Specifications applied to herbal drugs usually include (EMEA 2001a): definition,
characterization, identification, tests and assay. Identification testing should consist of
0
5
10
15
20
25
30
35
Tabl
ets
Har
d or
soft
caps
ules
Dro
ps
Ora
lso
lutio
ns
Nas
alsp
rays
Ora
lpo
wde
rs
gels
/oi
ntm
ents
Her
bal
teas
Num
ber
of H
erba
l Med
icin
es
mar
kete
d in
Fin
land

8
three or more of the following tests: macroscopic characters, microscopic characters,
chromatographic procedures and chemical reactions. Tests include foreign matter,
particle size, water content, inorganic impurities and toxic metals, microbial limits,
mycotoxins, pesticides and fumigation agents. Content assays are applied in the case
where the constituents with therapeutic activity are known, otherwise an assay of marker
substances is required.
Specifications applied to herbal drug preparations include (EMEA 2001a):
definition, characterization, identification, tests and assay. Identification testing should be
specific and discriminatory with respect to substitutes or adulterants that are likely to
occur. A combination of chromatographic tests is recommended for this purpose. The
tests include residual solvents, water content, inorganic impurities and toxic metals,
microbial limits, mycotoxins, pesticides and fumigation agents. Content assays are
required for known constituents with therapeutic activity, as well as herbal drug content
assays when possible.
The specifications applied to herbal medicinal products include (EMEA 2001a):
description of dosage form, identification, assays (the same as for herbal drug
preparation), impurities, microbial limits and specific tests. Specific tests depend on the
dosage form. For tablets and hard capsules, dissolution/disintegration, hardness/friability,
uniformity of dosage units, water content and microbial limit tests should be performed.
For oral liquid: uniformity of dosage units, pH, microbial limits, antimicrobial
preservative content, antioxidant preservative content, alcohol content, dissolution,
particle size distribution, redispersibility, reconstitution time and water content should be
performed among others.
The specifications are, nevertheless, only a part of the global quality scheme to be
applied to HMPs. The overall quality control procedure should also include control of the
raw materials and excipients, in�process testing, process evaluation and validation,
stability testing and testing of batch consistency (EMEA 2001a). Analytical procedures
not described in a Pharmacopea should be validated according to the ICH guidelines in
order to prove that they are suitable for their intended purpose. The two ICH guidelines
are a worldwide basis for both the regulatory authorities and industry (ERMER 2001).
They are called �Validation of analytical methods: Definitions and terminology� (EMEA

9
1994) and �Validation of analytical procedures: Methodology� (EMEA 1996). They
prescribe that identification tests should be validated with respect to their specificity, and
that assays should be validated with respect to their accuracy, precision, specificity,
linearity and range.
2.2.2. Traditional quality control tools
The quality control of bulk herbal drugs and finished products is mainly performed in the
quality control laboratory with conventional spectroscopic, chromatographic, titrimetric,
or other wet chemical analytical methods. However, these procedures are time�
consuming and expensive because they require the use of environmentally unfriendly
chemicals and personnel with a relatively high level of training. A sample preparation
step is frequently required before performing the analysis of the herbs. Recent sample�
preparation techniques for the extraction, clean up, and concentration of analytes from
herbal materials include solid�phase microextraction, supercritical�fluid extraction,
pressurised�liquid extraction, microwave�assisted extraction, solid�phase extraction, and
surfactant�mediated extraction (HUIE 2002). The most widely applied sample�
preparation techniques are nevertheless selective solvent extraction, filtration and
precipitation (HOSTETTMANN et al. 1998, SNYDER et al. 1997).
The usual qualitative analysis techniques are infrared spectroscopy (IR),
ultraviolet/visible (UV/VIS) absorption spectrometry, thin layer chromatography (TLC),
and microscopic identification. The most common tools for quantitative analyses are high
performance liquid chromatography (HPLC) for a wide variety of compounds, and gas
chromatography for volatile organic compounds (SETTLE 1997). HPLC is one of the
most widely used analytical tools for qualitative and quantitative measurements. It is also
used for the isolation of pure natural compounds from an extract (HOSTETTMAN et al.
1998). An HPLC chromatograph consists of the following devices: solvent reservoir,
high�pressure pump, packed column, detector and recorder. The most widely used
detectors are UV detectors. The two main modes of HPLC analysis are liquid�solid and
liquid�liquid chromatography. They are also called adsorption (normal phase) and
partition (reverse phase) modes, respectively. The reverse phase HPLC separates

10
compounds according to their hydrophobicity, and is widely used for all types of
biomolecules.
2.3. Near infrared (NIR) spectroscopy
2.3.1 Historical and physicochemical basis
The principles of NIR spectroscopy are linked to the development of Fourier Transform
spectroscopy (FTS) as early as in the middle of the 19th century. In 1862, Fizeau
constructed the first variable path interferometer for wavelength measurement and it is
considered to be the ancestor of the actual Fourier interferometers (CONNES 1984).
Michelson used this idea to develop his two�beam interferometer (MICHELSON 1890,
1891a, 1891b). Michelson, however, never realised the greatest potentiality of his
technique and faced several limitations. For example, the only detector that Michelson
used was his own eye (CONNES 1984). Therefore he was not able to record precisely the
fringe intensity. Moreover, he did not realise that multiplexing could be used to measure
all frequencies simultaneously, and had no concern about the energy throughput
advantage. Multiplexing, a technique also used in telephone engineering to send a large
number of messages simultaneously, was first applied to the interferometric device in the
middle 50´s by Fellgett during his doctoral studies (FELLGETT 1984). He was also the
first to derive a spectrum from the interferogram by using Fourier transformation. At
approximately the same time, Jacquinot discovered the throughput advantage
(JACQUINOT 1984). FTS was seldom used until the advent of computer technology that
allowed rapid and economical Fourier transformation of an interferogram into a
spectrum. A major step in the acceptance of this technique by industry was the
development of an algorithm by Cooley and Tukey in 1965 that significantly increased
the speed of the Fourier transformation computation and led to Fast Fourier Transform
equipment (PERKINS 1986). Since then, the number of practical applications of the
FTIR and FT�NIR spectroscopy has increased dramatically (BLANCO et al. 1998).

11
The NIR region, discovered by William Herschel in 1800, is situated between the
visible and the IR region of the electromagnetic spectrum, and ranges from approximately
780 nm to 2500 nm (DAVIES 1998), corresponding to a frequency range of 4000 cm-1 to
12 800 cm-1 (EUROPEAN PHARMACOPOEIA 2002) (see Figure 3).
Figure 3 Electromagnetic spectrum and positioning of the spectral regions.
At temperatures above absolute zero, all the atoms in molecules are continuously
vibrating. Two of the major types of vibration are stretching and bending, as illustrated
for a non-linear group CH2 in Figure 4.
If the fundamental frequency of a specific vibration, ν, is equal to the frequency of the
radiation impinging on the molecules, and if the molecule undergoes a change in its
dipole moment during the vibration, then the radiation is absorbed and excites a
vibrational transition in the molecule. Molecular vibrations are often described by means
of the harmonic oscillator model. The basic assumption is that the shift of an atom is
directly proportional to the force opposing the shift. For a harmonic model, only
transitions between two consecutive vibrational energy levels are allowed. The energy
difference between the two levels is hν, where ν is the fundamental frequency. In
practice, molecular vibrations tend to follow an anharmonic model. This leads to the
appearance of additional allowed transitions with energy differences of two, three etc.,
times the fundamental frequency (BLANCO et al. 1998). These higher transitions are
called overtones and they are observed beyond the fundamental vibration region in the

12
near infrared region. In the NIR region also combination vibrations are observed. The
most common group frequencies seen in the NIR region are �OH, �CH, �NH, and �SH
overtones. Overtone and combination transitions are much less likely than the
fundamental transitions (BLANCO and VILLARROYA 2002a). This explains why the
intensities of the generally broadly overlapping NIR bands are weaker than the intensities
of the fundamental IR bands, by a factor of 10 to 1000 (MACDONALD and PREBBLE
1993).
Figure 4 Main vibrational modes of a nonlinear CH2 group. A + sign indicates amotion from the plane of the page to the reader, and a � sign indicates motion fromthe plane away from the reader. Modified from SETTLE 1997.
The weakness of absorption bands in the NIR region is the key to the main advantage of
the technique: it allows for longer path lengths (1 mm�1 cm) to be used than in the Mid�
IR region (often < 0.1 mm for liquids (SETTLE 1997)). The samples are thus often
analysed without sample pretreatment.
13
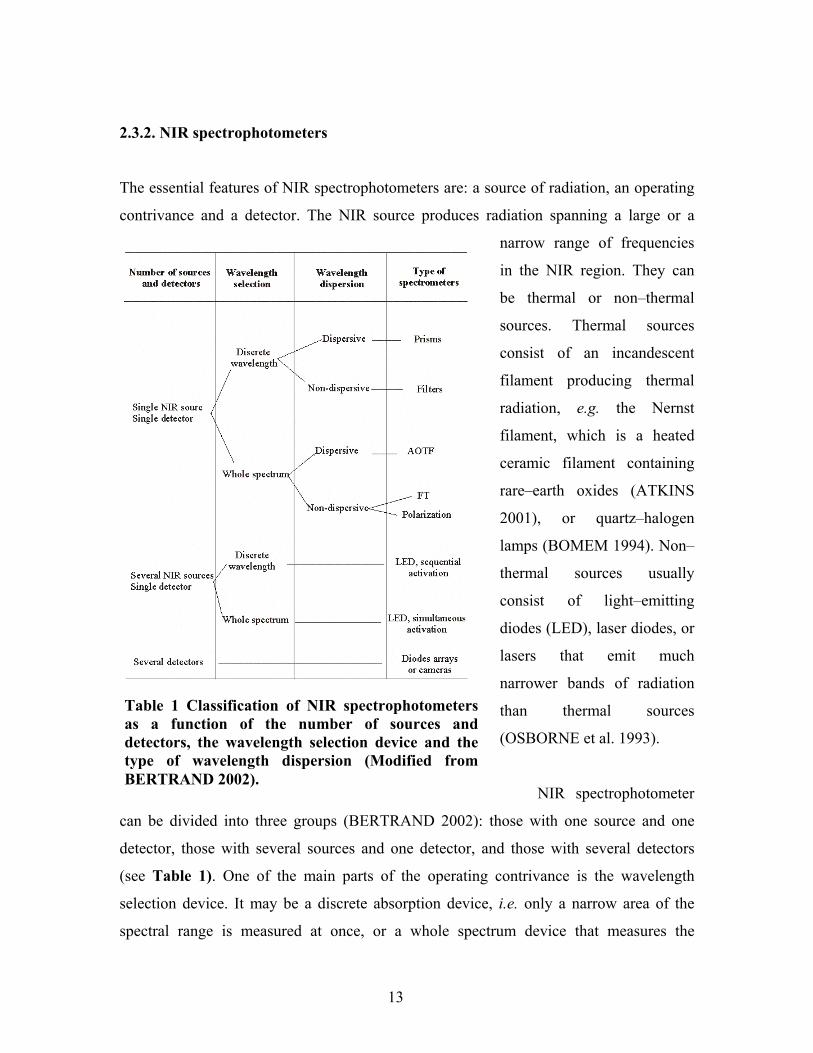
2.3.2. NIR spectrophotometers
The essential features of NIR spectrophotometers are: a source of radiation, an operating
contrivance and a detector. The NIR source produces radiation spanning a large or a
narrow range of frequencies
in the NIR region. They can
be thermal or non�thermal
sources. Thermal sources
consist of an incandescent
filament producing thermal
radiation, e.g. the Nernst
filament, which is a heated
ceramic filament containing
rare�earth oxides (ATKINS
2001), or quartz�halogen
lamps (BOMEM 1994). Non�
thermal sources usually
consist of light�emitting
diodes (LED), laser diodes, or
lasers that emit much
narrower bands of radiation
than thermal sources
(OSBORNE et al. 1993).
NIR spectrophotometer
can be divided into three groups (BERTRAND 2002): those with one source and one
detector, those with several sources and one detector, and those with several detectors
(see Table 1). One of the main parts of the operating contrivance is the wavelength
selection device. It may be a discrete absorption device, i.e. only a narrow area of the
spectral range is measured at once, or a whole spectrum device that measures the
Table 1 Classification of NIR spectrophotometersas a function of the number of sources anddetectors, the wavelength selection device and thetype of wavelength dispersion (Modified fromBERTRAND 2002).

14
information from several wavelengths simultaneously. The NIR spectrometer optical
system can be either a dispersive or non�dispersive device.
The dispersive optical systems or monochromators of single source and single
detector spectrometers separate the radiation of different frequencies into different spatial
directions. An exit slit is used to select a narrow range of wavenumbers to strike the
detector. Prisms were the simplest monochromators used in spectrometers (ATKINS
2001) and are still in use, but they give poor dispersion. They are made from glass or
quartz and utilize the variation of the refractive index as a function of the frequency as a
separating tool.
Non�dispersive optical systems based on filter devices may include up to 20 filters
on a carousel (BERTRAND 2002). This type of instrument is robust and still in use for
routine analysis.
Acousto�Optic Tunable Filters (AOTF) have been incorporated in NIR
spectrophotometers in recent years. This technique uses acousto�optic diffraction of light
in an anisotropic crystalline medium as the separation device (OSBORNE et al. 1993,
BERTRAND 1998 and BLANCO and VILLARROYA 2002a). The absence of moving
parts in AOTF ensures good wavelength stability, and provides a rugged, cost�effective
instrument with a high�signal�to�noise ratio. The resolution of AOTF instruments is
approximately 5 nm (SWEAT and WETZEL 2001).
Fourier Transformed instruments are based on interferometers that are widely used in
modern spectrometers (OSBORNE et al. 1993). The Fourier Transform technique is
based on the use of an interferometer (mostly of the Michelson -type) that is able to
detect intensities of several spectral frequencies in a composite signal. The Fourier
Transform of the recorded interferogram is the infrared spectrum. The purpose of an
interferometer (SMITH 1996 and BERTRAND 2002) is to split a beam of light into two
beams and to introduce a difference in their respective travelling distances. The optical
path difference is denoted as δ. The interferometer shown in Figure 5 consists of four
arms, one for the source, the second having a moving mirror M2, the third a fixed mirror
M1, and the last one is open. The beamsplitter is used to transmit half of the radiation
obtained from the source to the moving mirror and to reflect the other half of the

15
radiation to the fixed mirror. The beamsplitter usually consists of a very thin film of
germanium covered on both sides by a potassium bromide (KBr) substrate (PERKINS
1986). The two separated beams respectively strike M1 and M2 and are reflected back to
the beamsplitter. They are then recombined and exit the interferometer in the direction of
the sample and detector. M2 is moving longitudinally back and forth. When δ = 0, both
mirrors are equidistant from the beamsplitter. This is called the �zero path difference�
(ZPD). When the interferometer is in the position of ZPD (δ = 0) or when δ = nλ, the two
recombined beams are in phase with each other and the intensity of the detector signal
will thus be maximum.
These states are called constructive interference. Destructive interferences are obtained
when δ = (n +1/2)λ, and in these cases the resulting beam intensity is zero. Intermediate
intensities are obtained at intermediate positions of δ. The plot of the intensity versus the
optical path difference is called an interferogram. Figure 5 shows an interferogram
obtained with a monochromatic source. When the source is polychromatic (SMITH
Figure 5 Principle of a Michelson interferometer and example of an interferogramobtained from a monochromatic source (Adapted from PERKINS 1986).
16
1996), radiation of different wavelengths undergoes destructive and constructive
interference at different optical path differences. Each wavelength of light leads to an
interferogram with a specific path difference, resulting in intensity typical of their
frequency that can be measured by the detector. The signal passing through the sample is
the sum of each specific interferogram and therefore contains intensity information about
all the wavelengths contained in the band passing the sample. The interferogram, an
�intensity versus time� function, is then Fourier transformed to obtain the final NIR
spectrum, which is an �intensity versus frequency� function. FT�NIR spectrophotometers
can be obtained from several suppliers, including Bomem Inc., Bran + Luebbe, Brücker
Instrument, Büchi Labotecknik or Perkin Elmer. The newest features on FT instruments
include, for example, an imaging -system providing pictures of the samples showing the
chemical distribution at the microscopic level.
Polarization or crystal spectrometers are also �whole spectrum� techniques, but they are
not as well known as FT techniques (BERTRAND 1998). They are based, as is the case
with FT spectrometers, on the interference of two light beams travelling a slightly
different distance. A birefringent crystal is used to split the incoming beam into two
beams of different polarisation. The difference in the optical path is due to the fact that
the two beams have different refraction indices.
The group of spectrometers containing several sources includes non�thermal
optical designs, such as LED or laser diodes, and selection of the wavelength is inherent
in the narrow emitting range of the source. LED spectrometers (BERTRAND 1998)
contain several LEDs, each coupled to a narrow band optical filter. The LEDs are
activated one after the other in a sequence and, because all the measurements are focused
on the same channel, only one detector is needed. LEDs can also be activated
simultaneously and the instrument functions as a multiwavelength device (BERTRAND
2002).
The last group of spectrophotometers contains several detectors and they are called
multichannel spectrometers. The operating principle is based on diode arrays or cameras
that can measure many wavelengths simultaneously (BERTRAND 1998). This type of

17
instrument is available from Büchi Labotecknik, Perten Instruments or Multichannel
Instruments. However, single detector instruments are normally used.
Concerning detector technology, silicon�based photodetectors are recommended
for the short�wavelength infrared range (700�1000 nm or 14286�10000 cm-1). For lower
energies and longer wavelengths (1100�2500 nm or 9090�4000 cm-1), semiconductors
such as lead sulphide (PbS), indium gallium arsenide (InGaAs) or indium arsenide (InAs)
can be used as detectors (USP 2002, BOMEM 1994).
2.3.3. Advantages and disadvantages of Fourier Transform spectrometric
techniques compared to traditional analytical methods
The advantages of FT transform techniques over dispersive instruments have resulted in
almost total replacement of the dispersive instruments in spectroscopy.
The Multiplex or Fellgett Advantage: In a dispersive spectrometer, wavenumbers
are observed sequentially. In an FT�IR and FT�NIR spectrometer, all the wavenumbers
of light are observed simultaneously. Therefore, when spectra are collected under
identical conditions the signal�to�noise (S/N) ratio of the FT�IR spectrum will be greater
than that of the dispersive IR spectrum (HILL et al. 1997).
The Throughput or Jacquinot Advantage: In FT�IR instruments there is no need
to limit the beam width in order to obtain an adequate resolution. In fact, a circular
optical aperture is used in FT instruments, and the beam area is 75 to 100 times larger
than the slit area of dispersive instruments (SETTLE 1997). As a consequence, there is an
advantage of increased beam intensity going through the sample and therefore a much
higher throughput with a FT�IR than with a dispersive instrument (JACQUINOT 1984).
Wavenumber accuracy or Conne´s advantage: In FT instruments, e.g. in FT�IR
Bomem spectrometers, a wavelength accuracy of 0.04 cm-1 can be obtained (BOMEM
FT�IR REFERENCE MANUAL 2001), which is much higher than the traditional
wavelength accuracy obtained with dispersive instruments (only about 1�5 cm-1)
(SETTLE 1997). This difference is due to the fact that the frequency-stabilised helium�
neon laser is used as internal wavelength standard. Therefore the frequency precision is

18
determined by the frequency stability of the laser, which leads to precise and reproducible
wavelengths (PERKINS 1987, FROST et al. 1993).
High and constant resolution: Spectral resolution is a measure of how well a
spectrometer can distinguish closely spaced spectral features. Filter instruments cannot
offer high resolution because, in dispersive instruments, resolution decreases as lower
frequencies are scanned. In FT�IR, the resolution depends on the optical path difference
(OPD) that can be achieved. Thus it is constant across the scanning range (WILKS 1986,
PERKINS 1987).
Practical and powerful data station: FTIR or FTNIR instruments are normally
equipped with a powerful computer capable of carrying out the Fast Fourier
Transformation needed to obtain the spectrum. Additionally, the instrument computer
uses software that can perform data processing (SETTLE 1997) such as baseline
correction, smoothing, derivatisation or library searching, and therefore improve data
information.
The most attractive advantage of FT�NIR spectroscopy over traditional analytical
tools and any other spectroscopic method is probably that the measurements are non�
destructive, and non�invasive, and that it is possible to use solid samples without pre�
treatment and therefore without solvents. This leads to a large increase in the analysis
speed compared to traditional analysis methods, and decreases the risk of errors due to
weighing and dilution operations (TRAFFORD et al. 1999, HAN and FAULKNER
1996).
The variety in sampling technologies is another attractive feature of NIR
spectroscopy. Several accessories are adaptable to a number of situations, and can be
used with different scanning modes. For instance, fibre optic probes were used already
ten years ago for real�time analysis (WILLIAMS and MAC PETERS 1991) and are
nowadays often used in the diffuse reflectance mode for routine qualitative and
quantitative applications (BLANCO et al. 1999a, BLANCO et al. 2000a and 2000b).
Diffuse reflectance is also easily used for off-line analysis for samples contained in
simple glass vials (WARGO and DRENNEN 1996, FRAKE et al. 1998). The
transmittance mode is more and more widely used for recording spectra from intact

19
tablets (SCHILLING et al. 1996). It gives results with a better repeatability and a smaller
prediction error than reflectance measurements (CORTI et al. 1999, THOSAR et al.
2001). The transflectance mode, which is a variant of the diffuse reflectance mode, has
also been investigated recently. In this case, incident light crosses the sample, is reflected
by a reflectance material such as stainless steel or PTFE (Polytetrafluoroethylene) located
on the opposite side, and travels back through the sample before reaching the detector
(BLANCO and ROMERO 2002b).
An important property of the NIR signal is that, because it depends on both the
chemical composition and the physical properties of the sample, analysis of these two
characteristics can be performed by the same technique (CHEN and SØRENSEN 2000).
NIR also has the potential to be used for developing on�line methods, leading to real�
time control systems (RANTANEN et al. 2000b). This advantage can be well used in the
pharmaceutical or chemical industry to give real�time information about processes.
On the other hand, there are three main disadvantages of NIR spectroscopy over
traditional techniques. First, the development of a NIR method is time�consuming
because it is necessary to analyse several representative samples by a time�consuming
reference analysis method (HPLC or Karl Fisher titration for example). Secondly, NIR
methods lack robustness: calibrations often need to be updated, e.g. when a sample is
provided by a new supplier, or when the manufacturing process of the sample is modified
(CANDOLFI and MASSARD 2001). This is especially problematic with raw material
whose quality may vary from time to time leading to false identification of the material.
Furthermore, NIR spectroscopy is not very sensitive and it can usually be satisfactorily
applied to major components (BLANCO and VILLARROYA 2002a) but not to
impurities or low�dose substances.
Other minor disadvantages are the following: First, in contrast to IR spectra, NIR
raw spectra exhibit low specificity. They do not show clear peaks characteristic to a
specific compound of interest. Thus, extensive statistical calculations are required to
extract useful qualitative or quantitative information (LOWRY et al. 2000). Second, NIR
spectroscopy methods are developed using the reference analysis results of the calibration
samples. Thus, the accuracy of the NIR method cannot be better than the accuracy of the

20
reference method. Furthermore, the transferability of NIR methods from one instrument
to another is limited due to the frequent need for updating calibrations after routine
maintenance or repair of the instrument (WANG et al. 1998). Finally, the absence of NIR
training in pharmacy schools is one of the major obstacles to the acceptance of NIR
spectroscopy by pharmacists. The specialised vocabulary used in the chemometrics world
makes things even less accessible for pharmacists.
2.3.4. Use of chemometrics
Chemometrics is a chemical discipline that utilizes mathematics and statistics to design
optimal measurement procedures and experiments and to provide maximum relevant
chemical information by analysing chemical data (MASSART et al 1988). Traditional
applications of chemometrics often involve data pre�processing for enhancing analytical
measurements to obtain chemically or physically relevant information from the sample
(LAVINE 1998) and to reduce the irrelevant variability that arises from the effect of
instrument changes over time or physical phenomena, such as temperature, or scattering.
Of the number of existing signal�preprocessing techniques, only the most widely
used mathematical tools will be described here. In the reflectance mode, NIR spectra are
subjected to large baseline shifts introduced by the spectrometer or sample especially in
the case of solid powdered samples with a large particle size distribution, because
scattering of the light is strong (ISAKSSON and NAES 1988, CANDOLFI et al. 1999a).
Baseline effects can also be due to a number of reasons such as detector drift, changing
environmental conditions e.g. temperature and humidity, and sampling accessories. One
of the best methods for removing baseline effects is to use derivative spectra. A constant
background can be removed by transforming the original spectra into first�derivative
spectra, while the linear background can be removed by taking second�derivative spectra
(CANDOLFI et al. 1999a). The second derivative is more often used because it increases
the selectivity of interesting bands (STORDRANGE et al. 2002) and thus simplifies the
data interpretation. However, as derivation amplifies the spectral noise, it is necessary to
smooth the data before derivation (CANDOLFI et al. 1999a). The most widely used

21
differentiation method is the Savitzky and Golay algorithm (SAVITZKY and GOLAY
1964), which combines smoothing and differentiation and thus removes the noise.
The use of Standard Normal Variate (SNV) transformation leads to the removal of
the major effects of light scattering and particle size. The SNV algorithm normalises each
spectrum by dividing the difference between the transmittance and average transmittance
by the standard deviation of transmittance (CHAMINADE et al. 1998). De�trending is
also a baseline correction method. It removes offset and curves linearity, which often
occurs in the case of powdered, densely packed samples. The baseline is modelled as a
function of wavelength and subtracted from the spectrum. Normally, de�trending is
carried out in combination with SNV transformation (CANDOLFI et al. 1999a).
Multiplicative signal correction (MSC) can be used (LAVINE 1998) to resolve the
problem of a varying background due to differences in optical path length and to
compensate for different scatter and particle sizes from sample to sample. The principle is
that MSC establishes a linear regression between spectral variables and the average
spectrum. The slope and offset values of the regression spectrum are then removed from
the original spectrum in order to give a corrected spectrum (ISAKSSON and NAES 1988,
CHAMINADE et al. 1998).
Multivariate calibration remains, by far, the fastest growing area of chemometrics
(LAVINE 1998). This procedure is used to relate the analyte concentration or the
measured value of a physical or chemical property to a measured response.
PLS is now dominating the practice of multivariate calibration, because of the
quality of the calibration models produced and the ease of their implementation
(LAVINE 1998). This algorithm was developed by WOLD and MARTENS in the
beginning of the 80´s (TENENHAUS 1998, ERIKSSON et al. 2000). Industrial problems
can frequently be described on the basis of an input/output system: X are the input
variables, and Y the output variables being observed. The PLS regression is a linear
regression technique that can be used to understand and explain the relationship between
X and Y (TENENHAUS 1998).
The PLS regression principle (WOLD et al. 2001) is to find new variables to
estimate the latent or underlying X variables. The new variables are called X�scores and
22
denoted by T. The X�scores are used to model X and to predict Y (response variables).
The X�scores are orthogonal and restricted in number and are linear combinations of the
original variables X with the coefficients, or weights W. The relationship between the
matrices X, Y, T and W are shown in Equations 1�5 and in Figure 6. The explanation of
the abbreviations are as follow: X is the (N x K) matrix of the predictor variables, Y is
the (N x M) matrix of the response variables, N is the number of observations, k is the
index of the X variables, W is the X weight matrix, W* is the matrix of the X weights
transformed to be independent between components, A is the number of components in
the PLS model, C� is the transposed Y weight matrix, T is the X�score matrix (N x A), U
is the Y�score matrix (N x A), P� is the transposed loading matrix, E is the matrix of the
X residuals, and F is the matrix of the Y residuals.
The notation employs uppercases for the matrix (e.g., X), and lowercases for their
corresponding values (e.g. xa).
T = XW* (1)
X�scores, multiplied by the loadings P, are a good estimation of X providing that the
residues E are small.
X = TP� + E (2)
Y�scores, multiplied by the weights C, are a good estimation of Y providing that the
residues G are small.
Y = UC� + G (3)
The X�scores are good predictors of Y, providing that the residues F are small.
Y = TC� + F (4)
Therefore the summarising equation is in the form of a multiple regression, with XW* as
the PLS regression coefficients:
Y = XW*C� + F (5)
If the predictive power of this regression is too weak when only one component is
calculated, then a second component is calculated (TENENHAUS 1998). This iterative
procedure can be continued to calculate as many components or factors as are
predictively significant.

23
The geometric interpretation (Figure 6) of the PLS model is a projection of the K�
dimensional X matrix down on an A�dimensional plane (A<K). Each plane has a
direction corresponding to a PLS component, A. The direction of each plane is described
by its slope, pak (loadings). Each point projected on the plane is characterised by its co�
ordinates, also called scores t. The plane satisfactorily approximates X and, at the same
Figure 6 Matrix and geometric representation of a PLS model. The geometricrepresentation exemplifies the case of an X matrix projected onto a two�dimensionalplane (two-component model). Adapted from WOLD et al. 2001.
24
time, the positions of the projected data points on this plane (scores t), are related to the
responses, Y (WOLD et al. 2001).
The number of factors to be retained can be evaluated in several ways, often based
on cross�validation. The principle of cross�validation is to remove one sample or a group
of samples from the calibration set and then to calculate the model with the remaining
samples (HAALAND and THOMAS 1988, TENENHAUS 1998, WOLD et al. 2001).
The model will be different depending on which sample is removed and on the number of
factors included. The removed sample is predicted by each model that includes a
successive number of factors. The cross�validation is repeated by omitting another
sample, and so on, until each sample from the calibration set has been removed once.
Then, the differences between the actual and predicted Y values are calculated for the
deleted data. The sum of squares of these differences (Predictive Residual Sum of
Squares or PRESS) gives an estimation of the predictive ability of the model. The number
of significant PLS components is usually calculated to be the minimum number for which
the PRESS value is not significantly different from the lowest PRESS value, as described
by HAALAND and THOMAS (1988). If the number of factors (or components) is too
high, the risk of overfitting the model is increased. An overfitted model has little or no
predictive power (WOLD et al. 2001), because it includes factors that are not related to
the constituent of interest but instead to the noise.
Principal Component Regression is another widely used multivariate calibration
method, dominated by the use of a compression technique, Principal Component Analysis
(PCA). PCA also allows data visualisation by means of data dimensionality reduction,
(DASZYKOWSKI et al. 2003).
PCA is the most popular linear projection method. It projects multidimensional data
onto a few directions called principal components (PCs). PCs are a linear combination of
the original variables that describe the data variance (WOLD 1987). They explain
successively decreasing amounts of variance in the matrix X (STORDRANGE et al.
2002). Thus, the first PC is the direction that best approximates (minimised least square
error) the original data (DASZYKOWSKI et al. 2003) and explains the maximum
variance of the data. The second PC improves the approximation, and so on for the
further PCs. The number of extracted components equals the number of rows in the

25
original data matrix, but all components with small eigenvalues are considered as data
noise and are eliminated.
There are several other important chemometrics methods, such as multiple linear
regression (MLR) which is another widely used multivariate calibration method
(BLANCO et al. 1998), quantitative structure activity relationship (QSAR), pattern
recognition, multivariate process modelling (WOLD and SJÖSTRÖM 1998) or artificial
neural systems (ZURADA 1992).
2.3.5. Applications of NIR spectroscopy in pharmaceutical technologies and in
herbal medicinal products
In addition to applications in the food (IWAMOTO and KAWANO 1992, BENSON
1996, REEVES and ZAPF 1999), textile (CLEVE et al. 2000), biological (SOWA et al.
1999, SASIC and OZAKI 2001), petroleum (PARISI et al. 1990) and chemical industries
(WILLIAMS and MAC PETERS 1991), pharmaceutical technology is one of the main
application fields for NIR spectroscopy. The current applications concern a large part of
the pharmaceutical operations shown in Figure 1.
In the initial stage of pharmaceutical processes, NIR is used for the identification of
raw materials: active substances (MONFRE and BRIMMER 1996, GERHÄUSSER and
KOVAR. 1997) and excipients (SVENSSON et al. 1997, EBUBE et al. 1999, KRÄMER
and EBEL 2000, CANDOLFI et al. 1999b). The physical properties of the raw material
are also determined by near infrared spectroscopy, e.g. the particle size of drugs or
excipients (O´NEIL et al. 1998, FRAKE et al. 1998). In the following step of the
manufacturing process, the monitoring of blending processes can be performed
successfully with NIR (MACDONALD and PREBBLE 1993, SEKULIC et al. 1996,
HAILEY et al. 1996). NIR can provide real�time information about the blending, which
is often not the case with traditional analysis methods. When tablets are manufactured,
wet granulation is often the next process phase. NIR has frequently been used to monitor
the granulation process, for example, to quantify a drug during the different steps of the
granulation process (HAN et al. 1996), to measure the particle size (RANTANEN et al.
1998), or to follow the moisture content during granulation (RANTANEN et al. 2000a

26
and 2000b). After granulation, the tablets are sometimes coated. Here, as well, NIR can
be applied e.g. to monitor the film coating process (ANDERSSON 1999) and to perform
a final identification test of the active compound in the final dosage form (DEMPSTER et
al. 1995). The identification of active substances through blister packaging can also be
performed e.g. for discriminating between active tablets and placebos during clinical
trials (MACDONALD and PREBBLE 1993). One of the most important steps in tablet
quality control is the quantitative assay for the active substance. Currently, mostly other
spectroscopy methods, and chromatographic, titrimetric and wet chemical methods, are
used to analyse finished products. However, these tools are destructive for the sample,
while NIR is not. Quantitative measurements are nevertheless not the major application
for NIR spectroscopy in the pharmaceutical industry, probably because it requires more
extensive work than qualitative methods, and also because of the lack (nearly fulfilled
nowadays!) of adapted guidelines for the validation of such procedures (CIURCSAK
1998). However, a large number of publications reflect the advantages of the NIR assay
of active substances in semi�finished or finished products such as granules, cores or
tablets (HAN and FAULKNER 1996, BERTHA�SOMODI et al. 1996, TRAFFORD et
al. 1999, BLANCO 1999a, 1999b, 2000a and 2000b, RAMIREZ et al. 2001).
Quantitative measurements for the determination of moisture in finished products are also
a popular application of NIR spectroscopy (MACDONALD and PREBBLE 1993, LAST
and PREBBLE 1993). Very few papers have described the use of NIR spectroscopy to
monitor the quality of a pharmaceutical product during the different steps of its
manufacture (HAN and FAULKNER 1996, BLANCO et al. 2000a).
Concerning herbal medicinal applications, NIR spectroscopy has, during the past
few years, become a useful tool for the non�destructive analysis of plant species and
herbal products. An electronic search using the SciFinder Scholar (American Chemical
Society, version 2002) database showed that there are approximately twenty applications
in this field in the literature. In fact NIR spectroscopy has primarily been used to identify
or classify herbal drugs and herbal drug preparations, but seldom to control the quality of
herbal medicinal products. Literature applications report significant improvements in
terms of speed and flexibility of NIR analysis compared to the conventional or traditional

27
Tab
le 2
NIR
app
licat
ions
for
herb
al d
rugs
, her
bal d
rug
prep
arat
ions
and
her
bal m
edic
inal
pro
duct
s
Typ
e of
app
licat
ion
Des
crip
tion
of th
e ap
plic
atio
nL
itera
ture
NIR
Cla
ssifi
catio
n of
her
bal d
rugs
Scre
enin
g an
d au
then
ticat
ion
of C
hine
se h
erba
l dru
gs(r
efle
ctan
ce)
LI e
t al.
2001
Diff
eren
tiatio
n of
unp
repa
red
crud
e se
eds
of f
enne
lsee
d an
dhe
mlo
ck. (
refle
ctan
ce).
KU
DO
et a
l. 19
97
Aut
hent
icat
ion
of c
offe
e be
an v
arie
ty (d
iffus
e re
flect
ance
).D
OW
NEY
an
d B
OU
SSIO
N19
96N
IR C
lass
ifica
tion
of h
erba
l dru
g pr
epar
atio
nsC
lass
ifica
tion
of c
ultiv
atio
n ar
ea o
f gin
seng
(ref
lect
ance
). W
OO
et a
l. 20
02
Dis
crim
inat
ion
of A
stra
gali
Rad
ix, G
anod
erm
a, a
nd S
mila
cis
Rhi
zom
a ac
cord
ing
to g
eogr
aphi
cal o
rigin
(ref
lect
ance
).W
OO
et a
l. 19
99a
Fast
iden
tific
atio
n of
ver
y si
mila
r spe
cies
: Gin
seng
Rad
ix,
Aus
traga
li R
adix
, and
Sm
ilaci
s Rhi
zom
a (r
efle
ctan
ce)
WO
O e
t al.
1999
b
Cla
ssifi
catio
n of
oliv
e oi
ls a
s a
func
tion
of t
heir
geog
raph
ical
orig
in (t
rans
mitt
ance
).B
ERTR
AN
et a
l. 20
00
Diff
eren
tiatio
n of
ess
entia
l oils
as
a fu
nctio
n of
thei
r typ
e, s
ourc
ean
d ba
tch.
(ref
lect
ance
).W
ATT
199
9
NIR
Qua
ntifi
catio
n of
sub
stan
ces
in h
erba
l dru
gs o
rin
her
bal d
rug
prep
arat
ion
Qua
ntifi
catio
n of
hyp
erfo
rin a
nd I3
, II8
�bia
pige
nin
in S
t. Jo
hn�s
wor
t ext
ract
s (re
flect
ance
).R
AG
ER e
t al.
2002
Qua
ntita
tion
of e
chin
acos
ide
in E
chin
acea
root
s (re
flect
ance
)SC
HU
LTZ
et a
l. 20
02
Ana
lysi
s of f
ibre
con
tent
in fl
ax st
ems (
refle
ctan
ce).
BA
RTO
N e
t al.
2002
Det
erm
inat
ion
of n
ootk
aton
e an
d al
dehy
de c
onte
ntsi
n ci
trus o
ils(tr
ansf
lect
ance
)ST
EUER
et a
l. 20
01
Det
erm
inat
ion
of
glyc
yrrh
izin
in
ra
dix
Gly
cyrr
hiza
e an
dgi
nsen
osid
es in
radi
x N
otog
inse
ng (r
efle
ctan
ce).
CH
EN a
nd S
ØR
ENSE
N 2
000
Det
erm
inat
ion
of
gins
enos
ides
in
A
mer
ican
G
inse
ng(r
efle
ctan
ce).
REN
and
CH
EN 1
999
Qua
ntifi
catio
n of
alk
aloi
ds a
nd p
heno
lic s
ubst
ance
s in
tea
leav
es(d
iffus
e re
flect
ance
).SC
HU
LTZ
et a
l. 19
99
NIR
qua
ntifi
catio
n of
sub
stan
ces
in h
erba
l med
icin
alpr
oduc
tsD
eter
min
atio
n of
Sen
nosi
de c
onte
nt d
irect
ly f
rom
gra
nula
tes
(diff
use
refle
ctan
ce).
MO
LT e
t al.
1997
Qua
ntifi
catio
n of
caf
fein
e in
mill
ed t
able
tsA
LLEN
et a
l. 19
74

28
analysis of drugs (RAGER et al 2002, SCHULTZ et al. 2002). However, none of these
applications were validated according to pharmaceutical regulations. These methods can
therefore not be used as such in the pharmaceutical industries. Table 2 gives a list of
randomly selected typical literature applications concerning the NIR analysis of herbal
drugs, herbal drug preparations and herbal medicinal products, and does not attempt to be
complete.
2.3.6. Regulatory requirements for the use of NIR spectroscopy in pharmaceutical
industries
Although there are still no monographs in which the use of near infrared spectroscopy is
mandatory, the regulations concerning NIR spectroscopy are nowadays better adapted to
its practical use in the industry. The first sign of the acceptance of NIR spectroscopy was
the publication of the European Pharmacopoeia monograph on NIR (EUROPEAN
PHARMACOPOEIA 1997) describing the control of instrument performance and the
establishment of a spectral reference library for qualitative purposes. Then appeared the
revision in 1998 of the USP general chapter of Spectrophotometry and Light�scattering
(USP 1998), and the publication of a guideline for the qualification of NIR instruments
(PHARMACOPEIAL FORUM 1998).
However, the European Pharmacopoeia monograph on NIR (EUROPEAN
PHARMACOPOEIA 1997) does not give extended details on the way to develop and
validate a qualitative application or any information about the development or validation
of quantitative methods. In fact, up until now, quantitative NIR methods were validated
according to the ICH guidelines Q2A and Q2B (EMEA 1994, EMEA 1996) which,
nevertheless, address traditional method validation requirements more than NIR method
validation. The reason for this is that these guidelines were planned for separative
techniques such as high�performance liquid chromatography or gas chromatography, and
are not as suitable for non�separative procedures such as direct spectroscopic methods.
The lack of specific validation guidelines led several authors to attempt to adapt the ICH
guidelines to the purposes of their own NIR quantitative application. (PLUGGE and
VAN DER VLIES 1993, FORBES et al. 1999, TRAFFORD et al. 1999, BLANCO 2000a
29
and 2000b, MARK et al. 2001, MOFFAT et al. 2000). The Pharmaceutical Analytical
Sciences Group (PASG) even proposed its own guideline (BROAD et al. 2002). This
guideline covers the design, development and validation of NIR methods, whilst
remaining complementary to ICH Q2A and Q2B. In the meanwhile, the EMEA published
draft guideline for the use of near infrared spectroscopy in the pharmaceutical industries
(EMEA 2001c). This document aims at regulating the validation processes of qualitative
and quantitative NIR methods, and provides some recommendations about the
qualification of NIR spectrometers. The draft is under modification and will greatly
contribute to the acceptance of this technique as an analysis tool in the European
industries. After acceptance of this draft, the pharmaceutical industries will have the
regulations required to implement NIR spectroscopy as a routine analysis tool in their
laboratories.
30
3. AIMS OF THE STUDY
Near infrared spectroscopy has often been applied for herbal drugs but, paradoxically,
there are no published studies describing the application of pharmaceutical guidelines to
validate NIR methods for the quality control of herbal medicinal remedies. Thus, the
main target of this study was to demonstrate the applicability of NIR spectroscopy to
monitor the quality of herbal medicinal products according to pharmaceutical regulations.
In this context, the specific aims were:
1) To develop new quality control applications for NIR spectroscopy in the joint domain
of the pharmaceutical and the herbal drug industries.
2) To investigate the use of chemometrics tools for the optimization of NIR method
development.
3) To study the factors affecting the robustness of NIR analysis methods.
4) To compare the advantages and disadvantages of NIR spectroscopy with one of the
most widely used traditional analytical methods, high performance liquid
chromatography or HPLC.
5) To investigate several ways of adapting in�force and draft guidelines to the validation
of NIR methods.

31
4. EXPERIMENTAL
4.1. Material
4.1.1. Plant material
The plant material (II, III) consisted of 18 batches of Echinacea purpurea, 23 batches of
Echinacea angustifolia, 10 batches of Echinacea pallida and 2 batches of Parthenium
integrifolium. The samples were obtained in the form of dried roots from Heinrich Klenk
(Germany), Martin Bauer (Germany), Frantsilan Yrttitila (Finland), Alfred Galke
(Germany), Richters (Ontario, Canada), Bioforce, (Switzerland), Ian and Linda
Grossard´s farm (Manitoba, Canada), Medicinal herb farm (Kelowna, Canada), Nutrilite
farm (California, USA) and Teardrop farm (Kansas, USA).
4.1.2. Plastic raw material
The plastic films (I, V) were collected over a period of two years from a large number of
batches, several suppliers and several countries. The suppliers were: Perlen Converting
AG (Switzerland), Aerni�Leuch AG (Switzerland), Paskel International SA (Mexico),
Solvin SA (Belgium) and Riflex Film AB (Sweden). The different types of sample
differed with respect to their polymeric composition, colour and thickness:
A type: Clear transparent rigid 250 µm PVC (Poly(vinyl chloride)) film.
At type: Identical to the A type except for the thickness of the PVC layer (other than 250
µm).
B type: Clear transparent rigid 250 µm PVC film coated with 40 g m�2 of PVDC (Poly
(vinylidene dichloride)), with a nominal thickness of 273 µm.
Bt type: Identical to the B type except for the thickness of the PVC layer and / or the
amount of PVDC coating (nominal thickness other than 273 µm).
C type: Clear transparent rigid 250 µm PVC films coated with 5 g m-2 of TE
(Thermoelast®) and 90 g m-2 of PVDC, with a nominal thickness of 308 µm.

32
Ct type: Identical to the C type except for the thickness of the PVC layer and / or the
amount of TE and PVDC coating (nominal thickness other than 308 µm).
D type: Rigid plastic films of a different polymer composition than the A, B or C type
samples. For example, PP (Polypropylene) or PVC/PE (polyethylene)/PVDC films were
included in this group. The films were of several different thickness and colour.
A total of 193 batches of plastic film were collected.
4.1.3. Finished herbal medicinal product
The pharmaceutical product studied was the commercially available, 170 mg caffeine
tablet produced by Pharmia Oy, Finland (IV). The active principle is caffeine, or 1,3,7�
trimethylxanthine, a purine alkaloid. This alkaloid occurs naturally in tea leaves, coffee
beans, cocoa beans and maté leaves. The product is not marketed as a herbal medicinal
product in Finland because its pharmacological activity is based on a purified single
substance (NAM 2002), but it is marketed as a medicinal product with a �full� marketing
authorization. However, this product is a herbal medicinal product according to the
European directive (COUNCIL AND EUROPEAN PARLIAMENT 2001) because its
pharmacological activity is based on an alkaloid from vegetal sources.
The tablets contained 58.82% m/m anhydrous caffeine, and an excipient mass
consisting of α-lactose monohydrate, cellulose dry powder, starch and lubricants.
Twenty�two production batches were supplied by Pharmia Oy, and eleven laboratory�
made batches were prepared in order to broaden the caffeine concentration range. These
batches were obtained by overdosing or underdosing the samples by adding caffeine or
excipient mass during the mixing process prior to tableting. The caffeine concentration of
the laboratory batches covered the range from 0 (excipient tablets) to 100% m/m (pure
caffeine tablets). Two other laboratory batches were prepared using the same formula as
for the production batches, except that caffeine was replaced by two other alkaloids with
rather similar structures to caffeine: theobromine (3,7�dimethylxanthine) or theophylline
(1,3�dimethylxanthine).
4.1.4. Computer programs (I�V)

33
The spectrometer was equipped with the software package from ABB Bomem, Inc,
(Quebec, Canada) including Grams 32 version 4.04 for spectral acquisition, PLSPlus/ IQ
version 3.03 for spectral processing and chemometrics analysis, and AIRS (Advance
Infrared Software) version 1.54 for routine qualitative analysis. Statistical calculations
and PCA was performed using Systat version 9 and 10 (SPSS, Chicago, IL). The HPLC
method for Echinacea analysis (II, III) was developed using a computer�assisted
optimisation programme, Dry Lab 2000 (LC Resources, Walnut Creek, California).
4.2. Methods
4.2.1. High performance liquid chromatography (HPLC) (II, III, V)
The analytical equipment consisted of a Perkin Elmer Series 200LC pump and
autosampler with 200 µl loop (Norwalk, CT, USA), a Perkin Elmer LC 235 C Diode
Array detection system (Norwalk, CT, USA), and a PE Nelson 600 Series link (Norwalk,
CT, USA).
For the analysis of Echinacea species (II, III), the samples were analysed using an
RP�18 analytical column (Luna 3µ C18, 100x4.60 mm i.d. Phenomenex, USA) with a
fitted security guard cartridge (C18 ODS (Octadecyl) 3x4 mm, Phenomenex, USA). The
mobile phase flow rate was 1.0 ml/min for a total run time of 20 minutes, with UV
detection at 255 nm. The mobile phase consisted of A = water +0.1 % ortho�phosphoric
acid 85 % and B = acetonitrile. The gradient profile was developed using the computer�
assisted optimization program Dry Lab 2000. Identification of peaks was performed by
comparison with reference compound retention times and UV spectra recorded by
photodiode array detection.
For determination of the caffeine content (IV), the isocratic reversed�phase HPLC
method used a methanol:NaH2PO4 0.05M (30:70) mobile phase, a Lichrocart 125�4,
Lichrospher 5µm RP�18 Merck column, a flow rate of 1 ml/min, and a run time of 12
minutes. The UV absorbance was measured at 275 nm.

34
4.2.2. Characterization of the herbal drugs (II, III).
The moisture content of the herbal drugs, milled to powder with a grinder (Ika
Labortechnik, type A10, Staufen, Germany), was determined using an infrared dryer
(Sartorius Thermocontrol YTCOL, Sartorius GmbH, Göttingen, Germany). This dried the
samples at 110°C until the loss in weight was less than 0.1% during 50 seconds. The
particle size distribution of the samples was also evaluated by vibrational sieve analysis
(Analysette, Fritsch, Germany).
4.2.3. Near infrared reflectance spectroscopy (I, III�V)
The spectra were recorded on a FT�NIR MB160 spectrometer (ABB Bomem, Inc,
Quebec, Canada) fitted with a Powder Samplir reflectance accessory, a Quartz�Halogen
lamp and a cooled Indium Arsenide detector. The reflectance standard package was
supplied by Labsphere Inc. (North Sutton, New Hampshire, USA). The diffuse
reflectance mode was used for the three types of sample (powder, plastic, tablet). Each
spectrum was an average of 60 or 64 interferograms co�added at 16 cm-1 resolution, in
the range of 10000�4000 cm�1. For spectral acquisition, the sample presentation was
optimized according to the type of sample. For plastic samples (I, V), each film was
placed in the beam of the Powder Samplir Accessory with a Spectralon 99% reflective
standard located on top of the film. The radiation was scattered through the film, reflected
by the standard disk, passed back through the film, and finally picked up by the detector.
For Echinacea samples (II, III), the herbal powder was poured without tapping into a 20
ml borosilicate scintillation glass vial (Kimble glass, NJ, USA). The vial containing about
5 ml of powder was placed in the beam of the Powder Samplir accessory. For intact tablet
samples (IV), a �tablet holder� was constructed in order to prevent light scattering from
the beam due to the small nominal diameter (7 mm) of the tablets. The tablet holder
consisted of a 3 mm�thick piece of metal, with a 6 mm�diameter aperture in its centre.
Tablets were placed on the �tablet holder� located in the centre of the beam, and scanned
on both faces.

35
4.3. Data analysis
4.3.1. Second�derivative spectra
A second�derivative spectrum is the rate of change of the slope of the spectrum tangent.
They can be used to remove the linear background from raw spectra (OSBORNE et al.
1993). Spectra derivation was used during the feasibility studies in order to select the
spectral regions (I, III�V) and to correlate the spectral data with the property of interest
in the quantitative studies (IV, V). Moreover, it was always used as a pre�treatment
option during the construction of calibration models in order to improve their selectivity
and robustness (I, III�V). The 9-point Savitzky and Golay algorithm was used to perform
the derivations (SAVISTZKY and GOLAY 1964).
4.3.2. Hierarchical analysis
Hierarchical clustering (MASSART et al. 1988) was used (IV) as a tool for data
visualization. Similarity between pairs of second�derivative spectra was evaluated by
measuring the strength of the linear relationship between two spectra (Pearson distance).
The linkage distances between clusters were evaluated by the average of the distances
between all the points in the clusters. Spectra were then linked in one hierarchical
classification system, represented by a dendrogram.
4.3.3. Principal component analysis (PCA)
PCA analysis (WOLD 1987, DASZYKOWSKI et al. 2003) was performed during the
feasibility studies for the qualitative analyses (I, III) as a tool for data visualisation and to
improve our knowledge of the sample spectral features. PCA was primarily performed on
second�derivative spectra in order to improve the selectivity of the analysis. The PCA
analysis results were not published in the first article (I), but will be described in this
dissertation.

36
4.3.4. Pre�treatment options
Several pre�treatment options were selected, before performing the PLS regression, to
remove the spectral variability between samples due to irrelevant physical differences (I,
III�V). The pre�treatment options were chosen case by case, by the trial�and�error
method, as a function of the spectral variations found in the calibration data. The
algorithms used were among the following chemometric tools: mean centering, second�
derivative of Savitsky�Golay, SNV (standard normal variate) correction, and MSC
(multiplicative scatter correction).
4.3.5. Partial least square (PLS) algorithm
A partial least square algorithm was used as a calibration model for the qualitative and
quantitative methods. This algorithm was chosen because of the quality of the calibration
models produced and because of the adaptability of PLS software to pharmaceutical
regulations (validated software, data security, batch analysis mode).
For the qualitative analyses (I, III), binary coefficients were assigned to spectra as
a function of their identity according to the reference analysis results. Samples of the
required quality (true samples) were assigned the theoretical value of 100, and samples to
be rejected (false samples) were assigned the value of 0. The model was then calculated
using pre�treatment options. The number of significant PLS factors was chosen as
defined by HAALAND and THOMAS (1988). Three parameters were used as criteria to
discriminate true samples from false samples: predicted value, spectral residuals and
factor scores. Acceptance limits for each criterion were first set at 3 standard deviations
around the mean value obtained for this criterion by the true calibration samples. The
acceptances limits were later optimized during the internal validation step, i.e. when
calibration samples are tested against the method to control the performance of the
calibration model. If the sample results fall within these acceptance limits, then the
sample is considered as �accepted� and the quality control laboratory can conclude that
the sample fulfils the specifications. If the results are outside the limits, then the sample is
�rejected�.

37
For quantitative analysis (IV, V), spectra were assigned the value found by the
reference method for the parameter of interest. Acceptance limits for this parameter are
those defined by the material specifications. The quality of the developed models was
evaluated by performing a validation of the methods according to pharmaceutical
regulations already in force or in preparation.

38
5. RESULTS AND DISCUSSION
5.1. New applications of NIR spectroscopy
During the course of this study, new applications were developed for NIR spectroscopy
in the field of pharmaceutical quality control for herbal medicinal products. These
applications have never been published before, and they concern the control of raw
material at reception and the assay of the active principle in the final dosage form. They
were fully validated according to current pharmaceutical regulations or those in
preparation.
Three methods were developed for the quality control of the raw material at reception (I,
III, V). They can be used to ensure that the raw material sent by the supplier fulfils the
required specifications. The first one was a method that controls the identity of the
pharmaceutical plastic sheets for blistering (I). It can be successfully combined with the
NIR method (V) for the determination of the thickness of the plastic sheets. Quality
control of primary packaging is of prime importance in the case of herbal medicinal
products because natural products are especially sensitive to moisture. The two methods
are optimally used when a spectrum is simultaneously processed with both models. The
other identification model developed concerned the confirmation of the species identity
for Echinacea purpurea root (III), which is of importance to avoid any risk of
adulteration of the herb.
The last method was developed to show the possibility of using NIR as a
quantitative method for the assay of a compound of natural origin in intact solid dosage
form (IV). This method is very flexible. It can be used to determine the caffeine content
of a batch, as well as the content uniformity of caffeine tablets, and to validate the
manufacturing process, e.g by controlling content deviations or comparing the caffeine
content of tablets pressed by the different punches of the press.
5.2. What are the benefits of using chemometric analysis during feasibility studies?

Chemometrics tools can be optimally used for fast visual control of spectral differences
between samples before developing an NIR regression model because it enhances the
relevant chemical information from the samples (MASSART et al 1988, LAVINE 1998).
The output from the chemometric analysis is a range of useful information that can be
used to optimise the development of the targeted NIR method.
PCA analysis, for example, is very informative (WOLD 1987, DASZYKOWSKI
et al. 2003). It was performed on second-derivative spectra from plastic samples (Figure
7, unpublished results) before developing the identification method (I). Principal
components 1 and 2 (Figure 7a) make a clear difference between samples containing
Thermoelast® (C Type samples) and samples not containing this compound (A and B
types). Principal components 3 and 4 (Figure 7b), in contrast, exhibit clear evidence of
spectral differences between the three main types of plastic (A, B and C types). This
Figure 7 Principal component analysis (PCA) of a set of samples composed of A�,B�, and C�type plastic sheets. This plot displays the 1st, 2d (a) and 3d, 4th (b)principal components. Variance explained by the four components explains 55% ofthe data set variation including 26% for the first principal component (Unpublishedresults).
39
result is a good sign that a robust identification method can be developed based on
spectral differentiation. Moreover, PCA is useful to select a representative calibration set
and to favour the most specific spectral region. Figure 7 demonstrates that spectral
differences are larger between the C type and the two other types than between the A and
B types. Therefore, the spectral region to be included in the regression model must be
chosen in order to emphasise the spectral variability between the A and B types of plastic.
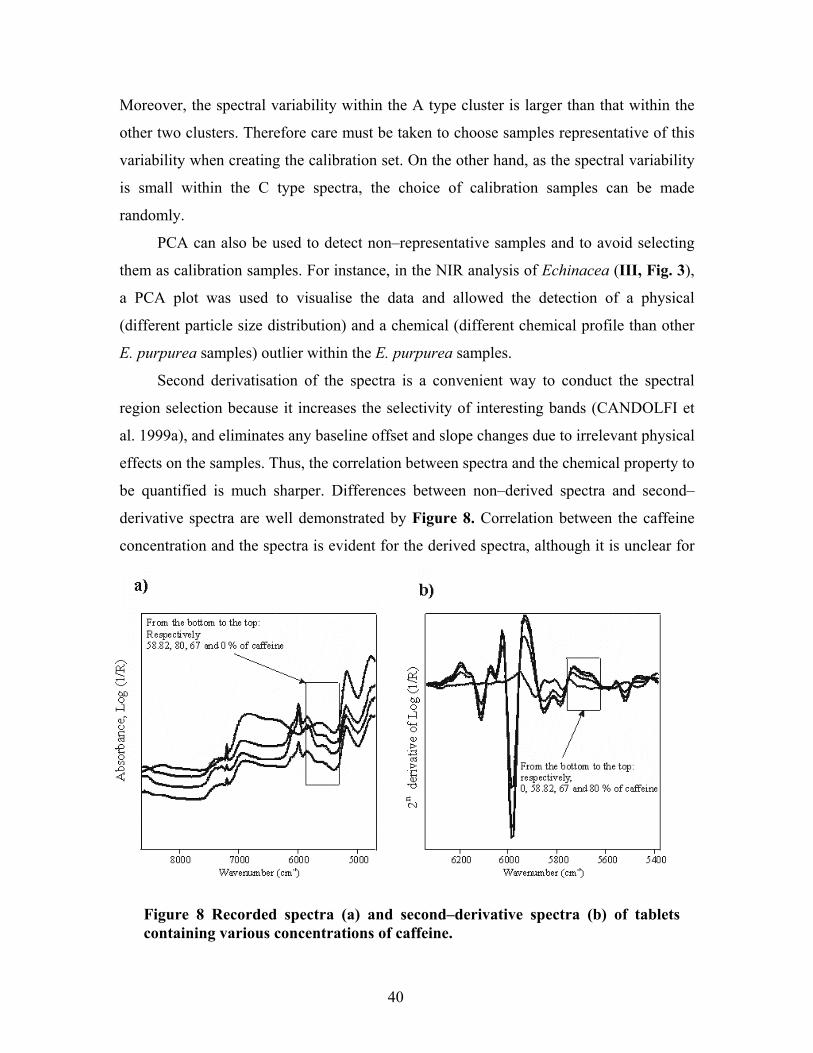
40
Moreover, the spectral variability within the A type cluster is larger than that within the
other two clusters. Therefore care must be taken to choose samples representative of this
variability when creating the calibration set. On the other hand, as the spectral variability
is small within the C type spectra, the choice of calibration samples can be made
randomly.
PCA can also be used to detect non�representative samples and to avoid selecting
them as calibration samples. For instance, in the NIR analysis of Echinacea (III, Fig. 3),
a PCA plot was used to visualise the data and allowed the detection of a physical
(different particle size distribution) and a chemical (different chemical profile than other
E. purpurea samples) outlier within the E. purpurea samples.
Second derivatisation of the spectra is a convenient way to conduct the spectral
region selection because it increases the selectivity of interesting bands (CANDOLFI et
al. 1999a), and eliminates any baseline offset and slope changes due to irrelevant physical
effects on the samples. Thus, the correlation between spectra and the chemical property to
be quantified is much sharper. Differences between non�derived spectra and second�
derivative spectra are well demonstrated by Figure 8. Correlation between the caffeine
concentration and the spectra is evident for the derived spectra, although it is unclear for
Figure 8 Recorded spectra (a) and second�derivative spectra (b) of tabletscontaining various concentrations of caffeine.

41
raw spectra because of the physical differences between tablets (e.g. hardness, density,
and position on the tablet holder). However, when the property to quantify is a physical
characteristic of the sample such as the thickness of the plastic film (V, Fig. 1. and 2.),
the improvement is not so significant because derivatisation does not remove variability
arising from chemical differences. Second�derivative spectra are thus useful to optimise
the method specificity (STORDRANGE et al. 2002). They help to select precisely the
spectral region having the highest correlation with the property of interest (IV, Fig. 1), as
well as the region interfering the least with excipients or closely related compound
features (IV, Fig. 1. and 4).
Hierarchical clustering is another way to classify the spectral differences between
samples (MASSART et al. 1988). In this study it was used to distinguish the differences
between spectra recorded from the two faces of caffeine tablet (IV). Similarity between
pairs of second�derivative spectra was evaluated by measuring the strength of the linear
relationship between two spectra (Pearson distance). The linkage distances between
clusters were evaluated by the average of the distances between all the points in the
clusters (MASSART et al. 1988). All the spectra were then linked in one hierarchical
classification system, represented by a dendrogram. The resulting dendrogram (IV, Fig.
2) exhibited two clear clusters: one containing spectra from the front face of the tablet,
the other one containing the spectra from the back face. It was thus obvious that the tablet
sides had different spectral features, which could lead to quantitative errors when
applying the PLS regression. The spectral difference was explained by density variations
between the two faces of the tablet as a result of compressional force differences between
the upper and the lower punch in the rotary machine (IV) (TRAIN 1956, AULTON
1988). This information led to the decision to modify the spectral acquisition mode,
which originally consisted in recording the spectrum from only one face of the tablet. The
tablets were therewith scanned on both faces and the two spectra then averaged to give
the tablet spectrum.
5.3. Factors affecting the robustness of NIR analysis methods
42
Lack of robustness is one of the main disadvantages of NIR spectroscopy compared to
other techniques (BLANCO and VILLARROYA 2002a). Several parameters can affect
NIR spectral features and some of them were directly identified during this study. They
can lead to misidentification of a sample or to imprecision in the quantitative results, and
thus should be investigated prior to developing the model.
The chemical composition of the samples modifies the spectral features. The case
of Echinacea purpurea identification is a good example. Chemical variations in this
species (II, Table 1) are large and attributable to the place and season of harvest, drying
methods, age of the plant, storage methods etc. Within the collected samples, one E.
purpurea batch, with the code P2, had a relatively different chemical profile compared to
the other samples within this species: its Dodeca�2E, 4E, 8Z, 10E/Z�tetraenoic acid
isobutylamide contents were nearly undetectable. This distinction was reflected by the
sample spectra and depicted during the feasibility study by the PCA analysis (III, Fig. 3).
In order to prevent this sample from being rejected by the NIR method, samples with a
large range of isobutylamide content (e.g. varying location of growth, climate) were
included in the calibration set. As a result, this sample was accepted by the developed
NIR model.
The physical properties of samples can also affect the method specificity. Again,
during Echinacea identification method development (III), PCA analysis showed a
spectral outlier, P1, which was found to have a much narrower particle size distribution
than the other samples (III, Fig. 4). The reason for this was that it was received directly
in milled and sieved form, although the other samples were milled at reception and not
sieved. Attempts to include this sample in the calibration set led to failures as it was
depicted as an outlier by the F�test. Thus, as it is assumed that all future samples will be
milled at reception, no special actions were taken to improve the calibration set. As a
result, this sample was not accepted by the method and was thus labelled as a �false
negative� sample. Nevertheless, it gave an indication that all samples should be milled in
the same way in order to avoid false negative identification. Another example was
demonstrated by the study on caffeine tablets. Hierarchical analysis (IV, Fig. 2) revealed

43
a difference in the spectral features of the two faces of a tablet. This was explained on the
basis of the variation of the caffeine density due to differences in the upper and lower
punch compressional forces during tableting. The concentration difference between the
two faces of the tablet was quantified by NIR and found to be between 1.4 and 1.0% m/m
of caffeine for two batches (IV).
Replacement of the NIR quartz halogen source can cause frequency variation and
thus spectral shifts. In our case, the frequency is calibrated according to the expected
position of a water vapour band (BOMEM 1994): i.e. 7299.87 ± 0.1 cm-1, which is a
combination of symmetrical stretching and asymmetrical stretching (ν1 + ν3) of O�H
vibrations (NIELSEN 1942). Maintenance tests are performed each day of analysis to
control the frequency calibration. However, if calibration spectra were recorded at a
precise frequency, a small deviation from this value can induce a significant spectral shift
in the recorded spectrum and lead to misidentification of the spectra. As an example,
during our study the NIR source was replaced but not precisely realigned, which induced
significant deviation of the water band frequency up to 7299.81 with a day�to�day
variation of approximately 0.02 cm-1. This value was, however, still within the frequency
acceptance limits. As the calibration model for the plastic identification (I) was created at
a very stable frequency (approximately 7299.87 ± 0.01 cm-1), the spectra were affected
by a significant shift and were thus no longer identified correctly by the method. To solve
the problem, the NIR source had to be realigned so that the frequency reaches the same
value as previously (unpublished result). In contrast, two batches of caffeine tablets
(IV) were analysed before and after the source replacement, prior to the source
realignment. The results were not found to be significantly different (n = 6, P = 0.19 and
0.73 respectively). Therefore, the effect on the spectral results depends on the type of
model developed: if the acceptance criteria are very tight, such as in the plastic
identification model (I), the effect may be significant.
Variation in sample presentation has always been known as a factor affecting
spectral features (YOON and MOFFAT 1998). However, it is highly dependent on the
situation. In the plastic thickness analysis method, robustness versus the position of the
44
reflectance standard was evaluated (V). The results were found to be unaffected if the
reflectance standard does not fit properly on the optical window due to a curling form of
the sheet. However, changing the reflectance standard from a routine standard to a newer,
cleaner standard was found to affect the spectra and resulted in a prediction error of 3.8
µm when measuring the thickness of the plastic film (V). However, this result is of little
practical significance because it is lower than the standard error of prediction of the NIR
method itself (SEP = 4.3 µm). In the case of caffeine tablets (IV), the results were not
affected (P = 0.30, n = 6) when the tablet holder was not fitted properly in the center of
the optical window. The repeatability of the results was, however, poorer (Relative
standard deviation RSD = 1.1 %) when the tablet holder was located off�center than
when it was placed correctly in the center of the beam (RSD = 0.78 %). Thus the correct
position of the tablet holder is a critical point in the NIR analysis of tablets.
Change of supplier or a change in the manufacturing process of the samples can
also lead to slight spectral modifications, which may affect the method specificity. As the
identification model of plastic samples (I) was used routinely for quality control
purposes, a sample was received and not correctly identified by the NIR method even
though it was positively identified by the reference IR method. The supplier was
contacted and it was shown that the manufacturing process of this sample had been
slightly modified. In this case, the only way to solve the problem is to collect other
samples of the new quality, to include them in the calibration set, and to update the
regression model.
Therefore, in order to ensure the robustness of an NIR method, the potential factors
likely to affect the results must be investigated, such as the chemical and physical
characteristics of the sample or sample presentation. Once these factors are known, two
different types of decision can be taken. The first one is to make sure that these variations
will not appear during the creation of calibration and the routine analysis of the samples.
For example, solid herbal drugs should always be milled in the same way, and the
frequency should not be subjected to large variations. On the other hand, when it is
difficult to control these factors, it may be better to include them in the calibration set as

45
normal variations of the sample. For example, if herbal drugs were susceptible to be
received in solid or in powder form, then it would be better to introduce samples milled at
reception and pre�milled samples in the calibration set. In this case, this variation will be
recognised as a normal variation of the samples, and thus samples will be correctly
identified by the PLS method irrespective of their particle size distribution. In the same
way, calibration could be created over a large period of time in order to include large
frequency variations. The resulting model will thus not be so susceptible to slight
frequency variations.
5.4. Comparison between NIR analysis and HPLC outputs
In this study, a comparison of the outputs obtained with NIR and traditional analysis
methods was performed by analysing Echinacea purpurea roots by both high�
performance liquid chromatography (HPLC) (II) and NIR spectroscopy (III). The aim
was to confirm the identity of Echinacea purpurea roots and enable the detection of
possible mislabelled samples or adulterants, e.g. other Echinacea species or Parthenium
integrifolium (BAUER and WAGNER 1991). In traditional HPLC analysis of Echinacea
species, hydrophilic and lipophilic fractions are usually separated by means of different
sample preparation methods and different HPLC settings (BAUER and WAGNER 1991).
This results in an analysis time of usually over 40 minutes without including sample
preparation. In order to increase the speed and limit the costs of HPLC analysis, a fast
HPLC method was developed (II). This method combines the analysis of hydrophilic and
lipophilic compound during the same run, i.e. using the same extract for both types of
compound and a single injection in the column. This enables the compounds of interest to
be separated within 20 minutes, i.e. about twice as fast as for traditional HPLC analysis.
The time needed to perform the HPLC analysis for five duplicate Echinacea purpurea
samples was approximately 18 hours, including sample preparation, establishment of the
three calibration curves, analysis runs and cleaning of the HPLC column.
As a comparison, the NIR analysis is able to verify the identity of Echinacea purpurea in
30 minutes, including grinding of the samples, calibration of the instrument, analysis of
46
the five duplicate samples, and cleaning the scintillation vials. The analysis is performed
on solid material, without the need for solvent. This explains why speed and
environmental friendliness are most probably the main advantages that spring to mind
when comparing NIR spectroscopy with other analytical techniques.
The information obtained from the two techniques is, however, quite different.
HPLC (II) gives specific and simultaneous results about the identity of the sample and
the concentration or presence of marker substances. HPLC chromatograms are thus
specific enough to determine the identity of the sample whatever its species (E. purpurea,
angustifolia or pallida), and can very easily detect the presence of the potential adulterant
Parthenium integrifolium. On the other hand, the developed NIR analysis (III) only gives
an answer to the question: is this sample an Echinacea purpurea root sample or not? If
the answer is no, then it is almost impossible to determine the identity of the sample due
to the poor specificity and selectivity of spectral features in NIR spectroscopy (III, Fig.
1). In the pharmaceutical industry, however, it is more important to make sure that the
sample is of the required quality, and it is of secondary importance to know the real
identity of the sample in case it does not fulfil specifications. Furthermore, the method
does not give any indication of the marker level of the sample. However, it would be
possible to overcome this drawback, as demonstrated recently by Schulz and co-authors
(SCHULZ et al. 2002), who described a quantitative NIR method for the determination of
the echinacoside content in Echinacea roots. NIR quantitative methods are nevertheless
able to quantify only the parameters they have been calibrated for and do not give
indication on any other parameters. In addition, more extensive development work is
required for developing a quantitative method than that for qualitative methods. The last
output is that routine NIR analysis can be performed by an almost untrained person. In
contrast, HPLC analysis requires highly trained personnel.
Thus, if assessing the exact identity of the sample or determining precisely its
chemical profile is the target to be reached, then the HPLC method is more suitable than
NIR for the analysis. But, if controlling that the sample is of the required identity and
quantifying a few marker substance is the target, NIR is the suitable technique and the
advantages in terms of time and costs saved during the analysis are huge (fast analysis, no
solvent, no highly trained personnel).

47
5.5. Validation of NIR methods
In this chapter, the way to validate NIR methods will be discussed. Two types of
document were followed in creating the validation plans. ICH guidelines (EMEA 1994
and 1996) are the document currently in�force for the validation of analytical methods,
but are not well adapted to non separative methods such as NIR spectroscopy. The recent
draft guideline (EMEA 2001c) is targeted for the validation of NIR methods.
5.5.1. Validation of qualitative NIR methods
According to the ICH guidelines (EMEA 1994 and 1996), identification methods should
only be validated for their specificity, i.e. their ability to discriminate compounds of
closely related structure. Specificity should be assessed by confirming that positive
results are obtained from samples containing the analyte (called true samples in the field
of NIR spectroscopy) and that negative results are obtained from samples not containing
the analyte or containing material structurally closely related to the analyte (false
samples). These criteria are just as applicable to the NIR method as to separative methods
such as HPLC. The two qualitative NIR methods developed (I, III) were validated by
adapting these two guidelines. An internal validation was first performed to control the
performance of the model with the calibration set samples, and the external validation
was then used to control the specificity of the model versus samples completely
independent of the calibration set. Both the calibration and validation sets contained true
samples and false samples (I, Tables 3, 4, 5 and III, Table 1) so that the ICH criteria for
assessing specificity were fulfilled. The validation of qualitative NIR methods was
clarified in the recent draft guideline (EMEA 2001c). Specificity should be assessed in
two steps, i.e. internal validation and external validation, but robustness should also be
demonstrated (investigation of the effect induced by possible variations such as
temperature, humidity, sample presentation, or changing lamps). In qualitative NIR
48
methods (I, III), only the robustness versus the change of raw material supplier was
assessed and both methods proved to be robust regardless of the supplier of the products.2
5.5.2. Validation of quantitative NIR methods
One of the first steps in the validation of an NIR quantitative method should be to control
the performance of the calibration model. This was not included in the specifications of
the ICH guidelines (EMEA 1994 and 1996), but it is of primary importance before any
further validation steps. EMEA has now included this specification in the draft for the
validation of NIR methods (EMEA 2001c). The chosen model should be presented in
detail, including the equation, correlation coefficient, slope, and y intercept of the
equation. However, this draft does not mention anything about the importance of the
model residuals. Graphical analysis (V) of the residuals could be conveniently performed
even at the method development stage in order to check that the model is based on correct
statistical principles.
A simple probability plot can confirm that the residuals are normally distributed random
variables with a mean of 0 (V, Fig. 3 a), and a studentized residual plot (V, Fig. 3 b) can
show that the residuals have a constant variance and are independent of the concentration.
These results give the insurance that the model is statistically valid. For the model
validation, the EMEA also recommends to assess the adequacy of the calibration by
calculating the standard error of calibration (SEC). However, it was found that the
formula given for the calculation of SEC is applicable to multiple linear regression
(MLR), but not to PLS regression (V). The main reason for this is that the spectra are
usually mean centred before performing the PLS regression, which takes one degree of
freedom. Thus in this case, the divisor (n-p-1) should be used instead of (n-p) in the SEC
formula given by the EMEA guideline (Eq. 6).
2 The draft for the validation of NIR methods was adopted on February 20, 2003 (EMEA 2003), after this thesis was completed. The
main modification brought by the adopted document concerning the validation of qualitative methods was as follows. Internal
validation is no longer part of the validation parameters for qualitative methods. This means that specificity testing of the batches
included in the reference library no longer needs anymore to be included in the validation report. However, it remains a crucial step to
test the method validity and improve the acceptance limits as demonstrated in (I).

49
pn
YySEC
n
iii
−
−=∑=1
2)(, (6)
Where n = the number of batches, y = the reference method value, Y = the NIR predicted
values, and p = the number of coefficients used in the calibration model. Therefore it was
suggested (V) that the SEC formula in the final EMEA guideline should be more detailed
in order to take into account the differences between the MLR techniques and the PLS
regression techniques.
According to the ICH guidelines, accuracy, precision, specificity, linearity and
range should be demonstrated during quantitative method validation. The NIR method
(IV) developed to determine the caffeine content in tablets was validated according to
these specifications. Some specifications had to be adapted because they were not directly
applicable to NIR methods.
Accuracy was found to be rather difficult to assess using only the prescribed
specifications. In fact, as the NIR calibration range has to be expanded by introducing
laboratory batches with a larger variation of active principle concentration, accuracy is
affected by the physical differences between laboratory samples and production samples.
The difference between the accuracy calculated only from production samples or from
production and laboratory samples, was found to be relatively large: 99.4 and 98.9 %,
respectively, of mean recovery from the reference HPLC value (IV). This is why
accuracy was also validated by other parameters such as standard error of prediction,
prediction bias and t�test between the NIR and reference values (IV). In the EMEA draft
for the validation of NIR methods (EMEA 2001c), accuracy assessment is now much
simpler: accuracy should be studied by determination of the standard error of prediction
(SEP) and the number of outliers of the validation set. SEP of the NIR method should not
be larger than 1.4 x SEL (standard error of laboratory of the reference method). The
thickness determination method (V) was validated according to this draft, and SEP was
found to be similar to SEL of the reference method (4.3 and 5.0 µm, respectively).
Precision was easy to evaluate using the specifications given by the ICH guidelines.
In fact, no modifications have been included in the new EMEA draft to assess the
50
precision of NIR methods. In the NIR methods developed, repeatability was found to be
well below the normally accepted criteria for analytical methods (RSD = 1%): RSD <
0.75% (IV) and RSD < 0.65% (V). Similarly, intermediate precision was found to be well
below the normally accepted criteria (RSD = 2%): RSD < 0.65 % (IV) and RSD < 1.05
% (V).
Specificity assessment has been modified considerably in the EMEA draft
compared to the ICH guideline currently in�force. The specificity of the caffeine
quantitative method (IV) was assessed by adapting the ICH criteria described in Chapter
5.5.1. It was proved that the absorption peaks that correlated with the caffeine
concentration did not interfere with the excipient peaks (IV, Fig. 1). This result was also
quantified by a comparison of the spectral residuals obtained with three production
batches and one laboratory batch containing only excipients. The acceptance criterion
(mean spectral residual + 3 standard deviations) was calculated from the results of
production batches from the calibration set. One�sample t�tests confirmed that the mean
residual of the excipient batch was significantly different (t = 24.8, P < 2 10-5, n = 6), and
35 times higher than the acceptance criterion. The mean spectral residuals from the
production batches were within the acceptance criterion. The ability of the method to
discriminate tablets containing caffeine from tablets containing theobromine or
theophylline, two alkaloids with structures closely related to caffeine, was also evaluated.
Their spectra and second derivatives (IV, Fig. 4) showed significant visual differences
between caffeine and theobromine or theophylline tablets. Thus this method is able to
discriminate caffeine tablets from tablets not containing the analyte, and from tablets
containing closely related compounds. Specificity was therefore validated. The specificity
of the thickness determination method (V) was evaluated according to the EMEA draft.
As the quantitative method was used simultaneously with the NIR identification of plastic
samples, specificity was assessed by challenging an updated version of the identification
method (I) with samples of different polymer combination, thickness or colour. The NIR
method gave 2.0, 4.5 and 0.0 % of false negative (or type I) error, and 1.7, 2.1 and 1.0 %
of false positive (or type II) error, for the identification of A, B and C types of plastic,
respectively. Therefore the method is specific enough to discriminate samples with
different polymer combination, thickness or colour.

51
There is no significant difference between the two guidelines in the way linearity is
to be assessed. For the caffeine (IV) and the thickness determination (V) methods,
linearity was assessed by providing a plot of the NIR�predicted value versus the
reference method value, together with the correlation coefficient and equation of the
regression line. Moreover, it was confirmed that the confidence interval for the slope and
for the y intercept included one and zero, respectively. Finally, a t�test was used to prove
that the y intercept did not differ significantly from zero, and analysis of the variance
demonstrated that the slope also did not differ significantly from one. Therefore the
linearity of the two methods was validated.
According to the ICH guideline, establishing that linearity, accuracy and precision
are validated is sufficient to validate the range of application of the methods. The range
of the two quantitative methods was validated therewith (IV, V). Nevertheless, according
to the recent EMEA guideline, this criterion no longer needs to be validated for NIR
methods.
The quantification limit is not a parameter suggested for the validation of an assay
by the ICH guideline, and neither by the draft EMEA guideline. However, it is
convenient and interesting to calculate this parameter with a simple approach based on
the standard deviation of the response and the slope, as recommended by the ICH
guideline (EMEA 1996) when impurities are to be quantified. Using a simple calculation
that involves no further laboratory work, the limits of quantitation were calculated for
both quantitative methods and were found to be 13.7 % m/m of caffeine in the tablet
(IV), and 41 µm of thickness for plastic sheets (V). These values confirmed that the range
of the methods were valid.
As the criteria for robustness provided by the ICH were not applicable to NIR
methods, specific criteria were created for this purpose during the validation of the
caffeine NIR method (IV). Robustness was assessed by evaluating the effect of changing
the position of the sample holder in the beam and replacing the NIR source (IV). The
EMEA draft guideline is more detailed about robustness evaluation and recommends that
the effect of temperature, humidity, different position of the sample in the optical
window, different sampling presentation devices or instrumental variations e.g. changing
lamps, reflectance standard, should be evaluated. Robustness for the thickness
52
determination method (V) was thus validated by evaluating the effect of an incorrect
position of the reflectance standard and of a change in the reflectance standard. The
results of robustness evaluation were discussed already in Chapter 5.3. 3
3 The draft for the validation of NIR methods was adopted on February 20, 2003 (EMEA 2003), after the thesis was completed. The
main modifications brought by the adopted document concerning the validation of quantitative methods were as follows.
The performance of the calibration model now takes into account the difference between multiple linear regression (MLR)
and PLS regressions as suggested in (V). The modification, however, brings a different solution to the one suggested in (V). MLR and
PCR methods should indeed be evaluated by the determination of the standard error of calibration SEC, and PLS methods should be
evaluated by the determination of the standard error of cross validation SECV (Eq. 7).
n
YySECV
n
iii∑
=
−= 1
2)((7)
Where n = the number of batches in the calibration set, y = the reference method value, Y = the NIR predicted values. This suggestion
solves, as does the one proposed in (V), the problem of the non-suitability of SEC formula for PLS regression. This, however means
that the calibration model performance should be evaluated by different parameters depending on the type of regression used. The
suggestion proposed in (V) had the advantage of keeping the same parameter (SEC) for all types of regression and thus facilitating
their comparison.
It is also suggested to add information concerning specificity of the method, e.g. a comparison of the NIR bands of the
analyte of interest with those from the matrix or a comparison of the factor loading with the analyte bands. The relevancy of this
information was already demonstrated during the validation of the caffeine quantitative method (IV).
53
6. CONCLUSIONS
The present study demonstrates that NIR can successfully be used to monitor the quality
of herbal medicinal products at different steps of the manufacturing processes. This was
illustrated by the development of four previously unpublished NIR methods. Three of the
methods target the quality control of raw material at reception. They can be used
routinely in the quality control laboratory to ensure that the raw material sent by the
supplier fulfils the required specifications. One of the methods aims at confirming species
identity for Echinacea purpurea root and at avoiding any risk of adulteration of the herb.
Another method controls the identity of the pharmaceutical plastic sheets used for
blistering. It can be successfully combined with the NIR method developed for the
determination of the thickness of plastic sheets. The time gained is optimal when a
sample is analysed simultaneously by both methods. The fourth method was developed
for the assay of caffeine, an alkaloid of natural origin, in intact tablets.
The importance of carrying out a feasibility study prior to the development of an
NIR model was brought to the fore. It was shown that the use of a suitable chemometrics
analysis during feasibility studies leads to a better knowledge of the spectral variability of
the samples and allows pertinent choices to be made prior to development of the model.
Principal component analysis, second�derivative and hierarchical analysis proved to be
especially helpful in choosing representative calibration samples, a specific spectral
region, and an improved spectral acquisition mode. Moreover, the study of factors
affecting the spectra was found to be crucial to optimise the variability of parameters that
should be included in the calibration set (frequency, supplier, particle size) and the
sample presentation mode.
Chemometrics analysis and a robustness study are thus highly critical steps for the
development of specific and robust NIR models.
When comparing the outputs and benefits of NIR compared to traditional analysis
methods, HPLC was found to give more informative composition results as compared to
NIR spectroscopy. Thus, when the analysis aims at assessing the exact identity of the

54
sample or precisely determining its chemical profile, then HPLC is a more suitable
analysis technique than NIR spectroscopy. However, controlling that the sample is of the
required identity and quantifying a small number of marker substances are often the goals
for the pharmaceutical industry. In these cases, NIR is a technique of choice for the
quality control of herbal medicinal remedies. In addition, it was shown that the
advantages in terms of time and costs saved during the analysis are considerable
compared to HPLC: NIR routine analysis is more than an order of magnitude faster,
environmental friendly, and does not require highly skilled personnel.
The methods were validated according to pharmaceutical regulations and all the
criteria met the recommended specifications. Qualitative methods were validated for their
specificity, and quantitative methods were validated for their accuracy, precision,
specificity, linearity, range, limit of quantitation and robustness. In�force validation
guidelines and those in preparation at that time were compared for this purpose. The draft
validation guideline for NIR methods was shown to be a much more suitable regulatory
framework than the guidelines in force at that time. A number of potential improvements
for the validation draft guideline were, nevertheless, suggested during the completion of
this work. They were found to be very similar to the modifications actually brought to the
adopted version of this document.
This demonstration of the applicability of NIR spectroscopy as a quality control
tool for herbal medicinal remedies and the implementation of the final validation draft
will hopefully facilitate the acceptance of NIR spectroscopy in pharmaceutical
laboratories.
55
7. REFERENCES
AESPG, Association Européenne des spécialités pharmaceutiques grand public. (1999):Herbal medicinal products in the European Union. European commission document,Bruxelles. http://pharmacos.eudra.org.ALLEN, L. (1974): Quantitative determination of carisoprodol, phenacetin, and caffeinein tablets by near�IR spectrometry and their identification by TLC. J. Pharm. Sci., 63(6):912�916.ANDERSSON, M., JOSEFSON, M., LANGKILDE, K.W. and WAHLUND, K.�G.(1999): Monitoring of a film coating process for tablets using near infrared reflectancespectrometry. J. Pharm. Biomed. Anal. 20(1�2): 27�37.ARTIGES, A. (1998): Pharmacopoeial standards for herbal medicinal products inEurope. Eur. Phytojournal. 1: 28�29.ATKINS, P.W. (2001): Physical Chemistry, 7th edition, Oxford University Press, Oxford.AULTON, M.E. (1988): Pharmaceutics: The Science of Dosage Form Design. Aulton,M.E., Collett, D.M. Eds., Churchill Livingstone, Edinburgh.BARNES, J. (2002): Herbal therapeutics. An introduction to herbal medicinal products.P. J. 268(7201): 804�806.BARTON, F.E., AKIN, D.E., MORRISON, W.H., ULRICH, A. and ARCHIBALD, D.D.(2002): Analysis of fiber content in flax stems by near�infrared spectroscopy. J. Agric.Food Chem. 50(26): 7576�7580.BAUER, R. and WAGNER, H. (1991): Echinacea species as potentialimmunostimulatory drugs. Economic and Medicinal Plant Research. Wagner, H.,Farnsworth, N.R. Eds., Academic Press, New York. BENSON, I.B. (1996): Not just moisture: a review of some commercially successful nearinfrared applications. Near Infrared Spectroscopy: The Future Waves. A.M.C. Davies andP. Williams Eds., NIR publications, Chichester.BERTHA�SOMODI, S., PAP�SZIKLAY, Z. and KAFFKA, K. (1996): Quantitativedetermination of the ingredients of pharmaceutical tablets. Near Infrared Spectroscopy:The Future Waves. A.M.C. Davies and Williams P. Eds., NIR publications, Chichester.BERTRAND, D. (1998): Principe de fonctionnement des spectromètres procheinfrarouge de conception récente. Analusis Mag. 26(4): M29�M33.BERTRAN, E., BLANCO, M., COELLO, J., ITURRIAGA, H., MASPOCH, S. andMONTOLIU, I. (2000): Near infrared spectrometry and pattern recognition as screeningmethods for the authentication of virgin olive oils of close geographical origins. J. NearInfrared Spectrosc. 8(1):45�52.BERTRAND, D. (2002): La spectroscopie proche infrarouge et ses applications dans lesindustries de l´alimentation animale. INRA Prod. Anim. 15(3): 209�219.BISSET, N.G. (1994): Herbal drugs and phytopharmaceuticals. A handbook for practiceon a scientific basis. Medpharm, Stuttgart.
56
BLANCO, M. COELLO, J., ITURRIAGA, H., MASPOCH, S. and DE LA PEZUELA,C. (1998): Near infrared spectroscopy in the pharmaceutical industry. Analyst. 123(8):135R�150R.BLANCO, M., COELLO, J., EUSTAQUIO, A., ITURRIAGA, H.A. and MASPOCH, S.(1999a): Development and validation of a method for the analysis of a pharmaceuticalpreparation by near�infrared diffuse reflectance spectroscopy. J. Pharm. Sci. 88(5): 551�556. BLANCO, M., COELLO, J., EUSTAQUIO, A., ITURRIAGA, H.A. and MASPOCH, S.(1999b): Development and validation of methods for the determination of miokamycin invarious pharmaceutical preparations by use of near infrared reflectance spectroscopy.Analyst. 124 (7):1089�1092.BLANCO, M., COELLO, J., ITURRIAGA, H., MASPOCH, S. and POU, N. (2000a):Development and validation of a near�infrared method for the analytical control of apharmaceutical preparation in three steps of the manufacturing process. Fresenius' JAnal. Chem. 368(5): 534�539. BLANCO, M., EUSTAQUIO, A., GONZÁLEZ, J.M. and SERRANO, D. (2000b):Identification and quantitation assays for intact tablets of two related pharmaceuticalpreparations by reflectance near�infrared spectroscopy: validation of the procedure. J.Pharm. Biomed. Anal. 22(1): 139�148. BLANCO, M. and VILLARROYA, I. (2002a): NIR spectroscopy: a rapid�responseanalytical tool, Trends Anal.Chem. 21(4): 240�250.BLANCO, M. and ROMERO, M.A. (2002b): Near infrared transflectance spectroscopydetermination of dexketoprofen in a hydrogel. J. Pharm. Biomed. Anal. 30(3): 467�472.BLUMENTHAL, M. (1998): The complete German commission E monographs:Therapeutic guide to herbal medicines. American Botanical Council and IntegrativeMedicine Communication, Newton, MA.BOMEM FT�IR REFERENCE MANUAL (2001): revision 1.1, IMZ8557.www.abb.com/analytical.BOMEM (1994): User�s guide. The Michelson series FT�IR spectrometer. Bomem, Inc,Canada.BRERETON, R.G. (2000): Introduction to multivariate calibration in analyticalChemistry. Analyst, 125(11): 2125�2154.BROAD, N., GRAHAM, P., HAILEY, P., HARDY, A., HOLLAND, S., HUGHES, S.,LEE, D., PREBBLE, K., SALTON, N. and WARREN P. (2002): Guidelines for thedevelopment and validation of near�infrared spectroscopic methods in the pharmaceuticalindustry. Pharmaceutical applications, Handbook of vibrational spectroscopy, ChalmersJ. M. and Griffiths P. R. Eds., John Wiley & Sons Ltd, Chichester.CANDOLFI, A., DE MAESSCHALCK, R., JOUAN�RIMBAUD, D., HAILEY, P.A.and MASSART, D.L. (1999a): The influence of data pre�processing in the patternrecognition of excipients near�infrared spectra. J. Pharm. Biomed. Anal. 21(1): 115�132.CANDOLFI, A., DE MAESSCHALCK, R., MASSART, D.L., HAILEY, P.A. andHARRINGTON, A.C.E. (1999b): Identification of pharmaceutical excipients using NIRspectroscopy and SIMCA. J. Pharm.Biomed. Anal. 19(6): 923�935.

57
CANDOLFI, A. and MASSART, D.L. (2000): Model updating for the identification ofNIR spectra from a pharmaceutical excipient. Appl. Spectrosc. 54(1): 48�53.CHAMINADE, P., BAILLET A. and FERRIER, D. (1998): Data treatment in nearinfrared spectroscopy. Analusis Mag., 26(4): M33�M38. CHEN, Y. and SØRENSEN, L.K. (2000): Determination of marker constituents in radixGlycyrrhizae and radix Notoginseng by near infrared spectroscopy. Fresenius J. Anal.Chem. 367(5): 491�496.CHEN, Y., THOSAR, S.S., FORBESS, R.A., KEMPER, M.S., RUBINOVITZ, R.L., andSHUKLA, A.J. (2001): Prediction of drug content and hardness of intact tablets usingartificial neural network and near infrared spectroscopy. Drug Dev. Ind. Pharm. 27(7):623�631.CHEVALLIER, A. (1996): The encyclopaedia of medicinal plants. Kindersley, D.London. CIURCZAK, E.W. (1998): Validation of spectroscopic methods in pharmaceuticalanalyses. Pharm. Techn. 22(3): 70, 92�102.CLEVE, E. BACH, E. SCHOLLMEYER, E. (2000): Using chemometric methods andNIR spectrophotometry in the textile industry. Anal. Chim. Acta 420(2): 163�167.COMMISSION DIRECTIVE. (1991): Directive 91/356/EEC of 13 June 1991 layingdown the principles and guidelines of good manufacturing practice for medicinalproducts for human use. Official Journal of the European Communities. L293, 0030�0033.COMMISSION OF THE EUROPEAN COMMUNITIES. (2002): Proposal for aDirective of the European Parliament and of the Council amending the Directive2001/83/EC as regards traditional herbal medicinal products 2002/0008 (COD). OfficialJournal of the European Communities. C126 E/263.CONNES, P. (1984): Early history of Fourier transform spectroscopy. Infrared Phys. 24(2/3): 69�93.CORTI, P., CERAMELLI, G., DREASSI, E. and MATTI, S. (1999): Near infraredtransmittance analysis for the assay of solid pharmaceutical dosage forms. Analyst,124(5): 755�758.COUNCIL AND EUROPEAN PARLIAMENT. (1989): Council Directive 89/397/ EECof 14 June 1989 on the official control of foodstuffs. Official Journal of the EuropeanCommunities. L186, 23�26.COUNCIL AND EUROPEAN PARLIAMENT. (2001): Directive 2001/83/EC of theEuropean parliament and of the council of 6 November 2001 on the Community coderelating to medicinal products for human use. Official Journal of the EuropeanCommunities. L311, 67�128.DASZYKOWSKI, M., WALCZACK, B., MASSART, D.L. (2003): Projection methodsin chemistry. Chem. Intel. Lab. Syst. 65(1): 97�112.DAVIES, T. (1998): The history of near infrared spectroscopic analysis: Past, present andfuture��From sleeping technique to the morning star of spectroscopy�. Analusis Mag.26(4): M17�M19.

58
DEMPSTER, M.A., MACDONALD, B.F., GEMPERLINE, P.J., ROYER, N.R. (1995):A near infrared reflectance analysis method for the non�invasive identification of film�coated and non�film�coated, blister�packed tablets. Anal. Chim. Acta. 310(1): 43�51.DOWNEY, G. and BOUSSION, J. (1996): Authentication of coffee bean variety bynear�infrared reflectance spectroscopy of dried extract. J. Sci. Food Agric. 71(1): 41�49.EBUBE, N.K., THOSAR, S.S., ROBERTS, R.A., KEMPER, M.S., RUBINOVITZ, R.,MARTIN, D.L., REIER, G.E., WHEATLEY, T.A. and SHUKLA, A.J. (1999):Application of Near infrared spectroscopy for nondestructive analysis of Avicel®powders and tablets. Pharm. Dev.Tech. 4(1): 19�26.EMEA, European agency for the evaluation of medicinal products (1994): ICH QualityGuideline Q2A: Note for the guidance on validation of analytical methods: definitionsand terminology. CPMP/ICH/381/95.EMEA, European agency for the evaluation of medicinal products (1996): ICH QualityGuideline. Q2B: Validation of analytical procedures: methodology. CPMP/ICH/281/95.EMEA, European agency for the evaluation of medicinal products (1999): Report fromthe ad hoc working group on herbal medicinal products 1997/1998.EMEA/HMPWP/25/99. EMEA, European agency for the evaluation of medicinal products (2001a): Note for theguidance on specifications: test procedures and acceptance criteria for herbal drugs,herbal drug preparations and herbal medicinal products, EMEA/CVMP/815/00. EMEA, European agency for the evaluation of medicinal products (2001b): Note forguidance on quality of herbal medicinal products, EMEA/CVMP/814/00.EMEA, European agency for the evaluation of medicinal products (2001b): Guideline onthe use of near infrared spectroscopy by the pharmaceutical industry and the data to beforwarded in part ii of the dossier for a marketing authorisation. CPMP/ QWP/ 3309�01.EMEA, European agency for the evaluation of medicinal products (2002): Points toconsider on the good agricultural and collection practice for raw materials of herbalorigin. EMEA/HMPVP/31/99 Rev.3.EMEA, European agency for the evaluation of medicinal products (2003): Note forguidance on the use of near infrared spectroscopy by the pharmaceutical industry and thedata requirements for new submissions and variations. CPMP/ QWP/ 3309�01.ERIKSSON, L., TRYGG, J., JOHANSSON, E., BRO, R. and WOLD S. (2000):Orthogonal signal correction, wavelet analysis, and multivariate calibration ofcomplicated process fluorescence data. Anal. Chim. Act. 420(2): 181�195.ERMER, J. (2001): Validation in the pharmaceutical analysis. Part I: An integratedapproach. J. Pharm. Biomed. Anal. 24(5�6): 755�767.EUROPEAN PARLIAMENT. (2002): Report on the proposal for a directive of theEuropean Parliament and of the Council amending the Directive 2001/83/EC as regardstraditional herbal medicinal products A5�0365/2002.EUROPEAN PHARMACOPOEIA. (1997): Methods of Analysis, 2.2.40. Near�infraredSpectrometry. European Pharmacopoeia, 3d edition, Council of Europe, Strasbourg. EUROPEAN PHARMACOPOEIA. (2002): European Pharmacopea, Council andEuropean Parliament, 4th edition, Strasbourg.

59
FELLGETT, P.B. (1984): Three concepts make a million points. Infrared Phys. 24 (2/3):95�98.FORBES, R.A., MAC GARVEY, B.M. and SMITH, D.R. (1999): Measurement ofresidual isopropyl alcohol in loracarbef by near infrared reflectance spectroscopy. Anal.Chem. 71(6): 1232�1239.FRAKE, P., GILL, I., LUSCOMBE, C.N., RUDD. D.R., WATERHOUSE, J. andJAYASOORIYA, U.A. (1998): Near�infrared mass median particle size determination oflactose monohydrate, evaluating several chemometric approaches. Analyst. 123 (10):2043�2046.FROST, R.L., FREDERICKS, P.M. and BARTLETT, J.R. (1993): Fourier transformRaman spectroscopy of kandite clays. Spectrochimica Acta. 49A(5/6): 667�674.GERHÄUSSER, C.I. and KOVAR K.�A. (1997): Strategies for constructing near�infrared spectral libraries for the identification of drug substances. Appl. Spectrosc.51(10): 1504�1510.GLASER, V. (1999): Billion�dollar market blossoms as botanicals take root. Nat.Biotech. 17(1): 17�18. HAALAND, D.M. and THOMAS, E.V. (1988): Partial least�square methods for spectralanalysis. 1. Relation to other quantitative calibration methods and the extraction ofqualitative information. Anal. Chem. 60 (11): 1193�1202.HAILEY, P.A., DOHERTY, P., TAPSELL, P., OLIVER, T., ALDRIDGE, P.K. (1996):Automated system for the on�line monitoring of powder blending processes using near�infrared spectroscopy. Part I: System development and control. J. Pharm. Biomed. Anal.14(5): 551�559.HAN, S.M. and FAULKNER, P.G. (1996): Determination of SB 2126469�S duringtablet production using near�infrared reflectance spectroscopy. J. Pharm. Biomed. Anal.14(12):1681�1689.HOSTETTMANN, K., MARSTON, A. and HOSTETTMANN, M. (1998): Preparativechromatography techniques. Applications in natural product isolation. Springer�Verlag,Berlin, Heidelberg.HUIE, C.W. (2002): A review of modern sample�preparation techniques for theextraction and analysis of medicinal plants. Anal. Bioanal. Chem. 373(1�2):23�30.ISAKSSON, T. and NAES, T. (1988): The effect of multiplicative scatter correction(MSC) and linearity improvement in NIR spectroscopy. Appl. Spectrosc. 42(7): 1273�1284.IWAMOTO, M. and KAWANO, S. (1992): Advantages and disadvantages of NIRapplications for the food industry. Making Light work: Advances in near infraredspectroscopy. Murray I. and Cowe I.A. Eds., VCH Weinheim, New York, Basel,Cambridge.JACQUINOT, P. (1984): How the search for a throughput advantage led to Fouriertransform spectroscopy. Infrared Phys. 24 (2/3): 99�101.KRÄMER, K. and EBEL, S. (2000): Application of NIR reflectance spectroscopy foridentification of pharmaceutical excipients Anal. Chim. Acta. 420(2): 155�161

60
KUDO, M., MOFFAT, A.C. and WATT, R.A. (1997): The rapid characterization ofnatural products and herbal medicines by near infrared spectroscopy. J. Pharm.Pharmacol. 50(supplement): 258.LAST, I.R. and PREBBLE, K.A.(1993): Suitability of near infrared methods for thedetermination of moisture in a freeze�dried injection product containing differentamounts of the active ingredient. J. Pharm. Biomed. Anal. 11(11�12): 1071�1076.LAVINE, B. K. (1998): Chemometrics. Anal. Chem. 70(12): 209R�228R.LEIPER, K., VESSMAN, J. and VAN DER VLIES, C. (1998): Reader´s tribunes: issuesrelating to the establishment of validation guidelines for material identification usingNIR. Pharmeuropa. 10(3): 468�470. LI, W., TSANG, Y. M., LEE, F.S.C., LEUNG, H.W., and WANG, X. (2001):Development of near�infrared diffuse reflectance spectroscopy for rapid screening andauthentication of Chinese materia medica. Anal. Sci., 17(Suppl.): a439�a442.LOWRY, S.R., HYATT, J. and MACCARTHY, W.J. (2000): Determination of thewavelength accuracy in the near infrared spectral region based on NIST´s infraredtransmission wavelength standard SRM 1921. Appl. Spectros. 54(3): 450�455.MACDONALD, B.F. and PREBBLE, K.A.J. (1993): Some applications of near�infraredreflectance analysis in the pharmaceutical industry. J. Pharm. Biomed. Anal. 11(11�12):1077�1085. MARK, H., RITCHIE, G.E., ROLLER, R.W., CIURCZAK, E.W., TSO, C. andMACDONALD, S.A. (2001): Validation of a near infrared transmission spectroscopicprocedure, part A: Validation protocols. J. Pharm. Biomed. Anal. 28(2): 251�260.MASSART, D.L.; VANDEGINSTE, B.G. M.; DEMING, S.N.; MICHOTTE, Y.;KAUFMAN, L. (1988): Chemometrics: a Textbook. Elsevier Science, New York.MICHELSON, A.A. (1891b): On the application of interference�methods tospectroscopic measurements. Phil. Mag. 31(191): 338�346.MICHELSON, A.A. (1890): On the application of interference methods to astronomicalmeasurement. Phil. Mag. 30(182): 1�21.MICHELSON, A.A. (1891a): Visibility of the interference fringes at the focus of atelescope. Phil. Mag. 31(191): 256�259.MOFFAT, A.C., TRAFFORD, A.D., JEE, R.D. and GRAHAM P. (2000): Meeting theInternational Conference on Harmonisation�s guidelines on validation of analyticalprocedures: Quantification as exemplified by a near�infrared reflectance assay ofparacetamol in intact tablets. Analyst, 125(7): 1341�1351.MOLT, K., ZEYEN, F. and PODPETSCHNING�FOPP, E. (1997): Quantitative NIR�Spektrometrie am Beispiel der Bestimmung des Sennosidgehalts in Pflanzlicher Matrix.Pharmazie, 52(12): 931�937.MONFRE, S.L. and BRIMMER, P.J. (1996): Qualitative near infrared analysis ofpharmaceuticals using principal component based spectral comparison: Some practicalexamples. Near Infrared Spectroscopy: The Future Waves. Davies A.M.C. and WilliamsP. Eds., NIR publications, Chichester.NAM, National Agency of Medicines in Finland. (2002): Herbal medicinal products.www.nam.fi/english/information/semimedicinal_products/index.html

61
NIELSEN, H.H. (1942): The near-infrared spectrum of water vapor. Part II. The parallelbands ν3, ν1 + ν3, ν2 + ν3 and the perpendicular bands ν1. Phys. Rev., 62, 422�433.O´NEIL, A.J., JEE, R.D. and MOFFAT, A.C. (1998): The application of multi linearregression to the measurement of the median particle size of drugs and pharmaceuticalexcipients by near infrared spectroscopy. Analyst, 123(11): 2297�2302.OSBORNE, B.G., FEARN, T. and HINDLE, P.H. (1993): Practical NIR spectroscopywith applications in food and beverage analysis, 2nd edition, Longman, Harlow.PARISI, A.F. NOGUEIRAS, L. and PRIETO, H. (1990): On�line determination of fuelquality parameters using near infrared spectrometry with fibers optics and multivariatecalibration. Anal. Chim. Acta. 238(1): 95�100.PERKINS, W.D. (1986): Topics in chemical instrumentation. Fourier Transform�Infrared spectroscopy. Part I. Instrumentation. J. Chem. Educ., 63(1): A5�A10PERKINS, W.D. (1987): Topics in chemical instrumentation. Fourier Transform�Infrared spectroscopy. Part II. Advantages of FT�IR. J. Chem. Educ., 64(11): A269�A271.PHARMACOPEIAL FORUM (1998): <1119> Near�infrared spectrophotometry. 24(4):6463�6473.PLUGGE, W. and VAN DER VLIES, C. (1993): Near infrared spectroscopy as analternative to assess compliance of ampicillin trihydrate with compendial specifications.J. Pharm. Biomed. Anal., 11(6): 435�442.RAGER, I., ROOS, G., SCHMIDT, P.C. and KOVAR K.A. (2002): Rapid quantificationof constituents in St. John�s wort extracts by NIR spectroscopy. J. Pharm. Biomed. Anal.28(3�4): 439�446.RAMIREZ, J.L., BELLAMY, M.K. and ROMAÑACH R.J. (2001): A novel method foranalyzing thick tablets by near infrared spectroscopy. Pharm. Sci. Techn. 2(3): e11. RANTANEN, J. and YLIRUUSI, J. (1998): Determination of particle size in a fluidized�bed granulator with a near infrared set�up. Pharm. Pharmacol. Commun. 4(2): 73�75. RANTANEN, J., ANTIKAINEN, O., MANNERMAA, J.�P. and YLIRUUSI, J. (2000a):Use of the near�infrared reflectance method for measurement of moisture content duringgranulation. Pharm. Dev. Tech. 5(2): 209�217. RANTANEN, J., RÄSÄNEN, E., TENHUNEN, J., KANSAKOSKI, M.,MANNERMAA, J.�P. and YLIRUUSI, J. (2000b): In�line moisture measurement duringgranulation with a four�wavelength near infrared sensor: an evaluation of particle sizeand binder effects. Eur. J. Pharm. Biopharm. 50(2): 271�276.RANTANEN, J., JORGENSEN, A., RÄSÄNEN, E., LUUKKONEN, P., AIRAKSINEN,S., RAIMAN, J., HAENNINEN, K., ANTIKAINEN, O. and YLIRUUSI, J. (2001):Process analysis of fluidized bed granulation. Pharm. Sci. Techn. 2(4): e21.REEVES, J.B. and ZAPF, C.M. (1999): Spectral library searching: Mid�infrared versusnear�infrared spectra for classification of powdered food ingredient. Appl. Spectrosc.53(7): 836�844. REN G. and CHEN F. (1999): Simultaneous Quantification of Ginsenosides in AmericanGinseng (Panax quinquefolium) Root Powder by Visible/Near�Infrared ReflectanceSpectroscopy. J. Agric. Food Chem. 47(7): 2771�2775.

62
RULES GOVERNING MEDICINAL PRODUCTS IN THE EUROPEAN UNION.(1998): Good Manufacturing Practices. Medicinal Products for human and veterinary use.Annex �Manufacture of herbal medicinal products. Eudralex collection. 4(Annex 7):101�103.SASIC, S. and OZAKI, Y. (2001): Short�wave near�Infrared spectroscopy of biologicalfluid. 1. Quantitative analysis of fat, protein, and lactose in raw milk by partial LeastSquares regression and band assignment. Anal. Chem. 73(1): 64�71.SAVISTZKY, A. and GOLAY, M.J.E., (1964): Smoothing and differentiation of data bysimplified Least Squares procedures. Anal. Chem. 36(8): 1627�1639.SCHILLING, D., BARTH, G., MÜLCHI, M. and DAMMERTZ, W. (1996): Advantagesof near infrared transmission measurement for the analysis of intact pharmaceuticaltablets. Near Infrared Spectroscopy: The Future Waves. Davies A.M.C. and Williams P.Eds., NIR publications, Chichester.SCHULZ, H., ENGELHARDT, U.H., WEGENT, A., DREWS, H.�H. andLAPCZYNSKI, S. (1999): Application of near�infrared reflectance spectroscopy to thesimultaneous prediction of alkaloids and phenolic substances in green tea leaves. J. Agric.Food Chem. 47(12): 5064�5067.SCHULTZ, H., PFEFFER, S., QUILITZSCH, R., STEUER, B. and REIF, K. (2002):Rapid and non�destructive determination of the echinacoside content in Echinacea rootsby ATR�IR and NIR spectroscopy. Planta Med. 68(10): 926�929.SEKULIC, S.S., WARD, H.W., BRANNEGAN, D.R., STANLEY, E.D., EVANS, C.L.,SCIAVOLINO, S.T., HAILEY, P.A. and ALDRIDGE, P.K. (1996): On�line monitoringof powder blend homogeneity by near�infrared spectroscopy. Anal. Chem. 68(3): 509�513.SETTLE, A.F. (1997): handbook of instrumental techniques for analytical chemistry.Prentice�Hall Inc., New Jersey.SMITH, B.C. (1996): Fundamentals of Fourier Transform infrared spectroscopy. CRCPress, Florida.SMITH, G.D. and PALMER, R.A. (2002): Fast Time�resolved Mid�infraredSpectroscopy Using an Interferometer, Time�resolved Spectroscopy, Handbook ofvibrational spectroscopy, Chalmers J. M. and Griffiths P. R. Eds., John Wiley & SonsLtd, Chichester.SNYDER, L.R., KIRKLAND, J.J., GLACH, J.L., (1997): Practical HPLC methoddevelopment. 2nd Edition, John Wiley & Sons Ltd, New York.SOWA, M.G., PAYETTE, J.R. and MANTSCH, H.H. (1999): Near�infraredspectroscopic assessment of tissue hydration following surgery. J. Surg. Res. 86(1): 62�69.STEINHOFF, B. (1998): The ESCOP Monographs, Eur. Phytojournal 1: 59�62. STEUER, B., SCHULZ, H., LAEGER, E. (2001): Classification and analysis of citrusoils by NIR spectroscopy. Food Chem. 72 (1): 113�117.STORDRANGE, L., LIBNAU, F. O., MALTHE�SØRENSSEN, D. and KVALHEIM,O.M. (2002): Feasibility study of NIR for surveillance of a pharmaceutical process,including a study of different preprocessing techniques. J. Chemom. 16 (8�10): 529�541.

63
SVENSSON, O., JOSEFSON, M. and LANGKILDE, F.W. (1997): Classification ofchemically modified celluloses using a near�infrared spectrometer and soft independentmodeling of class analogies. Appl. Spectrosc. 51(12): 1826�1835.SWEAT, J.A. and WETZEL, D.L. (2001): Near�infrared acousto�optic tunable filterbased instrumentation for the measurement of dynamic spectra of polymers. Rev. Sci.Instrum. 72(4): 2153�2158.TENENHAUS, M. (1998): La regression PLS, Theorie et pratique. Editions Technip,Paris.THOSAR, S.S., FORBESS, R.A., EDUBE, N.K., CHEN, Y., RUBINOVITZ, R.L.,KEMPER, M.S., REIER, G.E., WHEATLEY, T.A. and SHUKLA, A.J. (2001): Acomparison of reflectance and transmittance near�infrared spectroscopic techniques indetermining drug content in tablets. Pharm. Dev. Tech. 6(1): 19�29.TRAFFORD, A.D., JEE, R.D., MOFFAT, A.C. and GRAHAM. P. (1999): A rapidquantitative assay of intact paracetamol tablets by reflectance near�infrared spectroscopy.Analyst. 124 (2): 163�167.TRAIN, D. (1956): An investigation into the compaction of powders. J. Pharm.Pharmacol. 8, 745�761.USP, United States Pharmacopeia (1998): <851>General Chapter Spectrophotometry andLight�Scattering, Volume XXIV, number 4, United States Pharmacopeial Convention,Rockville, MD.USP, United States Pharmacopeia. (2002): <1119> Near�infrared spectrophotometry.Volume XXV, 2nd supplement, United States Pharmacopeial Convention, Rockville, MD.WANG, Q., DEJESUS, S., CONZEN, J.P., SCHMIDT, A. and WEILER, H. (1998):Calibration transfer in near infrared analysis of liquids and solids. J. Near InfraredSpectrosc. 6 (1�4): A 201�A205.WARGO, D.J. and DRENNEN, J.K. (1996): Near infrared spectroscopic characterizationof pharmaceutical powder blends. J. Pharm. Biomed. Anal. 14(11): 1415�1423. WATT, R. (1999): The characterisation of herbal natural products�NIR spectroscopyback to its roots. Eur. Pharm. Rev. 4(2): 15�19.WETZEL, D. (1983): Near Infrared reflectance spectroscopy. Sleeper amongspectroscopic techniques. Anal. Chem., 55 (12): 1165A�1176A.WHO, World Health Organization, (1998): Regulatory situation of herbal medicines. Aworldwide review, Geneva, WHO/TRM/98.1.WHO, World Health Organization, (1999): WHO monographs on selected medicinalplants, Geneva.WILKS, P.A. (1986): Infrared in the real world: FT�IR versus filter IR in processmonitoring. Spectrosc. 1(4): 42�3.WILLIAMS, S. and MAC PETERS, H.L. (1991): NIR spectroscopy in real time analysisof polymer melt process. Making Light work: Advances in near infrared spectroscopy.Ian Murray and Ian A. Cowe, Eds., VCH Weinheim, New York, Basel, Cambridge.WOLD, S. (1987): Principal Component Analysis. Chem. Int. Lab. Syst. 2(1�3): 37�52.WOLD S. and SJÖSTRÖM M. (1998): Chemometrics, present and future success. Chem.Int. Lab. Syst. 44 (1, 2): 3�14.
64
WOLD, S., SJOSTROM, M. and ERIKSSON L. (2001): PLS�regression: a basic tool ofchemometrics. Chem. Int. Lab. Syst. 58(2): 109�130.WOO, Y.A., KIM, H.J., CHO, J.H and CHUNG H. (1999a): Discrimination of herbalmedicines according to geographical origin with near infrared reflectance spectroscopyand pattern recognition techniques. J. Pharm. Biomed. Anal. 21 (2): 407�413.WOO, Y.A., KIM, H.J. and CHO, J.H. (1999b): Identification of herbal medicines usingpattern recognition techniques with near�infrared reflectance spectra Microchem. J.63(1): 61�70.WOO, Y.A., CHO, C.H., KIM, H.J., YANG, J.S. and SEONG, K.Y. (2002):Classification of cultivation area of ginseng by near infrared spectroscopy and ICP�AES,Microchem. J. 73(3): 299�306.YOON, W.L. and MOFFAT, A.C. (1998): Optimization of sample presentation for thenear infra-red spectra of pharmaceutical excipients. Analyst, 123(5): 1029�1034.ZURADA, J.M. (1992): An introduction to artificial neural systems. West, Saint Paul,Minnesota.