Embed Size (px)
Citation preview
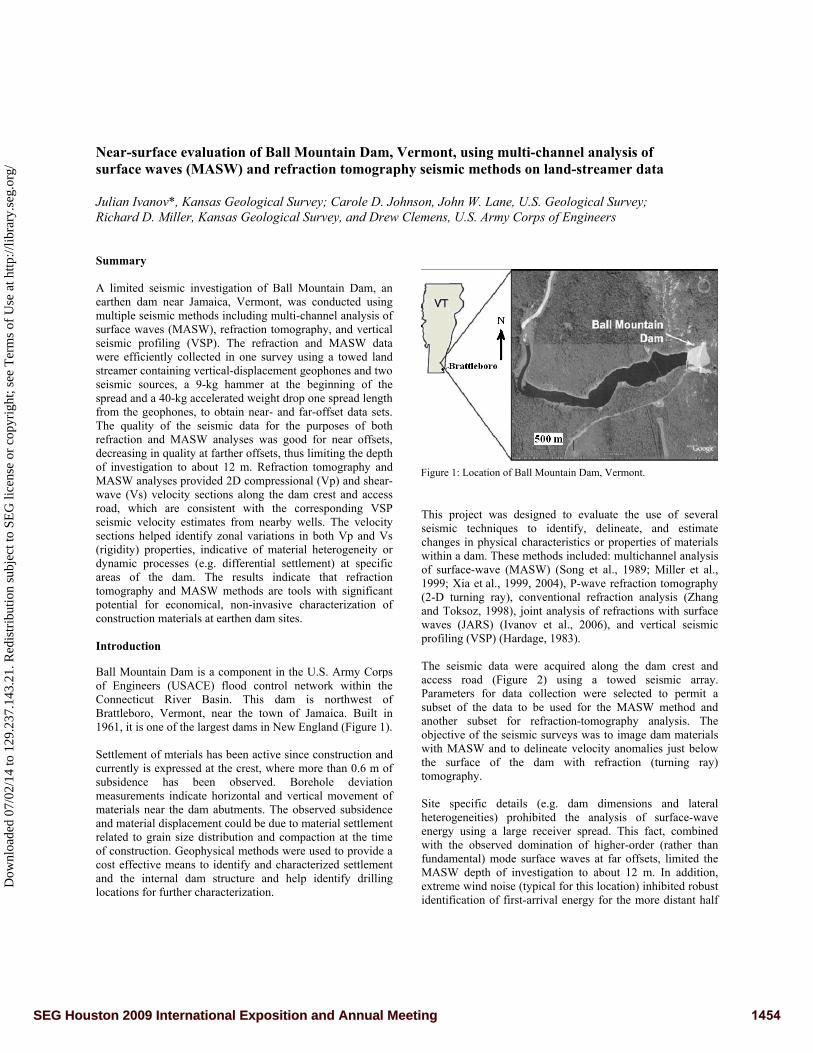
Near-surface evaluation of Ball Mountain Dam, Vermont, using multi-channel analysis of surface waves (MASW) and refraction tomography seismic methods on land-streamer data Julian Ivanov*, Kansas Geological Survey; Carole D. Johnson, John W. Lane, U.S. Geological Survey; Richard D. Miller, Kansas Geological Survey, and Drew Clemens, U.S. Army Corps of Engineers Summary A limited seismic investigation of Ball Mountain Dam, an earthen dam near Jamaica, Vermont, was conducted using multiple seismic methods including multi-channel analysis of surface waves (MASW), refraction tomography, and vertical seismic profiling (VSP). The refraction and MASW data were efficiently collected in one survey using a towed land streamer containing vertical-displacement geophones and two seismic sources, a 9-kg hammer at the beginning of the spread and a 40-kg accelerated weight drop one spread length from the geophones, to obtain near- and far-offset data sets. The quality of the seismic data for the purposes of both refraction and MASW analyses was good for near offsets, decreasing in quality at farther offsets, thus limiting the depth of investigation to about 12 m. Refraction tomography and MASW analyses provided 2D compressional (Vp) and shear-wave (Vs) velocity sections along the dam crest and access road, which are consistent with the corresponding VSP seismic velocity estimates from nearby wells. The velocity sections helped identify zonal variations in both Vp and Vs (rigidity) properties, indicative of material heterogeneity or dynamic processes (e.g. differential settlement) at specific areas of the dam. The results indicate that refraction tomography and MASW methods are tools with significant potential for economical, non-invasive characterization of construction materials at earthen dam sites. Introduction Ball Mountain Dam is a component in the U.S. Army Corps of Engineers (USACE) flood control network within the Connecticut River Basin. This dam is northwest of Brattleboro, Vermont, near the town of Jamaica. Built in 1961, it is one of the largest dams in New England (Figure 1). Settlement of mterials has been active since construction and currently is expressed at the crest, where more than 0.6 m of subsidence has been observed. Borehole deviation measurements indicate horizontal and vertical movement of materials near the dam abutments. The observed subsidence and material displacement could be due to material settlement related to grain size distribution and compaction at the time of construction. Geophysical methods were used to provide a cost effective means to identify and characterized settlement and the internal dam structure and help identify drilling locations for further characterization.
Figure 1: Location of Ball Mountain Dam, Vermont.
This project was designed to evaluate the use of several seismic techniques to identify, delineate, and estimate changes in physical characteristics or properties of materials within a dam. These methods included: multichannel analysis of surface-wave (MASW) (Song et al., 1989; Miller et al., 1999; Xia et al., 1999, 2004), P-wave refraction tomography (2-D turning ray), conventional refraction analysis (Zhang and Toksoz, 1998), joint analysis of refractions with surface waves (JARS) (Ivanov et al., 2006), and vertical seismic profiling (VSP) (Hardage, 1983). The seismic data were acquired along the dam crest and access road (Figure 2) using a towed seismic array. Parameters for data collection were selected to permit a subset of the data to be used for the MASW method and another subset for refraction-tomography analysis. The objective of the seismic surveys was to image dam materials with MASW and to delineate velocity anomalies just below the surface of the dam with refraction (turning ray) tomography. Site specific details (e.g. dam dimensions and lateral heterogeneities) prohibited the analysis of surface-wave energy using a large receiver spread. This fact, combined with the observed domination of higher-order (rather than fundamental) mode surface waves at far offsets, limited the MASW depth of investigation to about 12 m. In addition, extreme wind noise (typical for this location) inhibited robust identification of first-arrival energy for the more distant half
1454SEG Houston 2009 International Exposition and Annual Meeting
Dow
nloa
ded
07/0
2/14
to 1
29.2
37.1
43.2
1. R
edis
trib
utio
n su
bjec
t to
SEG
lice
nse
or c
opyr
ight
; see
Ter
ms
of U
se a
t http
://lib
rary
.seg
.org
/
Ball Mntn Dam evaluation using seismic
of the far-offset spread, limiting the maximum refraction tomography depth of investigation to 15-20 m. Data Acquisition A 24-channel Geometrics Geode seismograph was used for all data acquisition. MASW and turning ray tomography data were acquired using a towed array of geophones (Miller et al., 2003). Twenty four Geospace Technologies 4.5-Hz geophones connected to steel shoes on a fire hose were towed behind an SUV. Receiver spacing was 1.25 m and the total spread length was 28.75 m. Data were acquired using two source locations, one at a near-offset of 1.25 m and one at a far offset, (about 1-spread-length) offset of 30 m. Three individual shot records were
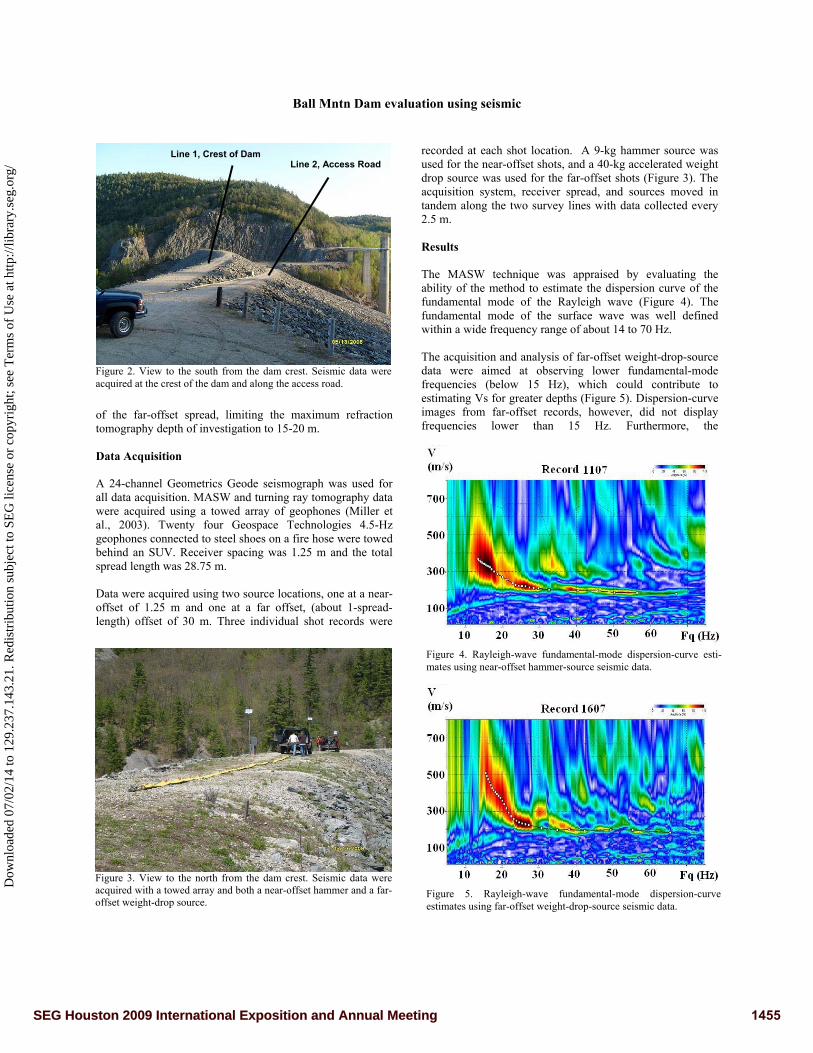
recorded at each shot location. A 9-kg hammer source was used for the near-offset shots, and a 40-kg accelerated weight drop source was used for the far-offset shots (Figure 3). The acquisition system, receiver spread, and sources moved in tandem along the two survey lines with data collected every 2.5 m.
Figure 2. View to the south from the dam crest. Seismic data were acquired at the crest of the dam and along the access road.
Line 1, Crest of Dam Line 2, Access Road
Results The MASW technique was appraised by evaluating the ability of the method to estimate the dispersion curve of the fundamental mode of the Rayleigh wave (Figure 4). The fundamental mode of the surface wave was well defined within a wide frequency range of about 14 to 70 Hz. The acquisition and analysis of far-offset weight-drop-source data were aimed at observing lower fundamental-mode frequencies (below 15 Hz), which could contribute to estimating Vs for greater depths (Figure 5). Dispersion-curve images from far-offset records, however, did not display frequencies lower than 15 Hz. Furthermore, the
Figure 4. Rayleigh-wave fundamental-mode dispersion-curve esti-mates using near-offset hammer-source seismic data.
Figure 3. View to the north from the dam crest. Seismic data wereacquired with a towed array and both a near-offset hammer and a far-offset weight-drop source.
Figure 5. Rayleigh-wave fundamental-mode dispersion-curveestimates using far-offset weight-drop-source seismic data.
1455SEG Houston 2009 International Exposition and Annual Meeting
Dow
nloa
ded
07/0
2/14
to 1
29.2
37.1
43.2
1. R
edis
trib
utio
n su
bjec
t to
SEG
lice
nse
or c
opyr
ight
; see
Ter
ms
of U
se a
t http
://lib
rary
.seg
.org
/
Ball Mntn Dam evaluation using seismic
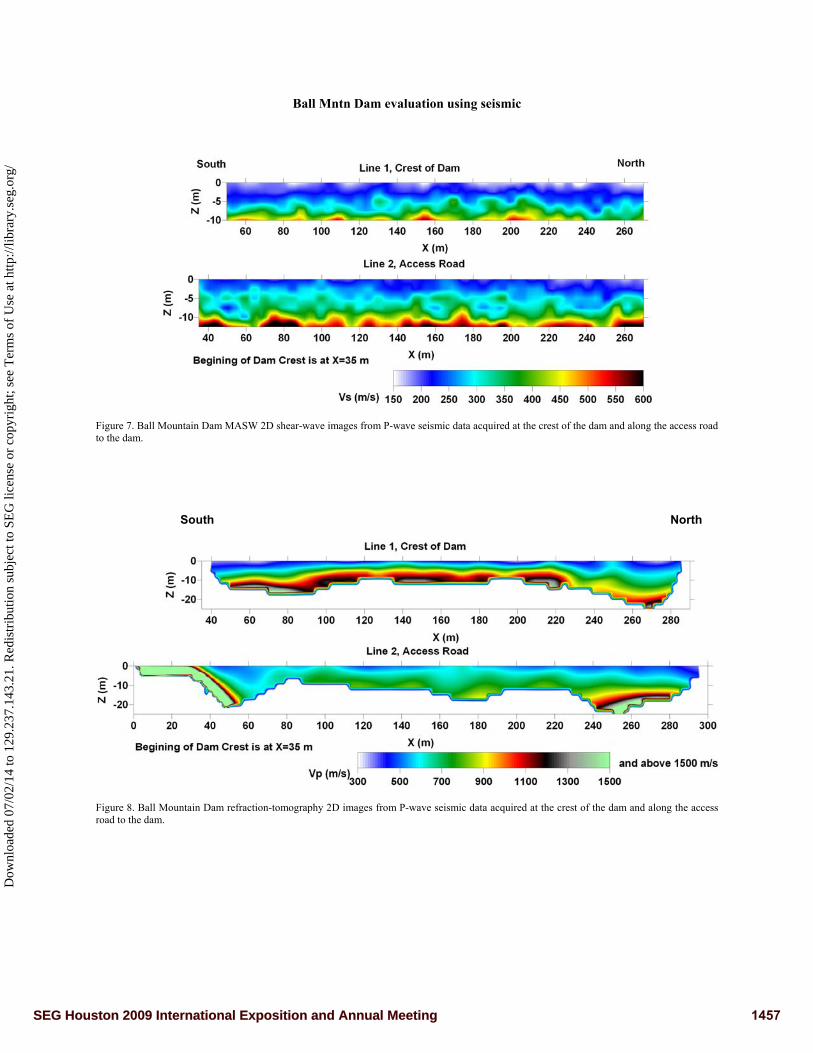
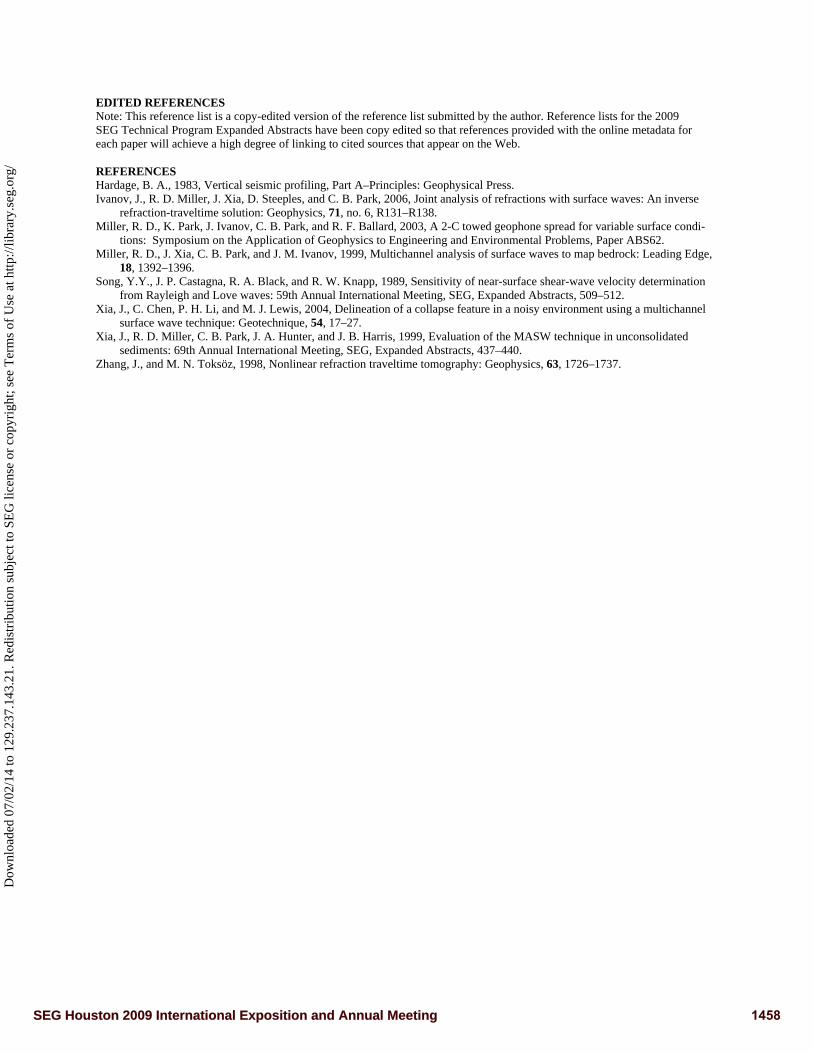
Two anomalous low-velocity zones are observed at the north and south ends of the dam on both Vs and Vp sections between 40-60 m and 220-270 m and at depths of 0-8 m for the Vs sections (Figure 7) and 0-11 and 0-18 m, respectively, for the Vp sections (Figure 8). The low-velocity Vs anomalies are more pronounced on the access-road line at 40-60 m and 225-250 m. Low-velocity anomalies also are seen in the Vp profile on the access road (line 2) at 40-70 m and to a lesser degree at 240-290 m. The appearance of these anomalies on both (semi-parallel) seismic lines supports the interpretation that several aerially extensive structural anomalies exist within the body of the dam.
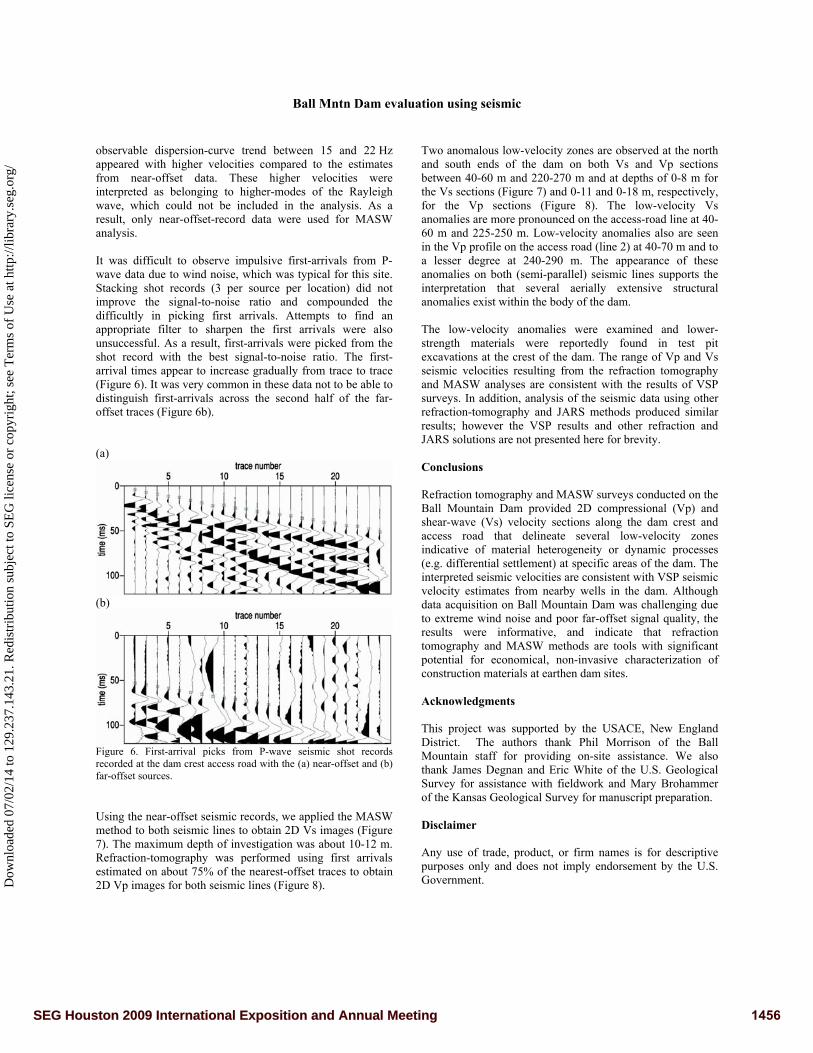
observable dispersion-curve trend between 15 and 22 Hz appeared with higher velocities compared to the estimates from near-offset data. These higher velocities were interpreted as belonging to higher-modes of the Rayleigh wave, which could not be included in the analysis. As a result, only near-offset-record data were used for MASW analysis. It was difficult to observe impulsive first-arrivals from P-wave data due to wind noise, which was typical for this site. Stacking shot records (3 per source per location) did not improve the signal-to-noise ratio and compounded the difficultly in picking first arrivals. Attempts to find an appropriate filter to sharpen the first arrivals were also unsuccessful. As a result, first-arrivals were picked from the shot record with the best signal-to-noise ratio. The first-arrival times appear to increase gradually from trace to trace (Figure 6). It was very common in these data not to be able to distinguish first-arrivals across the second half of the far-offset traces (Figure 6b).
The low-velocity anomalies were examined and lower-strength materials were reportedly found in test pit excavations at the crest of the dam. The range of Vp and Vs seismic velocities resulting from the refraction tomography and MASW analyses are consistent with the results of VSP surveys. In addition, analysis of the seismic data using other refraction-tomography and JARS methods produced similar results; however the VSP results and other refraction and JARS solutions are not presented here for brevity.
(a) Conclusions
Refraction tomography and MASW surveys conducted on the Ball Mountain Dam provided 2D compressional (Vp) and shear-wave (Vs) velocity sections along the dam crest and access road that delineate several low-velocity zones indicative of material heterogeneity or dynamic processes (e.g. differential settlement) at specific areas of the dam. The interpreted seismic velocities are consistent with VSP seismic velocity estimates from nearby wells in the dam. Although data acquisition on Ball Mountain Dam was challenging due to extreme wind noise and poor far-offset signal quality, the results were informative, and indicate that refraction tomography and MASW methods are tools with significant potential for economical, non-invasive characterization of construction materials at earthen dam sites.
(b)
Acknowledgments This project was supported by the USACE, New England District. The authors thank Phil Morrison of the Ball Mountain staff for providing on-site assistance. We also thank James Degnan and Eric White of the U.S. Geological Survey for assistance with fieldwork and Mary Brohammer of the Kansas Geological Survey for manuscript preparation.
Figure 6. First-arrival picks from P-wave seismic shot records recorded at the dam crest access road with the (a) near-offset and (b) far-offset sources.
Using the near-offset seismic records, we applied the MASW method to both seismic lines to obtain 2D Vs images (Figure 7). The maximum depth of investigation was about 10-12 m. Refraction-tomography was performed using first arrivals estimated on about 75% of the nearest-offset traces to obtain 2D Vp images for both seismic lines (Figure 8).
Disclaimer Any use of trade, product, or firm names is for descriptive purposes only and does not imply endorsement by the U.S. Government.
1456SEG Houston 2009 International Exposition and Annual Meeting
Dow
nloa
ded
07/0
2/14
to 1
29.2
37.1
43.2
1. R
edis
trib
utio
n su
bjec
t to
SEG
lice
nse
or c
opyr
ight
; see
Ter
ms
of U
se a
t http
://lib
rary
.seg
.org
/
Ball Mntn Dam evaluation using seismic
Figure 7. Ball Mountain Dam MASW 2D shear-wave images from P-wave seismic data acquired at the crest of the dam and along the access road to the dam. South North
Figure 8. Ball Mountain Dam refraction-tomography 2D images from P-wave seismic data acquired at the crest of the dam and along the access road to the dam.
1457SEG Houston 2009 International Exposition and Annual Meeting
Dow
nloa
ded
07/0
2/14
to 1
29.2
37.1
43.2
1. R
edis
trib
utio
n su
bjec
t to
SEG
lice
nse
or c
opyr
ight
; see
Ter
ms
of U
se a
t http
://lib
rary
.seg
.org
/
EDITED REFERENCES Note: This reference list is a copy-edited version of the reference list submitted by the author. Reference lists for the 2009 SEG Technical Program Expanded Abstracts have been copy edited so that references provided with the online metadata for each paper will achieve a high degree of linking to cited sources that appear on the Web. REFERENCES Hardage, B. A., 1983, Vertical seismic profiling, Part A–Principles: Geophysical Press. Ivanov, J., R. D. Miller, J. Xia, D. Steeples, and C. B. Park, 2006, Joint analysis of refractions with surface waves: An inverse
refraction-traveltime solution: Geophysics, 71, no. 6, R131–R138. Miller, R. D., K. Park, J. Ivanov, C. B. Park, and R. F. Ballard, 2003, A 2-C towed geophone spread for variable surface condi-
tions: Symposium on the Application of Geophysics to Engineering and Environmental Problems, Paper ABS62. Miller, R. D., J. Xia, C. B. Park, and J. M. Ivanov, 1999, Multichannel analysis of surface waves to map bedrock: Leading Edge,
18, 1392–1396. Song, Y.Y., J. P. Castagna, R. A. Black, and R. W. Knapp, 1989, Sensitivity of near-surface shear-wave velocity determination
from Rayleigh and Love waves: 59th Annual International Meeting, SEG, Expanded Abstracts, 509–512. Xia, J., C. Chen, P. H. Li, and M. J. Lewis, 2004, Delineation of a collapse feature in a noisy environment using a multichannel
surface wave technique: Geotechnique, 54, 17–27. Xia, J., R. D. Miller, C. B. Park, J. A. Hunter, and J. B. Harris, 1999, Evaluation of the MASW technique in unconsolidated
sediments: 69th Annual International Meeting, SEG, Expanded Abstracts, 437–440. Zhang, J., and M. N. Toksöz, 1998, Nonlinear refraction traveltime tomography: Geophysics, 63, 1726–1737.
1458SEG Houston 2009 International Exposition and Annual Meeting
Dow
nloa
ded
07/0
2/14
to 1
29.2
37.1
43.2
1. R
edis
trib
utio
n su
bjec
t to
SEG
lice
nse
or c
opyr
ight
; see
Ter
ms
of U
se a
t http
://lib
rary
.seg
.org
/