Embed Size (px)
Citation preview

Revised manuscript submitted to Cold Regions Science and Technology July 1, 2001 NEAR-SURFACE FACETED CRYSTALS, AVALANCHES AND
CLIMATE IN HIGH-ELEVATION, TROPICAL MOUNTAINS
OF BOLIVIA
Douglas Hardy Climate Systems Research Center and
Department of Geosciences University of Massachusetts, Amherst MA USA
Mark W. Williams
Department of Geography and Institute of Arctic and Alpine Research
University of Colorado, Boulder CO USA
Carlos Escobar President, Bolivian Association of Mountain Guides
La Paz, Bolivia Corresponding Address Douglas R. Hardy Dept. of Geosciences University of Massachusetts Amherst MA 01003-5820 Tel: 802-649-1829 Fax: 413-545-1200 e-mail: [email protected]
Tropical Avalanches Hardy, Williams & Escobar
2
Abstract
The importance of near-surface faceted crystals in forming weak layers associated with snow
avalanches has recently received greater attention. However, there is still much to be learned
concerning the formation and growth of these crystal types, their geographical extent, and related
avalanche activity. Here we report on two avalanches that occurred during late September 1999
at high-elevations in the Bolivian Andes. Climbers released one slide at about 5,200 m in the
Cordillera Apolobamba (on El Presidente), which claimed two lives. Four days later and 200 km
to the southeast, snow scientists servicing a high-elevation meteorological site triggered another
at 6,300 m near the summit of Illimani (Cordillera Real). Both slab avalanches fractured through
25-50 cm of relatively new snow, with deeper pockets of wind redistributed snow. Snowpit
analyses on Illimani showed the avalanche ran on a thick layer of near-surface faceted crystals
overlying the austral winter dry-season snow surface. Average crystal size was 5-7 mm, and
individual crystals exceeded 10 mm in diameter. We evaluate local and regional meteorological
information in an effort to understand what caused the growth of these large crystals and the
resultant snowpack instability. Dust and chemistry profiles indicate that the crystal growth
occurred through the austral winter, prior to a snowfall event in the days prior to the avalanche.
Temperature profiles measured just above and just below the snow surface indicate that bi-
directional, large gradients of temperature and vapor pressure exist through the dry winter
season. Insights are offered regarding the avalanche hazard due to near-surface faceted crystal
growth in high-elevation areas of the Tropics, where avalanches are not generally recognized as
a significant hazard during the climbing season.
keywords: avalanches, avalanche formation, snow, snow stratigraphy, mountains
Tropical Avalanches Hardy, Williams & Escobar
3
1. Introduction
In late September 1999, climbers at high-elevations in the Bolivian Andes released at least
two slab avalanches, as snowfall and wind loading onto the dry-season snow surface may have
led to instability over a large region. Avalanches are not among the widely recognized hazards of
climbing in Bolivia, because the climbing season is heavily concentrated in the dry austral winter
months of May through September. Avalanches receive no mention in the most recent
publication on climbing in Bolivia (Brain, 1999), consistent with the opinion of a guide-in-
training recently that “[avalanches] don’t happen in Bolivia” (Arrington, 1999).
On 25 September 1999, two climbers triggered a slab avalanche at an elevation of 5,200 m
on Cerro Presidente, Cordillera Apolobamba, Bolivia (Table 1). One partial burial and one
complete burial resulted, and both climbers were killed. Two members of the party witnessed the
slide but were not involved. Four days after the avalanche on Cerro Presidente, we triggered a
slab release ~200 km to the southeast, at 6,300 m near the summit of Illimani (Cordillera Real),
while servicing a high-elevation meteorological station. Both slab avalanches followed lateral
fracture propagation through 25-75 cm of relatively new snow, with deeper pockets due to wind
redistribution (Table 1). Weather and snow conditions prior to the avalanches were similar on
Illimani and in the Apolobamba Range.
Analysis of a snowpit on Illimani, from a nearby and safe location, showed that the
avalanche ran on well-developed faceted crystals located just below the new snow. We evaluate
snowpit observations, along with local and regional meteorological information, in an effort to
understand what caused the growth of these large crystals and the resultant snowpack instability.
Insights are offered regarding the potential avalanche hazard in high-elevation areas of the

Tropical Avalanches Hardy, Williams & Escobar
4
Tropics, where avalanches are not generally recognized as a significant hazard during the
climbing season.
The growth of near-surface faceted crystals, and their role in the formation of weak layers
within the snowpack, has recently received attention by Birkeland et al. (1996, 1998). Birkeland
(1998) proposed the terminology “near-surface faceted crystals” as snow formed by near-surface
vapor pressure gradients resulting from temperature gradients near the snow surface.
Furthermore, he identified the predominant processes leading to the formation of near-surface
faceted crystals. This work has built upon considerable work investigating the growth of faceted
snow crystals in response to vapor pressure gradients resulting from temperature gradients,
primarily in basal snowpack layers (e.g., Akitaya, 1974; Marbouty, 1980; Colbeck, 1982; Sturm
and Benson, 1997). Research focusing upon the growth of faceted crystals close to the surface
has also demonstrated the importance of these gradients. Armstrong (1985) for example,
determined that faceted crystal growth is initiated when the vapor pressure gradient exceeds 5
hPa m-1. Birkeland et al. (1998) document bi-directional gradients five times larger, resulting in
very rapid growth of near-surface faceted crystals. In the latter case study, a significant weak
layer formed in less than 48 hours. Of importance to the understanding of near-surface faceted
crystal growth at high elevations is the mathematical treatment of the issue by Colbeck (1989),
who determined that formation could occur due to either temperature cycling or solar radiation
input – but that “…solar input definitely increases the sub-surface growth rate”.
2. Site description
The University of Massachusetts maintains two high-elevation meteorological stations near
the summits of Illimani and Sajama in Bolivia (Figure 1), as part of a project to better understand

Tropical Avalanches Hardy, Williams & Escobar
5
the climatic signal recorded by tropical ice cores. Each station has an array of sensors to measure
aspirated air temperature and humidity, pressure, wind speed and direction, solar radiation and
snow accumulation/ablation (distance to snow surface). Additional instrumentation on Sajama
provide measurement redundancy, as well as profiles of air and snow temperature (Table 2).
Measurements are processed and stored on-site, as well as transmitted to the GOES East satellite.
Data are obtained from NOAA in near real-time at the UMass Climate Systems Research Center.
The meteorological station on Illimani was not fully functional in September; we were there to
service the station and collect snow samples. Data from Sajama are therefore used in our analysis
of the September avalanches to supplement the Illimani observations.
Nevado Illimani (6,458 m) is the highest peak in the Cordillera Real, a massive mountain
with three summits over 20,000 feet (Figure 2). The meteorological station on Illimani is located
approximately 200 m below the summit (16°39’ S; 67°47’ W at 6,265 m (20,555 ft)), in a large
bowl oriented to the southwest. Nevado Sajama is located in Parque Nacional Sajama, within the
Cordillera Occidental, on the eastern side of the Altiplano (Figure 1). This extinct volcano is the
highest peak in Bolivia (6,542 m), and higher elevations of the mountain are covered by an ice
cap. The meteorological station on Sajama is located about 27 m below the summit (18°06’ S;
68°53’ W at 6,515 m (21,376 ft)).
The Bolivian Andes experience a marked seasonality in precipitation, with an extended
summer wet season and a dry winter. The 30-year record from Chacaltaya, just west of Illimani
(Figure 1), illustrates the pronounced dry period June-August, when less than 5% of the annual
precipitation is delivered (Figure 3). Precipitation over the entire Bolivian Altiplano (including
Sajama) originates almost exclusively from the east, and annual totals decrease to the west of the
Cordillera Real.

Tropical Avalanches Hardy, Williams & Escobar
6
Mean annual temperature (MAT) near the Illimani weather station is –7.6°C, as indicated by
the borehole temperature at 10 m (Zweifel, personal communication). MAT on Sajama is 3.0°C
lower by our station measurements and by the 10 m borehole temperature (Zagoradnov, personal
communication).
3. Methods
On 30 September 1999 a snowpit was dug and analyzed in a location adjacent to the
avalanche we triggered on 29 September 1999. We measured snow properties and snowpack
stratigraphy using standard protocols (e.g., Colbeck et al., 1990; Williams et al., 1999). We used
a 100 cc stainless steel Taylor-LaChapelle cutter and an electronic scale (± 1g) to measure snow
density. Snowpack temperatures were measured with 20-cm long dial stem thermometers. A 16X
hand lens (18 mm diameter) and gridded plate were used to determine grain shape and estimate
grain size.
The chemical and dust content of individual strata in the snowpack were also analyzed.
These values have the potential to provide information on snowpack development (e.g., Hardy et
al., 1998b), and on conditions at the snow surface, such as evaporation amounts (Eichler et al., in
press). Snow samples were collected in EPA-certified containers for chemical and isotopic
content following methods such as those of Williams et al. (1996), and kept below –4°C during
transport to the lab. Laboratory analyses were conducted at the Byrd Polar Research Center at
Ohio State University.
Here we analyze the climatological and snow conditions that led to the two avalanches using
information from the high-elevation meteorological stations on Nevado Illimani and Sajama. A
comprehensive discussion of this station’s design and configuration has been published (Hardy et
Tropical Avalanches Hardy, Williams & Escobar
7
al., 1998a). For this report, we emphasize measurements of air temperature, snow accumulation,
snow surface temperature, and internal snowpack temperatures. Instruments and sampling
frequency for these measurements are presented in Table 2.
4. Results and discussion
4.1 Avalanche on Nevado Illimani
We released a slab avalanche near the summit of Nevado Illimani on 29 September 2000,
similar to the slab release on Cerro Presidente 4 days earlier (Table 1). We were at about 6,300 m
on the afternoon of 29 September en route to a weather station on the mountain. Snow was well-
sintered and supported steps and front-pointing on the 45-50° west-facing approach to a saddle
below the summit of Illimani Sur. We began descending from the saddle to the weather station,
on a gentle slope of perhaps 10 degrees. As the slope began to steepen the walking became more
difficult in deepening snow. We started to post-hole with every step. Twice the snow collapsed
with a “whoomph” noise the gradual slope, a phenomena one of us (CE) recalls experiencing
only five times in 13 years of climbing in Bolivia. We were in a dense white-out at the time,
proceeding toward the meteorological station by reckoning. Suddenly a larger whoomph (or “firn
quake”) occurred, representing a widespread collapse of the snowpack. Simultaneously, we
heard a fracture propagate to our left, followed by a dull roar. Visibility was minimal, but a fresh
fracture line was visible in the snowpack underneath our feet and extending to our left, where we
had heard what we thought was an avalanche release. We retreated back to the saddle and set up
camp, as in the whiteout it was impossible to assess the danger of additional slides.
Visibility improved shortly thereafter, revealing the avalanche we had released (Figure 2),
about 200 meters to our left. The slab originated from a distinct fracture, 1-2 m thick. We
Tropical Avalanches Hardy, Williams & Escobar
8
estimate the slide path at 100-200 m in both width and length (size 2, Canadian classification),
although we did not have time to inspect it more closely. The runout zone of the avalanche was
within 100 m of our meteorological station and snowpit.
4.2 Snow accumulation and snowpit stratigraphy
Negative sea-surface temperature anomalies in the central equatorial Pacific (i.e., La Niña)
enhance wet-season precipitation on the Altiplano (Vuille et al., 2000), and a large La Niña event
peaked during the 1998-99 wet season. At the Illimani weather station, 240 cm of snow
accumulated by early April of 1999, which buried the snow depth sensor. Station visits on 7
April and 17 June document the same snow depth, although without the sensor we have no
record of variability between those dates. On 29 September the snow surface was 25-30 cm
above that of 17 June, representing 270 cm of accumulation since the previous November.
A 180-cm deep snowpit was dug on 30 September 1999, the day after the avalanche, on a
slope angle of about 10 degrees. Stratigraphic analysis and sample collection were conducted
from about 1300 to 1600 hrs on that day. Weather was clear, bright, and brisk, with the sun
almost directly overhead. Snow temperatures were isothermal at 0°C in the first 9 cm, decreasing
to -3.0°C for the remainder of the snowpack observed (Figure 4). Density generally increased
with depth, from about 210 kg m-3 at the snow surface to 410 kg m-3 at a depth of 180 cm, with
the exception of several ice layers.
The stratigraphy of the snowpit contained some interesting surprises. Snow grains in the first
19 cm were rounded, suggesting the presence of some liquid water and wet snow metamorphism
(e.g., Colbeck, 1979). The small grain size of 0.3 mm along with the absence of polycrystalline
grains suggests that conditions consisted of snow with low water content and little if any
Tropical Avalanches Hardy, Williams & Escobar
9
percolation. A thin ice layer at 19-20 cm is consistent with subsurface melting and refreezing.
Snow grains from 20-27 cm were similar to grains at 0-19 cm, though slightly larger at 0.5 mm
in diameter.
Below a depth of 27 cm, the stratigraphy suggested a different snow environment. Snow
grains throughout the 27-37 cm depth layer were heavily faceted. Many of the grains showed
well-developed cups and scroll patterns similar to kinetic growth or depth hoar grains that
develop at or near the bottom of the snowpack (Colbeck, 1983). Average grain size was 3-5 mm,
with several grains larger than 10 mm, and the density was 230 kg m-3. Dust was visible
throughout this layer, with much higher concentrations in the upper 3 cm. Hardness was
measured by the hand test as low (Figure 4). The layer from 37-64 cm was similar to that above,
except that faceting was not as well-developed. Grain sizes of 2-4 mm were smaller than in the
layer above, and it was slightly harder. There was no visible dust in this layer. A well-bonded ice
lens was at 65-73 cm, composed of melt-freeze polycrystals.
The avalanche that we triggered appeared to run on the faceted grains located at a depth of
27-37 cm in our snowpit. We believe that the faceted grains we report for layers from 27-64 cm
are near-surface faceted crystals, formed by the process Birkeland (1998) terms diurnal re-
crystalization. To our knowledge, these near-surface faceted grains are larger, and more diverse
in form, than those previously reported either in the avalanche literature or informally among
avalanche professionals. We believe that these differences are the result of unique
meteorological conditions at high elevations in the tropical Andes.

Tropical Avalanches Hardy, Williams & Escobar
10
4.3 Snow chemistry and dust content
The chemical and dust content of the snowpack provides insight into the meteorological
history of the snowpack development. Dust concentrations from the bottom of the snowpit at 180
cm to a depth of 37 cm were relatively low (Figure 5). At the 27-37 layer, characterized by large
and well-developed near-surface faceted crystals, the dust concentration increased by more than
two orders of magnitude to almost 3,000,000 particles per mL. Calcium, which is a major
component of dust, increased by more than an order of magnitude from 50 ppb at a depth of 50
cm to 1500 ppb at the layer at 27-37 cm. These dust and calcium concentrations indicate that the
meteorological conditions were much different while the layer at 27-37 cm was exposed at the
snow surface, compared to all other layers.
Comparison of our results to those from the Quelccaya Ice Cap in Peru illustrates the climatic
conditions on Illimani that preceded the avalanche release. Dust concentrations from snowpits on
the Quelccaya Ice Cap in Peru exhibit a distinct seasonal variation, with high concentrations
during the dry season similar to those we report for the layer at 27-37 cm and with
concentrations during the wet season near zero (Thompson et al., 1980). The association of high
particle concentrations at Quelccaya with the dry season is a function of: (1) high radiation
receipt with little accumulation (e.g. lots of clear days with little cloud cover); (2) dominant wind
direction from the west, transporting material from the high, dry Altiplano; and (3) higher wind
speeds during the austral winter (Thompson et al., 1988).
The large increase in dust particles in our snowpit suggests that little precipitation occurred
for an extended period of time while the layer at 27-37 cm depth was exposed at the snow
surface – perhaps since early April. Additionally, the lack of grain rounding or refrozen
Tropical Avalanches Hardy, Williams & Escobar
11
meltwater in that layer is evidence that air temperatures were low enough that no liquid water
was produced at or just below the snow surface.
Chloride concentrations can be used to evaluate the possibility of sublimation/evaporation at
the snow surface in high-elevation environments (Eichler et al., 2000). Chloride concentrations
increased from 25 ppb at a depth of 50 cm to 450 ppb in the layer at 27-37 cm. The large
increase in concentration of chloride at a depth of 27-37 cm suggests that large amounts of
sublimation occurred while this layer was exposed at the snow surface.
The dust and chemistry data suggest that the surface at 27 cm depth was exposed to clear and
cold conditions during the austral winter. Meteorological conditions during this exposure appear
to have driven the formation of near-surface faceted crystals.
4.4 Meteorological conditions
Precipitation
Direct measurements of precipitation on Illimani are not available through the 1999 dry
season. From observations, we know that 25-30 cm of snow accumulated sometime between 17
June and 29 September, and snowpit evidence suggests that this increment fell within days to
weeks prior to 29 September. Such winter precipitation events have been recorded in prior years
on Illimani, including two snowfalls in August 1997 (19 and 12 cm), 15 cm in September of that
year, and one 10 cm event during June of 1998.
Bolivian station data show that a widespread regional precipitation event occurred on 17
September 1999 (7.4 to 7.9 mm at La Paz, Cochabamba, and Oruro). On Sajama, after a
prolonged period without precipitation, 19 cm of snow accumulation was recorded on 18-19
September and 23 cm on 28-30 September. These are relatively large events for the more arid
Tropical Avalanches Hardy, Williams & Escobar
12
Sajama, and the accumulation was not blown away as typically occurs with winter precipitation
events on Sajama.
One additional piece of indirect evidence for the timing of precipitation comes from Illimani.
During the dry (low humidity) evening of 22-23 September, snow was evidently drifting in
response to wind speeds of 4-7 m s-1, because the reflected solar radiometer was buried beneath
the snow surface on 23 September. Indeed, for the two week period prior to the Illimani
avalanche, winds were consistently from the northwest (blowing downslope) at speeds varying
between 2 and 8 m s-1. In summary, considerable snowfall apparently occurred within the period
8-12 days prior to avalanches in the Cordilleras Apolobamba and Real, probably accompanied by
sufficient wind to cause redistribution of the new snow.
Solar radiation and air temperature
Solar radiation receipt remains high during the austral winter at high elevations in the Andes,
with daily irradiance maxima typically greater than 800 W m-2 (Hardy et al., 1998a). However,
the mean temperature at the summit of Sajama (~460 hPa) during the winter is only –12.8°C
(1996-99). In contrast to mid-latitude mountain environments, the average diurnal temperature
range of 7.8°C is larger than the annual temperature range. Monthly mean measurements on
Sajama from July through September 1999 show increasing solar radiation, and increases in both
mean air temperature and the daily temperature range (Table 3). Illimani temperatures are
generally slightly higher, due to the 250 m elevation difference and higher humidity, but
unavailable for this time period.
Tropical Avalanches Hardy, Williams & Escobar
13
Near-surface temperature gradients
Although air temperature is measured only at ‘screen height’ on Illimani, additional
temperature measurement instrumentation operated on Sajama (Table 2). During clear-sky
conditions, without differences in cloud cover, Sajama provides an excellent analog for the near-
surface temperature patterns on Illimani. While we realize the inherent problems in the
measurement of near-surface temperatures and calculation of temperature gradients (e.g.
Birkeland et al., 1998), our results demonstrate the range of possible temperature (and vapor
pressure) gradients available to drive the formation of near-surface faceted snow crystals in this
environment. Where appropriate, we use only night-time measurements (2100-0700 hrs) to avoid
potential problems caused by solar heating of the instrumentation.
To investigate the near-surface air temperature gradient we selected a nearly cloudless 13-
day period of data from July 1997. A thermocouple (TC) had just been installed 4 cm above the
snow surface during a site visit ending 2 July, and the infrared temperature transducer was
functioning well. Given the uniformity of the radiation regime through this period, we
determined the average temperature at 4 cm and at the surface, for each hour of the day. These
pairs of values, for each hour, were used to estimate the temperature gradient in the lowest 4 cm
above the snow. The uniformity of the gradient during periods of no solar radiation (i.e., night-
time) is quite remarkable (Figure 6 upper); night-time gradients were not significantly affected
by wind speed, which varied between calm and 24 m s-1 (not shown). We calculate an average
night-time temperature gradient in the lowest 4 cm during these 13 days of 161°C/m, well within
the 100-300°C m-1 range others have recorded.
The near-surface snow temperature gradient was measured through a brief period just prior to
the time period discussed above. While servicing the weather station we installed a TC array in
Tropical Avalanches Hardy, Williams & Escobar
14
undisturbed snow nearby (as described by Birkeland et al., 1998), and temperature measurements
were collected every 15 min over 3 days. Our procedure differed slightly from that of Birkeland
et al. (1998) in that the top TC was installed right at the snow surface, so measurements were
made at 0, –1, –6, –11 and –16 cm. The resultant measurements do not provide a comprehensive
measure of the maximum temperature gradients possible at the site, because some cloud cover is
known to have occurred during the nighttime hours (altering the longwave radiation balance),
and because wind speeds were relatively high (10-20 m s-1) through the period (inducing
convection within the snowpack). Figure 6 (lower) illustrates profiles during largely clear-sky
conditions over a very brief period of measurements. These limited data suggest that bi-
directional gradients may be roughly symmetrical, reaching at least ± 50° C m-1 in magnitude
and probably higher close to the surface. At 6,515 m on Sajama (~460 hPa) therefore, vapor
pressure gradients could typically exceed ± 5 hPa m-1.
5. Summary
The near-surface faceted crystals observed on Illimani in September 1999 appear to be both
better developed (i.e., larger) and form a thicker layer than those reported from mid-latitude
mountain environments. This finding is consistent with Colbeck’s (1989) theoretical treatment of
near-surface faceted crystal growth. While the best-developed grains on Illimani were in a layer
10 cm thick, those in the 27 cm thick layer below were also faceted. It is not known when the
faceted crystals developed, although the thicker layer was exposed to the surface for less time
than the overlying 10 cm of accumulation, based on dust concentrations (Figure 5). Faceting in
the lower layer may have occurred after burial (i.e., 10 – 37 cm deep). Conditions unique to
high-elevation tropical mountains favoring the growth of near-surface faceted crystals include:
Tropical Avalanches Hardy, Williams & Escobar
15
(1) higher input of incoming solar radiation, due to less atmosphere and higher sun altitudes; (2)
greater day-time absorption of solar radiation at the snow surface during the austral winter, due
to the relatively high dust concentration (enhancing the temperature gradient); and (3) greater
longwave radiation loss due to rapid cooling of the dry, thin atmosphere in the evening.
Development of near-surface faceted crystals during the dry season, at high elevations in the
Bolivian Andes, may present a greater avalanche hazard than is generally recognized. Two
documented incidents in September 1999 occurred when ‘early season’ snow was redistributed
onto leeward slopes, burying a thick, well-developed layer of near-surface faceted crystals. This
layer probably formed through the process Birkeland (1998) termed diurnal recrystallization. In
this region of the Andes, our results suggest that ideal meteorological conditions for faceted
crystal growth persist through the entire climbing season of June-August, and probably occur
most years in high-elevation areas. Indeed, we have observed buried near-surface faceted crystals
within a previous years snowpack on Sajama. Regional precipitation decidedly increases during
September, and relatively large snowfall events are not uncommon in our short record from
Illimani. Avalanches may occur when synoptic weather conditions result in dry-season snow
events and high wind speeds that produce a slab over this weak layer. La Nina conditions, such
as during 1998-99, may favor this situation. Although the resulting instability should be
relatively easy to recognize due to audible collapse upon loading (whoomphing), climbers must
be alert to the potential threat. Currently, climbers and other users of the Bolivian high-mountain
environment are not expecting to encounter avalanche hazards during the climbing season, and
many have little experience in evaluating avalanche danger.
Tropical Avalanches Hardy, Williams & Escobar
16
Acknowledgements
Funding was provided by a NOAA Global Programs Office grant to the University of
Massachusetts, a Fulbright Fellowship and Faculty Fellowship from the University of Colorado-
Boulder (MW), as well as NSF Hydrology and International Programs. Thanks to Lonnie
Thompson and the Byrd Polar Research Center staff for the careful geochemical analyses, and to
Karl Birkeland for loaning the thermocouples. We are grateful for excellent logistical support
from Nuevo Horizontes in La Paz. This work has also benefited greatly from the on-going
involvement of Carsten Braun and Mathias Vuille at the University of Massachusetts. We
appreciate the reviewers helpful comments, which improved the paper.
References
Akitaya, E., 1974. Studies on depth hoar. Contr. Inst. Low Temp. Sci., A-26: 1-67.
Armstrong, R.L., 1985. Metamorphism in a subfreezing, seasonal snow cover: The role of
thermal and vapor pressure conditions. Ph.D dissertation, Dept. Geogr., University of
Colorado, Boulder, CO.
Arrington, V., 1999. Tragedy strikes in the Apolobamba. Bolivian Times, 7 October 1999.
Birkeland, K.W., R.F. Johnson, and D.S. Schmidt, 1996. Near-surface faceted crystals:
Conditions necessary for growth and contribution to avalanche formation, southwest
Montana, U.S.A. Proc. 1996 Int. Snow Sci. Wksp., Banff, Alberta, Canada, 75-79.
Birkeland, K.W., R.F. Johnson, and D.S. Schmidt, 1998. Near-surface faceted crystals formed
by diurnal recrystallization: A case study of weak layer formation in the mountain snowpack
and its contribution to snow avalanches. Arctic Alpine Res., 30: 200-204.

Tropical Avalanches Hardy, Williams & Escobar
17
Birkeland, K.W., 1998. Terminology and predominant processes associated with the formation
of weak layers of near-surface faceted crystals in the mountain snowpack. Arctic Alpine
Res., 30: 193-199.
Brain, Y., 1999. Bolivia: A Climbing Guide. The Mountaineers, Seattle, 224p.
Colbeck, S.C., 1979. Grain clusters in wet snow. J. Colloid Interface Sci., 72: 371-384.
Colbeck, S.C., 1982. Growth of faceted crystals in a snow cover. CRREL Rep. 82-29, U.S.
Army Cold Regions Res. Eng. Lab., Hanover, NH.
Colbeck, S.C., 1983. Theory of metamorphism of dry snow. J. Geophys. Res., 88: 5475-5482.
Colbeck, S.C., 1989. Snow-crystal growth with varying surface temperatures and radiation
penetration. J. Glaciol., 35: 23-29.
Colbeck, S. C., E. Akitaya, R. Armstrong, H. Gubler, J. Lafeuille, K. Lied, D. McClung, and E.
Morris, 1990. The international classification for seasonal snow on the ground, pp. 1-23,
National Snow and Ice Data Center, Boulder, CO.
Eichler, A., M. Schwikowski, and H.W. Gaggeler, 2000. An alpine ice-core record of
anthropogenic HF and HCl emissions. J. Geophys. Res. Lett., 27: 3225-3228.
Hardy, D.R., M. Vuille, C. Braun, F. Keimig, and R.S. Bradley, 1998a. Annual and daily
meteorological cycles at high altitude on a tropical mountain. Bull. Amer. Meteorol. Soc., 79:
1899-1913.
Hardy, D.R., M. Vuille, L.G. Thompson, and R.S. Bradley, 1998b. Climatic and snow
geochemical variations at the summit of Nevado Sajama, Bolivia [Abs.]. American
Geophysical Union Fall Meeting, San Francisco, Dec. 6-10, 1998, EOS.
Marbouty, D., 1980. An experimental study of temperature-gradient metamorphism. J. Glaciol.,
26: 303-312.
Tropical Avalanches Hardy, Williams & Escobar
18
Sturm, M. and C.S. Benson, 1997. Vapor transport, grain growth, and depth-hoar development
in the subarctic snow. J. Glaciol., 43: 42-59.
Thompson, L.G., 1980. Glaciological investigation of the tropical Quelccaya ice cap, Peru. J.
Glaciol., 25.
Thompson, L.G., M.E. Davis, E. Mosley-Thompson, and K-b Liu, 1988. Pre-Incan agricultural
activity recorded in dust layers in two tropical ice cores. Nature, 336: 763-765.
Vuille, M., R.S. Bradley, and F. Keimig, F., 2000. Interannual climate variability in the Central
Andes and its relation to tropical Pacific and Atlantic forcing. J. Geophys. Res., 105: 12,447-
12,460.
Williams, M.W., P.D. Brooks, A. Mosier, and K.A. Tonnessen, 1996. Mineral nitrogen
transforma-tions in and under seasonal snow in a high-elevation catchment, Rocky
Mountains, USA. Water Resour. Res., 32: 3175-3185.
Williams, M.W., D. Cline, M. Hartman, and T. Bardsley, 1999. Data for snowmelt model
development, calibration, and verification at an alpine site, Colorado Front Range. Water
Resour. Res., 35: 3205-3209.

Tropical Avalanches Hardy, Williams & Escobar
19
Table 1. Characteristics of two avalanches in the Bolivian Andes, September 1999 Cerro Presidentea
(Cordillera Apolobamba) Nevado Illimani (Cordillera Real)
Date 9-25-99 9-30-99 Time 0830 1700 Elevation (m) ~5,200 6,300 Incline (°) 30-40 30-40 Type Slab Slab Width (m) 100 100 Canadian size classification 2-3 (?) 2 Avalanche Trigger climbers snow scientists Activity Climbing Climbing Party size 2 3 Partial Burials 1 0 Complete Burials 1 0 Fatalities 2 0 a For further details see: http://www.csac.org/Incidents/1999-00/19990925-Bolivia.html

Tropical Avalanches Hardy, Williams & Escobar
20
Table 2. Selected sensors and measurement intervals, at high-elevation weather stations in Bolivia. Variables unique to Sajama are shown in italics. Heights changed constantly as the snow surface changed; those shown here are for Sajama on approx. 1 July 1997.
Sensor Height Sampling Variable Model (m) Interval Wind speed & direction (upper) R. M. Young 05103 3.7 60 s Wind speed & direction (lower) R. M. Young 05103 2.7 60 s Air temperature Vaisala HMP35C 3.7 10 min Relative Humidty Vaisala HMP35C 3.7 10 min Snow accumulation (n=2) Campbell SR50 acoustic 2.47 & 2.57 1 hr Snow surface temperature Everest Interscience 4000B 2.3 10 min Air temperature gradient Type E thermocouples 0.03, 1.03, 2.03
3.7 10 min
Snow temperature Thermometric thermistors 0.15, -1.85 10 min Snow temperature gradient Type J thermocouples 0, -0.01, -0.06,
-0.11, -0.16 10 s
Tropical Avalanches Hardy, Williams & Escobar
21
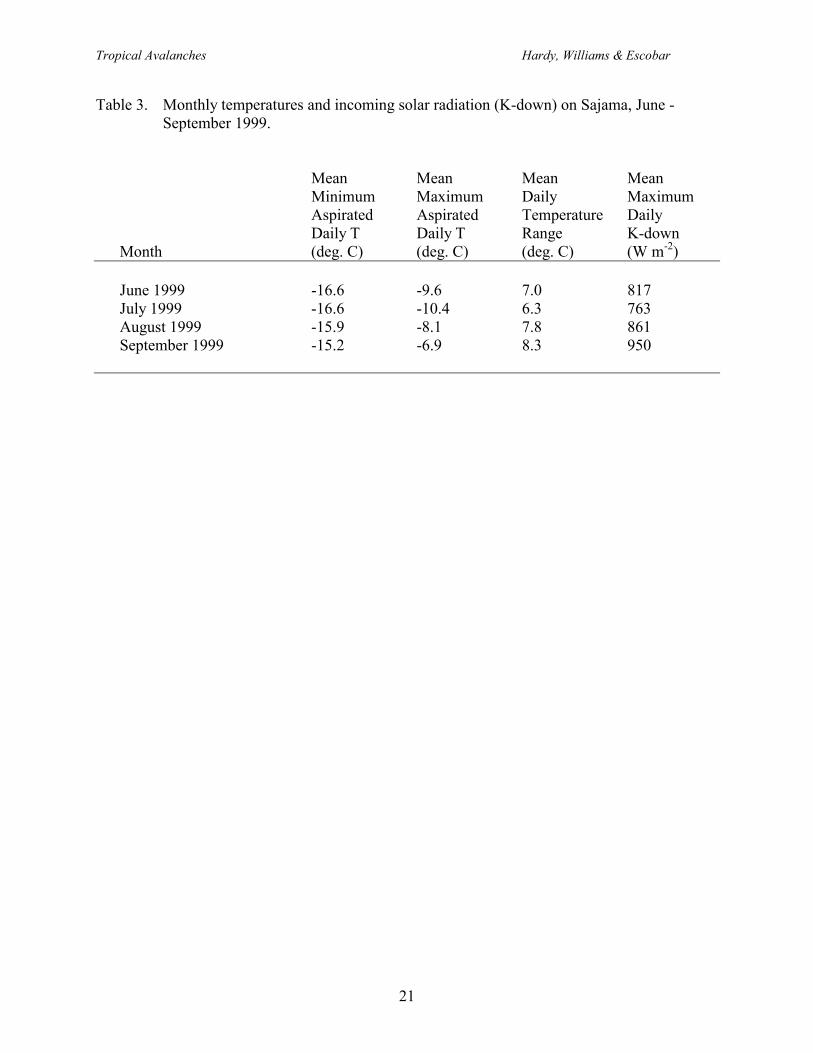
Table 3. Monthly temperatures and incoming solar radiation (K-down) on Sajama, June - September 1999.
Mean Minimum
Mean Maximum
Mean Daily
Mean Maximum
Aspirated Daily T
Aspirated Daily T
Temperature Range
Daily K-down
Month (deg. C) (deg. C) (deg. C) (W m-2)
June 1999 -16.6 -9.6 7.0 817 July 1999 -16.6 -10.4 6.3 763 August 1999 -15.9 -8.1 7.8 861 September 1999 -15.2 -6.9 8.3 950
Tropical Avalanches Hardy, Williams & Escobar
22
Figure 1. South America north of 25°S, showing locations discussed in text; all are within
Bolivia. From Illimani, Nevado Sajama is ~200 km to the southwest, and Cerro Presidente
(Cordillera Apolobamba) is ~200 km to the northwest. The University of Massachusetts
maintained high-elevation meteorological stations near the summits of Sajama and Illimani.
Figure 2. Nevado Illimani as seen from a commercial airline flight between La Paz, the capital
of Bolivia, and Santa Cruz. An oval on the image, east of the summit, indicates the location
of the avalanche that occurred 14-days prior. Illimani (6,458 m) is the highest peak in the
Cordillera Real, a massive mountain with three summits over 20,000 feet, visible from
hundreds of miles out on the Altiplano to the west and from far out into the Amazon Basin on
the east.
Figure 3. Monthly precipitation at Chacaltaya, Bolivia (5,220 m), 1967 – 1997. Whisker plot
boxes illustrate the median (line) and enclose the 25th and 75th percentiles. Error bars enclose
the 10th and 90th percentiles, with extremes indicated by circles. Annual precipitation
averaged 560 mm during this period.
Figure 4. Snowpit profile sampled at 6,300 m near the summit of Nevado Illimani, Bolivia on
30 September 1999. Note the presence of near-surface faceted crystals from 27-64 cm.
Figure 5. Dust and chemical content of the snowpit profile sampled at 6,300 m near the summit
of Nevado Illimani, Bolivia on 30 September 1999. Note the large increase in dust, calcium,
and chloride concentrations in the snowpack within the sample taken between 27 and 37 cm.
Tropical Avalanches Hardy, Williams & Escobar
23
Figure 6. Temperature profiles just above (upper plot) and below (lower plot) the snow surface
on Sajama, during two different time periods. Air temperature profiles represent the mean
hourly temperature at about 3.9 cm above the surface (range during period = 3.1 – 4.9 cm)
and at the snow surface, during the period 1 – 13 July 1997. (The 1400 temperature at 4 cm
may not be comparable to those at other times, due to differential shading of solar radiation
on the thermocouples.) Lower profiles depict measured temperatures at selected time periods
with clear-sky conditions, between 1900 h on 27 June and 1245 h on 28 June, 1997.
Measurement depths are 0, 1, 6, 11 and 16 cm.