Embed Size (px)
Citation preview
•
Nearly-zero energy buildings in Europe
Recommendations from research, 14 demonstration sites and 30 buildings
Conference Brussels, 23 June 2014
•
Does building use matter? What monitoring data can tell us about user behaviour and equipment control
Ulrich Filippi Oberegger DIRECTION Brussels, 23 June 2014
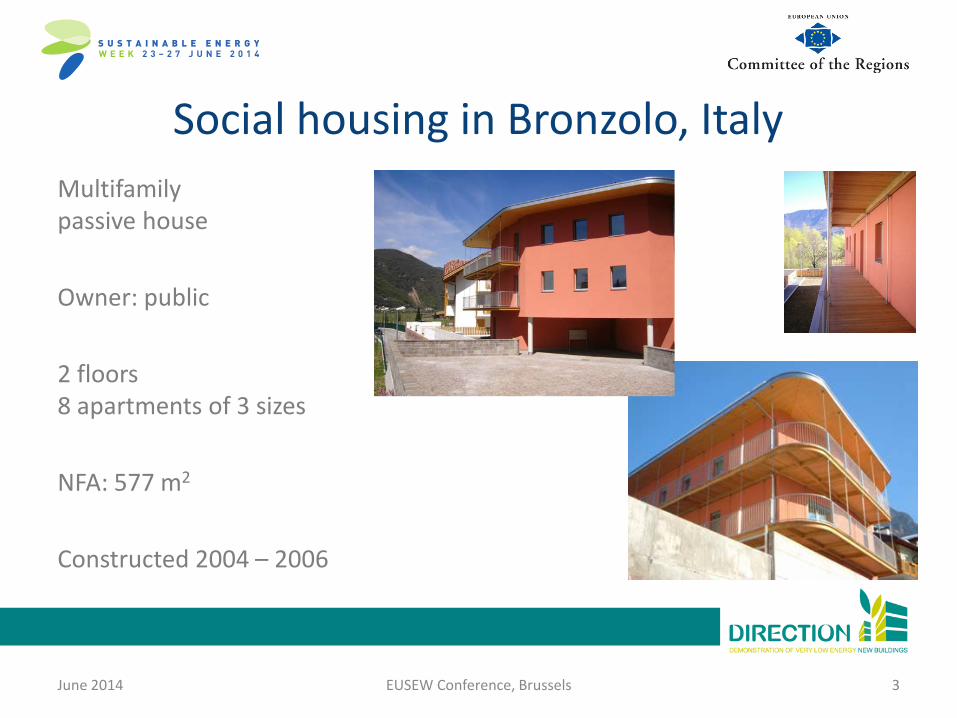
Social housing in Bronzolo, Italy Multifamily passive house Owner: public 2 floors 8 apartments of 3 sizes NFA: 577 m2
Constructed 2004 – 2006
June 2014 EUSEW Conference, Brussels 3
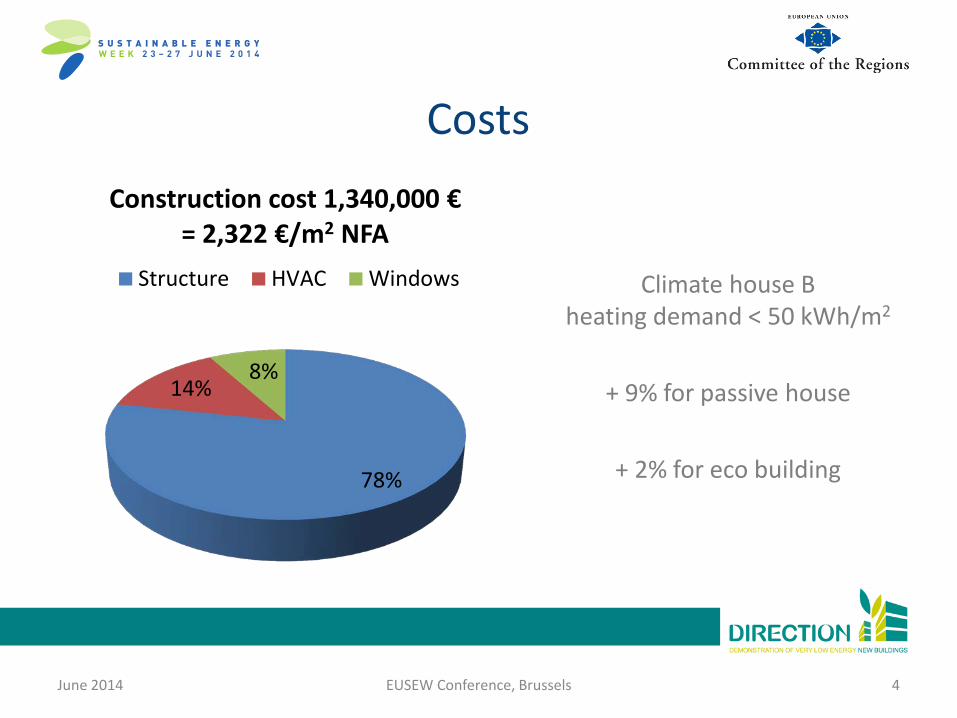
Costs
Climate house B heating demand < 50 kWh/m2
+ 9% for passive house
+ 2% for eco building
June 2014 EUSEW Conference, Brussels 4
78%
14% 8%
Construction cost 1,340,000 € = 2,322 €/m2 NFA
Structure HVAC Windows
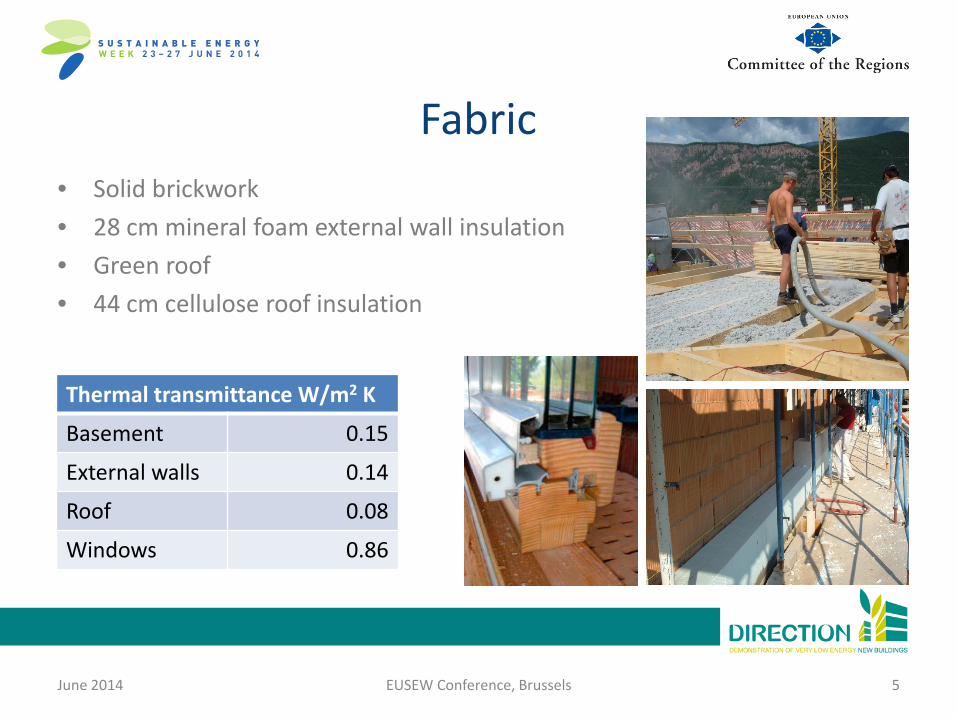
Fabric • Solid brickwork • 28 cm mineral foam external wall insulation • Green roof • 44 cm cellulose roof insulation
June 2014 EUSEW Conference, Brussels 5
Thermal transmittance W/m2 K
Basement 0.15
External walls 0.14
Roof 0.08
Windows 0.86
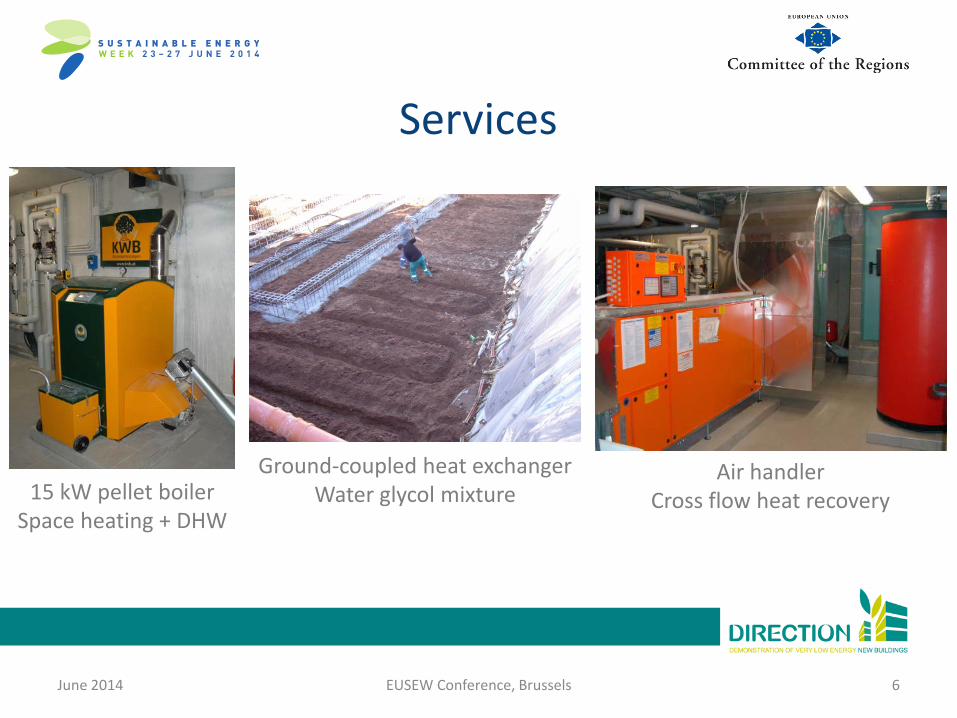
Services
June 2014 EUSEW Conference, Brussels 6
15 kW pellet boiler Space heating + DHW
Air handler Cross flow heat recovery
Ground-coupled heat exchanger Water glycol mixture
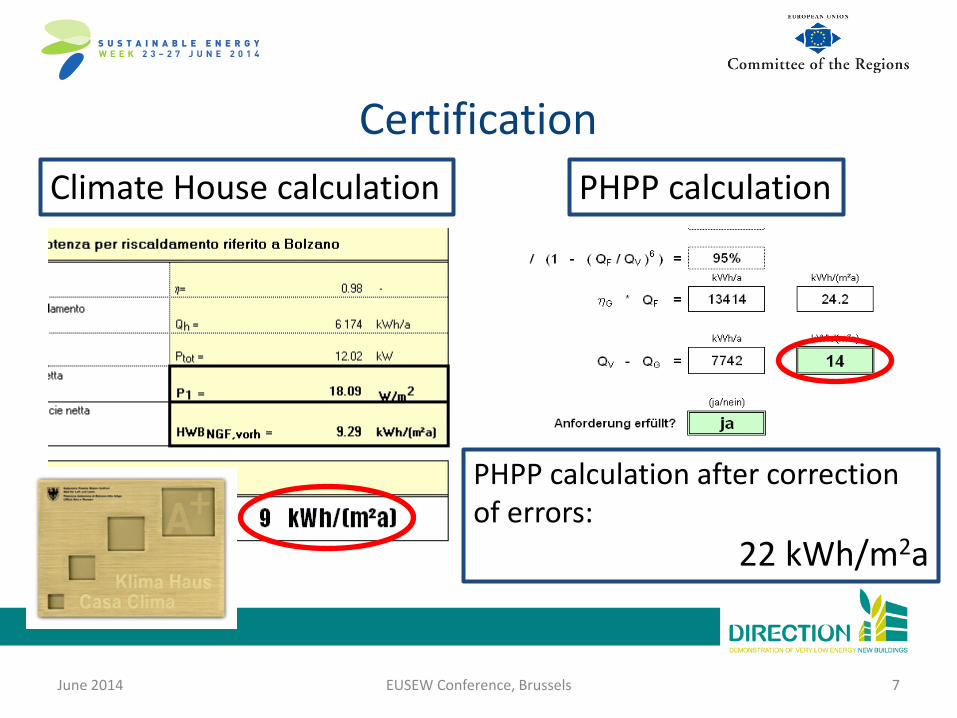
Certification
June 2014 EUSEW Conference, Brussels 7
Climate House calculation PHPP calculation
PHPP calculation after correction of errors:
22 kWh/m2a
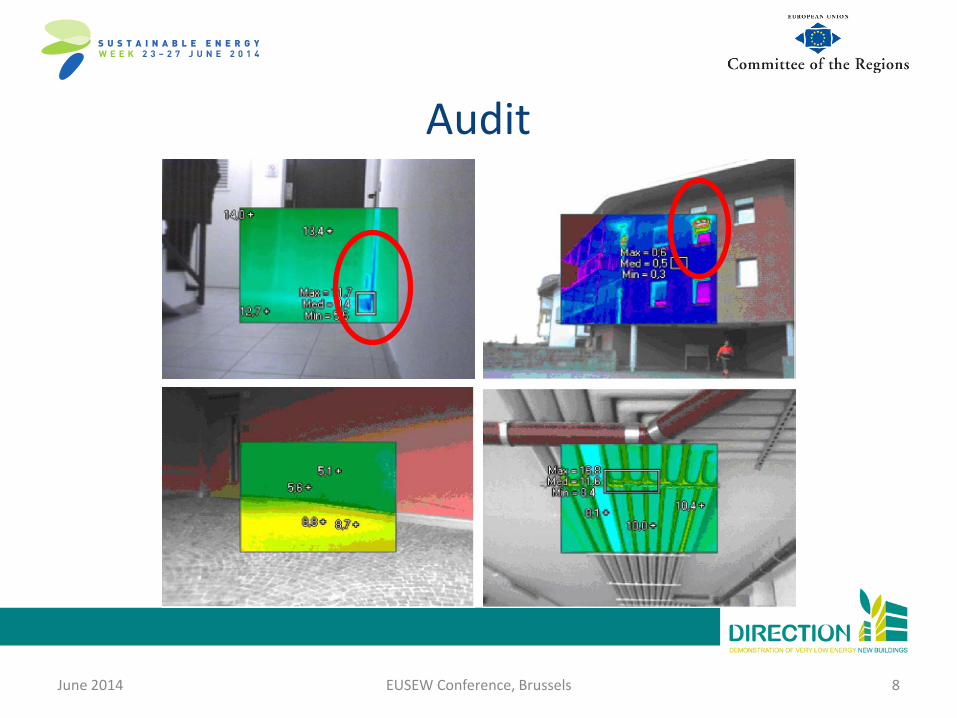
Audit
June 2014 EUSEW Conference, Brussels 8
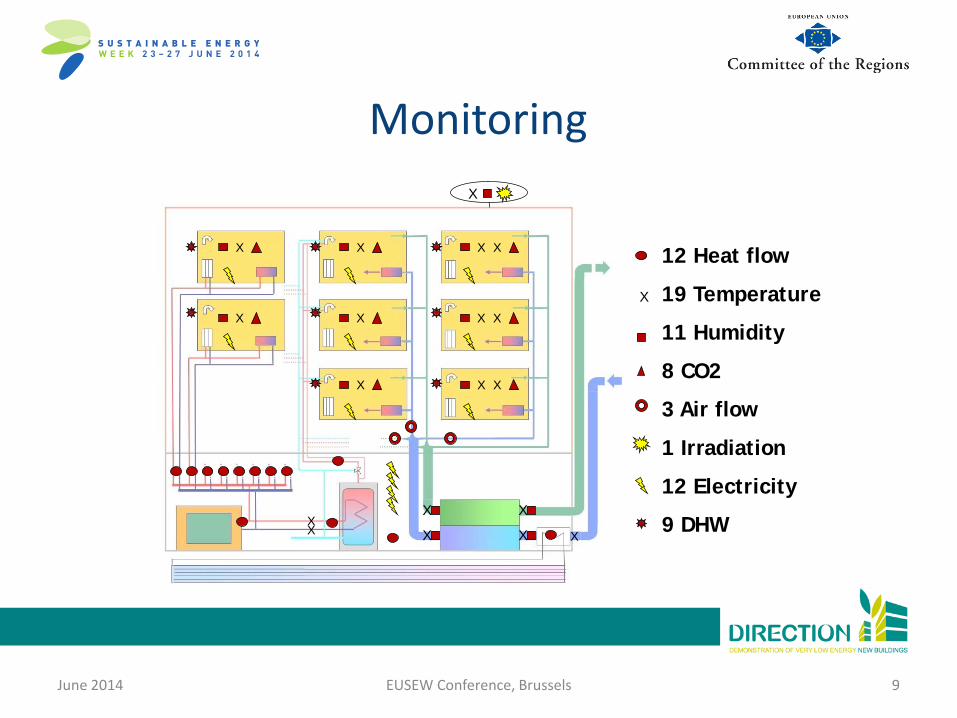
Monitoring
June 2014 EUSEW Conference, Brussels 9
X
XX XX
XX XX
X XX
XX
XX
XXX
12 Heat flow
19 Temperature
11 Humidity
8 CO2
3 Air flow
1 Irradiation
12 Electricity
9 DHW
X
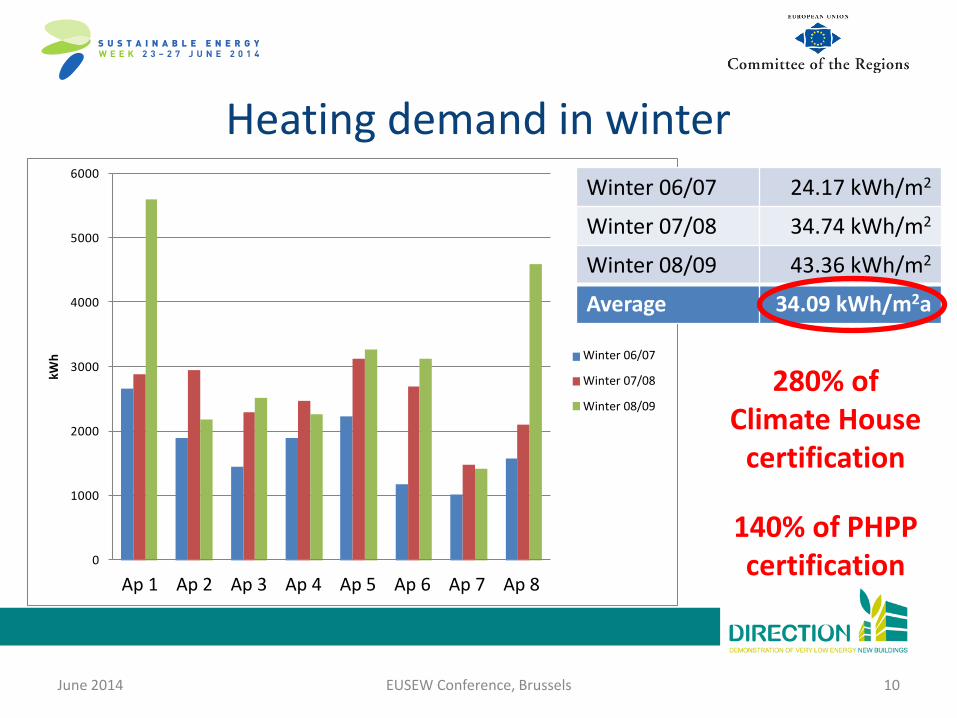
Heating demand in winter
June 2014 EUSEW Conference, Brussels 10
0
1000
2000
3000
4000
5000
6000
App 1 App 2 App 3 App 4 App 5 App 6 App 7 App 8
kWh Inverno 06/07
Inverno 07/08
Inverno 08/09
Winter 06/07 24.17 kWh/m2
Winter 07/08 34.74 kWh/m2
Winter 08/09 43.36 kWh/m2
Average 34.09 kWh/m2a
280% of Climate House
certification
140% of PHPP certification
Winter 06/07
Winter 07/08
Winter 08/09
Ap 1 Ap 2 Ap 3 Ap 4 Ap 5 Ap 6 Ap 7 Ap 8
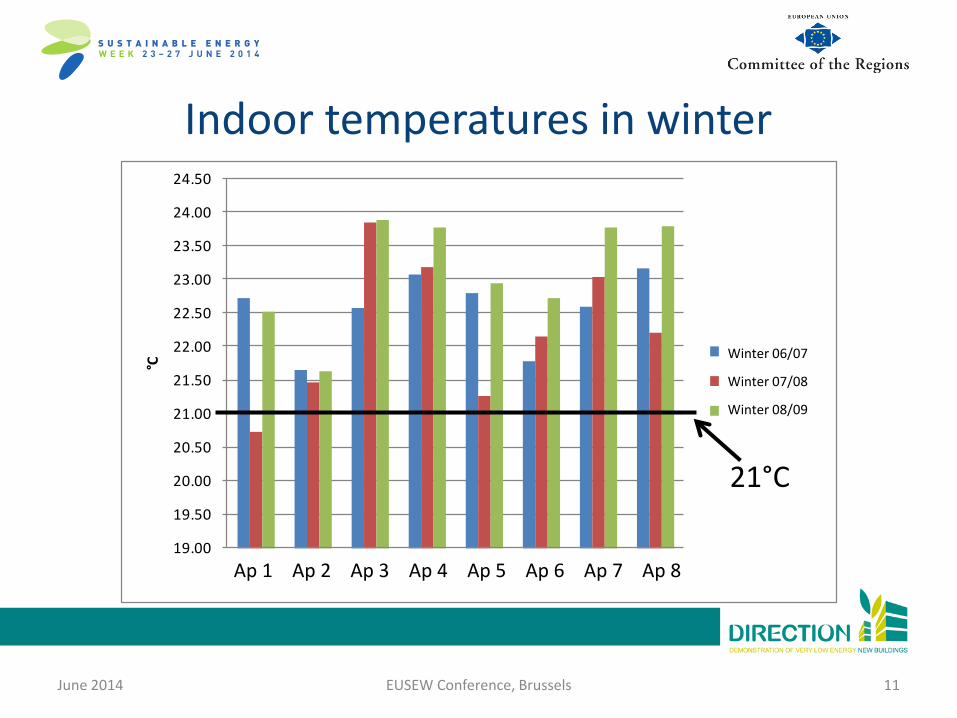
Indoor temperatures in winter
June 2014 EUSEW Conference, Brussels 11
19.00
19.50
20.00
20.50
21.00
21.50
22.00
22.50
23.00
23.50
24.00
24.50
App 1 App 2 App 3 App 4 App 5 App 6 App 7 App 8
°C
Inverno 06/07
Inverno 07/08
Inverno 08/09
21°C
Winter 06/07
Winter 07/08
Winter 08/09
Ap 1 Ap 2 Ap 3 Ap 4 Ap 5 Ap 6 Ap 7 Ap 8
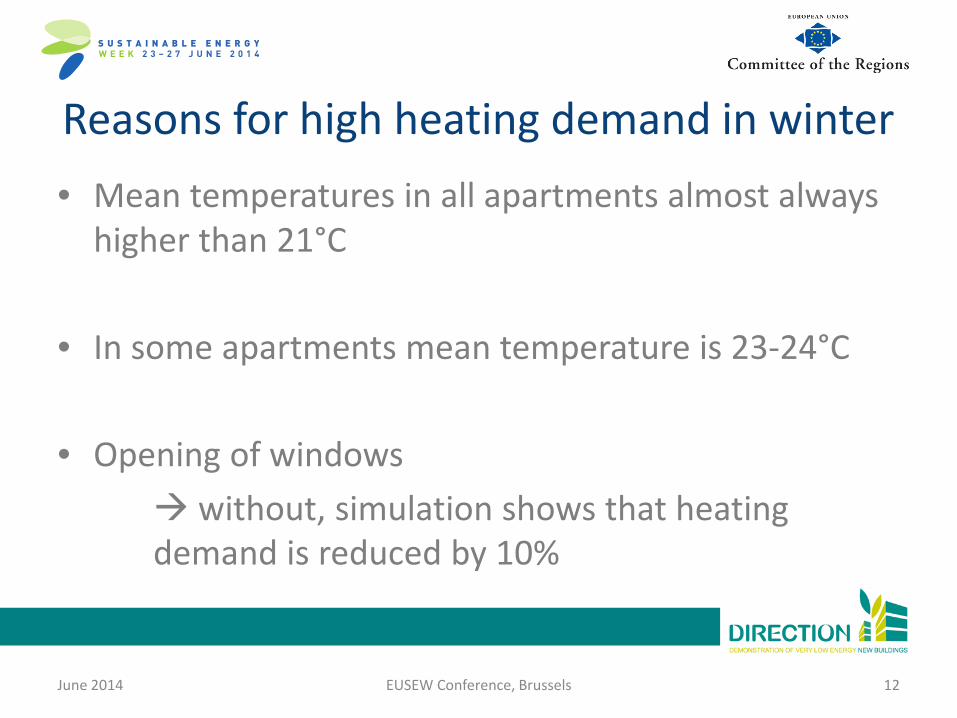
Reasons for high heating demand in winter • Mean temperatures in all apartments almost always
higher than 21°C
• In some apartments mean temperature is 23-24°C
• Opening of windows without, simulation shows that heating demand is reduced by 10%
June 2014 EUSEW Conference, Brussels 12
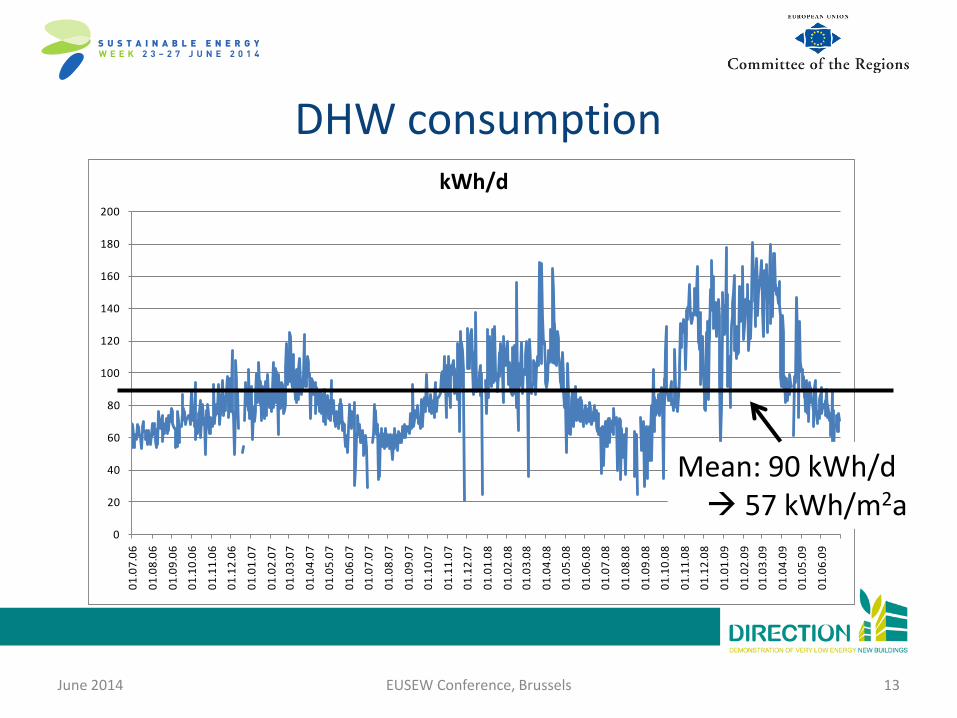
DHW consumption
June 2014 EUSEW Conference, Brussels 13
0
20
40
60
80
100
120
140
160
180
200
01.0
7.06
01.0
8.06
01.0
9.06
01.1
0.06
01.1
1.06
01.1
2.06
01.0
1.07
01.0
2.07
01.0
3.07
01.0
4.07
01.0
5.07
01.0
6.07
01.0
7.07
01.0
8.07
01.0
9.07
01.1
0.07
01.1
1.07
01.1
2.07
01.0
1.08
01.0
2.08
01.0
3.08
01.0
4.08
01.0
5.08
01.0
6.08
01.0
7.08
01.0
8.08
01.0
9.08
01.1
0.08
01.1
1.08
01.1
2.08
01.0
1.09
01.0
2.09
01.0
3.09
01.0
4.09
01.0
5.09
01.0
6.09
Consumo per acqua calda sanitaria [kWh/giorno]kWh/d
Mean: 90 kWh/d 57 kWh/m2a
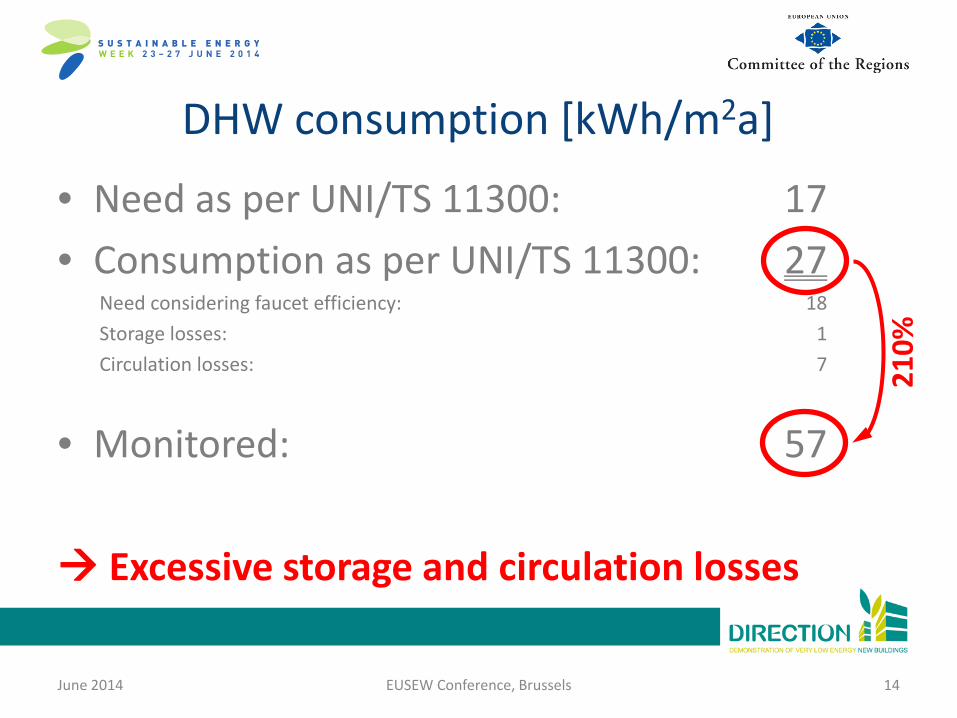
DHW consumption [kWh/m2a]
• Need as per UNI/TS 11300: 17 • Consumption as per UNI/TS 11300: 27
Need considering faucet efficiency: 18 Storage losses: 1 Circulation losses: 7
• Monitored: 57 Excessive storage and circulation losses June 2014 EUSEW Conference, Brussels 14
210%
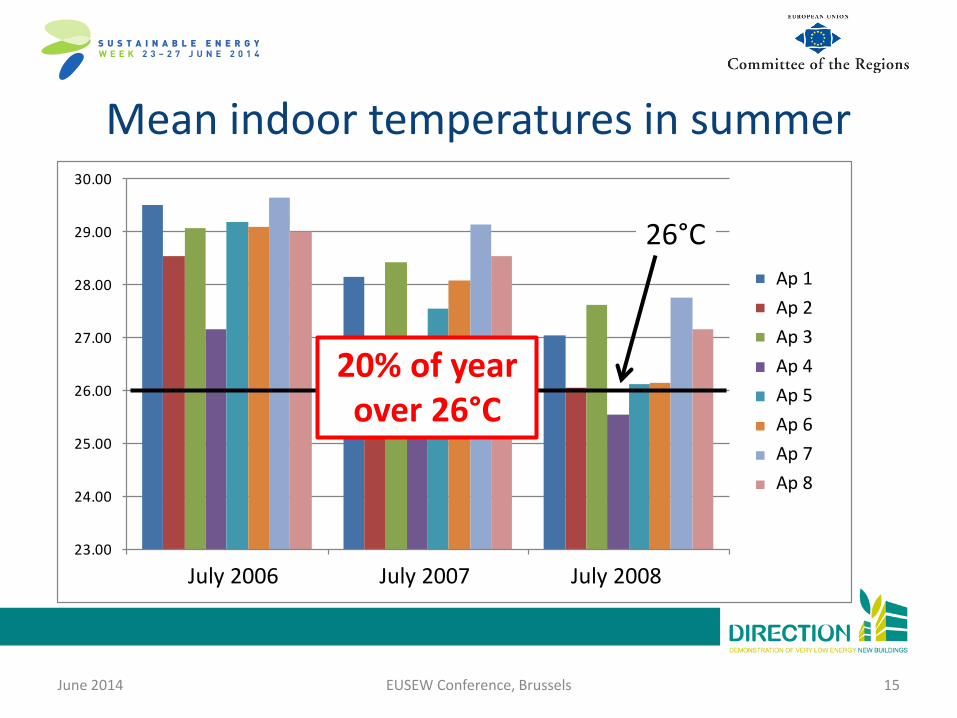
Mean indoor temperatures in summer
June 2014 EUSEW Conference, Brussels 15
23.00
24.00
25.00
26.00
27.00
28.00
29.00
30.00
Luglio 06 Luglio 07 Luglio 08
App 1 [°C]
App 2 [°C]
App 3 [°C]
App 4 [°C]
App 5 [°C]
App 6 [°C]
App 7 [°C]
App 8 [°C]
Ap 1 Ap 2 Ap 3 Ap 4 Ap 5 Ap 6 Ap 7 Ap 8
July 2006 July 2007 July 2008
26°C
20% of year over 26°C
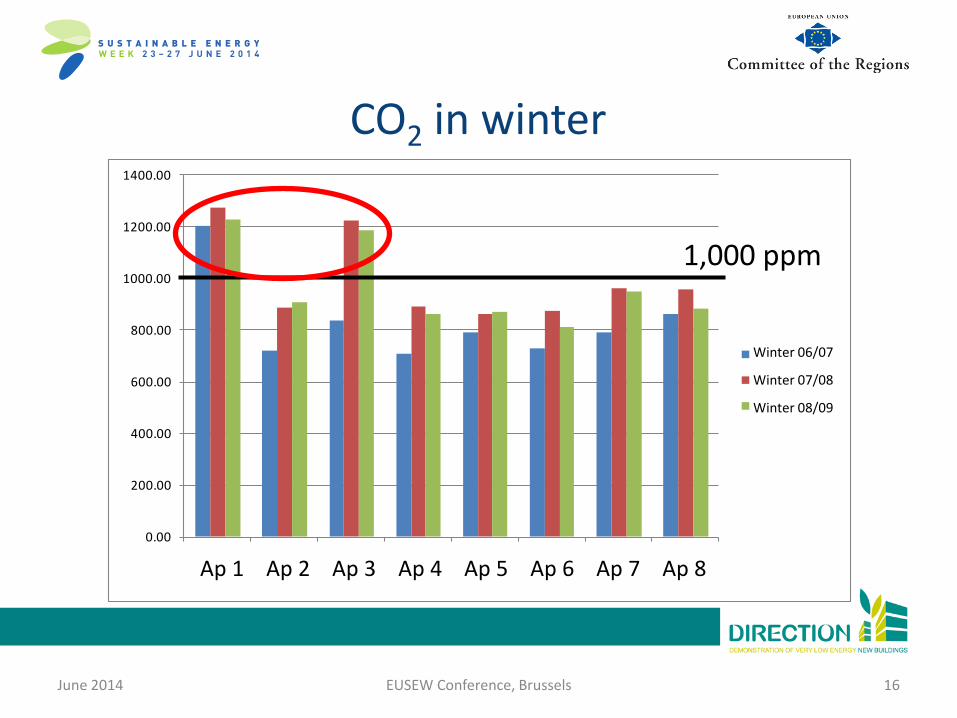
CO2 in winter
June 2014 EUSEW Conference, Brussels 16
0.00
200.00
400.00
600.00
800.00
1000.00
1200.00
1400.00
App 1 [ppm]
App 2 [ppm]
App 3 [ppm]
App 4 [ppm]
App 5 [ppm]
App 6 [ppm]
App 7 [ppm]
App 8 [ppm]
Inverno 06/07
Inverno 07/08
Inverno 08/09
Ap 1 Ap 2 Ap 3 Ap 4 Ap 5 Ap 6 Ap 7 Ap 8
Winter 06/07
Winter 07/08
Winter 08/09
1,000 ppm
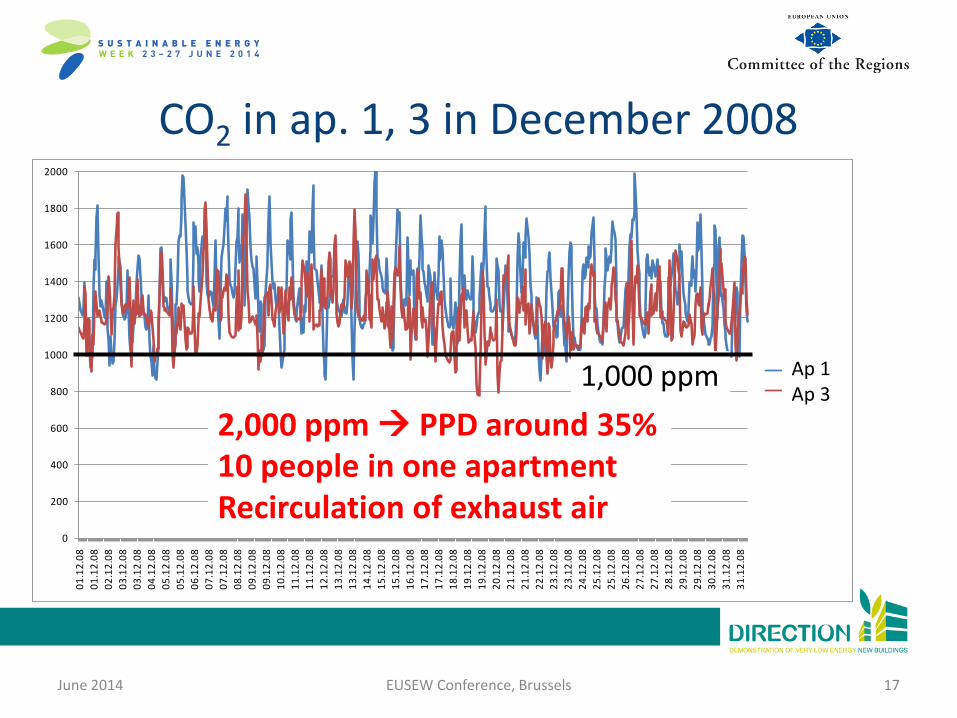
CO2 in ap. 1, 3 in December 2008
June 2014 EUSEW Conference, Brussels 17
0
200
400
600
800
1000
1200
1400
1600
1800
2000
01.1
2.08
01.1
2.08
02.1
2.08
03.1
2.08
03.1
2.08
04.1
2.08
05.1
2.08
05.1
2.08
06.1
2.08
07.1
2.08
07.1
2.08
08.1
2.08
09.1
2.08
09.1
2.08
10.1
2.08
11.1
2.08
11.1
2.08
12.1
2.08
13.1
2.08
13.1
2.08
14.1
2.08
15.1
2.08
15.1
2.08
16.1
2.08
17.1
2.08
17.1
2.08
18.1
2.08
19.1
2.08
19.1
2.08
20.1
2.08
21.1
2.08
21.1
2.08
22.1
2.08
23.1
2.08
23.1
2.08
24.1
2.08
25.1
2.08
25.1
2.08
26.1
2.08
27.1
2.08
27.1
2.08
28.1
2.08
29.1
2.08
29.1
2.08
30.1
2.08
31.1
2.08
31.1
2.08
CO2 App. 1
CO2 App. 3
Ap 1 Ap 3
1,000 ppm 2,000 ppm PPD around 35% 10 people in one apartment Recirculation of exhaust air
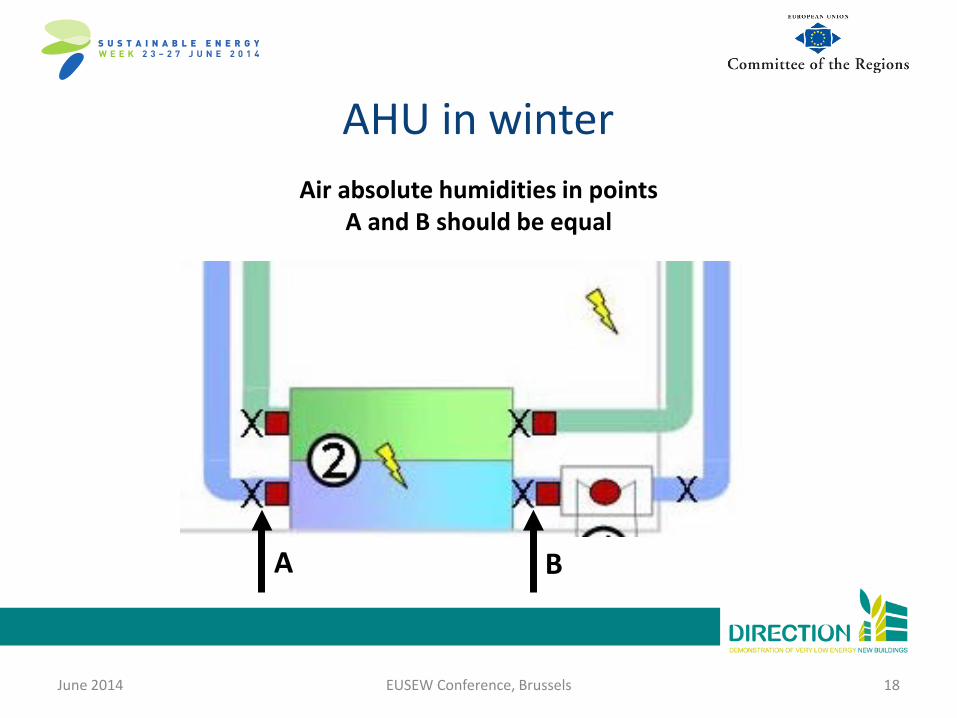
AHU in winter
June 2014 EUSEW Conference, Brussels 18
A B
Air absolute humidities in points A and B should be equal
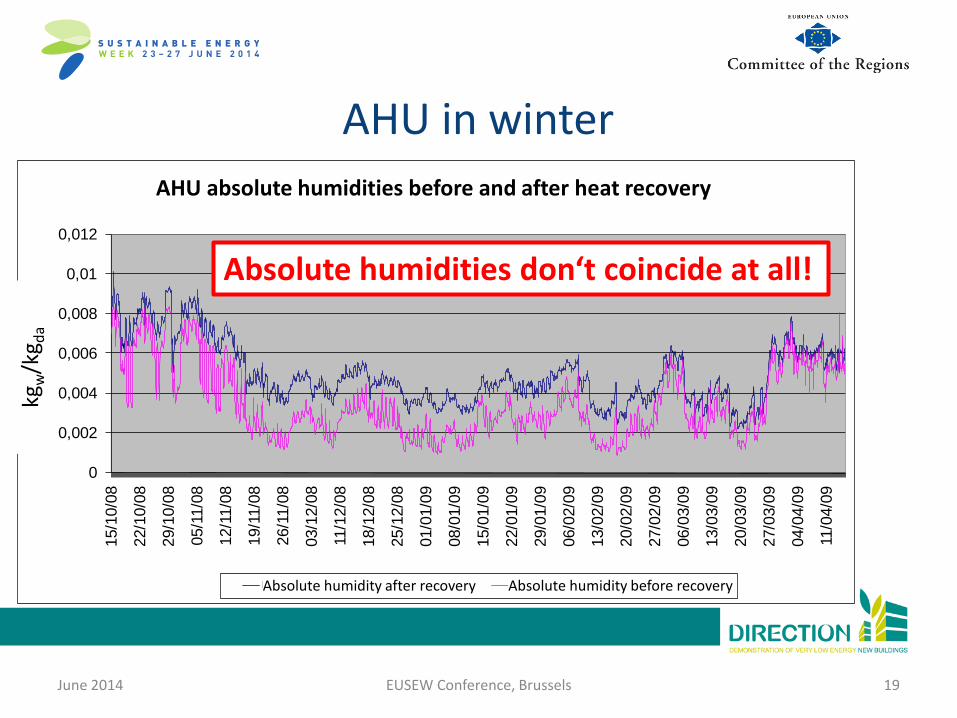
AHU in winter
June 2014 EUSEW Conference, Brussels 19
0
0,002
0,004
0,006
0,008
0,01
0,012
15/1
0/08
22/1
0/08
29/1
0/08
05/1
1/08
12/1
1/08
19/1
1/08
26/1
1/08
03/1
2/08
11/1
2/08
18/1
2/08
25/1
2/08
01/0
1/09
08/0
1/09
15/0
1/09
22/0
1/09
29/0
1/09
06/0
2/09
13/0
2/09
20/0
2/09
27/0
2/09
06/0
3/09
13/0
3/09
20/0
3/09
27/0
3/09
04/0
4/09
11/0
4/09
[kg
vapo
re/k
g ar
ia]
Confronto dell'umidità assoluta di ventilazione
Umiditá assoluta dopo recupero Umiditá assoluta prima recupero
AHU absolute humidities before and after heat recovery
kgw
/kg da
Absolute humidity after recovery
Absolute humidities don‘t coincide at all!
Absolute humidity before recovery
AHU problems • In winter, 50-60% of supply air is recirculation air • In summer 10-20%
High temperature and humidity in summer High CO2 levels Open windows to ensure healthy air exchange
June 2014 EUSEW Conference, Brussels 20
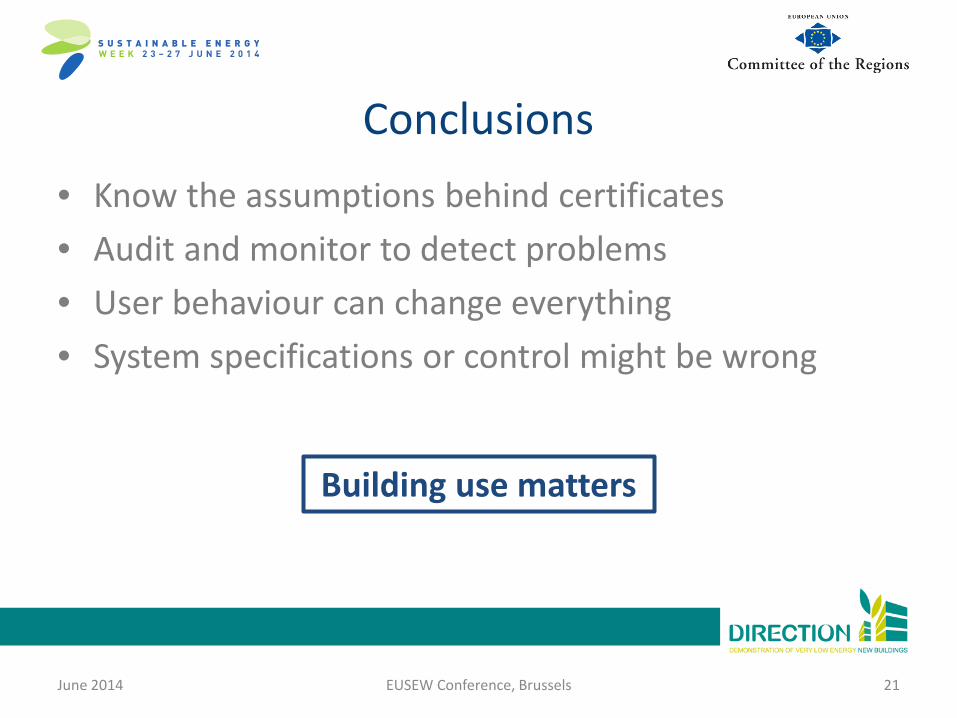
Conclusions • Know the assumptions behind certificates • Audit and monitor to detect problems • User behaviour can change everything • System specifications or control might be wrong
June 2014 EUSEW Conference, Brussels 21
Building use matters
Thank you for your attention
June 2014 EUSEW Conference, Brussels 22
Ulrich Filippi Oberegger EURAC research
[email protected] www.eurac.edu


![Belgian National Plan Nearly Zero Energy Buildings · Belgian National Plan Nearly Zero Energy Buildings - September 2012 [6] 1.1.3 The drawing-up and structure of the Belgian National](https://img.pdfslide.net/doc/110x75/5e99be345348ef021d25a130/belgian-national-plan-nearly-zero-energy-buildings-belgian-national-plan-nearly.jpg)