Embed Size (px)
Citation preview

Consolidated Financial Results for the Fiscal Year Ended March 31, 2017
April 27, 2017
Corporate name: NEC Capital Solutions Limited
Stock exchange listings: Tokyo Stock Exchange, First Section
Stock code: 8793
Website (URL): http://www.necap.co.jp/
Representative’s name and title: Masahiro Annaka, President
Contact: Seiichiro Kodama, General Manager of IR & PR Department
TEL (03) 6720-8400
(Amounts are rounded down to the nearest million yen) 1. Consolidated Financial Results for the fiscal year ended March 31, 2017(From April 1, 2016 to March 31, 2017)
(Percentage shows increase/decrease from previous term)
(1) Consolidated Business Results
Revenues Operating Income Ordinary Income Profit attributable to
owners of parent
Million Yen % Million Yen % Million Yen % Million Yen %
Fiscal year ended March
31, 2017 215,718 6.5 6,024 23.7 6,537 8.4 3,517 5.5
Fiscal year ended March
31, 2016 202,637 (5.2) 4,870 (19.4) 6,031 27.4 3,334 18.4
(Note) Comprehensive income: FY2016: 5,699 Million Yen 174.8% FY2015: 2,074 Million Yen (14.2)%
Net Income
per Share:
Basic
Net Income
per Share:
Diluted
Ratio of Net Income
to Shareholders’
Equity
Ratio of Ordinary
Income to Total
Assets
Ratio of Operating
Income to Net Sales
Yen Yen % % %
Fiscal year ended
March 31, 2017 163.35 - 4.5 0.8 2.8
Fiscal year ended
March 31, 2016 154.85 - 4.4 0.7 2.4
(Reference) Equity in earnings of affiliated companies: FY2016: 95 Million Yen FY2015: 43 Million Yen
(2) Consolidated Financial Position
Total Assets Net Assets Equity Ratio Net Assets per share
Million Yen Million Yen % Yen
As of March 31, 2017 860,482 108,821 9.2 3,675.84
As of March 31, 2016 828,943 101,026 9.2 3,529.64
(Reference) Shareholders’ Equity: March 31,2017: 79,151 Million Yen March 31 2016: 76,003 Million Yen
NEC Capital Solutions Limited (8793) Consolidated Financial Results for the fiscal year ended March 31, 2017
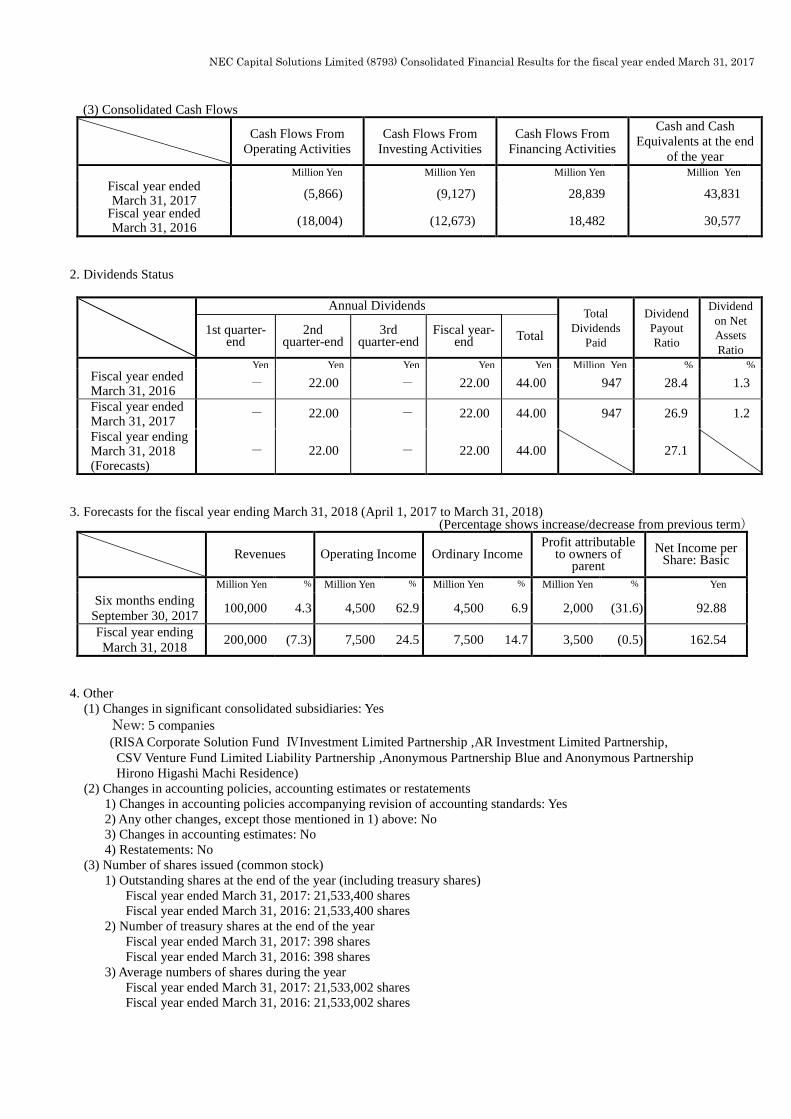
(3) Consolidated Cash Flows
Cash Flows From
Operating Activities
Cash Flows From
Investing Activities
Cash Flows From
Financing Activities
Cash and Cash
Equivalents at the end
of the year
Million Yen Million Yen Million Yen Million Yen
Fiscal year ended March 31, 2017
(5,866) (9,127) 28,839 43,831
Fiscal year ended March 31, 2016
(18,004) (12,673) 18,482 30,577
2. Dividends Status
Annual Dividends Total
Dividends
Paid
Dividend
Payout
Ratio
Dividend
on Net
Assets
Ratio
1st quarter-end
2nd quarter-end
3rd quarter-end
Fiscal year-end Total
Yen Yen Yen Yen Yen Million Yen % % Fiscal year ended March 31, 2016
- 22.00 - 22.00 44.00 947 28.4 1.3
Fiscal year ended March 31, 2017
- 22.00 - 22.00 44.00 947 26.9 1.2
Fiscal year ending March 31, 2018 (Forecasts)
- 22.00 - 22.00 44.00 27.1
3. Forecasts for the fiscal year ending March 31, 2018 (April 1, 2017 to March 31, 2018)
(Percentage shows increase/decrease from previous term)
Revenues Operating Income Ordinary Income
Profit attributable to owners of
parent
Net Income per Share: Basic
Million Yen % Million Yen % Million Yen % Million Yen % Yen
Six months ending
September 30, 2017 100,000 4.3 4,500 62.9 4,500 6.9 2,000 (31.6) 92.88
Fiscal year ending
March 31, 2018 200,000 (7.3) 7,500 24.5 7,500 14.7 3,500 (0.5) 162.54
4. Other
(1) Changes in significant consolidated subsidiaries: Yes
New: 5 companies
(RISA Corporate Solution Fund ⅣInvestment Limited Partnership ,AR Investment Limited Partnership,
CSV Venture Fund Limited Liability Partnership ,Anonymous Partnership Blue and Anonymous Partnership
Hirono Higashi Machi Residence)
(2) Changes in accounting policies, accounting estimates or restatements
1) Changes in accounting policies accompanying revision of accounting standards: Yes
2) Any other changes, except those mentioned in 1) above: No
3) Changes in accounting estimates: No
4) Restatements: No
(3) Number of shares issued (common stock)
1) Outstanding shares at the end of the year (including treasury shares)
Fiscal year ended March 31, 2017: 21,533,400 shares
Fiscal year ended March 31, 2016: 21,533,400 shares
2) Number of treasury shares at the end of the year
Fiscal year ended March 31, 2017: 398 shares
Fiscal year ended March 31, 2016: 398 shares
3) Average numbers of shares during the year
Fiscal year ended March 31, 2017: 21,533,002 shares
Fiscal year ended March 31, 2016: 21,533,002 shares

NEC Capital Solutions Limited (8793) Consolidated Financial Results for the fiscal year ended March 31, 2017
This Consolidated Financial Results Report for the fiscal year is out of scope of the audit procedures based on the Financial
Instruments and Exchange Act of Japan.
Forecasts are based on the information available to management at the time they were made. Actual results may differ
materially from forecasts for a number of reasons.

NEC Capital Solutions Limited (8793) Consolidated Financial Results for the fiscal year ended March 31, 2017
Consolidated Financial Report (1) Consolidated Balance Sheets
(Unit: Million Yen)
Term
Items As of March 31, 2016 As of March 31, 2017
(Assets)
I. Current assets
1. Cash on hand and in banks 30,254 43,950
2. Accounts receivable, installment sales 17,090 15,891
3. Leases receivables and investment in leases 413,200 404,535
4. Accounts receivable, leases 17,633 19,315
5. Accounts receivable, loans 189,265 212,962
6. Purchased receivables 17,135 20,725
7. Operational investment securities 6,399 11,240
8. Real estate for sale 39,698 28,206
9. Prepaid expenses 618 582
10. Income taxes receivable 174 153
11. Deferred tax assets 4,140 4,091
12. Other 12,442 12,011
13. Allowance for doubtful accounts (7,601) (7,394)
Total current assets 740,452 766,272
II. Fixed assets
(1) Property and equipment, net
(A) Leased assets
1. Leased assets 46,099 45,593
Total leased assets 46,099 45,593
(B) Assets held for own use
1. Buildings 313 295
2. Machinery and equipment 3,117 3,644
3. Furniture and fixtures 266 202
Total assets held for own use 3,697 4,141
Total Property and equipment, net 49,797 49,735
(2) Intangible assets
(A) Computer programs leased to customers
1. Leased assets 939 1,078
Total computer programs leased to customers 939 1,078
(B) Other intangible assets
1. Software 3,341 2,229
2. Software in progress 230 181
3. Goodwill 5,454 4,377
4. Other 23 22
Total other intangible assets 9,049 6,811
Total Intangible assets 9,988 7,890
NEC Capital Solutions Limited (8793) Consolidated Financial Results for the fiscal year ended March 31, 2017
(Unit: Million Yen)
Term
Items As of March 31, 2016 As of March 31, 2017
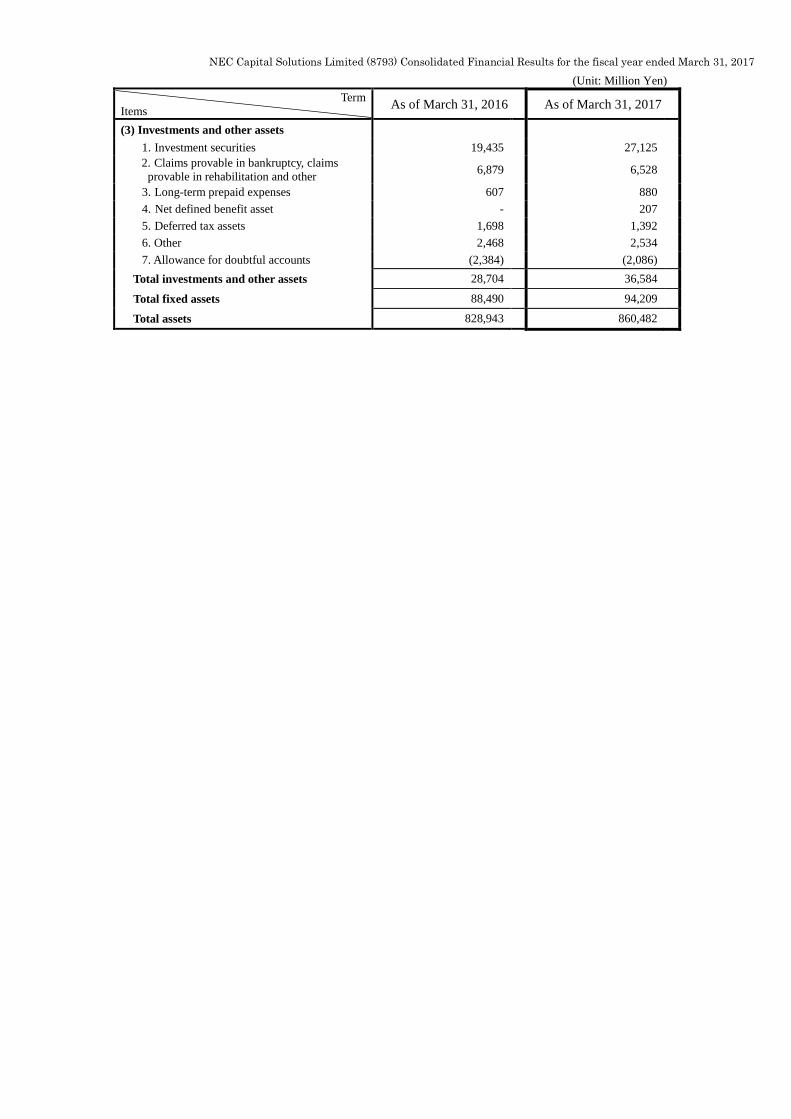
(3) Investments and other assets
1. Investment securities 19,435 27,125
2. Claims provable in bankruptcy, claims
provable in rehabilitation and other 6,879 6,528
3. Long-term prepaid expenses 607 880
4. Net defined benefit asset - 207
5. Deferred tax assets 1,698 1,392
6. Other 2,468 2,534
7. Allowance for doubtful accounts (2,384) (2,086)
Total investments and other assets 28,704 36,584
Total fixed assets 88,490 94,209
Total assets 828,943 860,482

NEC Capital Solutions Limited (8793) Consolidated Financial Results for the fiscal year ended March 31, 2017
(Unit: Million Yen)
Term
Items As of March 31, 2016 As of March 31, 2017
(Liabilities)
I. Current liabilities
1. Notes payable, trade 1,123 417
2. Accounts payable, trade 12,770 14,273
3. Short-term borrowings 24,873 49,343
4. Current portion of long-term debt 154,180 111,602
5. Current portion of bonds 10,000 -
6. Commercial paper 107,000 152,000
7. Payable under securitized lease receivables
due within a year 9,219 6,399
8. Accounts payable, other 1,443 783
9. Accrued expenses 4,026 4,369
10. Accrued income taxes 2,865 197
11. Advances received, lease 9,546 9,526
12. Deposits received 3,738 3,613
13. Unearned revenue 376 530
14. Allowance for bonuses 617 671
15. Other 572 591
Total current liabilities 342,353 354,321
II. Long-term liabilities
1. Bonds 50,000 70,000
2. Long-term debt 316,739 305,672
3. Payable under securitized lease receivables 7,184 10,729
4. Net defined benefit liability 1,975 2,275
5. Other 9,662 8,662
Total long-term liabilities 385,562 397,339
Total liabilities 727,916 751,661
(Net assets)
I. Shareholders’ equity
1. Common stock 3,776 3,776
2. Capital surplus 4,648 4,648
3. Retained earnings 67,277 69,847
4. Treasury stock, at cost (0) (0)
Total shareholders’ equity 75,701 78,271
II. Accumulated other comprehensive income
1. Net unrealized gains on marketable securities 805 917
2. Deferred losses on hedging derivatives (597) (219)
3. Foreign currency translation adjustments 197 199
4. Remeasurements of defined benefit plans (103) (17)
Total accumulated other comprehensive
income 302 880
III. Non-controlling interests 25,023 29,669
Total net assets 101,026 108,821
Total liabilities and net assets 828,943 860,482

NEC Capital Solutions Limited (8793) Consolidated Financial Results for the fiscal year ended March 31, 2017
(2) Consolidated Statements of Income and Consolidated Statements of Comprehensive Income
(i) Consolidated Statements of Income (Unit: Million Yen)
Term
Items
Fiscal year ended
March 31, 2016
Fiscal year ended
March 31, 2017
I. Revenues 202,637 215,718
II. Costs 181,391 192,401
Gross profit 21,245 23,316
III. Selling, general and administrative
expenses 16,374
17,292
Operating income 4,870 6,024
IV. Non-operating income
1. Interest income 16 7
2. Dividend income 38 61
3. Gain on sales of investment securities 14 3
4. Equity in earnings of affiliates 43 95
5. Foreign exchange gains 897 297
6. Gain on bad debts recovered - 63
7. Gain on investment in partnerships 147 50
8. Other 142 35
Subtotal 1,300 615
V. Non-operating expenses
1. Interest expense 44 31
2. Loss on investment in partnerships 49 50
3. Loss on valuation of investment securities 12 18
4. Other 32 1
Subtotal 139 102
Ordinary income 6,031 6,537
VI. Extraordinary income
Gain on reversal of foreign currency
transaction adjustment - 70
Subtotal - 70
Income before income taxes and minority
interests
6,031
6,608
Income taxes, current 3,014 1,393
Income taxes, deferred 188 133
Total 3,203 1,527
Profit 2,828 5,080
Loss attributable to non-controlling interests (505) 1,563
Profit attributable to owners of parent 3,334 3,517

NEC Capital Solutions Limited (8793) Consolidated Financial Results for the fiscal year ended March 31, 2017
(ii) Consolidated Statements of Comprehensive Income (Unit: Million Yen)
Term
Items
Fiscal year ended
March 31, 2016
Fiscal year ended
March 31, 2017
I. Profit 2,828 5,080
II. Other comprehensive income
1. Net unrealized gains (losses) on marketable
securities (320) 121
2. Deferred losses on hedging derivatives (81) 351
3. Foreign currency translation adjustments (65) 1
4. Remeasurements of defined benefit plans (170) 86
5. Share of other comprehensive income of
associates accounted for using equity method (116) 57
Subtotal (754) 618
Comprehensive income 2,074 5,699
Comprehensive income attributable to:
Owners of the parent 2,582 4,095
Non-controlling interests (508) 1,603

NEC Capital Solutions Limited (8793) Consolidated Financial Results for the fiscal year ended March 31, 2017
(3) Consolidated Statement of Changes in Net Assets
Fiscal year ended March 31, 2016 (Unit: Million Yen)
Shareholders’ equity
Common
stock
Capital
surplus
Retained
earnings
Treasury
stock
Total
shareholders’
equity
Balance at March 31,
2015 3,776 4,648 64,890 (0) 73,314
Changes of items
during the fiscal year
Cash dividends (947) (947)
Profit attributable to
owners of parent 3,334 3,334
Net changes of items
other than shareholders’
equity during the fiscal
year
Total changes of items
during the fiscal year - - 2,386 - 2,386
Balance at March 31,
2016 3,776 4,648 67,277 (0) 75,701
Accumulated other comprehensive income
Non- controlling
interests
Total net assets
Net unrealized gains (losses) on marketable
securities
Deferred
losses on hedging
derivatives
Foreign
currency translation
adjustments
Remeasurements
of defined benefit
plans
Total accumulated
other
comprehensive income
Balance at March 31,
2015 1,145 (420) 262 66 1,054 31,558 105,927
Changes of items
during the fiscal year
Cash dividends (947)
Profit attributable to
owners of parent 3,334
Net changes of items
other than shareholders’
equity during the fiscal
year
(339) (177) (64) (170) (751) (6,535) (7,287)
Total changes of items
during the fiscal year (339) (177) (64) (170) (751) (6,535) (4,900)
Balance at March 31,
2016 805 (597) 197 (103) 302 25,023 101,026

NEC Capital Solutions Limited (8793) Consolidated Financial Results for the fiscal year ended March 31, 2017
Fiscal year ended March 31, 2017 (Unit: Million Yen)
Shareholders’ equity
Common
stock
Capital
surplus
Retained
earnings
Treasury
stock
Total
shareholders’
equity
Balance at March 31,
2016 3,776 4,648 67,277 (0) 75,701
Changes of items
during the fiscal year
Cash dividends (947) (947)
Profit attributable to
owners of parent 3,517 3,517
Net changes of items
other than shareholders’
equity during the fiscal
year
Total changes of items
during the fiscal year - - 2,570 - 2,570
Balance at March 31,
2017 3,776 4,648 69,847 (0) 78,271
Accumulated other comprehensive income
Non- controlling
interests
Total net assets
Net unrealized gains on
marketable securities
Deferred losses on
hedging
derivatives
Foreign currency
translation
adjustments
Remeasurements
of defined benefit plans
Total
accumulated
other comprehensive
income
Balance at March 31,
2016 805 (597) 197 (103) 302 25,023 101,026
Changes of items
during the fiscal year
Cash dividends (947)
Profit attributable to
owners of parent 3,517
Net changes of items
other than shareholders’
equity during the fiscal
year
111 378 2 86 578 4,646 5,224
Total changes of items
during the fiscal year 111 378 2 86 578 4,646 7,794
Balance at March 31,
2017 917 (219) 199 (17) 880 29,669 108,821

NEC Capital Solutions Limited (8793) Consolidated Financial Results for the fiscal year ended March 31, 2017
(4) Consolidated Statements of Cash Flows (Unit: Million Yen)
Term
Items
Fiscal Year ended
March 31, 2016
Fiscal Year ended
March 31, 2017
I. Cash Flows From Operating Activities
Income before income taxes and minority interests 6,031 6,608
Depreciation and amortization 9,572 9,680
Impairment loss 717 -
Amortization of goodwill 1,077 1,077
(Decrease) in allowance for doubtful accounts (2,050) (504)
Increase in allowance for bonuses 9 54
Increase in net defined benefit liability 14 275
Interest and dividend income (54) (69)
Interest expense 4,795 4,728
Equity in earnings of affiliated companies (43) (95)
Exchange gain (3,444) 414
Gain on sales of investment securities (14) (3)
Loss on valuation of investment securities 12 18
Gain on reversal of foreign currency transaction
adjustment - (70)
Decrease (Increase) in installment sales receivables (1,546) 1,199
Decrease (Increase) in lease receivables and investment
in leases (16,284) 8,664
(Increase) in loans receivable (14,999) (23,696)
(Increase) in trading receivables (885) (1,682)
(Increase) Decrease in purchased receivables 3,011 (3,590)
(Increase) Decrease in operational investment securities 2,768 (4,841)
Decrease in real estate for sale 5,323 10,226
Purchases of leased assets (6,126) (5,982)
Proceeds from sales of leased assets 1,097 2,173
Increase (Decrease) in trading accounts payables (2,535) 1,232
Other, net (816) (3,039)
Subtotal (14,369) 2,778
Interest and dividend income received 59 69
Interest paid (4,898) (4,732)
Income taxes paid (508) (3,982)
Income taxes refund 1,711 -
Net cash used in operating activities (18,004) (5,866)
II. Cash Flows From Investing Activities
Purchases of assets held for own use (3,329) (1,844)
Purchases of investment securities (11,912) (10,445)
Proceeds from sales of investment securities 176 364
Proceeds from redemption of investment securities 2,320 2,648
Other, net 72 150
Net cash used in investing activities (12,673) (9,127)

NEC Capital Solutions Limited (8793) Consolidated Financial Results for the fiscal year ended March 31, 2017
(Unit: Million Yen)
Term
Items
Fiscal Year ended
March 31, 2016
Fiscal Year ended
March 31, 2017
III. Cash Flows From Financing Activities
Increase in short-term borrowings, net 12,716 24,439
Increase in commercial paper 41,000 45,000
Increase in long-term debt 156,862 119,667
Repayment of long-term debt (192,753) (173,101)
Proceeds from securitized lease receivables 10,133 10,705
Repayment of securitized lease receivables (7,502) (9,980)
Proceeds from issuance of bonds 20,000 20,000
Redemption of bonds (15,000) (10,000)
Cash dividends paid (947) (926)
Cash dividends paid to non-controlling interests (8,832) (3,033)
Proceeds from stock issuance to non-controlling
shareholders 2,805 6,069
Net cash provided by financing activities 18,482 28,839
Foreign currency translation adjustments on cash and
cash equivalents (428) (591)
IV. Net increase (decrease) in cash and cash equivalents (12,623) 13,254
V. Cash and cash equivalents at beginning of year 43,200 30,577
VI. Cash and cash equivalents at end of year 30,577 43,831