Embed Size (px)
Citation preview
NEER WORKING PAPER SERIES
INVESTMENT OPPORTUNITIES,MANAGERIAL DISCRETION, ANDTHE SECURITY ISSUE DECISION
Kooyul JungYong-Cheol Kim
René M. Stulz
Working Paper No. 4907
NATIONAL BUREAU OF ECONOMIC RESEARCH1050 Massachusetts Avenue
Cambridge, MA 02138October 1994
We are grateful for useful comments to Steve Buser, K.C. Clan, David Denis, Harry DeAngelo.Thomas George, David Mayers, John Persons, Pairicia Reagan, David Scharfstein. Chester Span,Robert Vishny, an anonymous referee, and to the participants in the 1993 NBER Summerthstitute and at finance seminars at the Hong Kong Institute of Science and Technology,University of British Columbia, the Ohio State University and the University of St. Gallen. Thispaper is part of NEER's research program in Corporate Finance. Any opinions expressed arethose of the authors and not those of the National Bureau of Economic Research.
1994 by Kooyul Jung. Yong-Cheol Kim, and René M. Stulz. All rights reserved. Shortsections of text, not to exceed two paragraphs. may be quoted without explicit permissionprovided that full credit, including notice, is given to the source.
NBER Working Paper #4907October 1994
INVESTMENT OPPORTUNITIES,MANAGERIAL DISCRETION, ANDThE SECURITY ISSUE DECISION
ABSTRACT
With agency costs of managerial discretion, equity financing is advantageous for the
shareholders of firms with valuable investment opportunities but not for the shareholders of other
firms. Accordingly, we find that firms with good investment opportunities are more likely to
issue equity than debt, have a smaller abnormal return in absolute value when the issue is
announced, and experience substantial asset growth following the issue. Firms that issue equity
even though they do not have good investment opportunities experience a larger abnormal return
in absolute value when the issue is announced and invest morn after the issue than comparable
firms that issue debt.
Kooyul Jung Yong-Cheol KimMJ Neeley School of Business Department of FinanceTexas Christian University Clemson UniversityFort Worth, TX 76129 314 Sirriew
Clemson, SC 29634-1301
René M. StulzDepartment of FinanceThe Max M. Fisher College of BusinessThe Ohio State University1775 S. College Road, Room 314Columbus, OH 43210and NBER
SectIon 1. IntroductIon.
Why is it that some firms issue equity and others debt when they raise new funds? The most
popular story, the pecking-order story, is based on the view that Information asymmetries between
managers and new investors make equity issues more costly than debt Issues and therefore imply a
financing hierarchy.' Investors in low flsk debt are affected only to a small extent If management attempts
to seH them overvalued securities and therefore do not discount the securities sold much to proteci
themselves against this adverse selection risk. In contrast, this flsk is large for investors who buy equity
because the value of equity is much more sensitive to new information about the finn's true value. Firms
therefore prefer issuing debt to issuing equity and firnis that cannot avoid Issuing equity experience a
negative stock-price reaction when they do so. This popular story assumes that management maximizes
the wealth of existing shareholders. It leaves no role for the agency costs of managerial discretion that arise
because managements objectives differ from those of shareholders and (or the agency costs of debt that
result from the divergence between the investment policy that maximizes finn value and the one that
maximizes shareholder wealth br a given level of leverage. In this paper we take agency costs seriously
and provide evidence that the popular story should be amended to take mb account the existence of these
costs.
In much of the recent agency literature, ft is assumed that the agency costs of managerial discretion
arise because management values growth even when growth does not benefit shareholders. Wth this view,
management is reluctant to pay out the firm's cash flow, preferring to use it to finance new projects even
when they have a negative net present value (NPV). Management dislikes debt financing because it
restricts its ability to pursue growth. Ii management issues debt, ft has to pay a coupon regularly, satisfy
covenants, and take the risk of losing control of the corporation if it falls to follow the bond indenture. One
way to state this is that debtholders monitor management.2 In contrast, for some firms, an equity issue can
See Myers (1 914). Information asymmetries between management and outside investors do notnecessarily imply a financing hierarchy. Examples of models which emphasize Inbormational asymmetriesbut do not obtain a pecking-order result are Brennan and Kraus (1987) and Noe (1985).
2 See Harris and Raviv (1990), Hart and Moore (1990). Jensen (1986) and Stulz (1990).
be very much like an infusion of free cash flow, i.e., of funds that management can spend without being
monitored. Therefore, if management wants to invest in a project of marginal value and does not have
inside funds available, it is more likely to be able to do so If the firm has low leverage and it will prefer to
finance ft with an equity issue.
Though debt financing restricts managements discretion to pursue growth objectives. ft fails to
discriminate perfectly between management exploiting positive NPV growth opportunities and management
growing firm size at the expense of firm value. This means that debt financing is advantageous for
shareholders when a firm has poor investment opportunities, because it constrains management to pay out
cash flow, but not when a firm has good investment opportunities, because ft may prevent that firm from
fully taking advantage of its opportunities. Since equity increases managerial discretion, management would
rather finance with equity if internal funds are insufficient. However, the value of the firm when management
finances with equity inappropriately is lower and therefore outside investors are more likely to intervene and
remove or restrict management.' The greater threat of outside intervention resulting from equity financing
limits the extent to which management finances projects with equity Issues and explains why management
which issues equity when it does not have good projects conveys bad news to shareholders, since it
effectively says that it is not concerned about intervention from outside investors.
In this paper, we find evidence that firms issuing equity belong to two types based on firm
characteristics that are observable at the time of the issue. There are firms with valuable investment
opportunities that obtain financing through an equity issue because this makes them better able to grow
profitably. There are also equity-issuing firms that have poor investment opportunities and have not
exhausted their debt capacity. Without agency costs of managerial discretion, one would not expect the
latter firms to issue equity. Equity issues by such firms are bad news for shareholders and we show that,
controlling for other firm and Issue characteristics, firrns with poor investment opportunities have a more
negative stock-price reaction to equity issues than firms with better investment opportunities. We provide
Further, as argued in Stulz (1988). equity financing reduces the extent to which management and itsames control votes within the corporation and hence makes outside intervention easier.
2
other evidence supporting the view that some firms issue equity when they should not If their management
was maximizing shareholder wealth. In particular, we show that finns with poor Investment opportunities
issuing equity invest more than similar firms issuing debt, that firms with low managerial ownership have
worse stock-price reactions, and that the worst stock-price reactions occur for firms with poor Investment
opportunities issuing equity to finance capital expenditures.
We proceed as follows. In section 2. we provide a more detailed analysis of the agency argument
and of its implications for the Interpretation of the stock-price reaction to equity Issues. In section 3, we
introduce our sample and discuss the characteristics of firms issuing debt and equity. In section 4, we
provide our evidence that investment opportunities play an Important role in firms' issuing decisions. In
section 5, we investigate how the stock-price reaction relates to firm characteristics. In section 6, we show
that debt and equity issuing firms have distinct investment patterns following the new issue. Concluding
remarks are presented in section 7.
Section 2. Agency costs and the security Issue decIsIon.
To understand the role of agency costs in the security issue decision, It is best to investigate a
special case of Myers and Majluf (1984). In their model, management has better information than Investors
about assets in place and about the firm's investment opportunities. If management can issue securities
at a higher price than they are truly worth given its information, it chooses to do so to maximize the wealth
of the existing shareholders. Riskless debt cannot be sold for more than it is worth, but risky debt and
equity can. When the firm announces issues of risky securities, therefore, outsiders adjust their valuation
of the firm to reflect the new information. This adjustment is trivial If the securities issued are not very
sensitive to firm value, but is significant in the case of equity. The valuation Impact of equity issues
increases their cost and induces firms to issue equity only as a way of raising funds when debt financing
would be extremely costly because the firm has exhausted its ability to sell low risk debt. For these results
to hold, though, it is crucial for outsiders to be less well-informed than management about both components
of firm value.
3

Suppose now that outsiders know the value of assets in place in the Myers and Majluf model. Then,
as recognized by Myers and Majiul, the model collapses: The firm always Invests if it has a positive NPV
project and, in thek set-up, always issues equity to finance It. With agency costs, this special case remains
interesting because management may choose to issue to invest in a negative NPV project to maintain firm
growtk Consider an all-equity firm such that outsiders expect the firm to have no profitable investment
opportunities. If the firm issues to invest, it is good news if management maxirrüzes shareholder wealth
because it means that a good project arrived to the firm unexpectedly. However, suppose that the
probability of arrival of a good project is trivial and outsiders are uncertain about the extent to which
management is willing to invest in negative NPV projects to grow the firm. It management finances
investment through a debt issue, it has to be prepared to Face monitoring by creditors who want to make
sure coupons and principal will be paid and the bond indenture respected. ThereFore, It will be difficult for
management to finance a negative NPV project with debt unless the 1km has so little leverage that
monitoring by creditors is irrelevant. If the firm has enough leverage that creditors would monitor.
management will choose to issue equity if it decides to undertake the bad project and management's
decision is bad news for shareholders.
If the firm has good projects, high leverage will make it less likely that It can take full advantage
of these projects. For instance, any adverse liquidity shock Is more likely to force a highly levered firm to
cut back on investment than an all-equity firm.' Consequently, firms with good projects want to limit their
leverage and, if levered, are more likely to choose equity financing.5 The agency costs that arise because
a levered firm may be unable to pursue the investment policy that would maximize the value of an all-equity
firm are called here the agency costs of debt.
See Bernanke, Gertler and Gilchrist (1993) for a review of the literature on the relation betweenliquidity shocks and investment. Lang, Ofek and Stulz (1994) show that investment is negatively related toleverage for low q firms.
$ There is cross-sectional evidence which shows that firms with better investment opportunities havelower leverage. See, for instance, Titman and Wessels (19B8) and Smith and Watts (1992). Note, however,that there is a mechanical negative relation between market leverage and Tobin's q if firms adjust leverageinfrequently, since market leverage falls as the numerator of q increases.
4
In figure I. we show the optimal amount of leverage for given Investment opportunities if the agency
costs of debt increase with leverage and if the agency costs of managerial discretion fall with leverage. We
show how a shift in investment opportunities leads to a decrease in leverage: For each level of leverage,
an increase in investment opportunities (1) increases the agency costs of debt because the firm has more
to lose from financial distress and (2) decreases the agency costs of managerial discretion because the
objectives of management and shareholders become more congruent when Investment opportunities
become better.
Since equity provides unrestricted funds, why is It that management ever chooses to Issue debt?
Issuing equity has both direct and indirect consequences for management. The direct effect is an increase
in managerial discretion that management values. However, the indirect effect can be quite adverse for
management depending on the firm's situation. If the firm does not have valuable investment opportunities,
an equity issue means that the agency costs of managerial discretion increase, which provides greater
incentives for outsiders to try to affect management's actions.' In particular, control activities, such as
takeovers, more active monitoring by large shareholders, more monitoring by board members, and proxy
fights, all became more advantageous for shareholders and outside investors, Issuing equity inappropnately
can therefore increase the probability that management will lose control through corporate control actions
unless management is well protected from such actions. Further, for a given amount invested in the firm
by management and its allies, equity financing reduces the fraction of votes controlled by management and
its allies (see Stulz (1988)). Consequently, equity financing both increases the benefits from outside
intervention and makes outside intervention easier.
Taking into account the agency costs of managerial discretion makes the information content of new
security issues more complicated. To understand this information content, It Is best to focus on the relation
6 See Zwiebel (1994) for a model where management issues debt because of a threat from the marketfor corporate control. Hoshi, Kashyap and Scharfstein (1993) also have a related model where the betterfirms choose financing with low monitoring, intermediate quabty firms choose financing with high monitoring,and the worst firms chose financing with low monitoiing. In their paper, financing with low monitoring ispubHc debt and financing with high monitoring is bank financing. Here, financing with low monitoring isequity and financing with high monitoring is pubc debt.
5
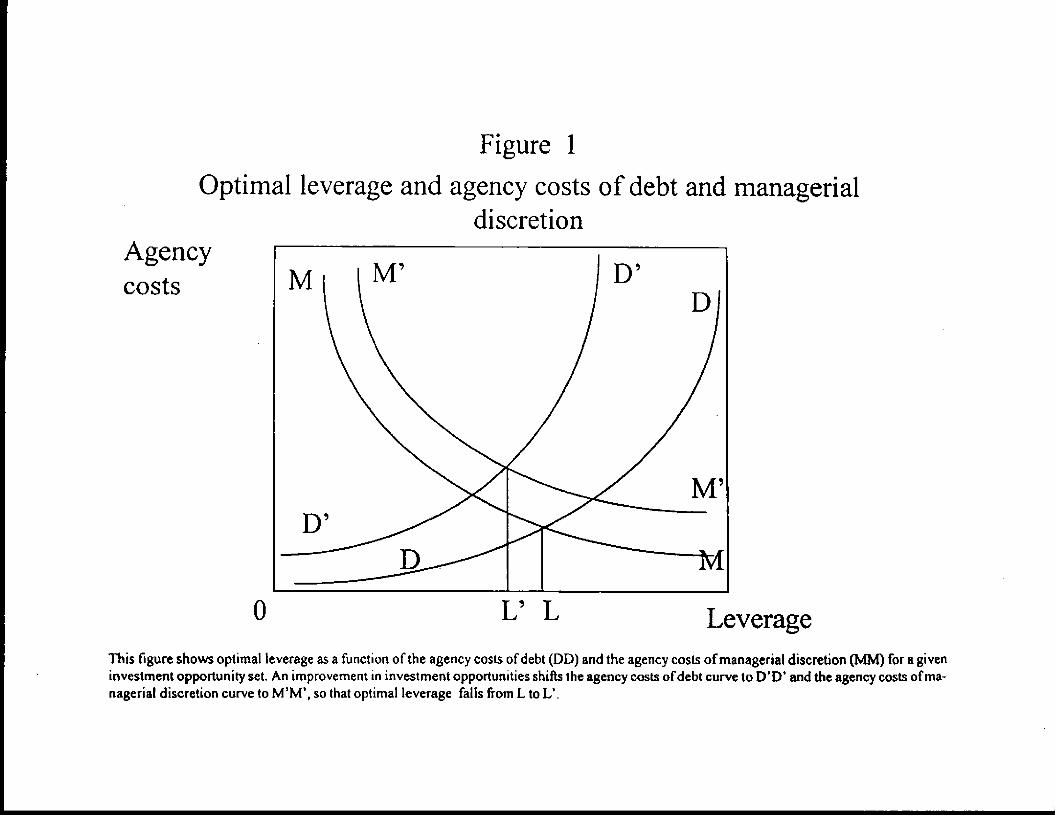
This figure shows optimal leverage as a function of the agency costs of debt (DD) and the agency costs of managerial discretion (MM) for agiveninvestment opportunity set. An improvement in investment opportunities shifts the agency costs of debt curve to D'D' and the agency costs of ma-nagerial discretion curve to M'M', so that optimal leverage falls from L to U.
Agencycosts
Figure 1Optimal leverage and agency costs of debt and managerial
discretion
0 L'L Leverage
between stock-price reactions and a firm's investment opportunities since the agency costs of managerial
discretion are inversely related to the quality of the firm's investment opportunities. lithere Is no uncertainty
about the value of a firm's investment opportunities, the issuing decision is straightforward in the pecking-
order model, If a firm has sufficiently good investment opportunIties, It issues equity ltd cannot issue debt
and the issue is not very informative about the value of assets in place If the investment opportunities are
good enough. In contrast, lithe lirm has poor Investment opportunities, ft never Issues equity. For firms with
sufficiently good investment opportunities, one would expect the interests of management and shareholders
to coincide so that there is no reason to depart from the pecking-order model. Firms that can finance with
low risk debt do so; those that cannot either issue equity or do not Invest if equity Is too underpriced. For
firms that have poor investment opportunities, however, there are good reasons to expect departures from
the pecking-order model if management pursues objectives of Its own. In particular, management may issue
equity to keep the firm growing even though the firm has no good Investment opportunities. For such firms,
an equity issue reveals to outsiders that management has to raise funds to finance Its plans, that it has
decided to proceed with poor investments and, finally, that it views the risks to Its position from doing all
this to be worth taking. If the equity issues are equally unanticipated for both firms, the news for outsiders
is worse for the firm with poor investment opportunities.
At this point, it is useful to summarize the view that agency costs matter for security issues by
showing how these costs affect the firm's decision of which security to Issue (the Issue decision), how
stock-price reactions are consistent with the existence of such costs (the information content), and how the
firm's behavior after the issue is affected by these costs (theex post actions):
1. The issue decision. Agency considerations imply that, keeping the threat of successful outside
intervention constant, managers favor equity over debt, so that for firms where the agency costs of
managerial discretion are important, one would expect management to Issue equity even though
shareholders would be better off with a debt issue or no issue at all.
2. The infonnation content An equity issue that Is not In the Interests of shareholders has a
negative impact on shareholder wealth to the extent that it is not anticipated. This is because the funds are
6

kety to be invested poorly and because management is not as constrained by monitoflng from outside
investors as was expected.
3. The ex post actions. One would expect equity-issuing firms to grow more than comparable debt-
issuing Arms, whether their investment opportunities are valuable or not.
It is important to note that the implications of agency costs do not make the considerations
emphasized in the pecking-order story irrelevant. Irrespective of the importance of the agency costs of
managerial discretion, there will always be a degree of undervaluation of the existing shares such that
management chooses not to issue. For firms where the agency costs of managerial discretion are small
enough, it may be that the pecking-order story applies exactly. The pecking-order story based on
information asymmetries assumes that management maximizes shareholder wealth whereas the agency
costs view assumes that management pursues objectives of its own. As emphasized by Dybvig arid Zender
(1991) and others, the pecking—order story makes an ad hoc assumption about management's objectives
that would not be appropriate if shareholders could choose a compensation policy for management such
that the ex ante value of the Arm is maximized. This means that the pecking-order story does not have the
intellectual high ground over the agency costs view: both approaches start from assumptions about
management's objectives that are not derived from first principles. It therefore Is an empirical question as
to whether the pecking-order story is enough to explain the new issue decisions of firms or whether agency
costs are determinants of this decision that cannot be ignored.
Section 3. The sample.
To obtain our sample of new bond issues and primary stock offerings, we used the Registered
Offerings Statistics File from 1977 to 1984. For the stock offerings, we used the Corporate Financing
Directory published by the Investment Dealers Digest to exclude all offerings that invoke secondary stock
offerings and all shelf-offerings. We restrict the sample to finns whose stock returns are available on the
CRSP tape for the whole calendar year before the announcement date. To obtain the announcement date,
we consulted the Wall Sbeet Journal Index. We use as our event date the first mention of a security issue
7

before the offering date and exclude secuflty issues for which such announcements are not available. We
exclude utilities and banking firms to conform to the earlier terature. We also eliminate firms that have
confounding announcements, such as dividend or earnings announcements.
We compute abnormal returns using a method similar to the one used by Asquith and Mullins
(1986). For each calendar year in the sample we rank securities in the CRSP daily tile according to their
beta estimated using the market model. We then divide the securities Into ten portfolios based on estimated
betas. For eacfl firm Issuing a security, we compute the abnormal return over a two-day period that Includes
the day of the Wall Street Journal announcement and the day preceding the announcement. The abnormal
return is defined to be the return of the issuing firm minus the return or the portfolio to which the firm
belongs!
Table 1 provides a summary of the abnormal return data for thestock and bond issues. The results
are similar to those reported in earlier papers, namely equity announcements have a significant negative
stock-price reaction and debt announcements have an insignificant stock-price reaction.5 Table 1 also
reports various characteristics of firms issuing debt and equity. The median debt-issuing firm has a stock
market capitalization about four times larger than the median equity-issuing firm and raises about four times
more funds through the issue. The equity-issuing firms are riskier than the debt-issuing firms, in that they
have both a higher beta and greater stock return volatility, The leverage measure that uses the market
value of common stock in the denominator does not differ between firms issuing debt and those issuing
stock, whereas the leverage measure that uses the book value of total assets In the denominator is higher
for firms that issue equity. Therefore, book leverage is more supportive of the pecking-order story than a
'All our results hold if we compute abnormal returns as market model residuals. We choose to focuson the abnormal returns using the Asquith and Mullins (1986) method because one of our explanatoryvariables in abnormal return regressions, the cumulative excess return for the 11 months before the issue,has a high correlation coefficient (0.48) with the market model alpha.
For instance, Mikkelson and Partch (1986) find an average abnormal retum for stock issues of-3.56% and straight debt of -0.23%, Eckbo (1986) finds a similar result for debt Issues. Asquith and Mullins
(1986) find an abnormal return for primary stock issues for Industrial firms of -3.0% whereas Masulis andKorwar (1986) find a stock-price reaction of -3.25%. Barclay and Lltzenberger (1988) find an abnormalreturn of -244% for the three hours surrounding the announcement on the Broad Tape.
B
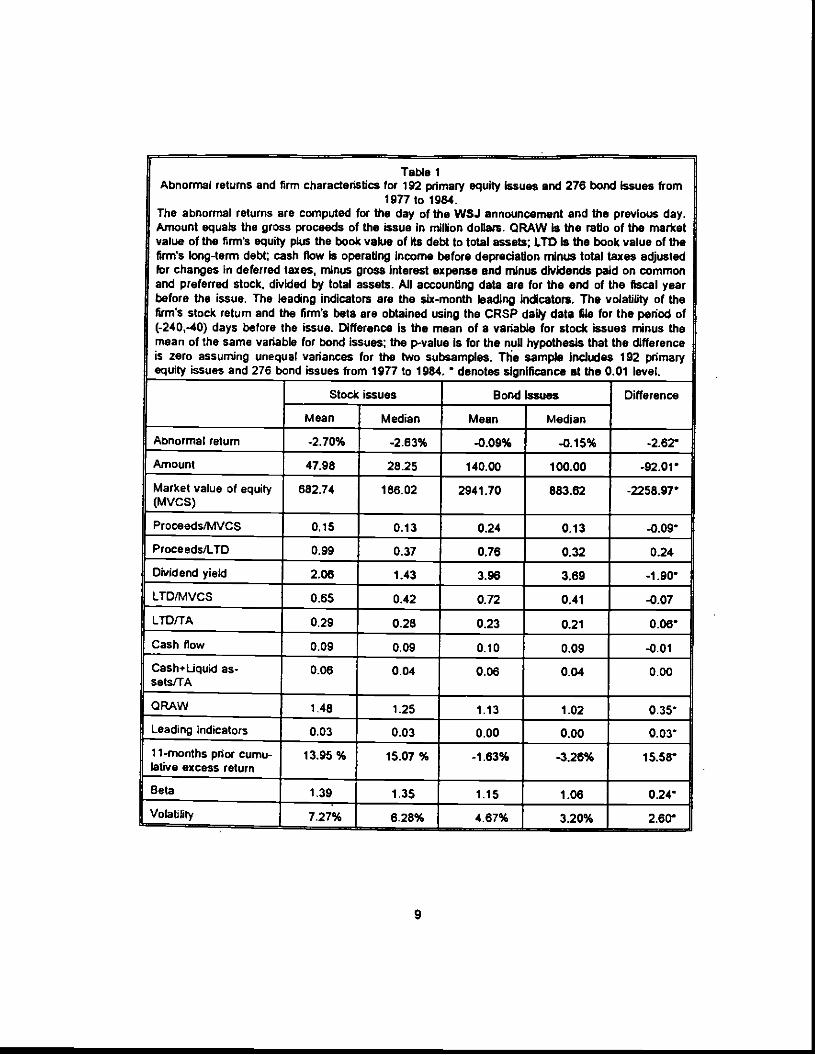
Table 1Abnormal returns and firm characteristics for 192 primary equity Issues end 276 bond Issues from
1977 to 1984.The abnormal returns are computed for the day of the WSJ announcement and the previous day.Amount equals the gross proceeds of the issue in million dotiara. QRAW Is the ratio of the marketvalue of the firm's equity plus the book value of Its debt to total assets; LTD Is the book value of thefirm's long-term debt; cash flow Is operating Income before depredation minus total taxes adjustedbr changes In deferred taxes, minus gross Interest expense end minus dividends paid on commonand preferred stock, divided by total assets. All accounting data are for the end of the fiscal yearbefore the issue. The leading indicators are the six-month leading Indicators. The volatility of thefirm's stock return and the firm's beta are obtained using the CRSP daily data file for the period of(-240,-40) days before the issue. Difference Is the mean of a variable for stock issues minus themean of the same variable for bond Issues; the p-value Is for the null hypothesis that the differenceis zero assuming unequal variances for the two subsarnples. The sample Includes 192 pflmaryequity issues and 276 bond issues from 1971 to 1984. • denotes significance at the 0.01 level.
Stock issues Bond Issues Difference
Mean Median Mean Median
Abnormal return -2.70% -2.63% -0,09% -0.15% •2.6?
Amount 47.98 28.25 140.00 100.00 -92.0?
Market value of equity(MVCS)
682.74 186.02 2941.70 883.82 -2258.97
ProceedsiMVC$ 0.15 0.13 0.24 0.13 -0.09
Proceeds/LTD 0.99 0.37 0.76 0.32 0.24
Dividend yield 2.06 1.43 3.96 3,69 -l.90
LTD/MVCS 0.65 0.42 0.72 0.41 -0.07
LTD/TA 0.29 0.28 0.23 0.21 0.0&Cash flow 0.09 0.09 0.10 0.09 -0.01
Casfl+Uquid as-sets/TA
0.06 0.04 0.06 0.04 0.00
QRAW 148 125 1.13 1.02 0.35
Leading indicators 0.03 0.03 0.00 0.00 0.03
1 I-months prior cumu-lative excess return
13.95 % 15.07% -1.63% -3.26% 15.58
Beta 1.39 1.35 1.15 1.06 0.24
Volatility 7.27% 6.28% 4.67% 3.20% 2.60
9
market measure of leverage.
The adverse selection model predicts that Arms are more kety to issue equity when the stock price
experiences positive abnormal returns before the issue. Such a result is also consistent with the managerial
discretion view. Firms that experienced positive abnormal returns are more likely to have good investment
opportunities (since they may just have obtained them) and are more kely to have good managerial
performance (since it may just have improved). Measuring the cumulative excess return of the issuing firms
common stock like Asquith and Mullins (1986), we find that firms that issue common stock have
experienced significant positive abnormal returns for the 11 months before the stock issue, whereas firms
that issue bonds experience insignificant negative cumulative abnormal returns on average. The result for
debt is inconsistent with some versions of the adverse selection model. For instance, Lucas and McDonald
(1990) conjecture that firms issuing risky debt should have positive cumulative abnormal returns on average
if debt is viewed as equity with less risk. It is supportive, however, of the managerial discretion view that
suggests that if the stock-price performance is poor, showing that management's performance has become
weaker, equity will be expensive compared with funds that impose restrictions on managements actions.
The firms issuing equity and those issuing debt have similar cash flows before the issue. We investigated
also, but do not report here, earnings to total assets, ESIT to total assets and net operating Income to total
assets. In all cases, the mean for equity Issuing firms is larger, but the difference in means is significant
only for net operating income. The only case where the difference is significant Is for net operating income.
Finally, the Arms issuing debt have a substantially higher dividend yield than the firms issuing equity,
Using the ratio of the market value of equity plus debt to the book value of assets as a proxy for
Tobin's q, firms issuing equity have better investment opportunities than firms issuing debt at the time of
the announcement. For a subset of the firms in the sample, replacement costs were available using FASS
files; the results on this subset are similar to the ones reproduced here. However, the results reported in
this paper use simply the book value of the firm's assets as a proxy for replacement costs in an effort to
Mikkelson and Partch (1986) obtain a similar result on a smaller sample of bond offerings.
10
use as large a sample as possible in our regressions and to avoid a selection bias against srnaU firms
resulting from the lesser availability of data for these firms. In addition, firms Issuing equity (but not those
issuing debt) are more likely to do so when the leading indicators suggest good economic conditions and
therefore good investment opportunities)° Finally, the cumulative abnormal returns before the issue
discussed in the previous paragraph are consistent with an improvement In the Investment opportunities
of firms issuing equity before the Issue.
Section 4. An empirical analysis of the security Issue choice.
In this section, we investigate an empirical model of security issue choice for our sample firms, This
model uses variables typically used in the Merature to predict the security Issue choice plus a proxy for
investment opportunities. For given firm characteristics, the agency costs of debt are higher for finns with
better investment opportunities, so that one expects the probability that a firm will Issue equity absent
agency costs of managerial discretion to increase with investment opportunities. Firms with high agency
costs of managerial discretion will issue equity with poor investment opportunities, but such firms are
expected to be a subset of the sample so that in a logistic regression model they will be firms that are not
expected to issue equity and hence issue against type. We then show how the firms that issue equity as
predicted differ from those which issue equity when they are predicted to issue debt.
The literature on the determinants of firms' capital structures is extensive, but some key ideas are
pervasive in lhe existing empirical work. In this paper, we Focus on a smali number of determinants of
leverage that are generally considered by empiricists and reflect these key ideas:"
1. Taxation. Because of the deductibility of interest payments, a number of papers argue that the
gain from debt financing relatively to equity financing increases with the fimrrrs tax rate. The literature has
shown that the firm's tax status affects the issue decision (see Mackie-Mason (1990)). As a proxy for these
'° Choe, Masulis and Nanda (1989) observe the same result.
" See Masulis (1988) and Harris and Raviv (1991) for references to empirical studies that use thesevanables as well as for references to theoretical papers that motivate their use.
11

benefits, we use tax payments divided by total assets for the year preceding the Issue.
2. Costs of financial distress. As debt and firm risk Increase, financial distress and bankruptcy
become more likely. As a risk proxy, we use stock return volatility measured over 200 days preceding the
issue; profitability is measured as cash flow divided by total assets; and leverage is measured as long-term
debt divided by total assets. We used alternate proxies for risk (beta Instead of volatility), for profitability
(earnings measures) and for leverage (market value of equity Instead of total assets). Our results are
insensitive to the choice of proxies for bankruptcy risks and costs.
3. Asymmetric information. Following Myers and MajIuf (1984), It is well-established that Issuing
equity is more expensive when there is asymmetric Information between firm Insiders and outsiders.
Therefore, one would expect firms where this information asymmetry is large to issue debt If they can or
abstain from raising funds altogether. As emphasized by Korajczyk, Lucas and McDonald (1991). one would
also expect firms to time equity issues for periods where the Information asymmetry Is smaller. Further,
Lucas and McDonald (1990) show that equity issues are more likely after Increases In the firm's stock price
since then the firm is less likely to be undervalued. We use the cumulative excess returns measured over
200 days before the issue, a measure of leading indicators of economic activity, arid a measure of slack,
namely cash and liquid assets normalized by total assets.
In some of our regressions, we also control for the amount raised through the security issue since
net proceeds have been found to affect the stock-price reaction in some studies. Presumably, the amount
raised by the firm and the type of security issued are jointly endogenous variables. This suggests that
logistic regressions that do not include the amount raised as an explanatory variable have the Interpretation
of reduced form equations, whereas equations that include the amount raised suffer from a simultaneous
equation bias. A more important reason to consider regressions without the amount raised as an
explanatory vanable. is that such regressions can be used by investors to forecast whether a firm wifi issue
equity or debt, whereas regressions that incorporate the size of the issue cannot (since they incorporate
information not available before announcement of the type of security issued).
Regression I shown in table 2, shows that investment opportunities play a substantial role in the
12
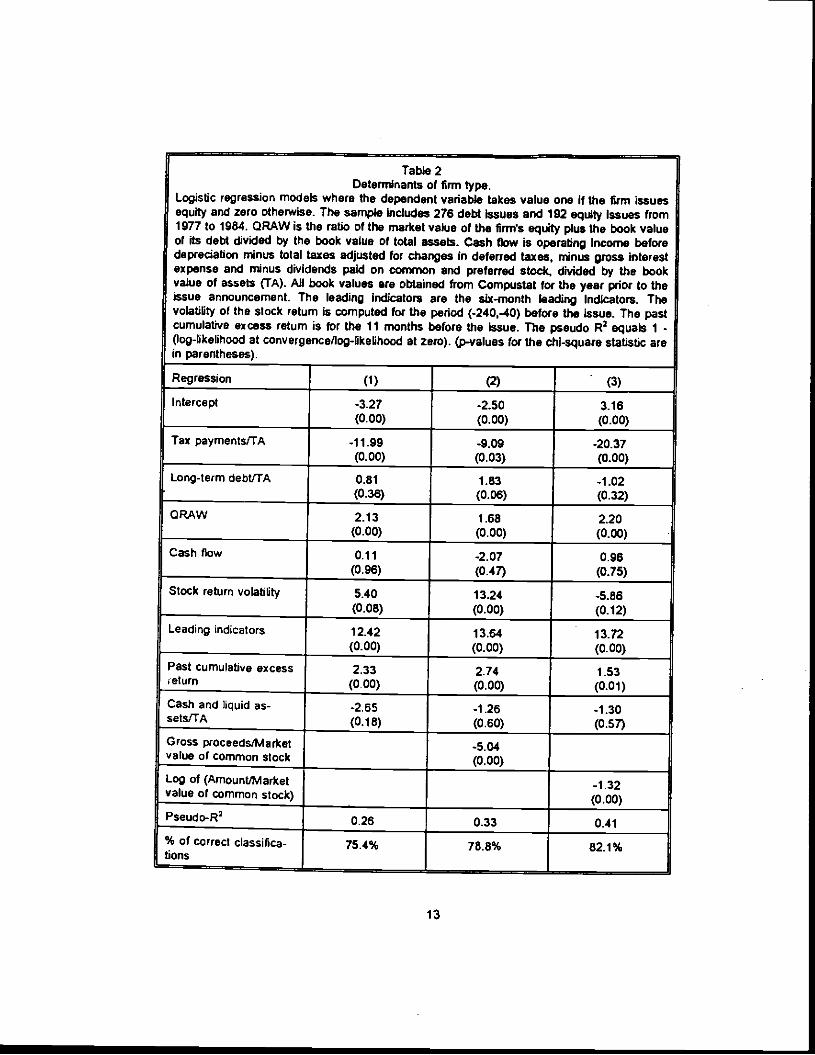
Table 2Determinants of firm type.
Logistic regression models where the dependent variable takes value one If the 1km issuesequity and zero otherwise. The sample Includes 276 debt Issues and 192 equIty Issues from1977 to 1984. (DRAW is the ratio of the market value of the finns equity plus the book valueof its debt divided by the book value of total asseS. Cash flow Is operating Income beforedeprecation minus total taxes adjusted for changes in deferred taxes, minus gross interestexpense and minus dividends paid on common arid preferred stock, divided by the bookvalue of assets (TA). All book values are obtained from Compustat for the year prior to theissue announcement. The leading indicators are the sIx-month leading Indicators. Thevolatility of the stock return is computed for the period (-240.-40) before the Issue. The pastcumulative excess return is for the 11 months before the Issue. The pseudo R2 equals 1 -(log-likelihood at convergence/log-likelihood at zero). (p-values for the chl-square statistic arein parentheses).
Regression (1) (2) (3)
Intercept -3.27(0.00)
-2.50(0.00)
3.16(0.00)
Tax payments/TA -11.99(0.00)
-9.09(0.03)
-20.37(0.00)
Long-term debt/TA 0.81
(0.36)1.83(0.06)
-1.02(0.32)
(DRAW 2.13(0.00)
1.68
(0.00)2.20(0.00)
Cash flow o.i I(0.96)
-2.07(0.47)
0.96(0.75)
Stock return volatility 5.40(0.08)
13.24(0.00)
-5.86(0.12)
Leading indicators 12.42(0.00)
13.64
(0.00)13.72(0.00)
Past cumulative excesseturn
2.33(0.00)
2.74(0.00)
1.53(0.01)
Cash and liquid as-sets/TA
-2.65(0.18)
-1.26(0.50)
-1.30(0.57)
Gross proceeds/Marketvalue of common stock
-5.04(0.00)
Log of (AmountjMarketvalue of common stock)
-1.32(0.00)
Pseudo-R2
% of correct classiflcalions
0.26 0.33 0.41
75.4% 78.8% 82.1%
13
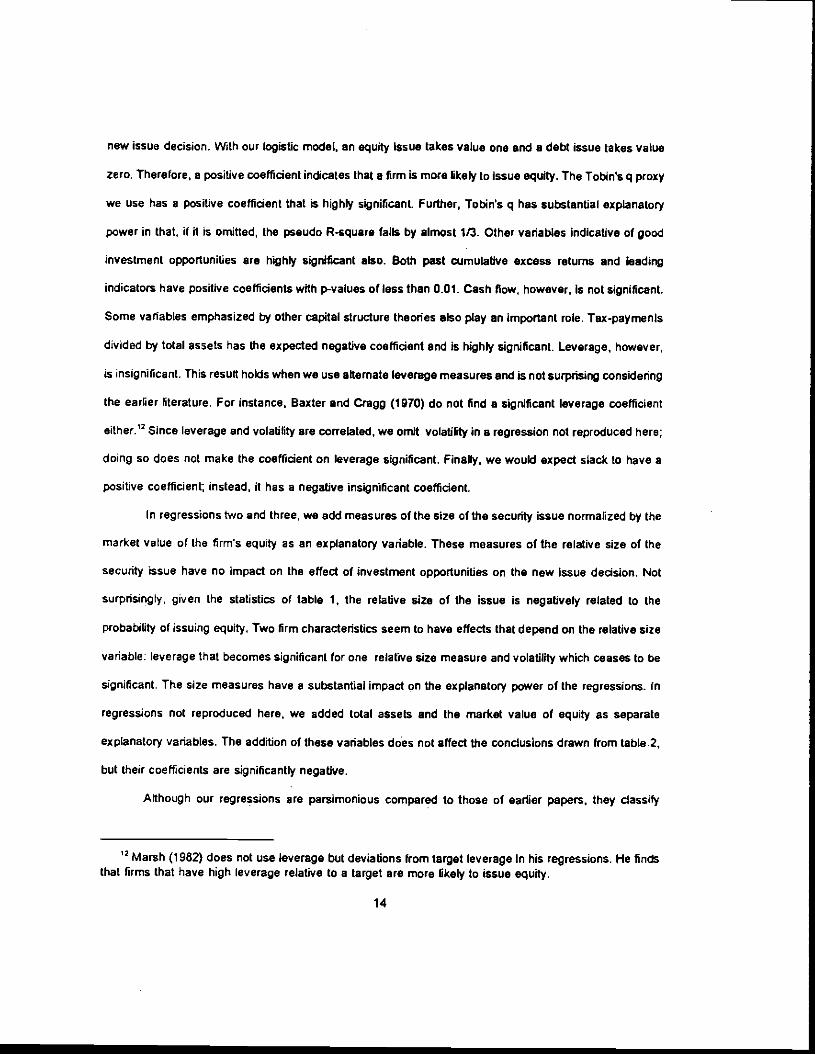
new issue decision. With our logistic model, an equity issue takes value one and a debt issue takes value
zero. Therefore, a positive coefficient indicates that a firm is more likely to Issue equity. The Tobin's q proxy
we use has a positive coefficient that is highly significant. Further, Tobin's q has substantial explanatory
power in that, if it is omitted, the pseudo R-square falls by almost 113. Other variables Indicative of good
investment opportunities are highly significant also. Both past cumulative excess returns and leading
indicators have positive coefficients with p-values of less than 0.01. Cash flow, however, Is not significant.
Some variables emphasized by other capital structure theories also play an important role. Tax-paymenls
divided by total assets has the expected negative coefficient and Is highly significant. Leverage, however,
is insignificant. This result holds when we use alternate leverage measures and is not surprising considering
the earlier literature, For instance, Baxter and Cragg (1970) do not find a signIficant leverage coefficient
either.'3 Since leverage and volatility are correlated, we omit volatility in a regression not reproduced here;
doing so does not make the coefficient on leverage significant. Finally, we would expect slack to have a
positive coefficient; instead, it has a negative insignificant coefficient.
In regressions two and three, we add measures of the size of the security issue normalized by the
market value of the firm's equity as an explanatory variable. These measures of the relative size of the
security issue have no impact on the effect of investment opportunities on the new Issue decision. Not
surprisingly, given the statistics of table I, the relative size of the issue is negatively related to the
probability of issuing equity. Two firm characteristics seem to have effects that depend on the relative size
variable; leverage that becomes significant for one relative size measure and volatility which ceases to be
significant. The size measures have a substantial impact on the explanatory power of the regressions. in
regressions not reproduced here, we added total assets and the market value of equity as separate
explanatory variables. The addition of these variables does not affect the conclusions drawn from table.2,
but their coefficients are significantly negative.
Although our regressions are parsimonious compared to those of earlier papers, they classify
13 Marsh (1982) does not use leverage but deviations from target leverage in his regressions. He findsthat firms that have high leverage relative to a target are more likely to issue equity.
14

correctly a traction of the decisions that is equal to or greater than the fraction correctly classified in these
papers. For instance, Marsh (1981) classifies correctly 75% of the decisions, whereas our regressions in
table 2 classify correctly from 75% to 82% of the decisions.
With this model, we have firms that issue equity even though they resemble firms that issue debt.
Table 3 compares these finns to the firms that issue debt and the firms that Issue equity and are predicted
to do so. To classify firms, we use equation one of table 2. For that equation, the threshold that minimizes
the sum of the probability of a type I and of the probability of a type II error Is 0.42. In all their
characteristics except the ratio of proceeds to market value of equity, the firms that issue equity when
predicted to issue debt look indistinguishable from debt-issuing firms. In contrast, these equity4ssuing firms
are significantly different from finns issuing equity predicted to do so for many characteristics, The firms
issuing equity against type pay more taxes relative to assets than other equity-issuing finns. showing that
the tax deductibility of interest would be quite valuable for them. These firms have less leverage than firms
predicted to issue equity, although not significantly so. They issue at times when leading indicators are
neutral. Their past abnormal returns are insignificantly different from zero. Their volatility is closer to the
volatility of firms issuing debt. Finally, these firms have much poorer investment opportunities than firms
predicted to issue equity. Their mean and median q proxy is only trivially different from the mean and
median q proxy of firms issuing debt. There are no significant cash flow differences among the three sets
of firms. Given the characteristics of these firms, it is difficult to argue that they would benefit from the
flexiDility resulting from issuing equity instead of debt.
Since managerial ownership is often viewed as an indicator of agency costs, we collected
ownership data from Value Line and found it available for 100 equity-issuing firms. In the last row of table
3, we compare managerial ownership of the two groups of equity-issuing firms. We find that firms that issue
equity against type have lower ownership, but not significantly so.
Why do firms issue equity against type? Within the context of the pecking-order story, several
explanations seem plausible. First, one might argue that firms will issue equity at times when the cost of
15
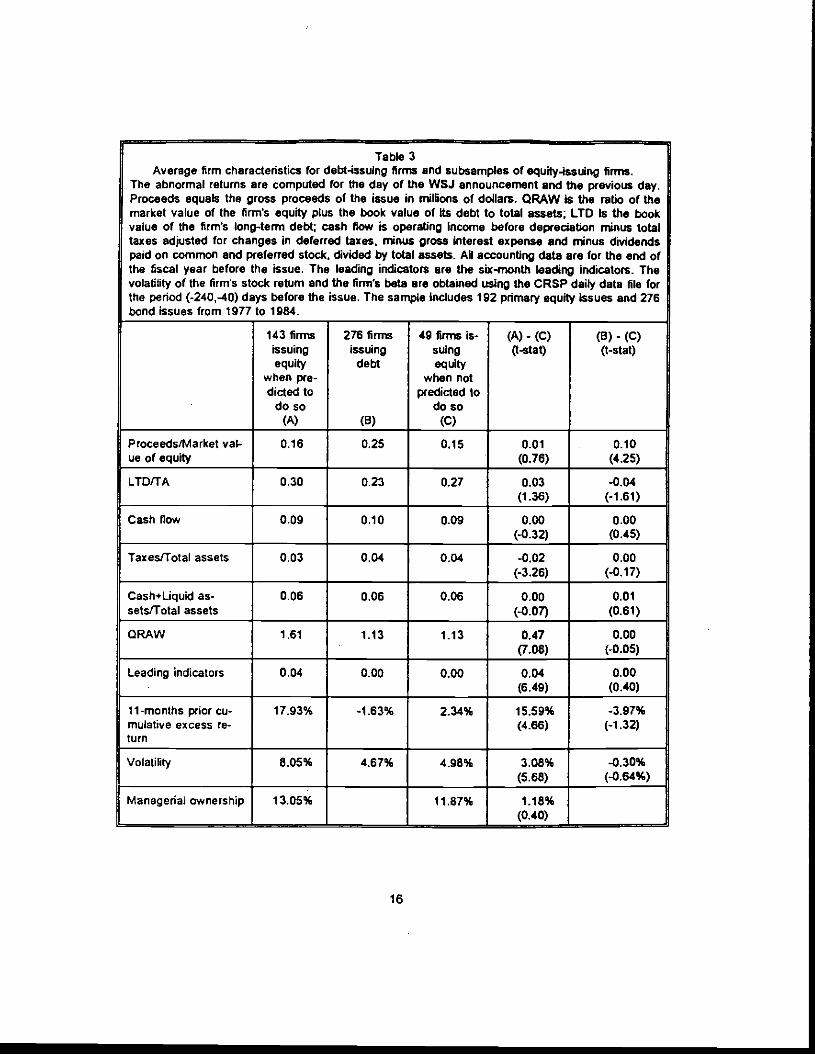
Table 3Average firm characteristics for debt-issuing firms and subsamples of equity-issuing finns.
The abnormal returns are computed for the day of the WSJ announcement and the previous day.Proceeds equals the gross proceeds of the issue in milbons of dollars. QRAWIs the ratio of themarket value of the firm's equity plus the book value of Its debt to total assets; LTD Is the bookvalue of the firm's long-term debt; cash flow is operating Income before depredation minus totaltaxes adjusted for changes in deferred taxes, minus gross Interest expense and minus dividendspaid on common and preferred stock, divided by total assets. All accounting data are for the end ofthe fiscal year before the issue. The leading indicators are the six-month leading indicators. Thevolatility of the firm's stock return and the firm's beta are obtained using the CRSP daily data file forthe period (-240-40) days before the issue. The sample Includes 192 primary equity Issues and 276bond issues From 1977 to 1984.
.
143 firmsissuingequity
when pre-dicted to
doso(A)
276 firmsissuingdebt
(B)
49 finn is-suingequity
when notpedicted to
doso(C)
(A) - (C)Q-stat)
(B) - (C)(I-stat)
Proceeds/Market val-ue of equity
0.16 0.25 0.1$•
0.01(0.76)
0.10(4.25)
LTD/TA 0.30 0.23 0.27 0.03(1.36)
-0.04(—1.61)
Cash flow 0.09 0.10 0.09 0.00(-0.32)
0.00(0.45)
Taxes/Total assets 0.03 0.04 0.04 -0.02(-3.26)
0.00(-0.17)
Cash+Uquid as-sets/Total assets
0.06 0.06 0.06 0.00
(-0.07)
0.01
(0.61)
CRAW 1.61 1.13 1.13 0.47(7.08)
0.00(-0.05)
Leading indicators 0.04 0.00 0.00 0.04(6.49)
0.00(0.40)
11-months prior cu-mulative excess re-turn
17.93% -1.63% 2.34% 15.59%(4.66)
-3.97%(-1.32)
Volatity 8.05% 4.67% 4.98% 3.08%(5.68)
-0.30%(-0.64%)
Managerial ownership 13.05% 11.87% 1.18%(0.40)
16
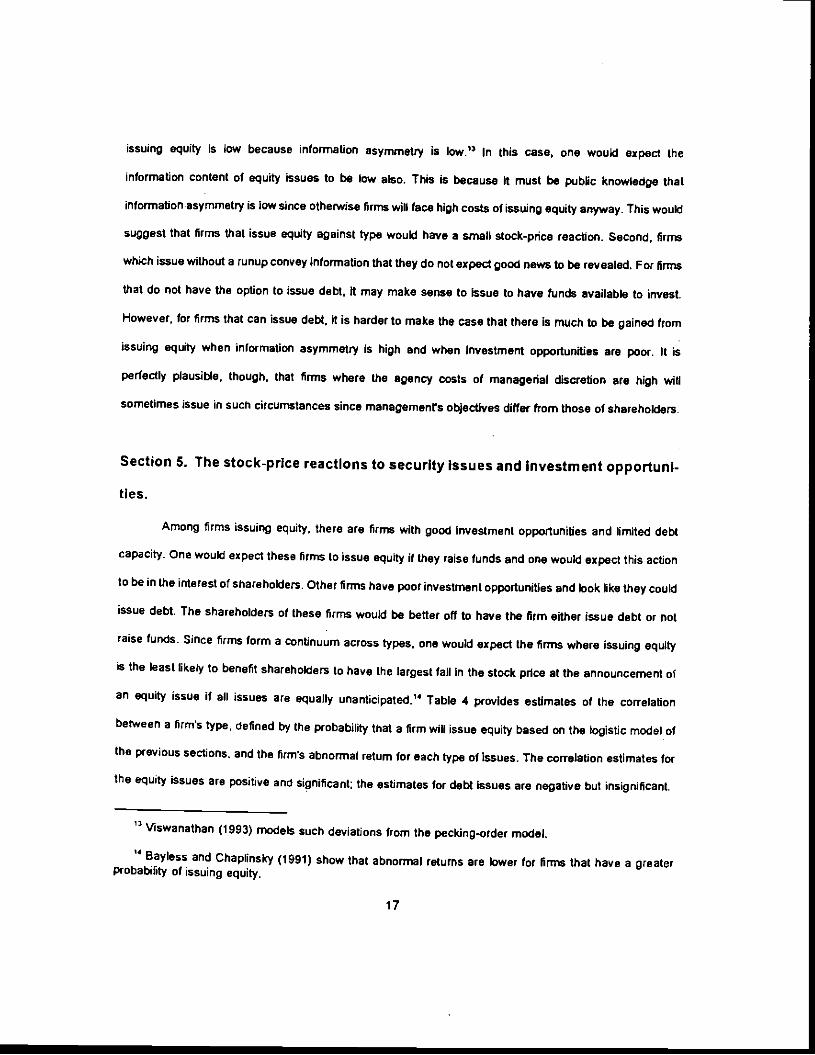
issuing equity is low because information asymmetry is low." In this case, one would expect the
information content of equity issues to be low also. This is because it must be public knowledge that
information asymmetry is low since otherwise firms will face high costs of issuing equity anyway. This would
suggest that firms that issue equity against type would have a small stock-price reaction. Second, firms
which issue without a runup convey information that they do not expect good news to be revealed. For firms
that do not have the option to issue debt, It may make sense to Issue to have funds available to invest.
However, for firms that can issue debt, it is harder to make the case that there Is much to be gained from
issuing equity when inFormation asymmetry Is high and when Investment opportunities are poor. it is
perfectly plausible, though, that firms where the agency costs of managerial discretion are high will
sometimes issue in such circumstances since managements objectives differ from those of shareholders.
Section 5. The stock-price reactions to security issues and investmentopportuni-
ties.
Among firms issuing equity, there are firms with good Investment opportunities and limited debt
capacity. One would expect these firms to issue equity if they raise Funds and one would expect this action
to be in the interest of shareholders, Other firms have poor investment opportunities and look like they could
issue debt, The shareholders of these firms would be better off to have the firm either issue debt or not
raise funds. Since firms form a continuum across types, one would expect the firms where issuing equity
is the least likely to benefit shareholders to have the largest fall In the stock pflce at the announcement of
an equity issue if all issues are equally unanticipated,' Table 4 provides estimates of the correlation
between a firm's type, defined by the probability that a firm will issue equity based on the logistic model of
the previous sections, and the firm's abnormal return for each type of issues. The correlation estimates for
the equity issues are positive and significant; the estimates for debt Issues are negative but insignificant.
13 Viswanathan(1993) models such deviations from the pecking-order model.
Bayless and Chaplinsky (1991) show that abnormal returns are lower for firms that have a greaterprobability of issuing equity.
17

Table 4Correlations between firms' types and abnormal returns.
Firm type is obtained from regression (1) of table 2. Abnormal returns arecumulative abnormal returns for days (-1.0), where day zero is the day ofthe Walt Street Journal announcement.
Correlation measures Correlation betweenfirm type and ARs for
bond Issues(p-values)
Correlation betweenfirm type and ARs for
equity issues(p-values)
Correlation coefficientbetween firm type andabnormal returns
-0.03(0.65)
0.17
(0.02)
Spearman rank-sumcorrelation betweenfirm type and abnor-mal returns
-0.07(0.25)
0.17(0.02)
18
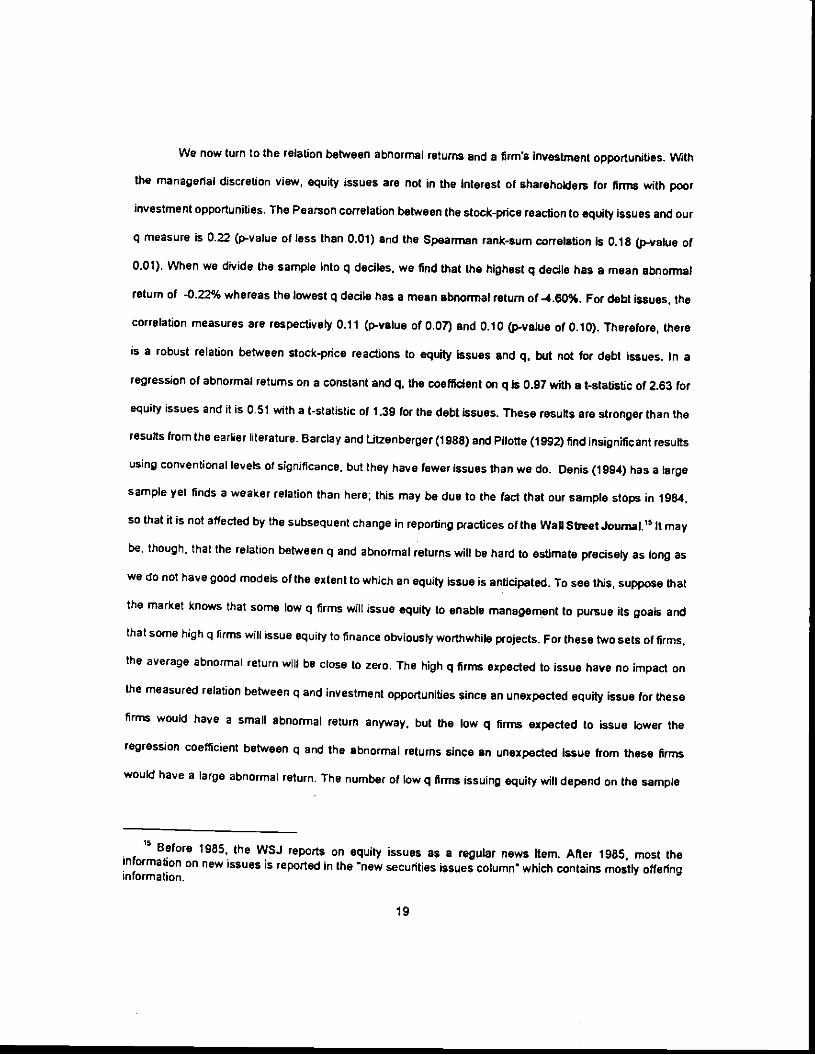
We now turn to the relation between abnormal returns and a firm's investment opportunities. With
the managerial discretion view, equity issues are not in the Interest of shareholders for firms with poor
investment opportunities. The Pearson correlation between the stock-price reaction to equity issues and our
q measure is 0.22 (p-value of less than 0.01) and the Spearrnan rank-sum correlation Is 0.18 (p-value of
0.01). When we divide the sample Into q deciles, we find that the highest q decile has a mean abnormal
return of -0.22% whereas the lowest q docile has a mean abnormal return o(4.60%. For debt issues, the
correlation measures are respectively 0.11 (p-value of 0.07) and 0.10 (p-value of 0.10). Therefore, there
is a robust relation between stock-price reactions to equity Issues and q. but not for debt issues. In a
regression of abnormal returns on a constant and q, the coefficient on q is 0.97 with a 1-statistic of 2.63 for
equity issues and it is 051 with a t-statistic of 1.39 for the debt issues. These results are stronger than the
results From the earlier literature. Barclay and Utzenberger (1988) and Pilotte (1992) find insignificant results
using conventional levels of significance, but they have fewer issues than we do. Denis (1994) has a large
sample yet finds a weaker relation than here; this may be due to the fact that our sample stops in 1984,
so that it is not affected by the subsequent change in reporting practices of the Wall Street Journal)5 It may
be, though, that the relation between q and abnormal returns will be hard to estimate precisely as long as
we do not have good models of the extent to which an equity issue is anticipated. To see this, suppose that
the market knows that some low q firms will issue equity to enable management to pursue its goals and
that some high q firms will issue equity to finance obviously worthwhile projects. For these two sets of firms,
the average abnormal return will be close to zero. The high q firms expected to issue have no impact on
the measured relation between q and investment opportunities since an unexpected equity issue for these
firms would have a small abnormal return anyway, but the low q firms expected to issue lower the
regression coefficient between q and the abnormal returns since an unexpected Issue from these firms
would have a large abnormal return. The number of low q firms issuing equity will depend on the sample
' Before 1985, the WSJ reports on equity issues as a regular news kern. After 1985, most theinformation on new issues is reported in the new securities issues column which contains mostly offeringinformation.
19
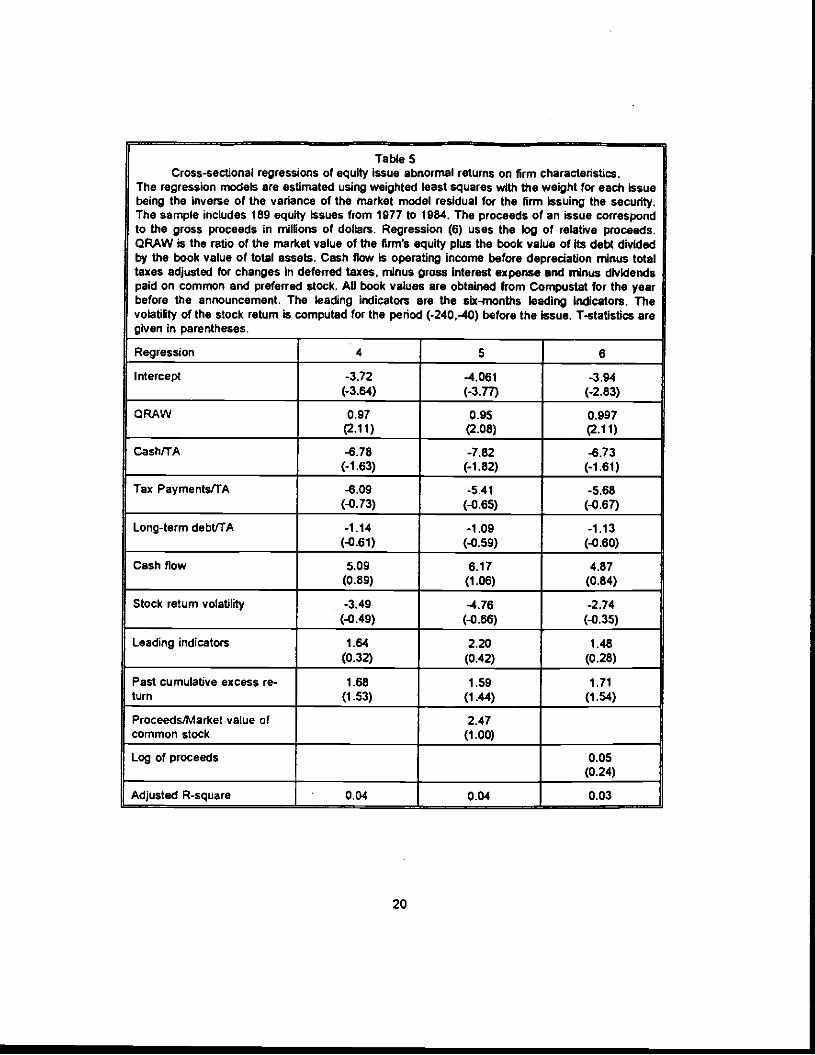
Table 5Cross-sectional regressions of equity issue abnormal returns on firm characteñstics.
The regression models are estimated using weighted least squares with the weight for each Issuebeing the inverse of the variance of the market model residual for the firm Issuing the security.The sample includes 189 equIty issues from 1977 to 1984. The proceeds of an issue correspondto the gross proceeds in miIons of dollars. Regression (6) uses the log of relative proceeds.0MW is the ratio of the market value of the firm's equity plus the book value of its debt dividedby the book value of total assets. Cash flow Is operating income before depredation minus totaltaxes adjusted for changes in deferred taxes, minus gross Interest expense and minus dividendspaid on common and preferred stock. All book values are obtained from Compustat for the yearbefore the announcement. The leading indicators are the six-months leading Indicators. ThevolatiRty of the stock return is computed for the period (-240,40) before the Issue. T-statlstics aregiven in parentheses.
Regression 4 5 6
Intercept -3.72(-3.64)
4.061(-3.77)
-3.94(-2.83)
QRAW 0.97(2.11)
0.95(2.08)
0.997(2.11)
Cash/TA -6.78(-1.63)
-7.82(-1.82)
-6.73(-1.61)
Tax Payments/TA -6.09(-0.73)
-5.41
(-0.65)-5.66
(-0.67)
Long-term debt/TA -1.14(-0.61)
-1.09(-0.59)
-1.13(-0.60)
Cash flow 5.09(0.89)
6.17(1.06)
4.87(0.84)
Stock return volatility -3.49(-0.49)
-4.76
(-0.66)-2.74
(-0.35)
Leading indicators 1.64
(0.32)2.20
(0.42)1.48
(0.28)
Past cumulative excess re-turn
1.68(1.53)
1.59(1.44)
1.71
(1.54)
Proceeds/Market value ofcommon stock
2.47(1.00)
Log of proceeds 0.05(0.24)
Adjusted R-square 0.04 0.04 0.03
20
considered and therefore the anticipation effect may be stronger In some samples than others. This means.
however, that the relation between q arid the issuing decision is easier to estimate convincingly in empirical
models of the th•m's decision to issue equity as opposed to debt rather than In empirical models which
attempt to explain abnormal returns. Another issue that may make ft difficult to estimate the relation
between abnormal returns and q that affects some earfler papers is the use of the market model. A high
q firm is more kely to have done well recently and hence to have a positive alpha in market model
regressions: this increases its predicted return and lowers the regression coefficient o(q in cross-sectional
regressions.
q is positively correlated with a variable emphasized in models that focus on adverse selection,
namely the runup in the firm's stock-price before the issue. q is also ikely to be corTelated with other
vanables emphasized in the literature. Therefore, it is important to investigate whether the relation between
abnormal returns and q can be athibuted to its role as a proxy for other variables that may have nothing
to do with managerial disaetion. We investIgate this in table 5 for stock Issues. It Is immedIately apparent
that the coefficient on q is not affected by the inclusion of the additional variables emphasized by the earlier
bterature. In these regressions! though, the stock runup is not significant and the leading indicators are not
significant either. Therefore, in such regressions, it seems that q dominates the variables emphasized in
papers which focus on adverse selection. When we regress the abnormal return on q and past cumulative
abnormal returns alone, past cumulative abnormal returns has a coefficient of 1.62 with a t-statistic of 1.52,
in contrast to q that has a coefficient or 0.93 with a t-statistic of 2.52. The inclusion of a q proxy results in
a substantial weakening of the variables emphasized in papers which focus on adverse selection. Some
might argue that q is a belier estimate of oveivaluation than the stock runup and that it Is related to the
abnormal return for that reason, If that were the case, though, one would expect equity-issuing firms to
invest less than debt-issuing firms with comparable q's. since presumably the equity-issuing firms are the
overvalued firms where q overstates investment opportunities. We investigate this in the next section.
We estimated similar regressions for debt issues, but do not report them here. The only variable
that is ever significant in these regressions is the amount of the issue divided by the value ol common
21
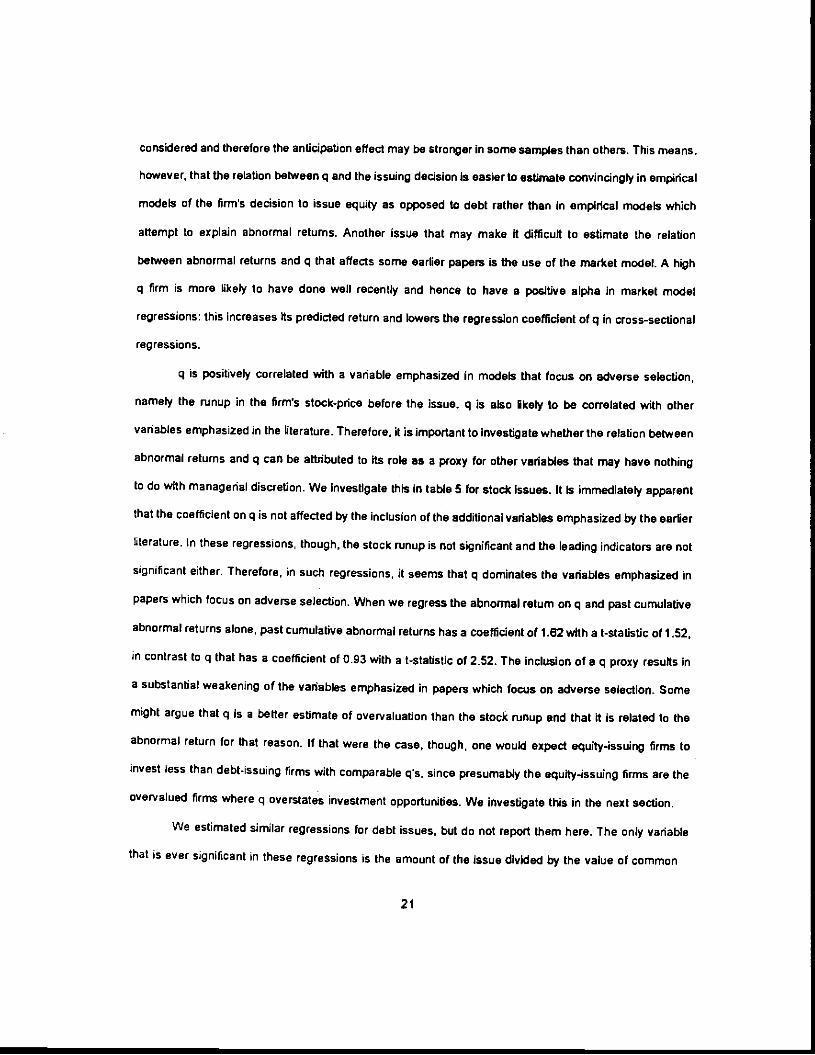
Table 6Abnormal returns of equity issues by purpose of issue.
The purpose of the issue is obtained from the WaA Sheet Journal announcement. We do notreproduce results for cells smaller than 10 or for cases where the purpose could not be determinedunambiguously.
Purpose Number of issues Abnormal return I-statistic
To repay bank debt 26 -2.93 -4.54
Capital expenditures 40 -3.04 -5.16
To repay long-termdebt
20 -4.15 -6.16
To repay short-termdebt
15 -1.16 -1.15
Working capital 51 -2i4 -4.43
22
stock, which has a coefficient of-I .57 and a t-slatistic 01-1.97. The adjusted R-square for these regressions
is never greater than zero.
The results provided are consistent with the role of agency costs In the new issue decision. An
equity issue allows Arms with poor investment opportunities to invest In poor projects and/or to reduce the
disciplinary role of debt. Table 6 shows the abnormal returns for equity issues divided according to the
purpose of the issue. The stock-price reactions that are above the average for the sample are for firms that
plan to use the proceeds for capital expenditures, firms that plan to replace long-term debt, and firms that
plan to replace bank debt. We investigated whether there is a relation between firm type and the abnormal
return for a given issuing purpose. The problem with this Investigation Is that the cell sizes become small.
Nevertheless, it is interesting that the nine firms that are not of the equity-Issuing type which plan to use
the proceeds for capital expenditures have an average abnormal return of 4.43% with a t-statishc oI-5.52,
whereas the 29 fIrms of the equity-issuing type planning to use the proceeds for capital expenditures have
an average abnormal return of -2.52% with a t-statistic of -3.41. This evidence should be treated with
caution given the cell sizes, but it nevertheless provides support to the argument that outsiders view the
information that a firm invests the proceeds when it is not of the equity issuing-type negatively.
It is often argued that agency costs of managerial discretion are less for lirms with high managerial
ownership because management bears more of the monetary consequences from pursuing its own
objectives. We have ownership data available from Value Une for 100 equity issuing firms, For this smaller
sample, we find that when we split the sample into high and low ownership, the low ownership sample has
a mean abnormal return of -3.71% and the high ownership sample has a mean abnormal return of -2.56%.
The difference between the two groups is 1.16% with a t-statistjc of 1.72. One might worry that this
difference is size-related since ownership is inversely related to size; when we split the sample according
to firm size, however, there is no difference in abnormal returns.
23
Section 6. Ex post characteristics of firms issuing debt and equity.
So far, we have shown that the typical equity-issuing firm has good Investment opportunities
compared with the typical debt-issuing firm and that the market reaction to an equity Issue is negatively
related to the issuing finn's investment opportunities. It could be, though, that firms issuing equity with poor
investment opportunities do so because they believe that they are worth less than the market's valuation
since they are low q firms. If this were the case, one would expect these firms to Invest less than the other
equity-issuing firms. In contrast, agency considerations suggest that these firms issue equity to invest oven
though they have poor investment opportunities.
In this section, we investigate whether the post-issue characteristics of firms issuing equity against
type resemble those of debt-issuing firms of similar type or those of equity-issuing firms of different type.
We provide this information for all firms issuing a type of security as well for subsamples of firms that are
expected to issue the security they issue and those that are not, To distinguish between firms that are
expected to issue a security and those that are not, we use equation (1) from table 2 In the same way we
did to construct table 3. For each variable, we compute the change in the variable from the year before the
issue to the year after the issue, expressed as a percentage of the variable for the year before the issue.
We reproduce the change in cash flow and leverage even though the type of security Issued affects these
variables directly, reducing cash flow and increasing leverage for debt-issuing.Ilrms compared with equity
issuing firms as one would expect.
The results of table 7 are striking: firms comparable to debt-issuing firms that issue equity Invest
more than the comparable debt-issuing firms: their plant, property and equipment (PP&E). total assets and
capital expenditures all grow at a significantly higher rate. The differences in growth are economically large:
a firm issuing equity against type that has the same PP&E than a firm expected to Issue debt has 20%
more PP&E at the end of the year following the security issue. Since both categories of firms have similar
q proxies, these results are fully consistent with the view that firms which issue equity against the pecking-
order do so to pursue a more aggressive investment policy that is not in the interest of their shareholders.
Compared to the firms expected to issue equity, the firms that issue equity when expected to issue debt
24
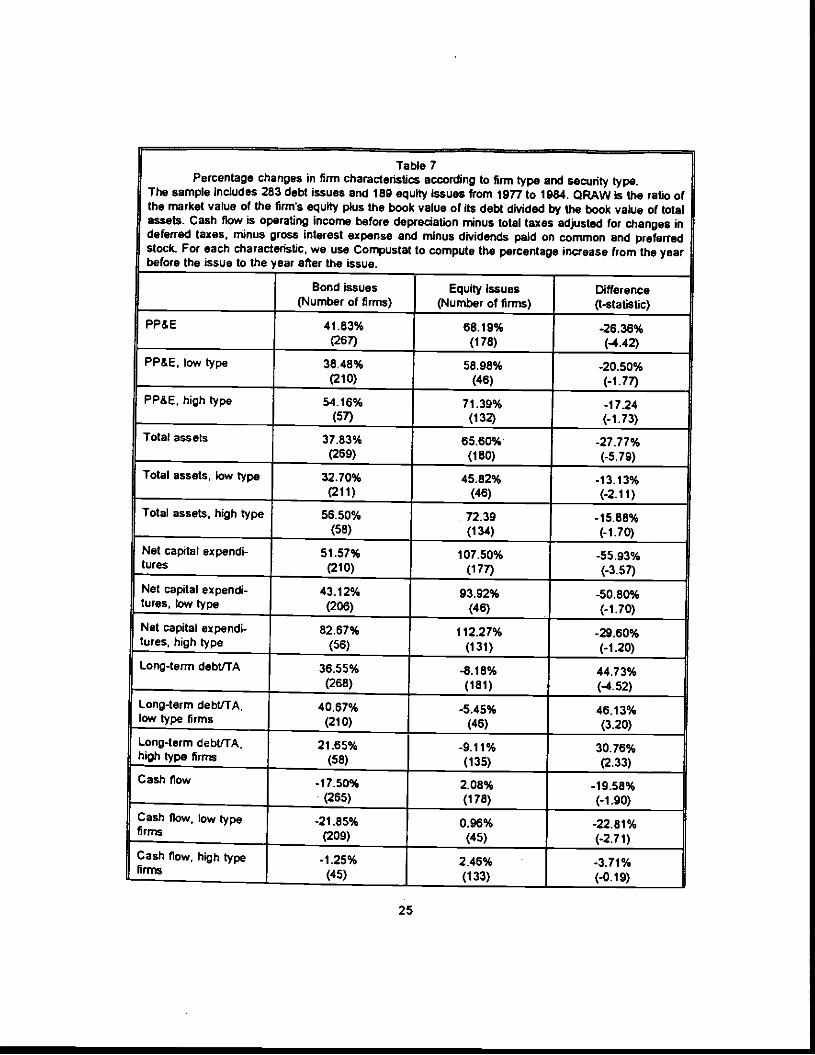
Table 7Percentage changes in finn characteristics according to firm type and security type.
The sample includes 283 debt issues and 189 equity issues from 1977 to 1984. ORAW Is the ratio ofthe market value of the firm's equity plus the book value of its debt divided by the book value of totalassets. Cash flow is operating income before depredation minus total taxes adjusted for changes indeferred taxes, minus gross interest expense and minus dividends paid on common and preferredstock. For each characteristic, we use Compustat to compute the percentage increase from the yearbefore the issue to the year after the issue.
Bond issues(Number of firms)
Equity Issues(Number of firms)
Difference(t-statistic)
PP&E 41.83%(267)
68.19%(178)
-26.36%(-4.42)
PP&E, low type 3848%(210)
58.98%(46)
-20.50%(-1.77)
PP&E, high type 54.16%(57)
71 .39%
(132)-17.24(-1.73)
Total assets 37.83%(269)
65.60%(180)
-27,77%(-5.79)
Total assets, low type 32.70%(211)
45.82%(46)
-13.13%(-2.11)
Total assets, high type 56.50%(58)
72.39(134)
-15.88%(-1.70)
Net capital expendi-tures
51.57%(210)
107.50%(177)
-55.93%(-3.57)
Net capital expendi-tures, low type
43.12%(206)
93.92%(46)
-50.80%(-1.70)
Net capital expendi-tures, high type
82.67%(56)
112.27%
(131)-29.60%(-1.20)
Long-term debtlTA 36.55%(268)
-8.18%(181)
44.73%(-4.52)
Long-term debt/TA,low type fIrms
40.67%(210)
-5.45%(46)
46.13%(3.20)
Long-term debt/TA.high type firms
21 .65%
(58)-9.11%(135)
30.76%(2.33)
Cash flow -11.50%(265)
2.08%(178)
19,58%(-1.90)
Cash flow, low typefIrms
-21 .85%
(209)0.96%
(45)-22.81%(-2.71)
-1.25%(45)
2.46%(133)
-3.71%(-0.19)
Cash flow, high typefluns
25
EBIT 15.45%(266)
53.15%(181)
-37.70%(-228)
EBIT, low type 6.84%(210)
10.60%(46)
-3.76%(-0.11)
E8IT, high type 47.72%(56)
67.65%(135)
-19.92%(-1.01%)
Change in dividendyield
0.18(269)
-0.10(183)
0.26(1.78)
Change in dividendyield, low type
-0.02(209)
-0.21(48)
0.19(0.77)
Change in dividendyield, high type
0.84(60)
-0.07(135)
0.91(3.98)
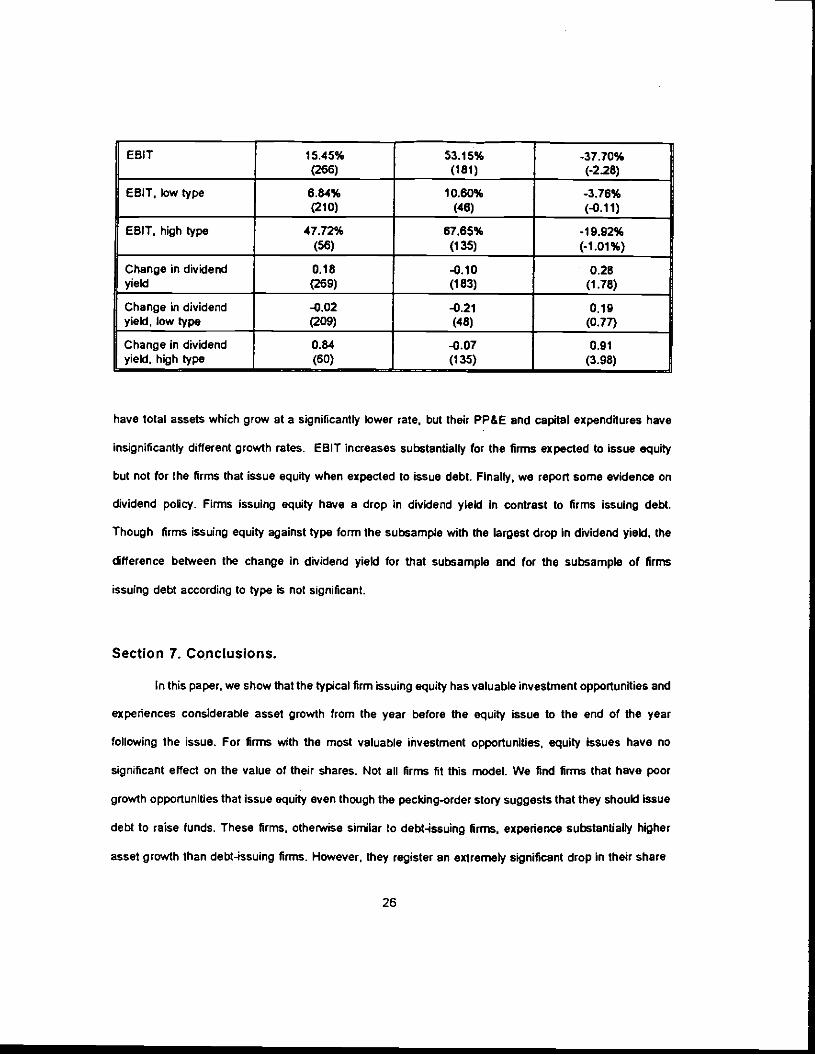
have total assets which grow at a significantly lower rate, but their PP&E and capital expenditures have
insignificantly different growth rates. EBIT increases substantially for the firms expected to issue equity
but not for the firms that issue equity when expected to issue debt. Finally, we report some evidence on
dividend policy. Firms issuing equity have a drop in dividend yield In contrast to firms Issuing debt.
Though firms issuing equity against type form the subsample with the largest drop in dividend yield, the
difference between the change in dividend yield for that subsample and for the subsample of firms
issuing debt according to type is not signiAcant.
Section 7. Conclusions.
In this paper, we show that the typical firm issuing equity has valuable investment opportunities and
experiences considerable asset growth from the year before the equity issue to the end of the year
following the issue. For firms with the most valuable investment opportunities, equity Issues have no
significant effect on the value of their shares. Not all firms fit this model. We find firms that have poor
growth opportunities that issue equity even though the pecking-order story suggests that they should issue
debt to raise tunds. These firms, otherwise similar to debt-issuing firms, experience substantially higher
asset growth than debt-issuing firms. However, they register an extremely significant drop in their share
26

price when they issue. Though it 15 true that these firms reveal that they are valued too highly when they
issue, a consistent explanation of this excessive valuation Is that the market did not expect these firms to
issue equity to undertake major investments given their investment oppottunities and does not expect these
investments to increase shareholder wealth. The behavior of the firms Issuing equity against type in this
paper seems inconsistent with the pecking-order model or asymmetric information models which assume
that managers maximize shareholder wealth. If the firms that issue against type have valuable Investment
opportunities that are not recognized by the ñnancial markets, they should not be issuing equity since their
equity would be underpriced and since they could issue debt because similar firms issue debt.
27

References
Asquith, P. and OW. Mullins, Jr., 1986, Equity issues and offering dilution, Journal of Financial
Economics 15, 31-60.
Barclay, M.J., and Rn Litzenberger, 1988, Announcement effects of new equity Issues and the use of
intraday price data! Journal of Financial Economics 21, 71-99.
Baxter, ND., and JO. Cragg, 1970, Corporate choice among long-term financing instruments, Review of
Economics and Statistics 52, 225-235.
Bayless. M., and S. Chaplinsky, 1990, Expectations of security type and the information content of debt and
equity offers, Journal of Financial Intermediation 3, 195-214.
Bernanke, B., M. Gertler, and S. Gilohuist, 1993, The financial accelerator and the flight to quality,
unpublished working paper. Princeton University.
Brennan, M., and A. Kraus, 1987, Efficient financing under asymmetric information, Journal of Finance 42.
1225-1243.
Choe, H., R. Masulis, and V. Nanda, 1989, On the timing of seasoned common stock issues: Theory and
evidence, working paper.
Denis,O.J., 1994, Investment opportunities and the market reaction to equity offerings, Journal of
Quantitative and Financial Analysis, forthcoming.
Dierkens, N.. 1991. Information asymmetry and equity issues, Journal of Financial and Qantitative
Analysis 26, 181-201.
Dybvig, P.H., and J.F. Zender, 1991, Capital structure and dividend irrelevance with asymmetric
information, The Review of Financial Studies 4, 201-220.
Eckbo, B.E.,1986, Valuation effects of corporate debt offerings, Journal of Financial Economics 15, 119-
151.
Hansen, R.S. and C. Crutchley, 1990, Corporate financings and corporate earnings: An empiflcal analysis,
Journal of Business 63, 347-371.
28

Harris, M. and A. Raviv, 1991, The theory of capital structure. Journal of Finance 46, 297-356.
Hart, 0. and J. Moore, 1990. A theory or corporate financial structure based on the seniority of claims,
Working paper, MIT.
Hoshi, T., A. Kashyap, and D. Scharfstein, 1993, The choice between pubkc and private debt: An analysis
of post-deregulation corporate financing in Japan, mimeo.
Jensen, M.C., 1986, Agency costs of free cash flow, corporate finance and takeovers, American Economic
Review, 323-329.
Jensen, M.C., and W.H. Meckling, 1976, Theory of the firm: Managerial behavior, agency costs and
ownership structure. Journal of Financial Economics 3, 305-380.
Kalay, A., and A. Shimrat, 1987, Firm value and seasoned equity issues: Price pressure, wealth
redistribution, or negative information, Journal of Financial Economics 19. 109-127.
Korajczyk, R., D.J. Lucas, and R.L, McDonald, 1991. The effect of information releases on the pricing and
timing of security issues, Review of Financial Studies 4, 685-708.
Lucas, D.J., and R.L. McDonald, 1990, Equity issues and stocic price dynamics, Journal of Finance 45,
1019-1043.
MacKie-Mason, J.K., 1990, Do taxes affect corporate financing decisions?, Journal of Finance 45,1471-
1495.
Marsh, P., 1982, The choice between equity and debt, Journal of Finance 37, 121-144.
Masulis, R.W., 1988, The debt/equity choice, Ballinger Publishing Company.
Masulis, R.W. and AN. Korwar, 1986, Seasoned equity offerings: An empirical investigation, Journal of
Financial Economics 15, 91-118.
Mikkelson, W. and M. Partch, 1986, Valuation effects of security offerings and the issuance process,
Journal of Financial Economics 15, 31-60.
Miller, M. and K. Rock, 1985, Dividend policy under asymmetric inforTTtation, Journal of Finance 40, 1031-
1051.
Myers, 5., 1977, Determinants of corporate borrowing, Journal of Financial Economics 5, 147-175.
29

Myers. S. and N. Majluf. 1984, Corporate financing and investment decisions when firms have information
that investors do not have. Journal of Financial Economics 13. 187-221.
Myers, S., 1989. The capital structure puzzle, Journal of Finance 39, 575-592.
Noe, T., 1988, Capital structure and &gnang equilibria. Review of Financial Studies 1, 331-356.
Pilotte. E.. 1992, Growth opportunities and the stock price response to new financing, Journal of Business
65, 371-395.
Smith, C.W., 1986. Investment banking and the capital acquisition process. Journal of Financial Economics
15, 3-29.
Smith, C.W.. and R.L. Watts, 1992, The investment opportunity set and corporate financing, dividend, and
compensation policies, Journal of Financial Economics 32, 263-292.
Stulz, R.M., 1985. Managerial control of voting rights: Financing pocies and the market for corporate
control, Journal ol Financial Economics 20, 25-54.
Stulz, RM., 1990, Managerial discretion and optimal financing policies, Journal of Financial Economics 26,
3-27.
Titman, S. and R. Wessels, 1988, The determinants of capital structure choice, Journal of Finance 43, I-
20.
Viswanathan, PV., 1993, Strategic considerations, the pecking order hypothesis, and market reactions to
equity financing. Journal of Financial and Quantitative Analysis 28, 213-234.
Zwiebel J., 1994, Dynamic capital structure under managerial entrenchment, unpubfished working paper,
Stanford University. CA.
30