Embed Size (px)
Citation preview
1
Negative-feedback inhibition of NFATc1 by DYRK1A regulates bone homeostasis
Youngkyun Lee,1 Jeongim Ha,
1 Hyung Joon Kim,
1 Yeun-Soo Kim,
2 Eun-Ju Chang,
1
Woo-Joo Song,2 and Hong-Hee Kim
1
1Department of Cell and Developmental Biology, BK21 Program and DRI, Seoul
National University, Seoul, Korea 2Graduate Program in Neuroscience, Institute for Brain Science and Technology (IBST),
Inje University, Busan, Korea
Address correspondence to: Hong-Hee Kim, Seoul National University, 28 Yeongon-
Dong, Chongno-Gu, Seoul 110-749, Korea. Phone: +82-2-740-8686; Fax: +82-2-765-
8656; E-mail: [email protected] (this author will correspond with the editorial office)
or Woo-Joo Song, Inje University, Kaegum 2-Dong, Busanjin-Gu, Busan 614-735,
Korea. Phone: +82-51-892-4186; Fax: +82-51-892-0059; E-mail: [email protected]
Running title: Regulation of bone homeostasis by DYRK1A
Nonstandard abbreviations used are: BMM, bone marrow macrophage; DYRK1A, dual-
specificity tyrosine regulated kinase 1A; HPRT, hypoxanthine guanine phosphoribosyl
transferase; M-CSF, macrophage colony-stimulating factor; RANKL, receptor activator
of nuclear factor B ligand; siRNA, small interfering RNA; TRAP, tartrate-resistant acid
phosphatase.
Keywords: Down syndrome/ DYRK1A/ NFATc1/ osteoblast/ osteoclast
http://www.jbc.org/cgi/doi/10.1074/jbc.M109.042234The latest version is at JBC Papers in Press. Published on October 2, 2009 as Manuscript M109.042234
Copyright 2009 by The American Society for Biochemistry and Molecular Biology, Inc.
by guest on August 30, 2018
http://ww
w.jbc.org/
Dow
nloaded from
2
ABSTRACT
DYRK1A is a serine/threonine kinase
that has been linked to mental
retardation associated with Down
syndrome. In the present report, we
describe a previously unknown role for
DYRK1A in bone homeostasis. The
protein expression of DYRK1A
increased during osteoclast
differentiation. In vitro studies in
osteoclasts revealed that DYRK1A
inhibited osteoclastogenesis. While
DYRK1A phosphorylated and inhibited
the osteoclastogenic transcription factor
NFATc1, forced expression of NFATc1
induced DYRK1A expression
suggesting a negative-feedback loop.
Transgenic mice overexpressing
DYRK1A by the extent of the increased
gene dosage in Down syndrome
exhibited significantly reduced bone
mass despite the decreased
osteoclastogenesis, which is reminiscent
of osteoporotic bone phenotype in Down
syndrome patients. In these mice,
attenuated osteoblast differentiation and
function in the presence of extra
DYRK1A overrode the effect of
impaired osteoclastogenesis. However,
impeded osteoclastogenesis in DYRK1A
transgenic mice was proven to be
beneficial in protecting bone loss
induced by inflammation or estrogen
deficiency. These results provide novel
insight into the role for DYRK1A in
bone homeostasis as well as in bone
destructive diseases, in which
modulation of DYRK1A might be used
as a strategy to treat unregulated bone
resorption.
INTRODUCTION
DYRK1A (dual-specificity
tyrosine regulated kinase 1A) is a
member of genetically conserved protein
kinases that phosphorylate
serine/threonine residues on substrates
and autophosphorylate on tyrosine
residues (1,2). Most evidence has so far
indicated that DYRK1A is mainly linked
to brain development (3) and mental
retardation associated with Down
syndrome (4-6). However, the broad
tissue distribution of DYRK1A (7)
suggests a possibility of hitherto
unknown functions in addition to its role
in neurodevelopment.
In the presence of macrophage
colony-stimulating factor (M-CSF) and
receptor activator of nuclear factor B
ligand (RANKL), macrophage/monocyte
lineage of hematopoietic precursor cells
differentiate into osteoclasts, cells
specialized for bone resorption (8-10).
M-CSF supports survival and
proliferation of osteoclast precursors as
well as expression of RANKL receptor
(RANK). RANKL induces signaling
cascades including the recruitment of
TNF receptor-associated factors
(TRAFs), activation of mitogen-
activated kinases (MAPKs), stimulation
of NF B and c-Fos transcription factors,
and phospholipase C (PLC )-dependent
calcium signaling, all of which
culminating in the induction and
activation of NFATc1, a “master”
transcription factor for
osteoclastogenesis (11-14).
Through a proteomic approach,
we discovered that the expression of
DYRK1 family protein was significantly
up-regulated during osteoclastogenesis.
Recent studies of Drosophila RNAi
screening and examination of genes in
the Down syndrome critical region
reported that DYRK1A facilitates
by guest on August 30, 2018
http://ww
w.jbc.org/
Dow
nloaded from
3
nuclear export of NFAT (15,16). Here
we show that DYRK1A functions as a
negative-feedback regulator of NFATc1
in the modulation of bone homeostasis in
vivo. Our results indicate a novel
function of DYRK1A for bone cell
regulation that might be applied to the
treatment of bone destructive diseases.
MATERIALS AND METHODS
Animals. Five week-old ICR mice were
obtained from Charles River
Laboratories (Wilmington, MA).
DYRK1A TG mice expressing human
DYRK1A and WT littermates of
C57BL/6 background were described
previously (6). For LPS-induced bone
loss model, male WT or DYRK1A TG
mice (6 week-old) were injected
intraperitoneally with PBS or LPS
(Sigma, O111:B4; 5 mg/kg) dissolved in
PBS of 200 μl volume at 7 and 3 days
before sacrifice. For ovariectomy-
induced bone loss model, female WT
and DYRK1A TG mice (14 week-old)
were either ovariectomized or sham-
operated at 4 weeks before sacrifice.
Animal experimental protocols were
approved by the committees on the care
and use of animals in research at Seoul
National University and Inje University.
Reagents. Recombinant human soluble
RANKL, human M-CSF, and human
BMP-2 were purchased from PeproTech
(Rocky Hill, NJ). Leukocyte acid
phosphatase assay kit was from Sigma
(St. Louis, MO). Lipofectamine 2000TM
was from Invitrogen Life Technologies
(Carlsbad, CA). Antibodies (Abs)
against DYRK1A (M01) and DYRK1B
were from Abnova (Taipei, Taiwan) and
Abgent (San Diego, CA), respectively.
Abs against NFATc1 (7A6), Lamin B
(M-20), and c-Fos (H-125) were
purchased from Santa Cruz
Biotechnology (Santa Cruz, CA). The
7A6 anti-NFATc1 Ab was raised against
a fragment of human NFATc1 that is
conserved in all 6 known mouse
isoforms. Anti- -actin (AC-74) was
from Sigma. Phospho-specific Abs for
ERK (Thr202/Tyr204), JNK
(Thr182/Tyr185), and p38
(Thr180/Tyr182) were from Cell
Signaling Technology (Beverly, MA).
Anti-phosphoserine Ab (3C171) was
from Abcam (Cambridge, UK).
Ionomycin and cyclosporin A were
obtained from Calbiochem (La Jolla,
CA). All other chemicals were
purchased from Sigma.
Immunoprecipitation and
immunoblotting. Immunoprecipitates,
whole cell lysates, or nuclear extracts
equivalent of same number of cells were
subjected to 10% SDS-PAGE followed
by immunodetection using
chemiluminescence (17).
Quantitative real-time PCR analysis.
The mRNA expression of genes was
quantified by the methods described
previously (17). Primer sequences for
real-time PCR analyses were listed in
Table S1.
Osteoclast differentiation. BMMs (2
104 cells/well in 48-well plastic plates)
were incubated with 30 ng/ml M-CSF
and 100 ng/ml RANKL for 3~4 days. At
the end of incubation, osteoclast
differentiation was determined by
staining for TRAP activity using a
leukocyte acid phosphatase assay kit
(Sigma) and cells were photographed as
previously described (17). In some
experiments, BMMs were cocultured
with osteoblasts (104/well) in the
by guest on August 30, 2018
http://ww
w.jbc.org/
Dow
nloaded from
4
presence of 10 nM 1 ,25-
dihydroxyvitamin D3 and 1 μM PGE2.
Osteoblast differentiation. Calvarial
cells were prepared from 1-day old mice
(18). Osteoblast differentiation was
induced by treating cells (104/well in 48
well plates) with either 10 mM -
glycerophosphate plus 100 μM ascorbic
acid or 300 ng/ml BMP-2 in DMEM
supplemented with 10% FBS. After 6
days, cells were stained for alkaline
phosphatase activity. The intensity of
alkaline phosphatase staining was
quantified by scanning of cell culture
plates (PowerLook 1100 scanner)
followed by measuring the integrated
density using ImageJ program (version
1.40, http://rsb.info.nih.gov/ij).
Alternatively, the mineralization was
visualized by alizarin red staining after
2~3 week culture.
Plasmids. pcDNA3.1-DYRK1A was
prepared from mouse brain cDNA (19).
pMX-NFATc1 WT and pMSCV-
NFATc1 constitutive active (CA) mutant
were also used. For DYRK knock-down
experiments, oligonucleotides for siRNA
were generated by targeting a 21-base
sequence of mouse Dyrk1a and Dyrk1b.
The resulting oligonucleotide sequences
(Table S2) were annealed and ligated
into pSuper-retro vector (Oligoengine,
Seattle, WA) using BamHI and HindIII
sites.
Retroviral gene transfer. Retroviruses
were packaged by transfecting plasmids
into Plat-E cells. Retroviral infection of
cells was performed as previously
described (17).
Luciferase assay. RAW264.7 cells were
transfected with pcDNA3.1 vector or
pcDNA3.1-DYRK1A and incubated
with 100 ng/ml RANKL for 2 days. The
cells were transfected with the reporter
plasmid containing the 0.8 kb proximal
region of NFATc1 promoter (20). At 24
h after reporter transfection, cells were
lysed in GloTM
lysis buffer. Luciferase
activity was measured using Bright-
GloTM
luciferase assay system (Promega,
Madison, WI) in FLUOstar optima
luminometer (BMG Labtech GmbH,
Offenburg, Germany).
Calcein-xylenol orange double
labeling. WT or DYRK1A TG mice (8
week-old) were injected
intraperitoneally with 25 mg/kg calcein
(Sigma-Aldrich, dissolved in 200 μl of
2% NaHCO3, 150 mM NaCl) followed
by 90 mg/kg xylenol orange (Sigma-
Aldrich) at day 1 and day 7,
respectively. Mice were sacrificed at day
10 and femurs were fixed and embedded
in resin (BMP Lab, Seoul, Korea).
Sections were observed under Zeiss
LSM 5 PASCAL laser scanning
microscope (Carl Zeiss microimaging
GmbH, Goettingen, Germany) with 40
objective (C-Apochromat /1.2 w corr).
The distance between calcein and
xylenol orange deposition was calculated
from 5 different regions of the same
image in 4 slides per group using LSM 5
image browser (version 3.1).
Micro-computed tomography
(microCT). Femurs from mice were
subjected to microCT analyses using
SkyScan 1172 scanner (SkyScan,
Aartselaar, Belgium, 40 kV, 250 μA, 7.9
μm pixel size). Images obtained from 1
mm-thick distal femoral area, starting
from 1 mm below growth plate, were
analyzed by CT-analyzer program
(version 1.7, SkyScan) to calculate bone
volume and bone parameters. A 3D
reconstitution of images was performed
by guest on August 30, 2018
http://ww
w.jbc.org/
Dow
nloaded from

5
by CT-volume software (version 1.11,
SkyScan).
Histology and histomorphometry.
Femurs were fixed, decalcified for 1
month in 10% EDTA, and embedded in
paraffin. Sections of 5 μm thickness
were prepared using Leica microtome
RM2145 (Leica Microsystems,
Bannockbrun, IL) and were subjected to
TRAP and hematoxylin staining.
Histomorphometric analysis was
performed as described (21) using
Bioquant OsteoII program (Bioquant
image analysis corporation, Nashville,
TN).
Statistics. The Student’s t test was used
to determine the significance of
difference between two groups.
Comparison of results comprised of
more than 2 groups was done by one-
way ANOVA followed by Student
Knewman-Keuls post hoc tests.
Differences with p<0.05 were regarded
as significant.
A detailed description of methods was
provided in Supplemental Information.
RESULTS
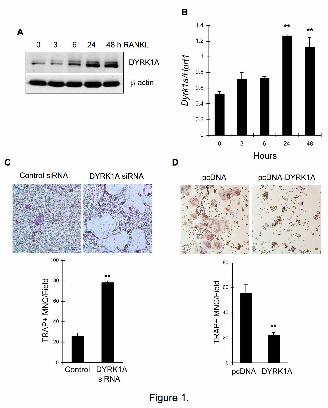
DYRK1A negatively regulates
osteoclastogenesis
DYRK1A expression
significantly increased upon stimulation
of mouse bone marrow macrophages
(BMMs) with RANKL (Fig. 1A). A real-
time PCR analysis revealed that RANKL
significantly up-regulated Dyrk1a
mRNA expression (Fig. 1B). To gain
insights into the role of DYRK1A during
RANKL-induced osteoclastogenesis, we
down-regulated DYRK1A protein
expression by introducing small
interfering RNA (siRNA) into BMMs
via retroviral infection (Fig. S1A).
Osteoclast differentiation was
dramatically enhanced in DYRK1A
down-regulated BMMs, suggesting a
negative-regulatory role of DYRK1A
during osteoclastogenesis (Fig. 1C).
Furthermore, when DYRK1A was
overexpressed in RAW264.7
macrophages (Fig. S1B), significant
decrease in osteoclastogenesis was
observed (Fig. 1D). On the other hand,
DYRK1B did not dramatically affect
osteoclastogenesis although its
expression was significantly increased
by RANKL (Fig. S2).
DYRK1A is a negative feedback
inhibitor of NFATc1 activity
To uncover the RANKL-
dependent transcription factor(s) that
might induce DYRK1A expression in
osteoclasts, BMMs were infected with
retroviruses to overexpress transcription
factors known to be activated
downstream of RANKL. While c-Fos
only slightly stimulated DYRK1A
expression, both WT and constitutive
active NFATc1 dramatically increased
DYRK1A in the absence of RANKL
(Fig. 2A), suggesting that NFATc1
might be a regulator of DYRK1A
expression. Although the RANKL-
dependent DYRK1A expression was
suppressed by NF B inhibitors (Fig.
S3A), it was most likely due to the
inhibition of NFATc1 expression since
NF B inhibitors did not reduce
DYRK1A expression in the presence of
constitutive active NFATc1 (Fig. S3B).
It was suggested that DYRK1A might
phosphorylate and thereby exclude
NFAT from the nucleus (15,16). Indeed,
there was a significant increase in the
phosphorylation of NFATc1 in
DYRK1A-overexpressing 293FT cells
(Fig. 2B). Similar enhanced
by guest on August 30, 2018
http://ww
w.jbc.org/
Dow
nloaded from
6
phosphorylation of NFATc1 was
observed in RAW264.7 cells
overexpressing DYRK1A (Fig. S3C).
The accumulation of nuclear NFATc1 in
response to RANKL-treatment was
prominently suppressed in DYRK1A-
overexpressing cells (Fig. 2C).
Similarly, NFATc1 in the nuclear
fraction from DYRK1A-overexpressing
cells did not increase upon stimulation
with ionomycin (Fig. 2D). In addition, it
was evident that there was little
activation of NFATc1 promoter activity
by RANKL in DYRK1A-overexpressing
RAW264.7 cells, compared with that in
control cells (Fig. 2E). DYRK1A also
suppressed NFATc1-dependent IL-4
promoter activity (Fig. S3D). In
accordance with the reduced NFATc1
promoter activation, RANKL-induced
increase in total NFATc1 protein was
significantly impaired in DYRK1A-
overexpressing cells (Fig. 2F). Taken
together, we suggest that DYRK1A
inhibits NFATc1 activity and expression
via a negative-feedback regulation.
Osteoporotic bone phenotype of
DYRK1A transgenic mice in spite of
impaired osteoclastogenesis
The in vitro inhibition of
osteoclastogenesis by DYRK1A led us
to analyze the bone phenotype of
DYRK1A BAC transgenic (DYRK1A TG)
mice that overexpress human DYRK1A
by 1.5-fold under the control of
endogenous promoter to mimic the
increased gene dosage of Down
syndrome (6). Although we detected no
emphatic skeletal anomaly in gross
examination by soft X-ray (Fig. S4A),
microCT analysis of femurs revealed
that trabecular bone volume was
markedly decreased in TG mice
compared with WT (Fig. S4B). Analyses
of bone parameters from microCT data
further confirmed an osteoporotic bone
phenotype of both male and female
DYRK1A TG mice (Fig. 3A). The bone
volume /tissue volume (BV/TV) in male
mice was 12.7 ± 0.6% in
WT and 10.1 ± 0.9% in TG femurs.
Similarly, BV/TV in female mice was
reduced from 12.6 ± 0.5% in WT to 10.9
± 0.3% in TG mice. The analyses of
trabecular thickness (Fig. S4C),
trabecular number (Fig. S4D), and
trabecular separation (Fig. S4E)
indicated reduced bone mass in TG
mice. However, it seemed that the extra
DYRK1A did not affect cortical bone
thickness of femurs (Fig. S4F and G).
The RANKL-stimulated expression of
NFATc1 was significantly reduced in
DYRK1A TG BMMs (Fig. 3B). We
observed no significant defect in
RANKL-dependent MAPK activation
(Fig. S5A), indicating that the signaling
pathways known to regulate RANKL-
dependent NFATc1 expression in
BMMs were not affected. Both
proliferation (Fig. S5B) and RANKL-
induced osteoclastogenesis (Fig. 3C and
Fig. S5C) were significantly impaired in
DYRK1A TG BMMs. A real-time PCR
analysis revealed significant reduction of
osteoclast differentiation markers Acp5,
Calcr, and to a lesser extent, Ctsk in TG
BMMs following RANKL stimulation
(Fig. 3D). In agreement with the reduced
osteoclast differentiation, the resorption
activity of TG osteoclasts was
significantly lower than that of WT
osteoclasts (data not shown). However,
when DYRK1A TG BMMs were forced
to express WT or constitutive active
NFATc1, defective osteoclastogenesis
was restored comparable to WT cells
(Fig. 3E).
Defective osteoblastogenesis in
DYRK1A TG mice
by guest on August 30, 2018
http://ww
w.jbc.org/
Dow
nloaded from
7
Since the impaired
osteoclastogenesis contradicted the
reduced bone mass in DYRK1A TG
mice, we next investigated the function
of osteoblasts in TG mice. Stimulation
of osteoblast differentiation in mouse
calvarial cells with -glycerophosphate
and ascorbic acid significantly induced
DYRK1A expression (Fig. 4A).
Interestingly, the induction of DYRK1A
paralleled NFATc1 expression.
Overexpression of NFATc1 in calvarial
cells induced DYRK1A expression (Fig.
4B), suggesting that DYRK1A might be
under the regulation of negative-
feedback loop as in osteoclasts. A
markedly reduced NFATc1 induction by
BMP-2 was observed in TG osteoblasts
(Fig. 4C), while extra DYRK1A did not
affect BMP-2-dependent Smad
phosphorylation (Fig. S6A). Treatment
of osteoblasts with BMP-2 increased
nuclear NFATc1 in WT cells but not in
DYRK1A TG cells (Fig. 4D). In addition,
proliferation (Fig. S6B) and
differentiation (Fig. 4E) of calvarial
osteoblasts were significantly impaired
in DYRK1A TG mice. The inhibition of
NFATc1 by a calcineurin inhibitor
cyclosporine A resulted in a significant
attenuation of osteoblast differentiation,
suggesting a role for NFATc1 in
osteoblasts (Fig. S6C). A real-time PCR
analysis revealed that the mRNA
expression of osteoblast differentiation
markers including Bglap1, Alpl, and
Col1a1 was significantly reduced in
DYRK1A TG osteoblasts (Fig. 4F).
Interestingly however, the expression of
Tnfsf11 was consistently higher in TG
than in WT osteoblasts. DYRK1A TG
osteoblasts formed less mineralized
nodules (Fig. 4G). In vivo bone
formation, measured by the distance
between the two fluorescence labels
after sequential labeling of femurs with
calcein and xylenol orange, was visibly
impaired in TG mice (Fig. 4H).
Accordingly, mineral apposition rate
was significantly lower in TG mice (Fig.
S6D). However, presumably due to the
compensatory effect of increased
RANKL (encoded by Tnfsf11)
expression in TG osteoblasts, impaired
TG osteoblast function by extra
DYRK1A did not affect
osteoclastogenesis in osteoblast-BMM
coculture system (Fig. 4I and Fig. S6E).
Taken together, DYRK1A plays a
negative regulatory role during normal
osteoblast differentiation. In DYRK1A
TG mice, impaired osteoblast function
seemingly overrode impeded osteoclast
function, resulting in the reduced bone
mass.
Protection against LPS- and
ovariectomy-induced bone loss in
DYRK1A TG mice
To examine the effect of extra
DYRK1A on bone resorption in TG
mice, we adopted LPS challenge and
ovariectomy model that emulates
inflammation- and hormone deprival-
induced bone loss. A 3D visualization of
distal femoral area showed massive loss
of trabecular bone following LPS
treatment in WT mice (Fig. 5A). On the
other hand, no further significant loss of
trabecular bone was observed in
DYRK1A TG mice challenged with LPS.
This was clearly demonstrated when
bone volume was analyzed from
microCT data (Fig. 5B). The BV/TV
was 9.2 ± 0.2% for PBS-treated group
and 7.3 ± 0.2% for LPS-treated group in
WT mice. However, there was no
statistical difference in the bone volume
of femurs between PBS- and LPS-
challenged TG mice (8.1 ± 0.2% for
PBS-treated group and 8.0 ± 0.2% for
LPS-treated group). Analyses of
by guest on August 30, 2018
http://ww
w.jbc.org/
Dow
nloaded from
8
trabecular thickness and trabecular
number also revealed that LPS did not
induce trabecular bone loss in DYRK1A
TG mice (Fig. S7A and B). Consistent
with the microCT results, histological
analyses revealed significant loss of
trabecular bone accompanied by
increased TRAP activity in femoral
sections from LPS-treated WT mice
compared with PBS-treated groups (Fig.
5C). On the other hand, no such bone
loss and the increase of TRAP-positive
osteoclasts were observed in DYRK1A
TG mice upon LPS treatment.
Assessment of the osteoclast and
osteoblast numbers also indicated that
DYRK1A TG mice were protected from
LPS effects (Fig. 5D and Fig. S7C). A
3D reconstitution of microCT images
(Fig. S8A) and an analysis of microCT
data (Fig. 5E) from ovariectomized mice
also revealed that ovariectomy reduced
bone volume by more than 30% in WT
mice. The BV/TV was 15.6 ± 0.5 % in
sham-operated and 10.4 ± 0.6% in
ovariectomized WT mice. However, the
femoral bone volume of DYRK1A TG
mice was not affected by ovariectomy
(13.5 ± 0.1% in sham-operated and 13.4
± 0.4% in ovariectomized mice, Fig.
5E). Analyses of trabecular thickness
(Fig. S8B) and trabecular number (Fig.
S8C) also indicated that ovariectomy
resulted in a significant trabecular bone
loss only in WT mice. Histological
analyses were consistent with the
microCT results, showing no increase of
TRAP-positive osteoclasts and bone loss
in DYRK1A TG mice following
ovariectomy (Fig. S8D). The number of
osteoblasts in sham-operated and
ovariectomized TG mice was
significantly smaller than that of
corresponding WT mice (Fig. S8E).
Although osteoclast number per bone
perimeter dramatically increased
following ovariectomy in WT mice, the
increase was insignificant in TG mice
(Fig. 5F). Taken together, these results
suggest that DYRK1A TG mice are
apparently resistant to LPS- and
ovariectomy-induced bone loss.
DISCUSSION
In the present report we
investigated the role of DYRK1A in
bone homeostasis. Intriguingly, in an
effort to delineate signaling pathways
responsible for the induction of
DYRK1A, we discovered that NFATc1
stimulated the expression of DYRK1A
in both osteoclast precursors and
osteoblasts. Since NFATc1 activity and
expression were inhibited by DYRK1A,
it is likely that there is a negative-
feedback mechanism. In this hypothesis,
increased NFATc1 upon pro-
osteoclastogenic signals in osteoclast
precursors induces DYRK1A
expression, which in turn attenuates
NFATc1 activity and expression thereby
limiting excessive osteoclastogenesis.
DYRK1A inhibited NFATc1 nuclear
localization and activity via
phosphorylation. Importantly, DYRK1A
also reduced NFATc1 promoter activity,
suggesting a crucial role for DYRK1A in
the regulation of NFATc1
autoamplification process (22). The
schematic diagram in Fig 6A and B
depicted this DYRK1A-dependent
negative-feedback regulation of
osteoclastogenesis. Similarly, bone
formation-inducing signals such as
BMP-2 induce NFATc1 expression in
osteoblasts. Enhanced DYRK1A by
NFATc1 turns down NFATc1 signaling
to prevent uncontrolled bone formation.
Thus, the DYRK1A-NFATc1 negative-
feedback loop might serve as a
mechanism to maintain bone
by guest on August 30, 2018
http://ww
w.jbc.org/
Dow
nloaded from
9
homeostasis and to prevent pathologic
bone destruction or bone formation.
The role of DYRK1A in Down
syndrome has been of particular interest
due to its location on human
chromosome 21q22.2 region denoted as
“Down syndrome critical region”, which
is believed to contain crucial genes for
Down syndrome pathogenesis (23). The
BAC DYRK1A TG mice used in this
study have benefits as a clinically
relevant model since these mice carry
only one copy of human DYRK1A under
the control of endogenous promoter
region (see Supplemental Information
for detailed discussion). As a result,
these mice exhibited ~1.5 fold
overexpression of DYRK1A protein,
providing an optimal model to study the
role of DYRK1A in Down syndrome
pathogenesis (6,19,24). Several groups
have reported that the bone mineral
density in Down syndrome patients is
significantly lower than that in normal
population. Importantly, the reduced
bone density was observed in both male
and female even in young age groups
(25-29). This was in sharp contrast with
the prevalence of osteoporosis in elderly
women in normal population. However,
the etiology of osteoporosis among
Down syndrome patients remains
ambiguous and under debate until
present. The current explanation spans
from the additional existence of gene(s)
on extra chromosome 21 to malnutrition
and sedentary life style among Down
syndrome patients. Here we showed for
the first time that the 1.5-fold overdose
of DYRK1A alone was sufficient to
induce significant reduction in bone
volume (21% in male mice and 13% in
female mice, Fig. 3A), reminiscent of
the Down syndrome-associated
osteoporosis. Inhibition of NFATc1
activity by additional DYRK1A resulted
in a compromised osteoblast
proliferation, differentiation, and
mineralization, supporting a suggested
role of NFATc1 in osteoblastogenesis
(30,31). At the same time, the
proliferation, differentiation, and
function of osteoclasts were also
diminished in DYRK1A TG mice. From
these results, we suggest that extra
DYRK1A in DYRK1A TG mice and
Down syndrome patients sets a new
equilibrium for NFATc1 signaling in
bone homeostasis, reducing bone
turnover (Fig. 6C). In concert with this
hypothesis, we observed consistently
lower numbers of osteoblasts and
osteoclasts in bones from DYRK1A TG
mice in accordance with the reported
“adynamic” bone phenotype in Down
syndrome patients (32). Notably, the
Down syndrome critical region also
contains DSCR1, which encodes a
calcineurin inhibitor. As a result, the
phosphorylated state of NFATc1 might
be further sustained by inhibition of
calcineurin (16), possibly magnifying
the effect of DYRK1A on NFATc1
activity and bone homeostasis in Down
syndrome.
Historically, it was of great
interest to search for gene(s) on human
chromosome 21 that is/are responsible
for specific Down syndrome
pathogenesis. In this context, the
possible involvement of DYRK1A in
Down syndrome skeletal anomalies in
addition to the osteoporotic bone
phenotype might be worth of pursuit.
Notably however, we could not observe
significant gross malformations in
skeletal system such as craniofacial
defect in DYRK1A TG mice, in contrast
to Down syndrome patients and trisomy-
16 mice (33,34). Indeed, mice trisomic
only for ‘Down syndrome critical
region’ did not show distinctive facial
by guest on August 30, 2018
http://ww
w.jbc.org/
Dow
nloaded from
10
phenotype (35), suggesting that genes in
this region may not be involved.
Alternatively, mice overexpressing Ets2
that is located outside of the Down
syndrome critical region had defects in
cranial and cervical skeleton formation
(36). However NFATc1, a substrate of
DYRK1A, has been linked to
craniofacial anomalies in mice. Recent
reports observed craniofacial
malformations in Nfatc1nuc
mice that
express constitutive-active form of
NFATc1 (31), viable Nfatc1-/-
mice (31),
and Nfatc2-/-
Nfatc4-/-
double-knockout
mice (16), suggesting possible gene
dosage-dependent mechanisms for
NFATc proteins in the regulation of
skeletal development. Taken together,
although it is believed that the regulation
of NFATc1 by DYRK1A alone is
sufficient to control bone homeostasis,
skeletal development might be governed
by additional mechanism(s). Further
studies are required to clearly define the
mechanism of NFATc protein regulation
in skeletal anomalies observed in Down
syndrome.
Notwithstanding the deleterious
effect on bone mass in unchallenged
DYRK1A TG mice, extra DYRK1A was
beneficial in protecting these mice from
experimental bone loss induced by
inflammation or hormone deprival. As
summarized in Fig. 6C, bone destruction
by LPS or ovariectomy was prevented
since the negative-regulation of NFATc1
reduced osteoclastogenesis in DYRK1A
TG mice. In efforts to develop a strategy
to intervene osteoporosis, NFATc1 has
been suggested as a target molecule due
to its role for osteoclastogenesis (22,37).
We suggest that targeting DYRK1A
instead of directly modulating NFATc1
might provide efficient strategy for
treating bone destructive diseases, since
only 50% increase in the DYRK1A
protein level was enough to completely
prevent bone loss in animal models.
To summarize, we discovered a
negative-feedback mechanism for
DYRK1A-NFATc1 regulation, which
affects bone homeostasis. Our results
provide an insight into the novel role for
DYRK1A in the regulation of bone mass
in normal and pathologic conditions
including Down syndrome-associated
osteoporosis as well as prospects for
therapeutic applications for bone-
destructive diseases.
by guest on August 30, 2018
http://ww
w.jbc.org/
Dow
nloaded from
11
ACKNOWLEDGEMENTS
This work was supported by KOSEF grants to W-J. S. (R01-2007-000-11910-0), by
Korea Research Foundation grants funded by the Korean Government (KRF-2008-314-
E00180 to W-J. S. and KRF-2008-313-E00439 to Y. L.), and by grants from the 21C
Frontier Functional Proteomics Project (FPR08B1-170) and Science Research Center
(2009-0063269) to H-H. K.
We thank Min-Su Jung for technical support in animal experiments.
by guest on August 30, 2018
http://ww
w.jbc.org/
Dow
nloaded from
12
REFERENCES
1. Becker, W., and Joost, H. G. (1999) Prog Nucleic Acid Res Mol Biol. 62, 1-17.
2. Kentrup, H., Becker, W., Heukelbach, J., Wilmes, A., Schurmann, A., Huppertz,
C., Kainulainen, H., and Joost, H. G. (1996) J Biol Chem. 271, 3488-3495.
3. Fotaki, V., Dierssen, M., Alcantara, S., Martinez, S., Marti, E., Casas, C., Visa, J.,
Soriano, E., Estivill, X., and Arbones, M. L. (2002) Mol Cell Biol. 22, 6636-6647.
4. Smith, D. J., Stevens, M. E., Sudanagunta, S. P., Bronson, R. T., Makhinson, M.,
Watabe, A. M., O'Dell, T. J., Fung, J., Weier, H. U., Cheng, J. F., and Rubin, E.
M. (1997) Nat Genet. 16, 28-36.
5. Altafaj, X., Dierssen, M., Baamonde, C., Marti, E., Visa, J., Guimera, J., Oset, M.,
Gonzalez, J. R., Florez, J., Fillat, C., and Estivill, X. (2001) Hum Mol Genet. 10,
1915-1923.
6. Ahn, K. J., Jeong, H. K., Choi, H. S., Ryoo, S. R., Kim, Y. J., Goo, J. S., Choi, S.
Y., Han, J. S., Ha, I., and Song, W. J. (2006) Neurobiol Dis. 22, 463-472.
7. Becker, W., Weber, Y., Wetzel, K., Eirmbter, K., Tejedor, F. J., and Joost, H. G.
(1998) J Biol Chem. 273, 25893-25902.
8. Teitelbaum, S. L. (2000) Science 289, 1504-1508.
9. Boyle, W. J., Simonet, W. S., and Lacey, D. L. (2003) Nature. 423, 337-342.
10. Arai, F., Miyamoto, T., Ohneda, O., Inada, T., Sudo, T., Brasel, K., Miyata, T.,
Anderson, D. M., and Suda, T. (1999) J Exp Med. 190, 1741-1754.
11. Asagiri, M., and Takayanagi, H. (2007) Bone. 40, 251-264.
12. Lee, Z. H., and Kim, H. H. (2003) Biochem. Biophys. Res. Commun. 305, 211-
214.
13. Theill, L. E., Boyle, W. J., and Penninger, J. M. (2002) Annu Rev Immunol. 20,
795-823.
14. Wada, T., Nakashima, T., Hiroshi, N., and Penninger, J. M. (2006) Trends Mol
Med. 12, 17-25.
15. Gwack, Y., Sharma, S., Nardone, J., Tanasa, B., Iuga, A., Srikanth, S., Okamura,
H., Bolton, D., Feske, S., Hogan, P. G., and Rao, A. (2006) Nature. 441, 646-650.
16. Arron, J. R., Winslow, M. M., Polleri, A., Chang, C. P., Wu, H., Gao, X., Neilson,
J. R., Chen, L., Heit, J. J., Kim, S. K., Yamasaki, N., Miyakawa, T., Francke, U.,
Graef, I. A., and Crabtree, G. R. (2006) Nature. 441, 595-600.
17. Lee, Y., Hyung, S. W., Jung, H. J., Kim, H. J., Staerk, J., Constantinescu, S. N.,
Chang, E. J., Lee, Z. H., Lee, S. W., and Kim, H. H. (2008) Blood 111, 885-893
18. Ryu, J., Kim, H. J., Chang, E. J., Huang, H., Banno, Y., and Kim, H. H. (2006)
Embo J. 25, 5840-5851.
19. Ryoo, S. R., Jeong, H. K., Radnaabazar, C., Yoo, J. J., Cho, H. J., Lee, H. W.,
Kim, I. S., Cheon, Y. H., Ahn, Y. S., Chung, S. H., and Song, W. J. (2007) J Biol
Chem. 282, 34850-34857.
20. Chuvpilo, S., Jankevics, E., Tyrsin, D., Akimzhanov, A., Moroz, D., Jha, M. K.,
Schulze-Luehrmann, J., Santner-Nanan, B., Feoktistova, E., Konig, T., Avots, A.,
Schmitt, E., Berberich-Siebelt, F., Schimpl, A., and Serfling, E. (2002) Immunity.
16, 881-895.
by guest on August 30, 2018
http://ww
w.jbc.org/
Dow
nloaded from
13
21. Chang, E. J., Ha, J., Oerlemans, F., Lee, Y. J., Lee, S. W., Ryu, J., Kim, H. J.,
Lee, Y., Kim, H. M., Choi, J. Y., Kim, J. Y., Shin, C. S., Pak, Y. K., Tanaka, S.,
Wieringa, B., Lee, Z. H., and Kim, H. H. (2008) Nat Med. 14, 966-972.
22. Asagiri, M., Sato, K., Usami, T., Ochi, S., Nishina, H., Yoshida, H., Morita, I.,
Wagner, E. F., Mak, T. W., Serfling, E., and Takayanagi, H. (2005) J Exp Med.
202, 1261-1269.
23. Delabar, J. M., Theophile, D., Rahmani, Z., Chettouh, Z., Blouin, J. L., Prieur,
M., Noel, B., and Sinet, P. M. (1993) Eur J Hum Genet. 1, 114-124.
24. Ryoo, S. R., Cho, H. J., Lee, H. W., Jeong, H. K., Radnaabazar, C., Kim, Y. S.,
Kim, M. J., Son, M. Y., Seo, H., Chung, S. H., and Song, W. J. (2008) J
Neurochem. 104, 1333-1344.
25. Center, J., Beange, H., and McElduff, A. (1998) Am J Ment Retard. 103, 19-28.
26. Angelopoulou, N., Matziari, C., Tsimaras, V., Sakadamis, A., Souftas, V., and
Mandroukas, K. (2000) Calcif Tissue Int. 66, 176-180.
27. Guijarro, M., Valero, C., Paule, B., Gonzalez-Macias, J., and Riancho, J. A.
(2008) J Intellect Disabil Res. 52, 182-189.
28. Sakadamis, A., Angelopoulou, N., Matziari, C., Papameletiou, V., and Souftas, V.
(2002) Eur J Obstet Gynecol Reprod Biol. 100, 208-212.
29. Baptista, F., Varela, A., and Sardinha, L. B. (2005) Osteoporos Int. 16, 380-388.
30. Koga, T., Matsui, Y., Asagiri, M., Kodama, T., de Crombrugghe, B., Nakashima,
K., and Takayanagi, H. (2005) Nat Med. 11, 880-885.
31. Winslow, M. M., Pan, M., Starbuck, M., Gallo, E. M., Deng, L., Karsenty, G., and
Crabtree, G. R. (2006) Dev Cell. 10, 771-782.
32. Grimwood, J. S., Kumar, A., Bickerstaff, D. R., and Suvarna, S. K. (2000)
Histopathology. 36, 279-280.
33. Richtsmeier, J. T., Baxter, L. L., and Reeves, R. H. (2000) Dev Dyn. 217, 137-
145.
34. Richtsmeier, J. T., Zumwalt, A., Carlson, E. J., Epstein, C. J., and Reeves, R. H.
(2002) Am J Med Genet. 107, 317-324.
35. Olson, L. E., Richtsmeier, J. T., Leszl, J., and Reeves, R. H. (2004) Science. 306,
687-690.
36. Sumarsono, S. H., Wilson, T. J., Tymms, M. J., Venter, D. J., Corrick, C. M.,
Kola, R., Lahoud, M. H., Papas, T. S., Seth, A., and Kola, I. (1996) Nature. 379,
534-537.
37. Takayanagi, H., Kim, S., Koga, T., Nishina, H., Isshiki, M., Yoshida, H., Saiura,
A., Isobe, M., Yokochi, T., Inoue, J., Wagner, E. F., Mak, T. W., Kodama, T., and
Taniguchi, T. (2002) Dev. Cell 3, 889-901.
by guest on August 30, 2018
http://ww
w.jbc.org/
Dow
nloaded from
14
FIGURE LEGENDS
Figure 1. Negative regulation of osteoclast differentiation by DYRK1A. (A) BMMs
from ICR mice were treated with 100 ng/ml RANKL for 2 days in the presence of 30
ng/ml M-CSF. Whole cell lysates were subjected to Western blotting. (B) A real-time
PCR analysis to assess mRNA expression of Dyrk1a relative to that of Hprt1. (C) Control
or DYRK1A down-regulated BMMs were stimulated with 100 ng/ml RANKL for 4 days
in the presence of 30 ng/ml M-CSF and stained for TRAP activity. (D) Vector- or
DYRK1A-transfected RAW264.7 cells were stimulated with 200 ng/ml RANKL for 4
days and stained for TRAP activity. All data are representative of at least 3 independent
experiments. Data in (B), (C), and (D) are mean ± S.E. of triplicate assay. **P<0.01
versus control.
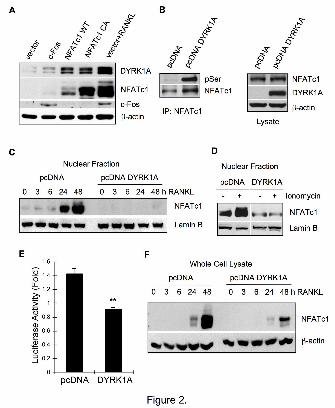
Figure 2. Reduced activity and expression of NFATc1 by DYRK1A via a negative-
feedback mechanism. (A) BMMs were infected with retroviruses containing c-Fos, WT
NFATc1, or constitutive active (CA) mutant of NFATc1 and further incubated for 48 h in
the absence or presence of 100 ng/ml RANKL. Cell lysates were subjected to Western
blotting. (B) 293FT cells were co-transfected with pMX-NFATc1 and pcDNA vector or
pcDNA-DYRK1A constructs. At 24 h after transfection, the NFATc1
immunoprecipitates were subjected to Western blotting using anti-phosphoserine Ab. (C)
Control or DYRK1A-teansfected RAW264.7 cells were stimulated with 200 ng/ml
RANKL for 48 h. The nuclear fraction was examined for NFATc1 by Western blotting.
(D) Control or DYRK1A-transfected RAW264.7 cells were cultured with 200 ng/ml
RANKL for 48 h before stimulation with 10 μM ionomycin for 30 min. Nuclear NFATc1
was examined. (E) NFATc1 promoter activity was measured in RAW264.7 cells in the
presence or absence of excess DYRK1A. (F) Control or DYRK1A-transfected
RAW264.7 cells were stimulated with 200 ng/ml RANKL for 2 days. Whole cell lysates
were analyzed for NFATc1 expression. All data are representative of at least 3
independent experiments. Data in (E) are mean ± S.E. of triplicate assay. **P<0.01
versus control.
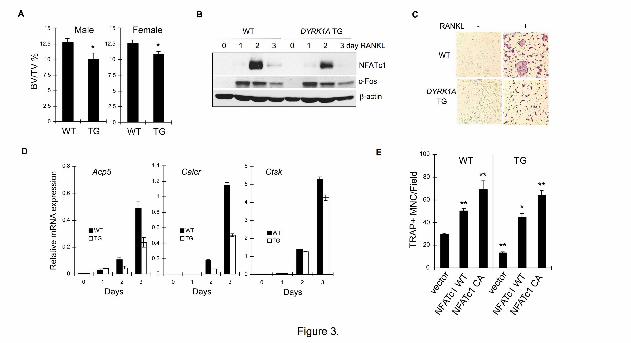
Figure 3. Reduced bone mass in DYRK1A TG mice in spite of impaired
osteoclastogenesis. (A) Femurs from 8 week-old WT and DYRK1A TG mice were
subjected to microCT analyses. Bone volume per tissue volume (BV/TV) was calculated
from femur sections by CT-analysis program. Results are mean ± S.E. of 5 mice per
group. (B) WT or DYRK1A TG BMMs were stimulated with 100 ng/ml RANKL for 3
days in the presence of 30 ng/ml M-CSF. Whole cell lysates were examined by Western
blotting. (C) WT or DYRK1A TG BMMs were stimulated with 100 ng/ml RANKL for 4
days in the presence of 30 ng/ml M-CSF and stained for TRAP activity. (D) A real-time
PCR analysis of osteoclast differentiation markers in WT and DYRK1A TG osteoclasts.
Data are mean ± S.D. of the representative experiment performed in triplicates. (E) WT
or DYRK1A TG BMMs were infected with retroviruses containing WT or constitutive
active (CA) mutant of NFATc1 and cultured for 6 days in the presence of 30 ng/ml M-
CSF and 100 ng/ml RANKL. The number of TRAP positive osteoclasts was counted.
Data are mean ± S.E. of triplicate assay representative of 3 experiments. **P<0.01 and
*P<0.05 versus WT.
by guest on August 30, 2018
http://ww
w.jbc.org/
Dow
nloaded from
15
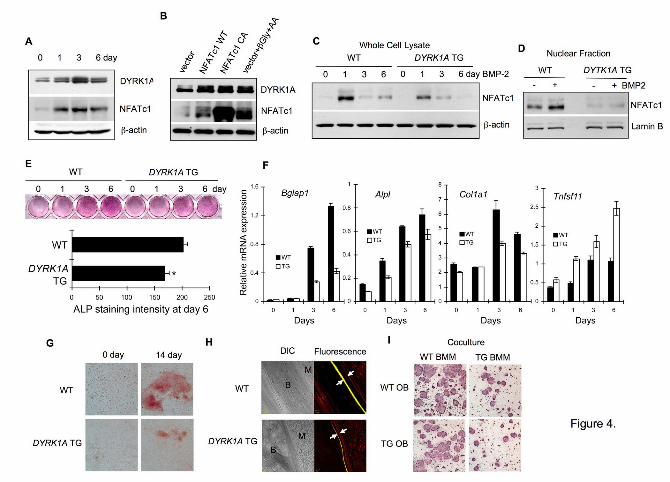
Figure 4. Reduced osteoblastogenesis in DYRK1A TG mice. (A) Calvarial cells
isolated from ICR mice were stimulated with 10 mM -glycerophosphate and 100 μM
ascorbic acid to induce osteoblast differentiation. Whole cell lysates were subjected to
Western blotting. (B) Calvarial cells from ICR mice were infected with retroviruses
containing WT or constitutive active (CA) mutant of NFATc1. Cells were further
incubated for 48 h with or without 10 mM -glycerophosphate ( -Gly) and 100 μM
ascorbic acid (AA). Whole cell lysates were subjected to Western blotting. (C) Calvarial
cells isolated from WT or DYRK1A TG mice were treated with 300 ng/ml BMP-2 for 6
days. Whole cell lysates were examined for NFATc1 expression. (D) WT or TG
osteoblasts were stimulated with 300 ng/ml BMP-2 for 3 days and NFATc1 in nuclear
fraction was examined by Western blotting. (E) WT or DYRK1A TG calvarial cells were
stimulated with 300 ng/ml BMP-2 and stained for alkaline phosphatase activity. Bar
graph indicates intensity of alkaline phosphatase staining of WT and DYRK1A TG
osteoblasts after 6 days (mean ± S.E.M. of 3 experiments performed in triplicates). (F)
WT or DYRK1A TG calvarial cells were stimulated with 10 mM -glycerophosphate and
100 μM ascorbic acid for 6 days and subjected to a real-time PCR analysis of osteoblast
markers. Data are mean ± S.D. of the representative experiment performed in triplicates.
(G) WT or TG calvarial cells were stimulated with 10 mM -glycerophosphate and 100
μM ascorbic acid for 14 days and stained with Alizarin red to assess the formation of
mineralized nodules. (H) WT or DYRK1A TG mice were intraperitoneally injected with
calcein followed by xylenol orange with 7-day interval. Femurs were isolated at 3 days
after final injection and were subjected to confocal microscopy. Fluorescence labels were
indicated by arrows (B; bone, M; marrow space). (I) WT or TG calvarial cells were
cocultured for 7 days in combination with WT or TG BMMs to assess the contribution of
DYRK1A in each cell type to osteoclastogenesis. All data represent at least 3
independent experiments. *P<0.05 versus control.
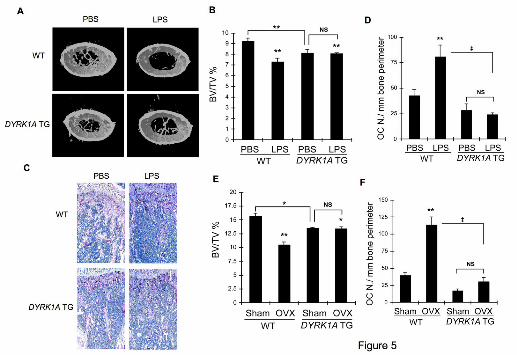
Figure 5. Protection against LPS- and ovariectomy-induced bone loss in DYRK1A
TG mice. (A) Six week-old male mice were challenged with PBS or LPS to induce bone
loss. Femurs were subjected to microCT analyses and representative 3D reconstruction
images of femurs (1 mm thickness starting from 2 mm below growth plate) are shown.
(B) Bone volume per tissue volume (BV/TV) was analyzed from microCT images by
CT-analysis program. (C) Sections of decalcified femurs were stained for TRAP activity
and hematoxylin. (D) The number of osteoclasts was counted from images in (C). (E)
Fourteen week-old female mice were ovariectomized or sham-operated. Femurs were
subjected to microCT analyses to determine BV/TV. (F) The number of osteoclasts was
counted from femoral sections after TRAP staining. Results in (B), (D), (E), and (F) are
mean ± S.E. of 3 mice per group. **P<0.01 and *P<0.05 versus PBS-treated WT.
‡P<0.01 between values linked by lines.
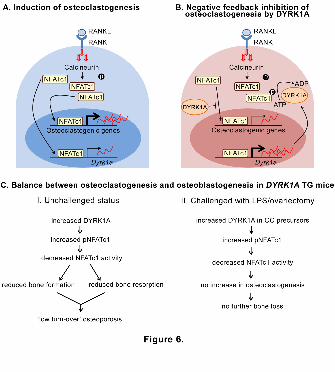
Figure 6. Regulation of bone mass by DYRK1A. (A) During the early phase of
osteoclastogenesis, binding of RANKL to RANK on osteoclast precursors initiates
signaling events including the activation of calcineurin. Dephosphorylated NFATc1
translocates to nucleus and stimulates the induction of osteoclastogenic genes including
Nfatc1. NFATc1 also initiates Dyrk1A transcription. (B) Increase in the DYRK1A protein
by guest on August 30, 2018
http://ww
w.jbc.org/
Dow
nloaded from

16
during osteoclastogenesis results in the phosphorylation of NFATc1 and inhibition of
nuclear translocation, thereby reducing the transcription of osteoclastogenic genes
including Nfatc1. Similar negative-feedback regulation of NFATc1 by DYRK1A is also
observed during BMP-2-dependent osteoblastogenesis. (C) DYRK1A TG mice show
osteoporotic phenotype due to the reduced bone turn-over. However, these mice are
protected from the pathologic bone destruction by inflammation or hormone-deprival.
by guest on August 30, 2018
http://ww
w.jbc.org/
Dow
nloaded from
Song and Hong-Hee KimYoungkyun Lee, Jeongim Ha, Hyung Joon Kim, Yeun-Soo Kim, Eun-Ju Chang, Woo-Joo
Negative-feedback inhibition of NFATc1 by DYRK1A regulates bone homeostasis
published online October 2, 2009J. Biol. Chem.
10.1074/jbc.M109.042234Access the most updated version of this article at doi:
Alerts:
When a correction for this article is posted•
When this article is cited•
to choose from all of JBC's e-mail alertsClick here
Supplemental material:
http://www.jbc.org/content/suppl/2009/10/02/M109.042234.DC1
by guest on August 30, 2018
http://ww
w.jbc.org/
Dow
nloaded from