Embed Size (px)
Citation preview
ABSTRACT
Title of Document: NEIGHBORHOOD LEVEL
DISADVANTAGE,RACE/ETHNICITY AND INFANT MORTALITY IN WASHINGTON DC
Ndidiamaka Nneoma Amutah
Doctor of Philosophy, 2010 Directed By: Dr. Sandra L. Hofferth Professor &
Dr. Elaine A. Anderson, Professor, Co-Chairs Department of Family Science
This study examines the effects of neighborhood level disadvantage and individual
level characteristics such as race/ethnicity on infant mortality. Social determinants of
health theory and ecological theory were used to construct a neighborhood advantage
index for Washington DC. Secondary analyses were conducted using linked
birth/death certificate and census data from the DC State Center for Health Statistics.
Live births (55,938) and infant deaths (607) occurring in Washington DC from 2001-
2007 were examined. Multilevel modeling techniques were utilized to determine the
relationship between individual and neighborhood level factors on infant mortality.
The research questions were: (a) Do women who are comparable on factors such as
maternal education and marital status experience different rates of infant mortality by
race? (b) Do women living in areas of high disadvantage experience higher rates of
infant mortality than women living in areas of low disadvantage? (c) Does the effect
of race/ethnicity on infant mortality change if the mother lives in a place of high
disadvantage versus low disadvantage? (d) Does having an infant born preterm or low
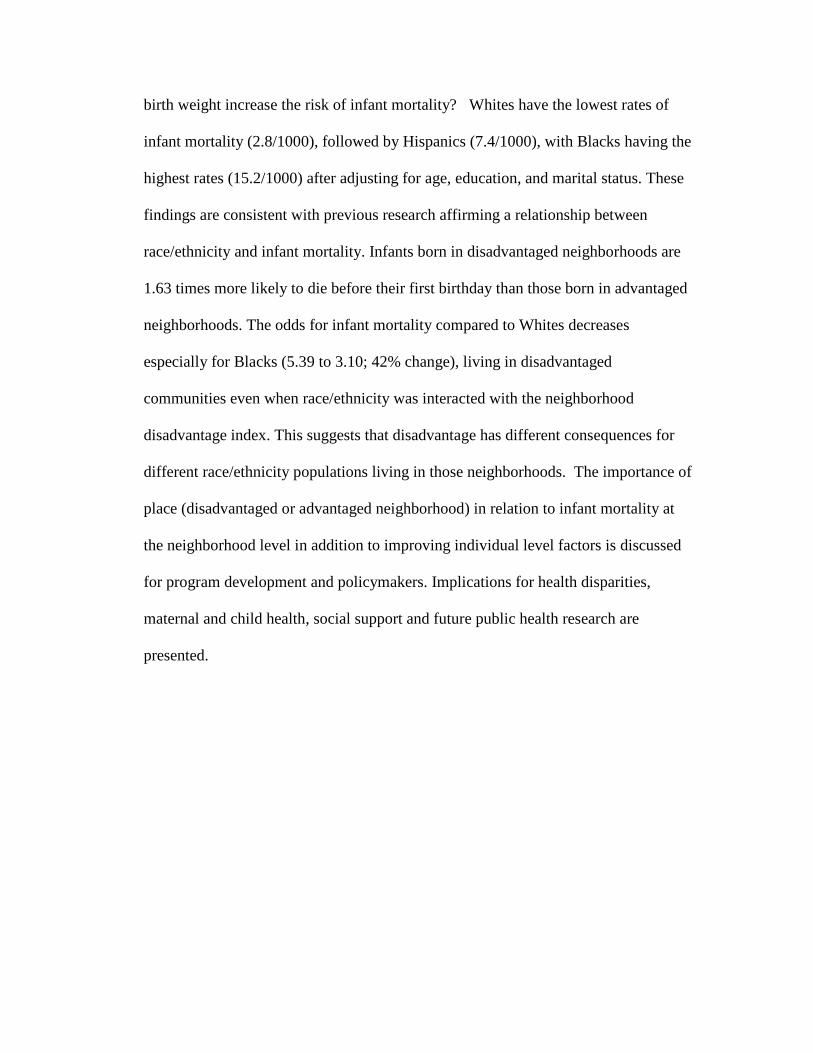
birth weight increase the risk of infant mortality? Whites have the lowest rates of
infant mortality (2.8/1000), followed by Hispanics (7.4/1000), with Blacks having the
highest rates (15.2/1000) after adjusting for age, education, and marital status. These
findings are consistent with previous research affirming a relationship between
race/ethnicity and infant mortality. Infants born in disadvantaged neighborhoods are
1.63 times more likely to die before their first birthday than those born in advantaged
neighborhoods. The odds for infant mortality compared to Whites decreases
especially for Blacks (5.39 to 3.10; 42% change), living in disadvantaged
communities even when race/ethnicity was interacted with the neighborhood
disadvantage index. This suggests that disadvantage has different consequences for
different race/ethnicity populations living in those neighborhoods. The importance of
place (disadvantaged or advantaged neighborhood) in relation to infant mortality at
the neighborhood level in addition to improving individual level factors is discussed
for program development and policymakers. Implications for health disparities,
maternal and child health, social support and future public health research are
presented.

NEIGHBORHOOD LEVEL DISADVANTAGE, RACE/ETHNICITY AND INFANT MORTALITY IN WASHINGTON DC.
By
Ndidiamaka Nneoma Amutah
Dissertation submitted to the Faculty of the Graduate School of the University of Maryland, College Park, in partial fulfillment
of the requirements for the degree of Doctor of Philosophy
2010
Advisory Committee: Professor Sandra L. Hofferth, Co-Chair Professor Elaine A. Anderson, Co-Chair Associate Professor Mia S. Bynum Professor of the Practice Samuel S. Kessel Professor Tony L. Whitehead

© Copyright by Ndidiamaka Nneoma Amutah
2010

ii
Acknowledgements
“To whom much is given, much is required” (Luke 12:48). This dissertation could not
have come to fruition or completion without the help of many people. First and foremost,
I thank God for giving me the ambition, courage, and strength to pursue a doctoral
degree. Secondly, I thank my family, who have raised me to adulthood and continue to
raise, guide, consult, and love me. My mother, Abigail Amutah, my three brothers
Azunnah, Chimaobi, and David Amutah have been my rock and backbone for as long as I
can remember. My husband, Shaun Hardrick has truly been a blessing. From the
delicious meals to the insightful conversations, his love and feelings of pride for me have
never wavered. My best friend Mighty Fine, who has been an integral part of the
dissertation and my life for the past 10 years, thank you!
To my dissertation co-chairs, Drs. Sandra Hofferth and Elaine Anderson, this dissertation
has been a labor of love. I will be forever indebted to you for your many hours of
meetings, emails, conversations, and most of all the track changes in versions of the
document! Thank you, thank you, and thank you! To my committee members, Drs.
Bynum, Kessel and Whitehead, thank you for serving and providing your invaluable
wisdom to me. To Yeats Ye, thanks for your guidance, insight, and help with the data.
To, Drs. Johnson-Clarke and Davies-Cole from the State Center for Health Statistics
thanks for the data. To everyone else that has been kind, thoughtful and patient with me
during this process, thank you!
iii
Table of Contents
Acknowledgements ....................................................................................................... ii
Table of Contents ......................................................................................................... iii
List of Tables .................................................................................................................v
List of Figures .............................................................................................................. vi
Chapter 1: Introduction .................................................................................................1
Purpose ........................................................................................................................ 8
Chapter 2: Literature Review .......................................................................................10
Social Determinants of Health Theory ..................................................................... 10
Ecological Theory and Adverse Birth Outcomes ......................................................... 11
Dependent Variable ...................................................................................................... 14
Infant Mortality ......................................................................................................... 14
Independent Variables .................................................................................................. 15
Neighborhood Poverty .............................................................................................. 15
Mediators ...................................................................................................................... 21
Birth Outcomes: Low Birth Weight .......................................................................... 21
Birth Outcomes: Preterm Birth ................................................................................. 22
Controls ......................................................................................................................... 24
Maternal Age and the Weathering Hypothesis ......................................................... 24
Maternal Education ................................................................................................... 25
Marital Status ............................................................................................................ 26
Prenatal Care ............................................................................................................. 26
Research Questions and Hypotheses ............................................................................ 29
Chapter 3: Methodology ..............................................................................................32
Sample........................................................................................................................... 32
Procedure ...................................................................................................................... 33
Linked Birth/Death Data Set ..................................................................................... 33
Neighborhood Level Data ............................................................................................. 34
Definition of Variables ................................................................................................. 35
Dependent Variable ...................................................................................................... 35
Infant Mortality ......................................................................................................... 35
Independent Variables .................................................................................................. 36
Individual Level Variables ........................................................................................ 36
Community Level Variables ......................................................................................... 36
Neighborhood Disadvantage ..................................................................................... 36
Mediators of Infant Mortality ....................................................................................... 37
Low Birth Weight ..................................................................................................... 37
Preterm Birth ............................................................................................................. 37
Controls ......................................................................................................................... 38
Marital Status ............................................................................................................ 38
Maternal Education ................................................................................................... 38
iv
Maternal Age ............................................................................................................ 38
Prenatal care .............................................................................................................. 38
Modeling ....................................................................................................................... 39
Figure 3: Conceptual Model ........................................................................................40
Data Analysis ................................................................................................................ 40
Research Question 1 ................................................................................................. 42
Research Question 2 ................................................................................................. 43
Research Question 3 ................................................................................................. 43
Research Question 4 ................................................................................................. 44
Chapter 4: Results ........................................................................................................45
Demographic Characteristics of the Sample ................................................................. 46
Research Question 1 ................................................................................................. 54
Research Question 2 ................................................................................................. 58
Research Question 3 ................................................................................................. 61
Research Question 4 ................................................................................................. 64
Chapter 5: Discussion .................................................................................................69
Characteristics of the Sample........................................................................................ 70
Predictors of Infant Mortality (Dependent Variable) in Washington DC..................... 70
Independent Variables .................................................................................................. 71
Maternal Race ........................................................................................................... 71
Disadvantage Index ................................................................................................... 71
Control Variables .......................................................................................................... 73
Maternal Education ................................................................................................... 73
Maternal Age ............................................................................................................ 74
Marital Status ............................................................................................................ 74
Prenatal Care ............................................................................................................. 75
Mediator Effect of Birth Weight, and Preterm Birth on Infant Mortality .................... 76 Summary ....................................................................................................................... 77
Limitations .................................................................................................................... 77
Application to Social Determinants of Health Model and Ecological Theory ............. 78
Programmatic and Policy Implications ......................................................................... 80
Implications for Black Women in DC .......................................................................... 82
Directions for Future Research ..................................................................................... 84
Conclusion .................................................................................................................... 85
Appendix A – IRB Approval from the University of Maryland .................................86
Appendix B- Birth Certificate, 2003 Version ..............................................................87
Appendix C- Death Certificate 2005 Version .............................................................89
Appendix D- Definition of Variables ..........................................................................91
Appendix E- Factor Analysis for Disadvantage Score by Ward .................................92
References ....................................................................................................................93
v
List of Tables
Table 1. National Data on Rates of Low Birth Weight………………………………………………...................................................3 Table 2a. Selected Demographic Statistics of Wards………………………………………………………………………………….5 Table 2b. Selected Demographic Statistics of DC ……………………………..6 Table 3. List of Variables used for Multilevel Analysis……………………………..42 Table 4. Overall Descriptive Statistics of Sample………………………………………………………………………………..46 Table 5. Table 5. Demographic Maternal Characteristics, Birth Weight and Infant
Mortality by Percent…………………………………………………………………..48
Table 6a. – 6d. Infant Mortality by Maternal Characteristics and Disadvantage………………………………………………………………………50-53 Table 7. Infant Mortality by Maternal Characteristics and Disadvantage…………………………………………………………………………….55 Table 8. Odds Ratio for Infant Mortality by Race, Maternal Age, Maternal Education, and Marital Status…………………………………………………………………………….. . ……57 Table 9. Race, Demographic Characteristics and Neighborhood Level Disadvantage as predictors of infant mortality ……………………………………………………………60 Table 10 Race, Demographic Characteristics and Neighborhood Level Disadvantage as predictors of infant mortality.………………………………………………………………………………63 Table 11. Infant Mortality by Ward and Race…………………………………………………………………………..................64
Table 12- Demographic Factors, Birth Weight, Preterm Birth, and Adequacy of Prenatal Care as Predictors of Infant Mortality………………………………………………………………………………66
Table 13 Summary of Results………………………………………………………67-68

vi
List of Figures
Figure 1. Geographic Location of Wards …………………………………………..5 Figure 2. Ecological Model………………………………………………………………………………...13 Figure 3. Conceptual Model………………………………………………………………………………...40
1
Chapter 1: Introduction
A lack of improvement in the rates of infant and neonatal mortality over the
past couple of decades has warranted additional research in this area (Lee, Nigel,
Gartner, Pearlman, & Gruss, 1980; Brosco, 1999). The lack of improvement in the
rates directly contrasted the gains in infant mortality that had been made in previous
decades. Specifically, in the years from 1950 to 1965, the rates for neonatal mortality
declined 12% (Lee et al., 1980). In the 10 years from 1965 to 1975 the rates declined
by 35% (Lee et al., 1980). Except for a small transient increase in the 1960’s both the
very low birth weight and the low birth weight rates were unchanged for a period of
at least 25 years (Lee et al., 1980). In 1984, the black infant mortality rate in the
United States was 18.4 per 1,000 whereas the white infant mortality was 9.4 per 1,000
(Sappenfield, Buehler, Binkin, Hogue, Strauss, & Smith, 1987,). Additionally, the
ratio of Black to White infant mortality was nearly the same in 1984 (1.96) as it was
in 1960 (1.93) (Sappenfield et al., 1987; Brosco, 1999). Furthermore, the neonatal
mortality rate dropped by 89%, reaching a low in 1999 of 4.7 (Alexander, Kogan,
Bader, Carlo, Allen, & Mor, 2003).
Infant mortality is a tragic event for families and communities and is also an
indicator of the health of a nation. Congenital malformation is the leading factor
associated with infant death in the United States, and in 2005 accounted for 20% of
all infant deaths (MacDorman & Matthews, 2009a, CDC, 2008). A close second was
disorders related to short gestation (preterm birth) and low birth weight that is not
elsewhere classified, at 17% followed by sudden infant death syndrome (SIDS) at
2
8%, newborn deaths affected by maternal complications of pregnancy at 6%, and
cord complications at 4% (MacDorman & Matthews, 2009a, CDC, 2008).
Collectively, these causes of death for infants account for 55% of all infant deaths in
the U.S. (MacDorman & Matthews, 2009a). For some of the leading causes of deaths
such as SIDS and congenital malformation, the rates have decreased by 13% and 5%
respectively, but for low birth weight the rates have either stayed the same or
increased over time (MacDorman & Matthews, 2009a ; CDC, 2008).
Moreover, infant mortality varies by demographics of the mother such as race.
Disorders related to short gestation (< 37 weeks) are the leading cause of death for
Black infants, whereas congenital malformations are the leading cause of death for
White infants (MacDorman & Matthews, 2009a). Short gestation is closely associated
with low birth weight (<2500 grams), and low birth weight is a factor associated with
first-year mortality risk, as well as the primary reason for the underlying racial
disparity in infant mortality rates.
The prevalence of low birth weight and preterm births and their relationship to
infant mortality are extremely important health issues in the United States. This issue
is particularly important in minorities such as Blacks. Infant mortality in the United
States is sizeable; there are more than 28,000 deaths of children less than 1 year of
age every year in the United States (MacDorman & Matthews, 2008). As stated in the
Healthy People 2010 report on Maternal, Infant, and Child Health, “as of 1995, the
U.S. infant mortality rates ranked 25th among industrialized nations.”A 2008 report
from the National Center for Health Statistics showed a ranking of 30th for the U.S.
infant mortality rates (MacDorman & Matthews, 2008). In addition, the disparity in
3
infant mortality rates between Whites and racial and ethnic groups (especially Blacks,
American Indians and Alaska Natives, Native Hawaiians, and Puerto Ricans) persists.
A recent vital statistics report stated that Non-Hispanic Black infants in 2005
had the highest infant mortality rate in the U.S.; 13.7 per 1,000 live births compared
to 5.7 per 1,000 live births among non-Hispanic Whites (MacDorman & Matthews,
2008). The Healthy People 2010 target goal for the U.S. infant mortality rate is 4.5
infant deaths per 1,000 live births (Healthy People, 2009). In 2005, there was a more
than threefold difference in infant mortality rates by race and ethnicity that ranged
from 13.7 for Black women to a low of 4.42 for Cuban women (MacDorman &
Matthews, 2009a). Cuban women were the only group to achieve the Healthy People
2010 target goal of less than 4.5 infant deaths as of 2005 (Healthy People, 2009).
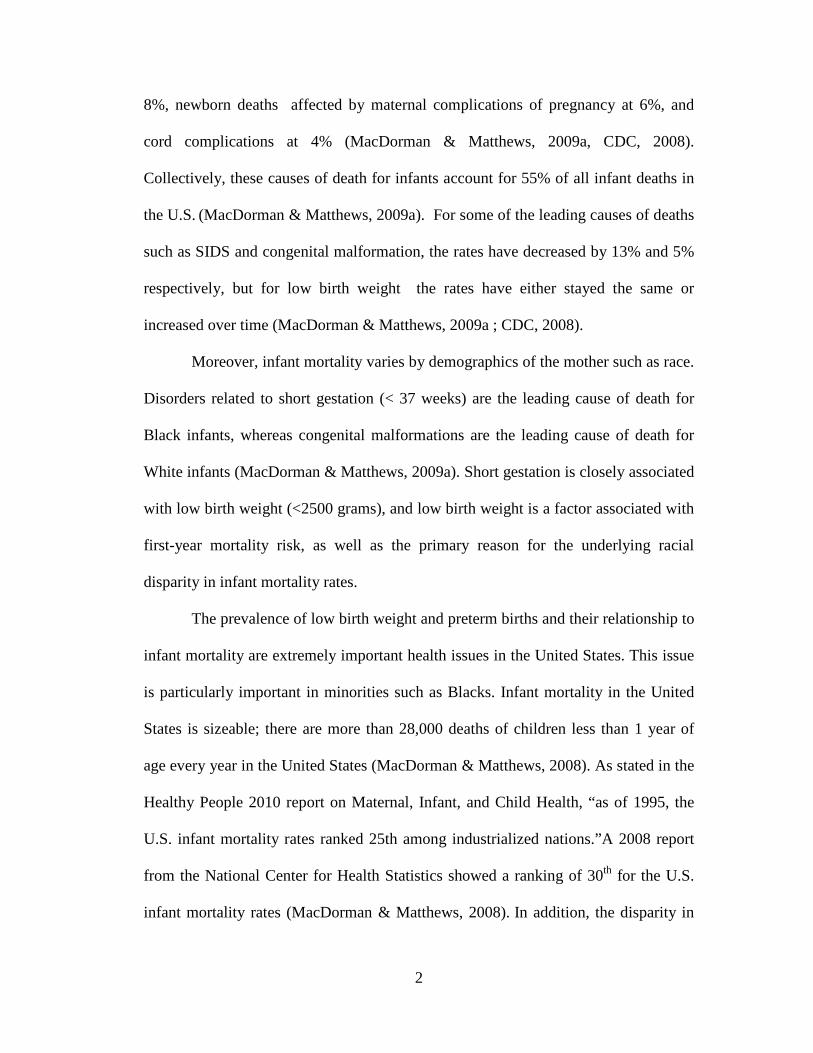
With respect to low birth weight babies, in 2006, Black women had 14.0 low
birth weight babies per 100 births, while non-Hispanic White women had 7.0 low
birth weight babies per 100 births (Martin, Hamilton, Sutton, Ventura, Menacker,
Kirmeyer & Matthews, 2009). Table 1 provides an overview of the national data on
low birth weight as reported in a recent vital statistics report showing the trend for
low birth weight over time. .
Table 1. National Data on Rates of Low Birth weight, 1990, 2006 and 2007
Source: National Vital Statistics Report, 2009
Black White Hispanic
1990- 13.1 % 1990-5.6% 1990-6.1%
2006-14.0% 2006-7.3% 2006-7.0%
2007-13.6% 2007-7.2% 2007-6.9%
4
With regard to the percentage of all preterm births, from 2000 to 2006 the
percentage of preterm births increased from 11.6% to 12.7% (Martin et al., 2009). In
2005, 68.6% of all infant deaths occurred to infants who were born preterm
(MacDorman & Matthews, 2008). As also seen with low birth weight, Black women
disproportionately accounted for nearly half of all infant preterm birth deaths, (46%),
compared with White women (32%) (MacDorman & Matthews, 2008). Finally, in an
international comparison, 1 in 8 births in the United States is preterm, compared with
1 in 18 births in Ireland and Finland for example (MacDorman & Matthews, 2009b).
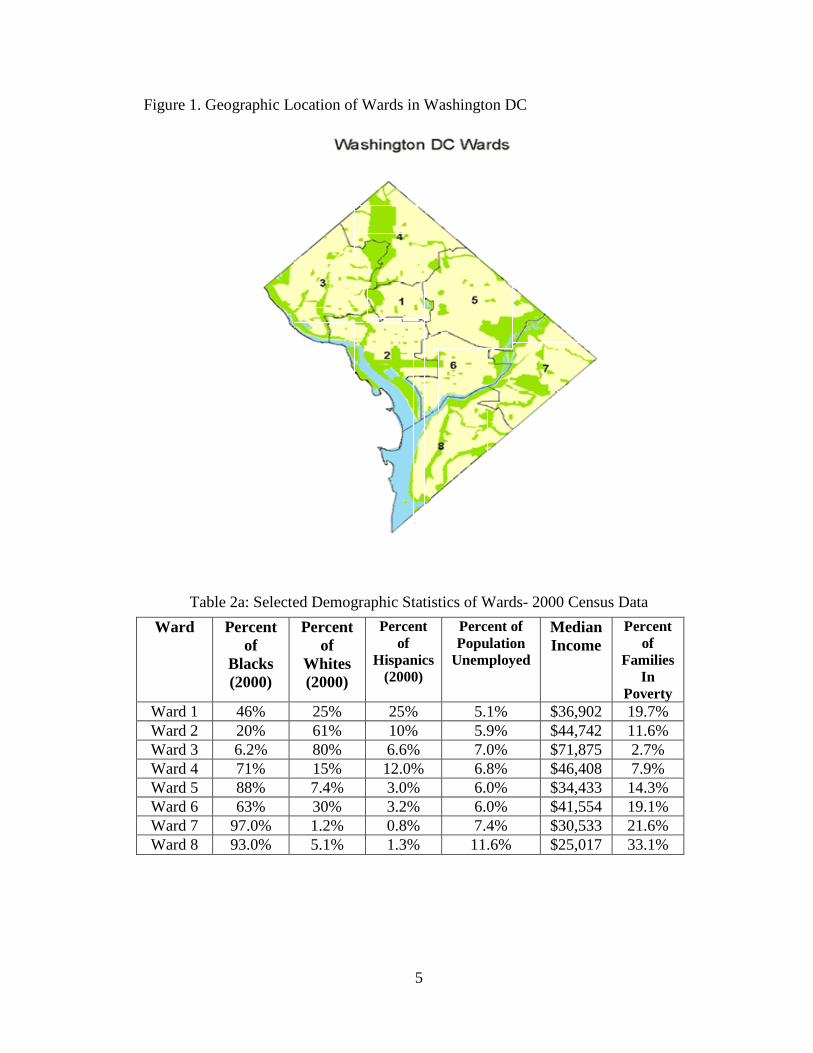
Washington DC, parallels the U.S. in terms of high rates of infant mortality
(Johnson-Clarke, 2009). The focus of the current study is on infnat mortality in
Washington DC. Therefore, in order to address this health challenge on a local level
and gain a better understanding of the unique dynamics that comprise Washington
DC, it is important to examine each of the 8 geographic wards individually within the
District of Columbia. All of the information below regarding the status of the
District’s wards was derived from the District of Columbia, State Center for Health
Statistics. Figure 1 provides the location of the geographic wards in Washington DC
and Table 2a and 2b provide selected demographics of Ward data.
5
Figure 1. Geographic Location of Wards in Washington DC
Table 2a: Selected Demographic Statistics of Wards- 2000 Census Data
Ward Percent of
Blacks (2000)
Percent of
Whites (2000)
Percent of
Hispanics (2000)
Percent of Population
Unemployed
Median Income
Percent of
Families In
Poverty Ward 1 46% 25% 25% 5.1% $36,902 19.7% Ward 2 20% 61% 10% 5.9% $44,742 11.6% Ward 3 6.2% 80% 6.6% 7.0% $71,875 2.7% Ward 4 71% 15% 12.0% 6.8% $46,408 7.9% Ward 5 88% 7.4% 3.0% 6.0% $34,433 14.3% Ward 6 63% 30% 3.2% 6.0% $41,554 19.1% Ward 7 97.0% 1.2% 0.8% 7.4% $30,533 21.6% Ward 8 93.0% 5.1% 1.3% 11.6% $25,017 33.1%
6
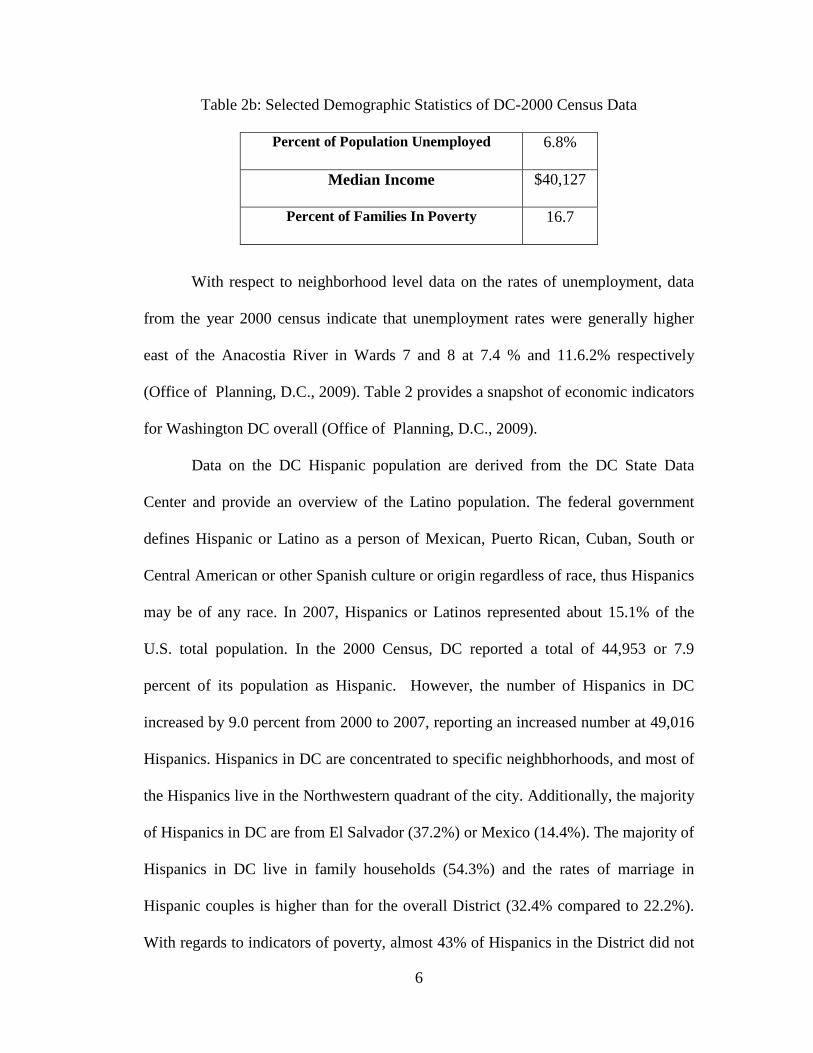
Table 2b: Selected Demographic Statistics of DC-2000 Census Data
Percent of Population Unemployed 6.8%
Median Income $40,127
Percent of Families In Poverty 16.7
With respect to neighborhood level data on the rates of unemployment, data
from the year 2000 census indicate that unemployment rates were generally higher
east of the Anacostia River in Wards 7 and 8 at 7.4 % and 11.6.2% respectively
(Office of Planning, D.C., 2009). Table 2 provides a snapshot of economic indicators
for Washington DC overall (Office of Planning, D.C., 2009).
Data on the DC Hispanic population are derived from the DC State Data
Center and provide an overview of the Latino population. The federal government
defines Hispanic or Latino as a person of Mexican, Puerto Rican, Cuban, South or
Central American or other Spanish culture or origin regardless of race, thus Hispanics
may be of any race. In 2007, Hispanics or Latinos represented about 15.1% of the
U.S. total population. In the 2000 Census, DC reported a total of 44,953 or 7.9
percent of its population as Hispanic. However, the number of Hispanics in DC
increased by 9.0 percent from 2000 to 2007, reporting an increased number at 49,016
Hispanics. Hispanics in DC are concentrated to specific neighbhorhoods, and most of
the Hispanics live in the Northwestern quadrant of the city. Additionally, the majority
of Hispanics in DC are from El Salvador (37.2%) or Mexico (14.4%). The majority of
Hispanics in DC live in family households (54.3%) and the rates of marriage in
Hispanic couples is higher than for the overall District (32.4% compared to 22.2%).
With regards to indicators of poverty, almost 43% of Hispanics in the District did not
7
have a high school diploma, and about 70.2 percent of Latinos in DC lived in renter
occupied housing (Office of Planning, D.C., 2009).
The analysis conducted for this research project builds on previous research
examining the factors associated with infant death.The analysis elucidates the effect
of social determinants of health at a neighborhood level on infant mortality in
Washington DC. The social determinants of health approach are factors that
collectively determine a woman’s “place” in society as well as her actual physical
location (Jackson, 2007). Examples of variables that represent the social determinants
of health model include: area of residence, education, income level, and access to
economic resources (Arrivillaga, 2009). Health care costs and accessibility vary
greatly in Washington DC based on location and place, and this difference is in part
due to differences in a community’s economic prosperity or debt, as well as
differences in policies and legislation enacted in specific communities (Matteson,
Burr & Marshall, 1998). In this study it is posited that through multilevel modeling
and the nesting of factors such as a neighborhood level disadvantage index, as well as
characteristics such as maternal education and marital status, a more detailed
relationship will be demonstrated with regard to whether or not the woman
experiences infant mortality. In the past, researchers have claimed that poverty is
increasingly becoming concentrated in urban areas and that the United States is in an
age of economic extremes, thus leading to further isolation of people in poverty
(Matteson, et al., 1998 ). This study assesses the effect of disadvantage in relation to
infant mortality at a neighborhood/ward level.
8
Purpose
The present study examines health disparities, maternal and child health and
neighborhood level influences on infant mortality. Collins, Wambach, David, &
Rankin (2009a), Raux (2001a), and O’Campo, Xue, Wang, & Caughy (1997) have
previously conducted research on the influences of neighborhood and place on infant
mortality using multilevel modeling. Washington DC demonstrates diversity in
income, access to resources, and demographics of its residents. The use of multilevel
modeling allows for a closer examination of the main variables of interest to infant
mortality. Finally, the use of neighborhood disadvantage as a main community level
variable of interest has not been studied previously in Washington DC with regards to
infant mortality and other adverse birth outcomes.
Infant mortality is examined in relation to demographic characteristics of the
mother such as maternal race, age, marital status and educational attainment. Using
linked birth death data from the District of Columbia, State Center for Health
Statistics from 2001-2007, the relationship between race/ethnicity, low birth weight,
neighborhood level poverty (as measured at the Ward level), and infant mortality for
women in Washington DC is studied.
With a focus on race and the social determinants of health such as the level of
disadvantage in a woman’s neighborhood, individual factors such as her marital
status, a previous history of preterm births (<37 weeks) and low birth weight (<2500
grams), this research examines the differences in infant death in Washington DC.
Infant mortality is analyzed for infants born to women of different races while
controlling for maternal age, maternal education, prenatal care and marital status. By
9
using the linked birth-death data and census data to glean indicators of advantage, this
research further examines the characteristics of mothers such as race/ethnicity and
communities in which mothers live, and the level of disadvantage in the
neighborhood, to understand the factors associated with infant mortality in DC. The
major research question is: How is infant mortality affected by the neighborhood in
which the mother resides in Washington DC with regard to disadvantage at the Ward
level and the race/ethnicity of the mother? The goal of this study is to identify those
specific factors that can be addressed in programmatic and policy initiatives, in order
best to reduce infant mortality health disparities in the District of Columbia.
10
Chapter 2: Literature Review
Social Determinants of Health Theory
In a report titled “Race, Stress, and Social Support: Addressing the Crisis in
Black Infant Mortality”, Jackson (2007) states that existing models that examine
infant mortality in Blacks have failed to elucidate the main reasons for the two-fold
gap between Blacks and Whites. Jackson posits a new model should be developed
that encompasses the social determinants of health theory, and that women and their
babies must be viewed not only as individuals but as members of families,
communities, and larger systems that have either positive or negative impacts on their
psychological and physical state. Thus, the social determinants of health theory would
be beneficial in the further exploration of the relationship of neighborhood level to
adverse birth outcomes such as infant mortality. The financial benefits or constraints
of their physical environment as well as protective and resiliency factors of their
work, life, and recreational environment should be taken into consideration when
planning programs with this population (Jackson, 2007).
The social determinants of health approach uses variables or factors that
collectively determine a woman’s “place” in society as well as her actual physical
location (Jackson, 2007). Examples of variables that represent the social determinants
of health model include: area of residence, education, and income level (Arrivillaga,
2009). The social determinant of health model is supported by substantial theory,
practice, and epidemiological evidence. In particular, this approach addresses the
growing evidence that social class is a major predictor of poor birth outcomes.
Additionally, the social determinant of health model recognizes that there are social
11
influences on health which operate through a variety of mechanisms, one of which
could be the neighborhood in which people live. The social determinant’s of health
model is the central theme of the present research and the basis of the research
question as it relates to neighborhood influences on birth outcomes.
Ecological Theory and Adverse Birth Outcomes
The ecological system has implications for the family and public health research
conducted in this study. Coined by Brofenbrenner, there are 5 layers in the ecological
theory (Paquette & Ryan, 2001). These are:
• The microsystem –Structures in the microsystem include family, school, and
neighborhood. At this level, relationships have impact in two directions.
Bronfenbrenner calls these bi-directional influences, and they occur among all
levels of environment. The interaction of structures within a layer and
interactions of structures between layers is key to this theory.
• The mesosystem – this layer provides the connection between the structures of
the child’s microsystem
• The exosystem – this layer defines the larger social system in which the child
does not function directly.
• The macrosystem – this layer may be considered the outermost layer in the
child’s environment. While not being a specific framework, this layer is
comprised of cultural values, customs, and laws (Berk, 2000). The effects of
larger principles defined by the macrosystem have a cascading influence
throughout the interactions of all other layers.
12
• The chronosystem – this system encompasses the dimension of time as it
relates to a child’s environments. Elements within this system can be either
external, or internal.
From a public health perspective, the ecological theory states that a public health
issue of concern such as infant mortality is the result of an overlap of many factors at
different levels and their influence on infant mortality (Alio, Richman, Clayton,
Jeffers, Wathington & Salihu, 2009). The ecological model posits two main concepts:
1) individual behavior affects and, in turn, is affected by the social environment and
2) behavior shapes and is shaped by many levels of influence (Alio et al., 2009). Alio
et al. reference the five levels of the ecological model that can affect health behavior:
1) individual factors, 2) interpersonal factors, 3) institutional or organizational
factors, 4) community factors, and 5) public policy factors. The ecological model,
similar to the social determinants of health model, acknowledges that analyzing all of
a person’s environments such as the family, the community, and the social
environment in which a person resides are integral to understand and alleviate health
problems such as infant mortality (Alio et al.).
The ecological model provides a framework within which to examine and
contextualize racial disparities in birth outcomes, demonstrating the multiple facets of
interaction between parental and familial risk factors within the context of the
community and society as a whole. Figure 2 illustrates the ecological model as it is
commonly described in the literature. For this present study, only two levels of the
ecological model, the individual, and the community factors are assessed both
separately and collectively to examine the relationship to infant mortality.
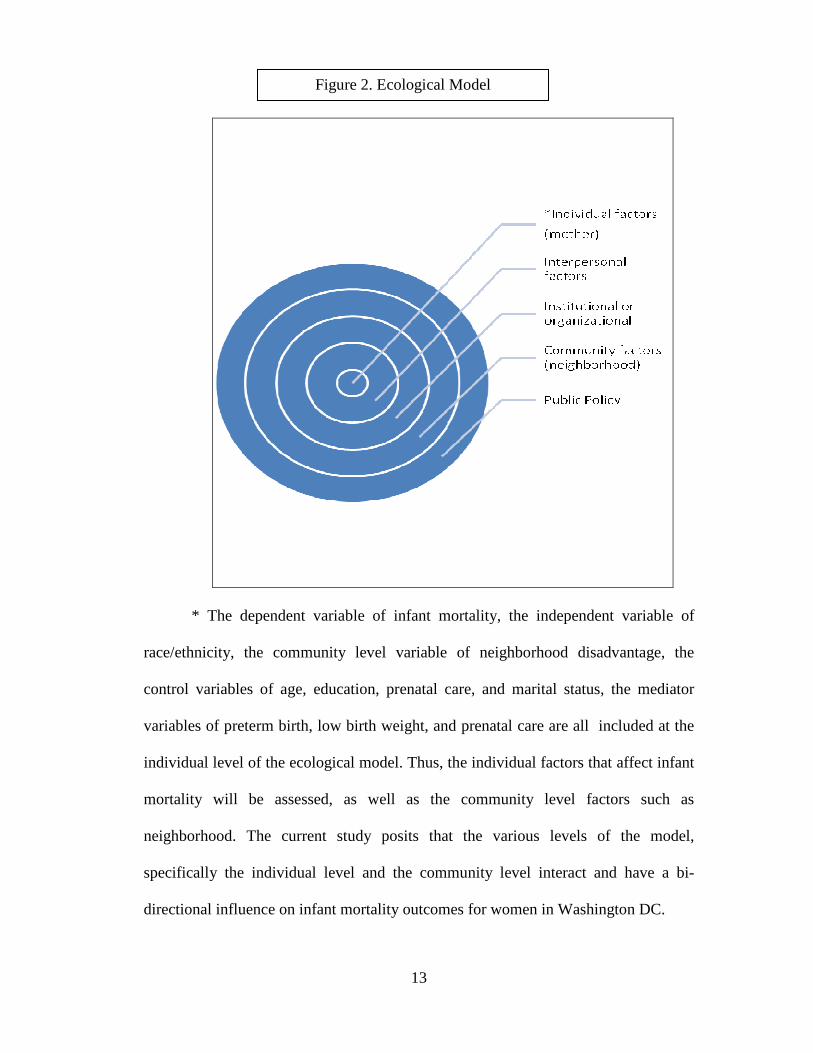
13
* The dependent variable of infant mortality, the independent variable of
race/ethnicity, the community level variable of neighborhood disadvantage, the
control variables of age, education, prenatal care, and marital status, the mediator
variables of preterm birth, low birth weight, and prenatal care are all included at the
individual level of the ecological model. Thus, the individual factors that affect infant
mortality will be assessed, as well as the community level factors such as
neighborhood. The current study posits that the various levels of the model,
specifically the individual level and the community level interact and have a bi-
directional influence on infant mortality outcomes for women in Washington DC.
Figure 2. Ecological Model
14
Dependent Variable
Infant Mortality
The major dependent variable explored in this study is infant mortality. The
rates of infant mortality have shown great improvement since the early 1900’s. In
1915, the rate of infant deaths was 100 infants per 1,000 live births (Berger, 2001). In
2005 the rate of infant mortality for the United States as a whole was 6.86
(MacDorman & Matthews, 2008). This decline represents a 90% decrease in the rates
of infant death for the United States, a feat that many medical and public health
advances helped to achieve. Some of these advances include improvements in
sanitation, pasteurization of milk, reduced fertility rates, and improved water and
sewage (Berger, 2001).
According to Berger (2001), there were three specific periods of development
the United States experienced that ultimately helped set the stage for a reduction of
infant mortality rates. These periods were: 1930-1950, the development of antibiotics
and fluid replacement techniques such as blood transfusions; the 1970’s, the
expansion of neonatal intensive care units to treat adverse birth outcomes; and the
1980’s, artificial pulmonary surfactant treatment for respiratory distress that is
common in many low birth weight babies. Additionally with regard to legislative
action, the introduction of Medicaid services in the 1960’s also improved birth
outcomes by providing access to care for low-income women. Finally, public health
played a major role in reducing infant mortality, by improving the rates of
immunization in children, and reducing sudden infant death syndrome (SIDS) by
placing infants on their backs to sleep. Over the past 40 years, the decline in infant
15
deaths experienced by White infants as compared to Black infants however has been
faster, thus increasing the gap between the two groups.
Berger states that much of this racial difference in the neonatal period is
attributed to low birth weight and preterm birth, and in the post neo-natal period the
difference is a result of psychosocial factors experienced by Black women, such as
racism, poverty, and being unmarried (Berger 2001; Brosco, 1999). The fact that not
all groups have experienced the same rate of decline in infant mortality rates also
suggests a disparity with regards to the social and medical advances that have
improved the rates of infant mortality overall (Berger, 2001; Brosco, 1999).
Additional factors that need to be considered with regards to disparities in infant birth
outcomes are related to differences in maternal preconception health, maternal rates
of infection, access to quality health care and stress (Berger, 2001; Brosco, 1999).
Specifically, groups such as Black, American Indian and Puerto Rican women are
more likely to have sociodemographic and behavioral risk factors, such as being a
smoker, having lower education levels, starting prenatal care late, and having a fourth
or higher birth order (MacDorman & Matthews, 2009a).
Independent Variables
Neighborhood Poverty
To begin a review of the independent variables included in the study, research
on neighborhood poverty was examined, as the main independent variable of interest.
The U.S. Census Bureau uses a set of dollar thresholds and family size to determine
who is in poverty. If a family’s total income is less than the threshold, then the entire
family and the individual members of the family are considered to be in poverty. For
16
example, in 2007 the threshold was $21,834 for a family consisting of 2 adults and 2
children, (U.S. Census Bureau, 2007).
In a report from 2007, the District of Columbia has rates of poverty that are
higher than the national average poverty rate (17.2% compared to 13.2%), and it is
the 5th highest poverty rate in the United States, next to Mississippi, Arkansas,
Kentucky, and Louisiana (Office of Planning, D.C., 2009). Additionally, the rates of
poverty in DC vary by race and ward. In 2008, 23.6 percent of Blacks had incomes
below the poverty level, compared with 8.1% of Whites, and 12.8% of Asians. For
comparison, in 2008, 15.4 percent of all households in DC had incomes below the
poverty level. Among family households, married-couple families were less likely to
be in poverty than other families. Also, among other family households female
households with no male present were more likely to be in poverty than male
households with no female present (26.9% compared to 10.1%). Thus, poverty in
general and neighborhood level poverty in particular for Washington DC are integral
to the study of health disparities and inequities, such as infant mortality.
A California study examined the relationship between neighborhood
characteristics and low birth weight by ethnicity and socioeconomic status (Pearl,
Braveman & Abrams, 2001). The study included Asian, foreign-born Latina, U.S.
born Latina, Black, and White women. The authors hypothesized that the magnitude
of the association between neighborhood socioeconomic factors and birth weight
would vary by ethnicity. The study included information on the rates of Medicaid
coverage, income and education for the participants. The data were retrieved from 18
public and private hospitals in California, and subjects were randomly selected by
17
geographic region, proportion of deliveries to Black women, and the prevalence of
private health insurance. Birth certificate data were obtained on all deliveries
occurring at the hospitals during the interview phase of the study from August 1994
to July 1995. The researchers were able to geocode and link 94.3% (n = 23,922) of
the cases to census tract and block group areas. Overall, they found that increasing
neighborhood poverty and unemployment were associated with decreasing birth
weight. When the results were stratified by ethnicity and birthplace, neighborhood
socioeconomic characteristics such as the percentage of residents who were poor or
unemployed were related to decreasing birth weight.
Of significant interest is that among Black women in the subsample with a full
range of data, adjustment for income, education, age, timely prenatal care, fair or poor
pre- pregnancy health, having a supportive person, living in an unsafe neighborhood,
parity, and smoking did not affect the negative association between unemployment
levels and birth weight (Pearl et al., 2001). Foreign-born Latinas living in
neighborhoods with the highest rates of poverty and unemployment were associated
with higher mean birth weight and lower risk of low birth weight .Interestingly, in all
of the ethnic groups, neighborhood-level results were largely unaffected by inclusion
of individual level socioeconomic measures, and vice versa. The authors concluded
that most likely community and individual pathways link socioeconomic conditions
to birth outcomes. Additionally, living in neighborhoods with high levels of
unemployment or poverty, which are proxies for individual resources and assets, can
result in lower birth weight infants for Black and Asian women.
18
Many Black women live in urban neighborhoods with very high rates of
poverty that are clustered or concentrated in a certain geographic area. Additionally,
these neighborhoods have high rates of violent crime which can directly or indirectly
influence low birth weight (Collins, et al., 2009a). Neighborhood-level characteristics
capture a dimension of socioeconomic conditions that may not be captured by
individual-level measures, such as income or education (Pearl et al., 2001).
Neighborhood poverty is also associated often with an increased rate of inadequate
prenatal care utilization among urban Black and White women (Pearl et al.).
In a study on neighborhood poverty and low birth weight using data from
Chicago, researchers found that 78% of Black women had a life-long residence in
low-income neighborhoods, and that Blacks had a greater percentage of women who
experienced downward financial mobility as compared to upward financial mobility
as measured by place of residence at time of birth and at time of pregnancy (Collins et
al., 2009a). Upward financial mobility is defined as growing up in a low-income
neighborhood and moving to a high-income neighborhood, and downward mobility is
defined as growing up in a high-income neighborhood and moving to a low-income
neighborhood.
With regards to the birth outcomes experienced, Black women with a lifelong
residence in low-income neighborhoods had an infant low birth weight rate of 17.1%
compared to 11.7% for Black women with a lifelong residence in high-income
neighborhoods. Also, Black women less than 20 years of age and with a low-income
had a lower low birth weight rate than women ages 20-35 years of age (13.6% vs.
18.1%). The authors report that the population attributable rate of low birth weight for
19
maternal lifelong exposure to low-income as compared to lifelong exposure to high
income was 23.6% for Blacks, showing a relationship to the almost one-fourth of low
birth weights experienced by Blacks and the direct relationship to poverty. Finally,
the authors conclude that increasing the prevalence of Black mothers with a lifetime
residence in high-income neighborhoods could reduce the number of low birth weight
infants in future generations. The results of the Collins et al. (2009a) study suggest
that exposure to life in low income neighborhoods has a direct relationship to low
birth weight for Blacks due to the constant stressors of poverty. Collins et al. (2009a)
focuses on low birth weight, and sets the foundation for establishing a causal link for
infant mortality as a precursor.
In another study conducted by researchers using data from Missouri’s birth
certificate database for 1989-1997, a multilevel logistic regression analysis was
conducted to estimate the effects of county-level poverty on preterm birth risk
(DeFranco, Lian, Muglia, & Schootman, 2008). The authors included individual level
measures such as maternal age, maternal race, residence within city limits, birth
sequence, indicators of low-income, and maternal health-related behaviors, such as
smoking. Additionally, they included maternal education and socioeconomic status as
dichotomous variables. They defined area level measures such as the poverty level
into quartiles using the federal poverty line at the county level of the mother’s
reported residence as a measure of socioeconomic position. The study population
consisted of 634,994 live births to mothers who resided in 115 counties in Missouri.
Women who resided in counties with higher rates of poverty were significantly
younger and more likely to be Black, less likely to graduate from high school, be
20
unmarried, and low income. The authors found a relationship between preterm birth
and county-level poverty. Specifically, the rate of preterm birth increased with a
higher county poverty rate. The risk increase resulted in women in counties with the
highest poverty rate being 1.30 times more likely to deliver preterm. Additionally, the
effect was similar when stratification was performed on the study population by race.
Both Black and White mothers living in counties with the highest rates of poverty had
an increased risk of preterm birth.
Collins et al. (2009a) examined neighborhood level poverty and found in their
regression model that even after controlling for maternal age, education, prenatal
care usage, and parity of women with a lifelong residence in high-income
neighborhoods, the adjusted relative risk of infant low birth weight for Blacks
compared to Whites was 1.9 (1.3-2.6). Thus, even when maternal factors are
controlled for; the relative risk of low birth weight for Blacks is still twice as high as
it is for Whites (Collins, David, Rankin, & Desireddi, 2009c). The work that Collins
et al. (2009a) conducted provided a foundation for the current study and research
questions. Neighborhood level poverty appears to be an important indicator in the
relationship of variables such as race, maternal age, education, prenatal care usage,
and parity of women to infant mortality. Intrinsically related to neighborhood level
data and the study of infant mortality is the acknowledgement that health outcomes
are related to a person’s physical, social, and cultural environment, a measure of their
disadvantage score.
In work done by Raux (2001a) on the relationship of area effects such as
neighborhood on health, the author states that neighborhood differences are becoming
21
increasingly relevant in the context of poverty and geographic clustering of poverty
along with other forms of disadvantage. Further, in a study on neighborhood
disadvantage and birth outcomes, the author found that living in a neighborhood that
was more affluent than expected (based on individual factors of the mother such as
educational attainment) reduced the risk of low birth weight and preterm birth among
Black women living in predominately Black neighborhoods (Pickett, Collins, Masi &
Wilkinson, 2005). Additionally, the authors found that for Black women living in
racially mixed neighborhoods there was no protective benefit for the reduction of low
birth weight (Pickett et al.). The next section of the literature review examines
important mediators of the relationship of infant mortality and contexutal factors such
as poverty, birthweight, preterm birth and prenatal care. Thus although low birth
weight is an important precursor to infant mortality, for the purposes of this study it
serves as a mediator.
Mediators
Birth Outcomes: Low Birth Weight
In the United States, nearly two-thirds of low birth weight infants and nearly
all very low birth weight infants are born preterm (Schempf, Branum, Lukacs, &
Schoendforf, 2007). Low birth weight continues to be the strongest predictor of infant
mortality, followed by preterm birth (Berger, 2001). In 2000, 65% of all infant deaths
were related to being born low birth weight (Berger). Previous research has stated
that infants who are born low birth weight are 40 times more likely to die in the first
month of their life, and those that do survive are twice as likely to suffer more
multiple complications (Berger). In 2000, a study reported that 49% of low birth

22
weight infants have a greater chance of growing up with neurological and
developmental disabilities (Berger). This percentage represents almost half of the
infants that are born low birth weight, and these statistics have great health, and social
implications for the parents of the infant and society. More specifically, 5 to 9% of
the low birth weight infants experience cerebral palsy, and 19% of low birth weight
infants have cognitive disabilities (Berger). Additionally, low birth weight is the
primary reason that underlies the racial disparity in infant mortality rates.
Specifically, as the proportion of Blacks relative to the total population increases,
Black individuals experience higher odds of low birth weight (Walton, 2009.) Blacks
continue to have higher proportions for preterm and LBW births, compared with
either whites or Hispanics. At the same time, blacks experience lower risks of
neonatal mortality for preterm and LBW infants, while having higher risks of
mortality among term, post term, normal birth weight, and macrosomic births
(Alexander et al., 2003). Low birth weight may be caused by preterm delivery,
intrauterine growth restriction, or a combination of the two (Berger). Research has
established that risk factors for preterm birth are similar to those of low birth weight.
Birth Outcomes: Preterm Birth
Preterm birth is a leading cause of infant morbidity and is associated with
many familial, social, and economic costs (Schempf et al., 2007). Infants born
preterm are more likely to experience infant mortality than infants born to term
(Schempf et al.). When an infant is born preterm, (defined as 36 weeks or earlier), if it
survives, it is predisposed to many health conditions over the course of its life, such
as a lower intelligence quotient and chronic health problems. Additionally, infants
23
who are born to term have a better chance of being born at a higher birth weight,
which is a protective factor against infant mortality. Preterm delivery contributes
greatly to the excess mortality rate among Black infants (Rowland-Hogue & Douglas,
2005). Whereas 20 years ago, black infants who were born preterm or of low birth
weight were more likely to survive than White infants of the same gestational age or
birth weight; in 2001 Black infants were less likely to survive than White infants,
regardless of gestational age or birth weight category (Rowland-Hogue & Douglas).
Specifically, 75% of all excess deaths of Black infants were those infants who
weighed less than 1,500 grams, or who were born at less than 32 weeks (Rowland-
Hogue & Douglas). In 2005, the percentage of infants born preterm (<37 weeks of
gestation) was significantly higher for non-Hispanic Black (18.4%), Puerto Rican
(14.3%) and American Indian women (14.1%) than non-Hispanic White women
(11.7%) (MacDorman & Matthews, 2009a).
The preterm-related infant mortality rate for Black women in 2005 was higher
than the total infant mortality rate for White, Mexican, Central and South American,
and Asian-Pacific Islander women combined (MacDorman & Matthews, 2009a). In
2005, 0.8% of births occurred at less than 28 weeks gestation, but accounted for
nearly half (46.4%) of infant deaths. In general, the risk of infant death is decreased
as gestational age increases. Interestingly, infants born in the late preterm period (34-
36 weeks of gestation) have higher rates of infant mortality as well, experiencing
infant death at three times the rate for full-term infants (MacDorman & Matthews).
Even infants born early during the medically accepted term period of (37-39) weeks
of gestation still have mortality rates that are 30.0% higher than infants born at 40-41
24
weeks (MacDorman & Matthews). Additionally, infants born to mothers who were
not married had increased rates of preterm birth, regardless of race/ethnicity (Masi,
Hawkley, Piotrowski & Pickett, 2007). These data suggest that preterm birth is a
complex maternal and child health issue and further research is warranted. The risk
factors for preterm birth and low birth weight include lower socioeconomic status (as
defined by occupation, income, or educational attainment), prenatal care, Black race,
multiple pregnancies, extremes of ages, and illicit drug use (Masi et al.).
Controls
Maternal Age and the Weathering Hypothesis
In work by Geronimus (1996) it was found that due to worsening health
profiles, Black women may experience a larger negative effect of advancing maternal
age on infant health than White women. This deterioration in reproductive health
status over the childbearing years among Black women has been coined as
“weathering” (Jackson, 2007). The weathering hypothesis conceptualizes the
cumulative impact of repeated exposure to social or economic adversity and political
marginalization on female reproductive outcomes. Physiologically, persistent and
high-intensity coping with acute and chronic stressors can have a profound effect on
health (Geronimus, Hicken, Keene & Bound, 2006). Neighborhood poverty also
drives the weathering hypothesis among urban Black women and contributes to the
racial disparity in infant birth weight (Collins et al., 2009a). In a recent study, the
authors found that the weathering pattern of maternal age and infant birth weight was
specific to Black women with a lifelong residence in low-income urban
neighborhoods. Interestingly, the infant low birth weight rates did not increase with
25
maternal age among Black women with a life-long residence in high income
neighborhoods (Collins et al.). Finally, Black women in their early thirties with
lifelong residence in high-income neighborhoods had an infant low birth weight rate
half that of Black women in their early thirties with a lifelong residence in low-
income neighborhoods (Collins et al.). The same is true for White women with a
lifelong residence in high-income neighborhoods when compared to White women in
low-income neighborhoods. Thus, the weathering hypothesis is useful in informing
the selection of the variables for this study.
Maternal Education
In previous work by Kleinman and Kessel (1987) on risk factors for adverse
birth outcomes, the authors found that Black women with low levels of education
were 59% more likely to have babies with moderately low birth weights, but the level
of education did not make a significant difference with regard to the birth of infants
with very low birth weights (Kleinman & Kessel,1987; Singh & Kogan, 2007)
conducted research on the relationship of maternal education to infant mortality in the
United States between 1969 and 2001. The authors found that educational inequalities
in total infant mortality were driven largely by educational gradients in mortality
among normal birth weight infants. Additionally, Singh and Kogan (2007) posit that
the effect of maternal education on infant mortality may reflect an increasingly
important role of social and environmental influences on infant mortality risks in the
United States. Finally, they noted that disparities in infant mortality by maternal
education were also greater for whites than for Blacks, Hispanics, and Asian/Pacific
Islanders (Singh & Kogan).
26
Marital Status
Research on marital status and its relationship to birth outcomes has shown
that Black and White unmarried women had a substantially higher risk of having
infants with very low or moderately low birth weights (Kleinman & Kessel, 1987;
Young & Declerq, 2009). Specifically, among Whites there was a higher risk for very
low birth weight than for moderately low birth weight (Kleinman & Kessel, 1987).
With regards to Blacks, the excess risks were the same for both categories of birth
weight. The authors conclude that marital status is more likely a surrogate or marker
for a myriad of other factors that are more causally related to pregnancy outcomes
and thus public health interventions (Kleinman & Kessel; Young & Declerq, 2009).
Prenatal Care
Mothers of low birth weight infants (as compared with non-low birth weight
infants) were less likely to have attended college and to have adequately utilized
prenatal care (Collins, et al., 2009a). Prenatal care is often used as a feasible, reliable
route for locating and managing the medical, sociodemographic, and behavioral risk
factors that may increase the risk of a woman having a poor pregnancy outcome
(Taylor, Alexander, & Hepworth, 2005; Johnson, Khoratzy, Hatcher, Wingrove,
Milligan, Harris, Richards, 2003). Amongst the public health and medical community
there is a widespread belief and effort that women need to have prenatal care at the
earliest point possible in their pregnancy. Unfortunately, for many women prenatal
care is not received prior to delivery. In the United States, there are approximately 1.5
to 2% of women (70,000) who do not receive any care at all prior to delivery. A
complete lack of prenatal care is a problem in the maternal and child health arena
27
because it deprives the medical provider from screening and treating the women for
conditions that are manageable with care, especially among women with little or no
prior medical care. There are many reasons that women do not access prenatal care
during their pregnancy, such as a lack of availability in their area, financial barriers to
care, cultural attitudes and beliefs about care, and not understanding the importance
of receiving care.
A recent study analyzed the types of women that do not receive prenatal care
at all, to determine if there were any characteristics among them that were similar, or
whether or not the reasons that women were not receiving care were different and
varied (Taylor, Alexander, & Hepworth, 2005). The authors also wanted to establish a
risk profile for the type of women who do not access prenatal care, and compare the
birth outcomes of these women, with women who received any kind of prenatal care.
The authors used data from White, Black, and Hispanic women in the United States,
using a linked birth-death file from the National Center for Health Statistics, 1995-
1997 data. The total sample size was 126,220 records, and no care at all was defined
as having a zero entered for the number of prenatal care visits, or having a zero or
blank entry for the month care began.
Using a cluster analysis tool, the women were clustered based on: age, race,
marital status, education, parity, nativity/birthplace, urban/suburban/rural residence,
tobacco use, alcohol use, hypertension, and diabetes. The results of the study found
six distinct no-care clusters: Cluster 1: Members of this cluster were more likely to be
married (65%), White (69%) and reported the highest proportion of diabetes (Taylor
et al.). Cluster 2: Almost half of this cluster was married, lived in suburbs, had low
28
medical and behavioral risks and was foreign-born Hispanic (89%). Cluster 3: Most
of the group (91%) was foreign-born Hispanics, almost 50% were married, had
completed elementary school, lived in the suburbs, and reported low medical and
behavioral risk. Cluster 4: Members of this group were the least likely to be
primaparous (14%), have extremely high behavioral risks (32% of the group smoked,
and almost 10% drank alcohol), and were the least likely to be married (78%).
Additionally, most members of Cluster 4 were young Black women with low
education, and high risk factors. Cluster 5: Members of this cluster were less likely to
be married, more likely to be White (46%) and they reported having more than a high
school education (12.8 years on average). Finally, Cluster 6: Members of this cluster
were young, (< than 20 years old), Hispanic (51%); not married, had low education
(8.7 years on average), live in an urban dwelling, and had the 2nd highest rates of
smoking (17.8%).
Overall, the birth outcomes for the no-care group were two to four times
worse for every measure of birth outcomes (low birth weight, preterm birth, and
gestational age) when compared to the entire population (Taylor et al., 2005). For
example, the rate of low-birth weight in the total population was 6.07%, whereas in
the total no-care group, it was 20.84% the highest rates of low birth weight, at
24.59% were seen in Cluster 4 (urban, young, Black, not married, low education, and
high risk factors). The rates of infant mortality in the total no-care group were almost
5 times greater than the total population. Cluster 4 (urban, young, Black, low
education and high risk factors) had the highest odds ratio for nearly every adverse
birth outcome. Conversely, the best outcomes were for Cluster 6 (young, foreign-born
29
Hispanics with lower risk factor levels). With regards to Hispanic outcomes, the
Hispanic paradox suggests that although some Hispanic women have low income and
education, they have certain protective factors that moderate the normal relationship
of low income and education on birth outcomes, such as better diets, higher rates of
marriage, and strong family and cultural ties. Although the study has limitations
usually seen with large data sets such as restricted maternal risk factors based on vital
records, the results add to the body of literature on prenatal care, and identify women
who should be targeted with regards to interventions and programs to improve their
birth outcomes.
Research Questions and Hypotheses
This research is based on, and the results are expected to add to our
understanding of the social determinants of health theory. The social determinants of
health theory state that women are a part of many environments that shape their
health and the adverse birth outcomes they experience, including infant mortality.
Examples of these environments include their family environment (marital status,
family income) and their economic environment (percent of poverty in ward).
Additionally, as race/ethnicity is the central theme of this research, the relationship of
maternal race/ethnicity to infant mortality with regard to the various environments
(family, economic) of women is examined. The main area-level measure examined is
the level of disadvantage in each ward.
The research questions that are tested and use the linked-birth death data are:
1. Do women experience different rates of infant mortality by race/ethnicity?

30
a. Hypothesis 1a: Rates of infant mortality will differ by race/ethnicity
and by maternal factors such as maternal education, marital status, and
maternal age.
b. Hypothesis 1b: Controlling for maternal education, maternal age, and
marital status, women will experience different rates of infant
mortality by race.
2. Do women living in areas of high disadvantage experience higher rates of
infant mortality than women living in areas of low disadvantage?
a. Hypothesis 2a: A woman in a place of high disadvantage as compared
to a place of low disadvantage will have an increased risk of infant
mortality.
b. Hypothesis 2b: A woman in a place of high disadvantage will have an
increased risk of infant mortality after controlling for marital status,
maternal education, and maternal age.
3. Does the effect of race/ethnicity on infant mortality differ if the mother lives
in a place of high disadvantage versus low disadvantage?
a. Hypothesis 3a: The effect of race/ethnicity will differ with regard to
infant mortality if the mother lives in an area of high disadvantage as
compared to an area with lower rates of disadvantage.
b. Hypothesis 3b: Controlling for maternal education, marital status, and
maternal age, the effect of race/ethnicity will differ in areas of high
disadvantage versus low disadvantage.

31
4. Will having a preterm birth or a child of low birth weight increase infant
mortality?
a. Hypothesis 4a: The effect of race/ethnicity on infant mortality will
be mediated by having an infant who is preterm or low birth weight.
b. Hypothesis 4b: The effect of race/ethnicity on infant mortality will
be mediated by having an infant who is preterm or low birth weight.
Additionally, the effect of race/ethnicity on infant mortality will differ
by the amount of prenatal care a woman received.
32
Chapter 3: Methodology
Sample
Deaths among infants born in the District of Columbia were identified through
District of Columbia death records from 2001-2007 and were linked to birth records
in those years. Only infants born to DC residents were included. The birth sample
included a total of 56,000 births and 659 deaths. Fifty-two death records that were
unable to be linked to birth records were excluded, thus reducing the infant death
sample size to 607. The 52 deaths that were excluded were randomly distributed
across year and were predominately Black. In addition, infants born to non-residents
(n = 62) were removed. This reduced the sample to 55,938 births and 607 deaths.
There was also information missing on individual variables for some cases.
These missing cases did not affect the results for the analysis. The number of missing
cases for each birth certificate variable utilized in the study is as follows:
• Maternal Race: 0
• Birth weight: 0
• Marital status: 1
• Preterm Birth: 50 (<1% of cases)
• Maternal Age: 71 (<1% of cases)
• Maternal Education: 4,436 (8% of cases)
• 6,929 Adequacy of Prenatal Care: 6,929 (12.4% of cases)
33
Procedure
Linked Birth/Death Data Set
The purpose of linking the birth and death certificates together is to use
variables listed on the birth certificate to allow for a detailed analysis of infant
mortality (Johnson-Clarke, 2009). For example, the linkage provides the birth weight
of the infant that died; unlinked files either identify the birth weight but not whether
the infant died or the reverse – an infant death without information about birth
weight. An additional benefit of using the linked birth/death data set is that the race
and ethnicity of the infant is provided by the mother at the time of delivery and is
considered to be more accurate than the race and ethnicity information that is
collected at the time of the infant’s death by an informant or observation
(MacDorman & Matthews, 2008).
In the dataset utilized for the study, there were some cases with missing data.
For the study period of 2001-2007, there were a total of 659 total infant deaths in DC.
I was able to successfully link 607 of the infant deaths to their corresponding birth
certificate. There were 52 cases of infant deaths with missing birth certificate data,
representing 7.9% of the total infant deaths during that period. These cases were
missing birth certificate data for a myriad of reasons including: incorrectly recorded
birth dates or duplicate certificate numbers. They may also have been born in the
preceding year to that of death. The infant mortality rate for DC for the study period
prior to excluding those deaths with missing data was 11.8 infant deaths per 1000 live
births; after removing the deaths with missing data the rate becomes 10.8 infant
34
deaths per 1,000 live births . All linked birth/death data were analyzed using SAS.
9.3. The research proposal was submitted to the University of Maryland Human
Subjects Review Board. The IRB application was approved and appears in Appendix
A.
Neighborhood Level Data
The latest data available from the 2000 Census and DC Office of Planning
were summarized using a correlation analysis to determine a neighborhood
disadvantage index. Specifically, the variables by ward of residence of the mother
included:
• percent of Blacks
• median household income
• percent of vacant housing units in a Ward
• percent of renter occupied housing units
• percent of unemployed people
• percent of people who are currently married.
• percent of residents who are unemployed
• percent of female-headed households
Neighborhood disadvantage index was defined as either low or high levels. To
determine the cut-off for neighborhood disadvantage with regards to high versus low
levels, a factor analysis was conducted. The factor analysis was used to determine
which variables were highly correlated to each other. A standardized factor score
(with a mean of 0) was assigned to each individual. Those with a factor score above
1 were considered disadvantaged and those with a score below 1 were considered

35
advantaged. Factor analysis is a collection of methods used to examine how
underlying constructs influence the responses on a number of measured variables
(DeCoster, 1998). Measures that are highly correlated (either positively or negatively)
are likely influenced by the same factors, while those that are relatively uncorrelated
are likely influenced by different factors (DeCoster, 1998). Variables such as percent
of people in a ward that were never married, and the average family size were
originally considered for inclusion but were not found to be highly correlated and
were not included. See Appendix E for the factor analysis utilized in the study.
Data utilized are derived from the official District of Columbia Vital
Registration System. Data for Washington DC were collected using the 1989 revision
of the U.S. Standard Birth Certificate (Appendix B) and the 2003 revision of the U.S.
Standard Death Certificate (Appendix C). Data for the neighborhood disadvantage
index were derived from the 2000 Census and the DC Office of Planning.
Definition of Variables
The following definitions of the variables were used. See Appendix D and
Table 3 for a further explanation of the variables utilized in the study.
Dependent Variable
Infant Mortality
The dependent variable was defined as the infant mortality rate (imr) in the
description of infant mortality by categories of mothers (e.g., Blacks) or, in the
regression analysis, whether the child died. Standard definitions were used with the
infant mortality rate equal to the number of infant deaths (in a particular category)
36
divided by the number of live births (in the same particular category) times 1000 to
yield a rate expressed in standard units.
Independent Variables
Individual Level Variables Maternal Race
Maternal race was categorized as reported on the birth certificate. Specifically,
the birth certificate records the following races: White, Black, Indian, Chinese,
Japanese, Hawaiian, Filipino, other Asian, other races, and unknown. Additionally,
the birth certificate collects information on the Hispanic origin of the mother, which
lists the following options: Mexican, Puerto Rican, or other Hispanic/Latina origin.
For the purposes of analysis, non-Hispanic White, non-Hispanic Black, and Hispanic
(White or Black) were analyzed as the main variables of interest. All of the other
races were grouped as non-Hispanic “other”. For the purposes of analysis, the original
variables of race were re-coded as dummy variables.
Community Level Variables
Neighborhood Disadvantage
For the purposes of the study, neighborhood disadvantage index as previously
described is defined at the ward level. Ward level data were chosen as the unit of
analysis because it represents distinct traditional geo-political communities with the
necessary data aggregated at the community level to be considered as a
neighborhood. As previously described, a factor-based disadvantage index consisted
of 8 census-based indicators:
1. the percent of Blacks in a ward,

37
2. the percent of residents unemployed,
3. the percent of residents who are married,
4. the percent of vacant housing units,
5. the percent of renter occupied housing units,
6. the median household income,
7. the percent of families in poverty,
8. and the percent of female headed households
The data utilized in the disadvantage index were derived from the 2000 census data,
which is the latest available. The factor scores (correlations of indicators with the
index) ranged from - 0.59 to 1.47, with a higher score representing higher
disadvantage at the ward level.
Mediators of Infant Mortality
Low Birth Weight
Low birth weight was defined dichotomously to reflect either low birth weight
(<2500 grams), or normal birth weight (2500 grams or more).
Preterm Birth
Preterm birth was defined dichotomously as no preterm birth (>36 weeks) or
preterm birth (<36 weeks) for logistic regression.
38
Controls
Marital Status
Marital status was defined dichotomously as married or single. Infants born to single
mothers have more adverse outcomes than infants born to married mothers across
races (Alio et al., 2009).
Maternal Education
Maternal education was defined as less than high school, high school, some
college or college degree. Maternal education was dummy coded into separate
categories for the logistic regression.
Maternal Age
The review of research showed evidence that infants of teen (<20) and older
mothers (<35) have a higher risk of mortality before the age of 1. Additionally,
women experience weathering as a result of the cumulative effects of stress and/or
racism. To estimate accurately the differences in birth outcomes as experienced by
Black and White women, maternal age was defined as: teen (<20 years), early
twenties (20-24), late twenties (25-29), early thirties (30-34), and 35 and over. These
categories were dummy coded for inclusion in the logistic regression.
Prenatal care
The Kessner Index algorithm requires that to be rated Adequate, prenatal care must
begin in the first trimester; to be rated Intermediate, care must begin in the second
trimester; and to be rated Inadequate, care must begin in the third trimester or not at

39
all. The additional factor in the Kessner Index is the number of prenatal care visits
(Kotelchuck, 1994).
Modeling
• Dependent Variable - infant mortality
• Independent Variables - maternal race and level of advantage or disadvantage
at the ward level
• Control variables - marital status, maternal age, and maternal education.
• Mediators - Preterm birth, low birth weight, prenatal care
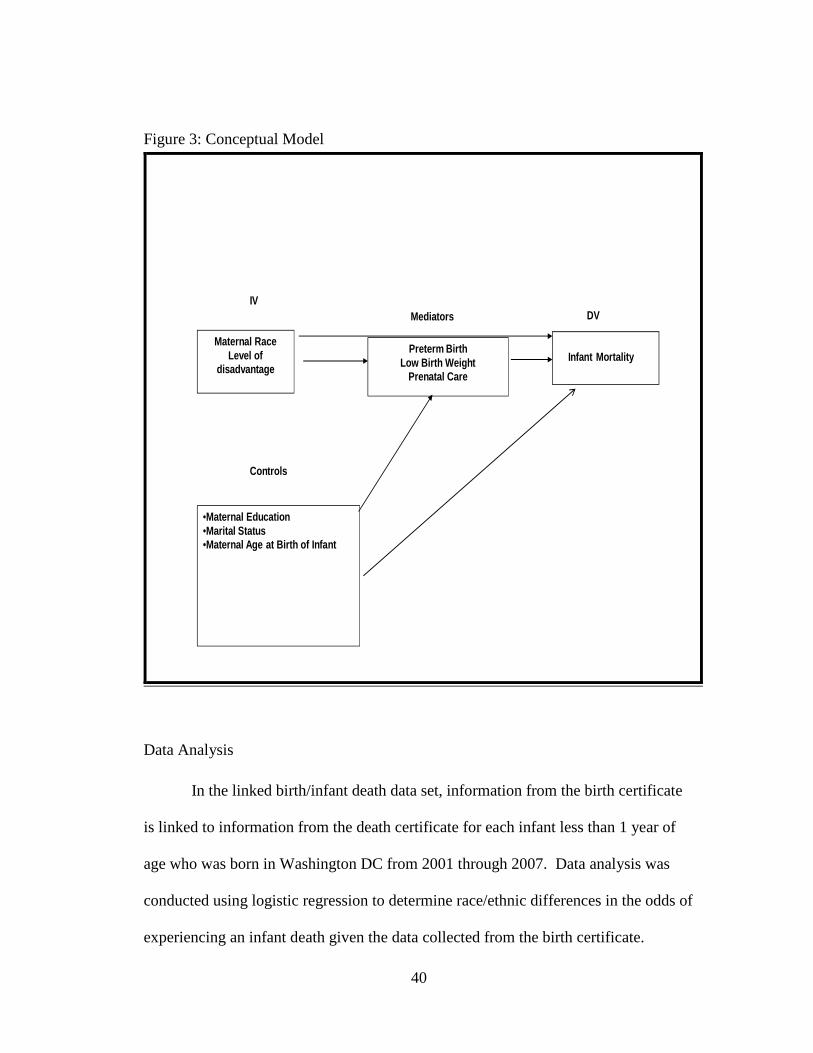
40
Figure 3: Conceptual Model
Maternal RaceLevel of
disadvantage
Preterm BirthLow Birth Weight
Prenatal Care
•Maternal Education•Marital Status •Maternal Age at Birth of Infant
Infant Mortality
IV
Controls
DVMediators
Data Analysis
In the linked birth/infant death data set, information from the birth certificate
is linked to information from the death certificate for each infant less than 1 year of
age who was born in Washington DC from 2001 through 2007. Data analysis was
conducted using logistic regression to determine race/ethnic differences in the odds of
experiencing an infant death given the data collected from the birth certificate.
41
Logistic regression was chosen because it allows for an analysis of categorical
variables as a dependent variable. Additionally, for variables that reflect an increased
odds ratio (over 1.00) the odds ratio demonstrates that the likelihood or probability of
experiencing an infant death is greatly increased for the variable of interest. The
effects of variables such as maternal education, marital status, prenatal care, and
whether a family lived in a disadvantaged ward on infant mortality were examined as
independent variables as well as controls. For example, if the majority of Black
mothers were age <20 yrs old and the White mothers were 25-29 years of age the
disparity might be more likely due to age than race. The analysis plan included both
individual and neighborhood level risk factors for infant mortality. Examining only
individual level risk might overlook the pivotal role that neighborhood level
disadvantage plays in influencing poor birth outcomes such as infant mortality, other
factors being equal.
Models included the following independent variables: maternal race, maternal
age, maternal education, marital status, and level of disadvantage at the
ward/neighborhood level. Adjusted odds ratios were estimated with 95% confidence
intervals to determine the magnitude of the relationship of infant mortality to each of
the independent variables, that is, whether it was more like that a black infant was
more or less likely to die before reaching their first birthday than a white infant. A
factor-based disadvantage index as previously described that consisted of 8 census-
based was used to construct the index. The factor score (correlations of indicators
with the index) ranged from - 0.59 to 1.47. Individuals were given scores on these
items based upon the ward they lived in. A principle components factor analysis was
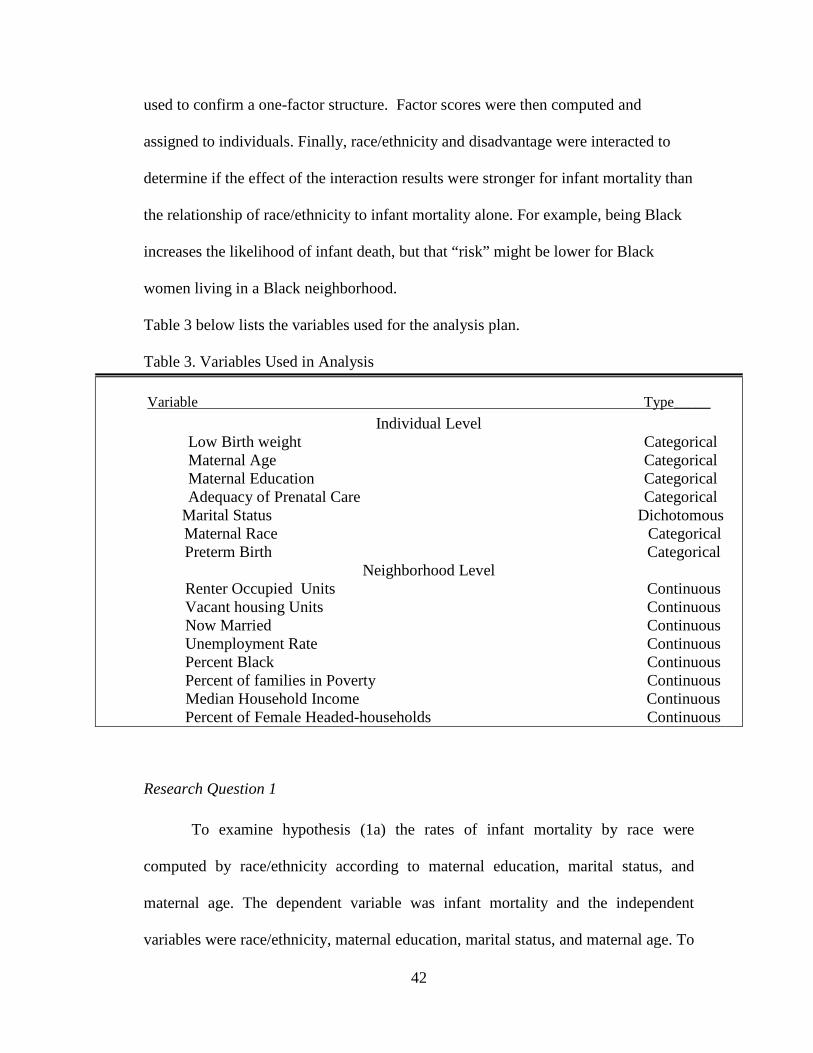
42
used to confirm a one-factor structure. Factor scores were then computed and
assigned to individuals. Finally, race/ethnicity and disadvantage were interacted to
determine if the effect of the interaction results were stronger for infant mortality than
the relationship of race/ethnicity to infant mortality alone. For example, being Black
increases the likelihood of infant death, but that “risk” might be lower for Black
women living in a Black neighborhood.
Table 3 below lists the variables used for the analysis plan.
Table 3. Variables Used in Analysis
Research Question 1
To examine hypothesis (1a) the rates of infant mortality by race were
computed by race/ethnicity according to maternal education, marital status, and
maternal age. The dependent variable was infant mortality and the independent
variables were race/ethnicity, maternal education, marital status, and maternal age. To
Variable Type_____
Individual Level Low Birth weight Categorical Maternal Age Categorical Maternal Education Categorical Adequacy of Prenatal Care Categorical
Marital Status Dichotomous Maternal Race Categorical Preterm Birth Categorical
Neighborhood Level Renter Occupied Units Continuous Vacant housing Units Continuous Now Married Continuous Unemployment Rate Continuous Percent Black Continuous Percent of families in Poverty Continuous Median Household Income Continuous Percent of Female Headed-households Continuous
43
examine the second hypothesis (1b) logistic regression was run. The dependent
variable was infant mortality, the independent variable was race/ethnicity, and the
control variables were maternal education, marital status, and maternal age.
Research Question 2
To test the first hypothesis (2a) whether or not women living in areas of high
disadvantage experience higher rates of infant mortality than women living in areas of
lower disadvantage, a regression in which the dependent variable is the infant
mortality rate and the independent variable is the neighborhood disadvantage index.
To test the second hypothesis (2b) a regression is performed in which the dependent
variable is the infant mortality rate, the independent variable is the neighborhood
disadvantage index, and the control variables are maternal age, marital status, and
maternal education.
Research Question 3
The first hypothesis, (3a) tests whether or not the effect of race/ethnicity will
differ with regard to infant mortality if the mother lives in an area of high
disadvantage as compared to an area with lower rates of disadvantage. The dependent
variable is the infant mortality rate, and the independent variable is race/ethnicity.
Next, a model including an interaction between the neighborhood disadvantage index
and race/ethnicity is run to examine the effect including the effect of the interaction.
If the coefficient for the interaction is significant this indicates that the effect of
race/ethnicity on infant mortality differs by the disadvantage level of the
neighborhood. Models of disadvantage, infant mortality and race/ethnicity with and
44
without the inclusion of the control variables of maternal education, maternal age, and
marital status were run to test hypothesis (3b).
Research Question 4
Hypothesis (4a) was used to test for mediation. To test for mediation, three
models were run. Specifically, infant mortality is regressed on race/ethnicity and the
percent of disadvantage in the neighborhood. Second the mediators, preterm birth,
low birth weight, and prenatal care are regressed on race/ethnicity and level of
advantage or disadvantage in the community. Finally, infant mortality is regressed on
both independent variables of race/ethnicity and percent of disadvantage in a
community and on the mediators, low birth weight, preterm birth, and prenatal care.
If the association between race/ethnicity and infant mortality declines when low birth
weight, preterm birth, and prenatal care are included then this finding will
demonstrate that low birth weight and preterm birth are in fact mediators. Hypothesis
(4b) is tested similarly as hypothesis (4a), but a regression between race/ethnicity,
disadvantage, and between the mediators of low birth weight, preterm birth, and
prenatal care are added to see whether or not the extent of mediation differs from that
in hypothesis (4a).
45
Chapter 4: Results
The primary null hypothesis driving this study is: neighborhood level
disadvantage has no effect on the race/ethnicity specific infant mortality rate for
infants born to resident mothers controlling for known factors related to infant
mortality. This study seeks to determine if there is a possible protective effect or
conversely a harmful effect associated with the neighborhood conditions in which the
mother lives. This chapter first presents descriptive statistics for the infant births and
deaths in the sample and the variables included in the analysis. Next, results of the
logistic regression for each of the four research questions and their corresponding
significance levels for the results of the individual level and ward-level variables are
presented. Finally, odds ratios are presented estimating the likelihood of
“neighborhood disadvantage” on Black and Hispanic infant mortality rates as
compared to Whites. Additionally, using contextual factors such as the median
household income and percent of residents unemployed, an index of neighborhood
level disadvantage was created and its influence on infant mortality examined. The
estimated odds ratios and their corresponding significance levels for the results of the
individual level and ward-level variables are shown in the tables for each research
question.
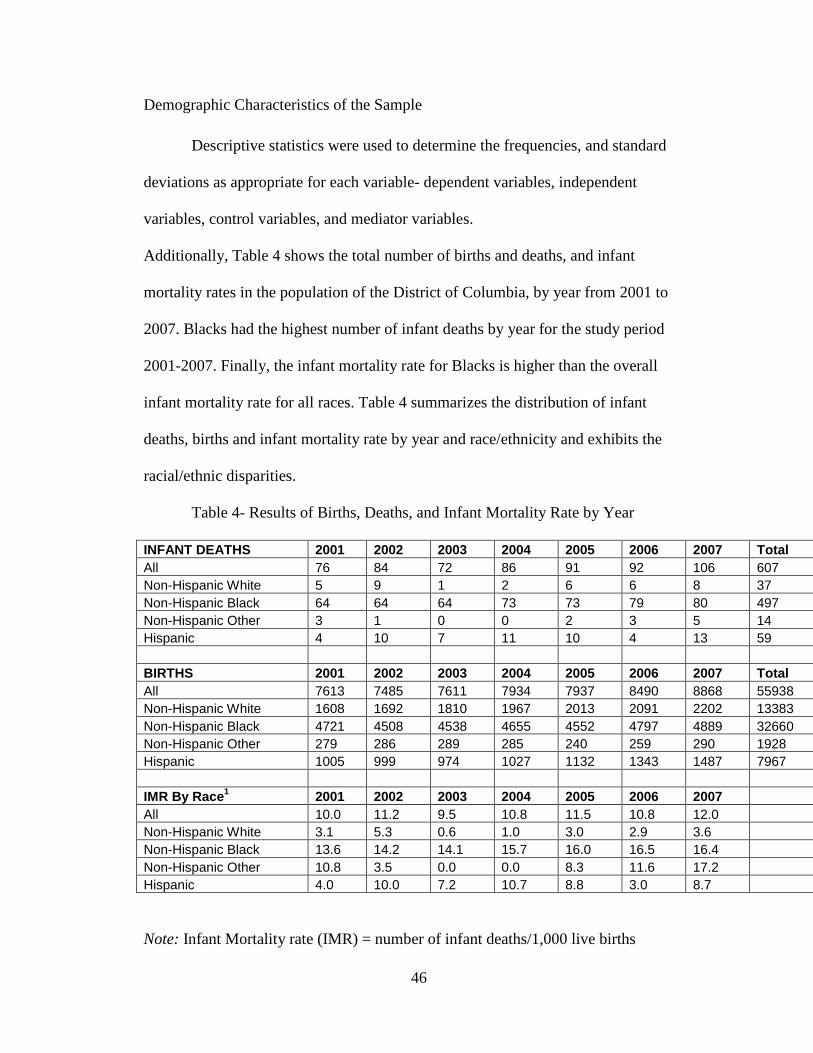
46
Demographic Characteristics of the Sample
Descriptive statistics were used to determine the frequencies, and standard
deviations as appropriate for each variable- dependent variables, independent
variables, control variables, and mediator variables.
Additionally, Table 4 shows the total number of births and deaths, and infant
mortality rates in the population of the District of Columbia, by year from 2001 to
2007. Blacks had the highest number of infant deaths by year for the study period
2001-2007. Finally, the infant mortality rate for Blacks is higher than the overall
infant mortality rate for all races. Table 4 summarizes the distribution of infant
deaths, births and infant mortality rate by year and race/ethnicity and exhibits the
racial/ethnic disparities.
Table 4- Results of Births, Deaths, and Infant Mortality Rate by Year
INFANT DEATHS 2001 2002 2003 2004 2005 2006 2007 Total All 76 84 72 86 91 92 106 607 Non-Hispanic White 5 9 1 2 6 6 8 37 Non-Hispanic Black 64 64 64 73 73 79 80 497 Non-Hispanic Other 3 1 0 0 2 3 5 14 Hispanic 4 10 7 11 10 4 13 59 BIRTHS 2001 2002 2003 2004 2005 2006 2007 Total All 7613 7485 7611 7934 7937 8490 8868 55938 Non-Hispanic White 1608 1692 1810 1967 2013 2091 2202 13383 Non-Hispanic Black 4721 4508 4538 4655 4552 4797 4889 32660 Non-Hispanic Other 279 286 289 285 240 259 290 1928 Hispanic 1005 999 974 1027 1132 1343 1487 7967 IMR By Race1 2001 2002 2003 2004 2005 2006 2007 All 10.0 11.2 9.5 10.8 11.5 10.8 12.0 Non-Hispanic White 3.1 5.3 0.6 1.0 3.0 2.9 3.6 Non-Hispanic Black 13.6 14.2 14.1 15.7 16.0 16.5 16.4 Non-Hispanic Other 10.8 3.5 0.0 0.0 8.3 11.6 17.2 Hispanic 4.0 10.0 7.2 10.7 8.8 3.0 8.7
Note: Infant Mortality rate (IMR) = number of infant deaths/1,000 live births

47
Table 5 describes the demographic variables for the entire sample.
o Blacks make up the majority of the sample representing 58.1%
o Whites comprise 24%,
o Hispanics 14.2% and the
o “Other” race category 3.4%.
The majority of the sample has a high school education or above, representing 78% of
the sample; however, 21.3% of the sample has less than a high school diploma. The
majority of the sample is between the ages of 20-34, and represents 66% of the
sample. The percentage of births to teens (<20 years old) is 12% and the percentage
of births to women ages 35 and over is 20%. The percentage of preterm birth, low
birth weight and inadequate prenatal care in the overall sample is 8% for each of the
variables. Forty-three percent of the sample was married.
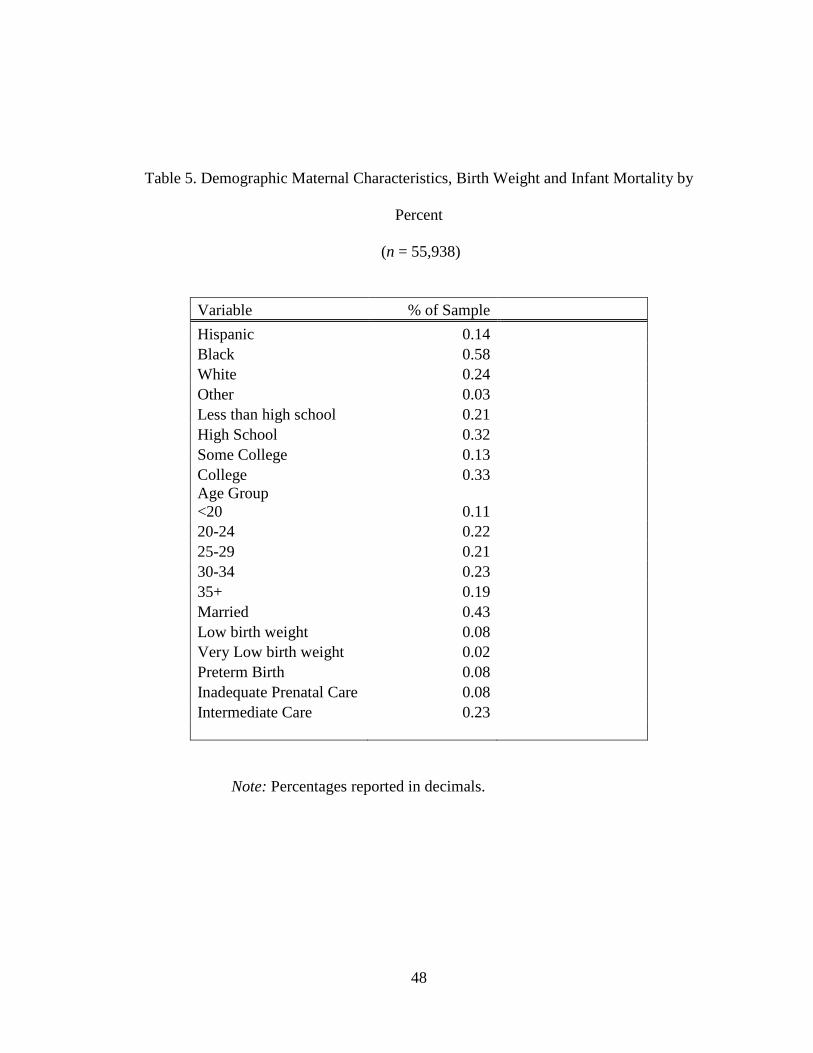
48
Table 5. Demographic Maternal Characteristics, Birth Weight and Infant Mortality by
Percent
(n = 55,938)
Variable % of Sample
Hispanic 0.14 Black 0.58 White 0.24 Other 0.03 Less than high school 0.21 High School 0.32 Some College 0.13 College 0.33 Age Group <20 0.11 20-24 0.22 25-29 0.21 30-34 0.23 35+ 0.19 Married 0.43 Low birth weight 0.08 Very Low birth weight 0.02 Preterm Birth 0.08 Inadequate Prenatal Care 0.08 Intermediate Care 0.23
Note: Percentages reported in decimals.
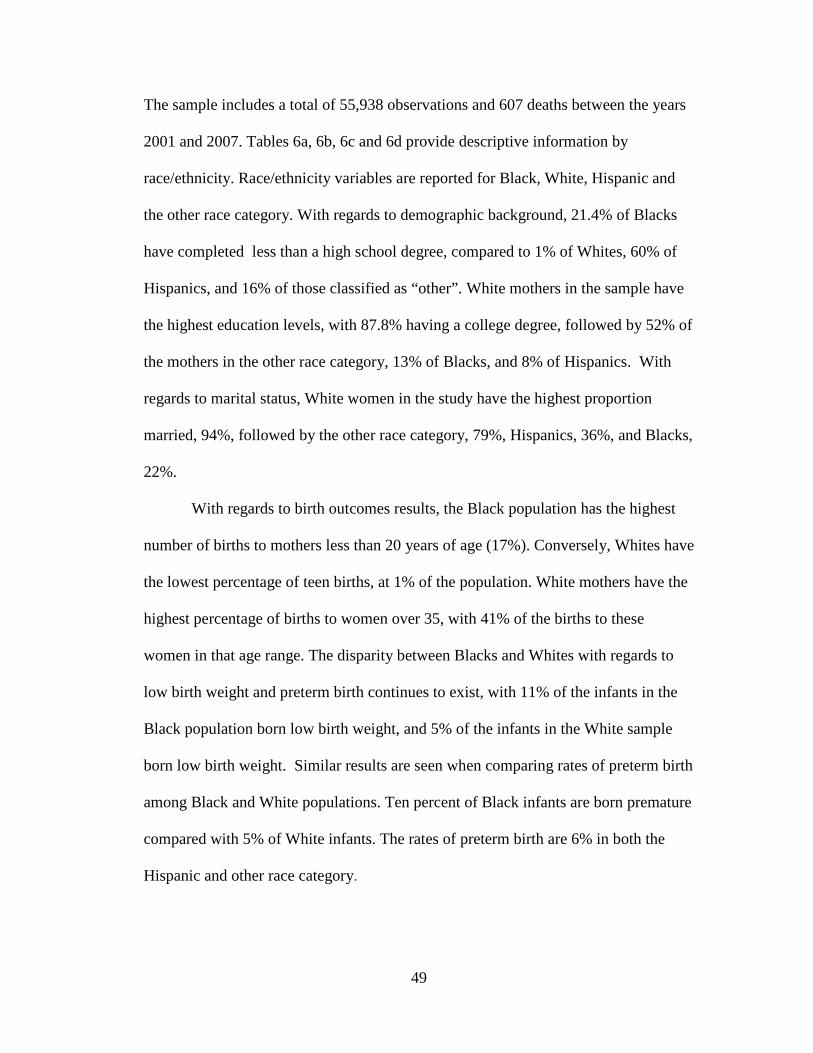
49
The sample includes a total of 55,938 observations and 607 deaths between the years
2001 and 2007. Tables 6a, 6b, 6c and 6d provide descriptive information by
race/ethnicity. Race/ethnicity variables are reported for Black, White, Hispanic and
the other race category. With regards to demographic background, 21.4% of Blacks
have completed less than a high school degree, compared to 1% of Whites, 60% of
Hispanics, and 16% of those classified as “other”. White mothers in the sample have
the highest education levels, with 87.8% having a college degree, followed by 52% of
the mothers in the other race category, 13% of Blacks, and 8% of Hispanics. With
regards to marital status, White women in the study have the highest proportion
married, 94%, followed by the other race category, 79%, Hispanics, 36%, and Blacks,
22%.
With regards to birth outcomes results, the Black population has the highest
number of births to mothers less than 20 years of age (17%). Conversely, Whites have
the lowest percentage of teen births, at 1% of the population. White mothers have the
highest percentage of births to women over 35, with 41% of the births to these
women in that age range. The disparity between Blacks and Whites with regards to
low birth weight and preterm birth continues to exist, with 11% of the infants in the
Black population born low birth weight, and 5% of the infants in the White sample
born low birth weight. Similar results are seen when comparing rates of preterm birth
among Black and White populations. Ten percent of Black infants are born premature
compared with 5% of White infants. The rates of preterm birth are 6% in both the
Hispanic and other race category.
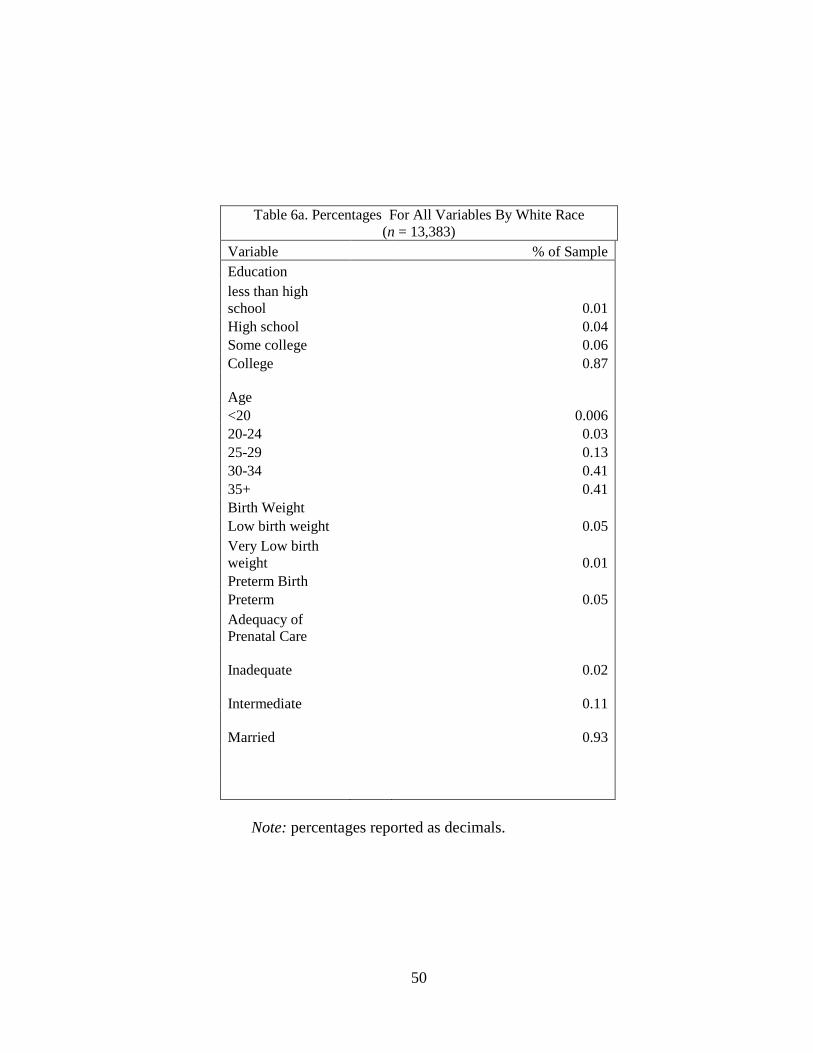
50
Table 6a. Percentages For All Variables By White Race (n = 13,383)
Variable % of Sample Education less than high school 0.01 High school 0.04 Some college 0.06 College 0.87 Age <20 0.006 20-24 0.03 25-29 0.13 30-34 0.41 35+ 0.41 Birth Weight Low birth weight 0.05 Very Low birth weight 0.01 Preterm Birth Preterm 0.05 Adequacy of Prenatal Care Inadequate 0.02 Intermediate 0.11 Married 0.93
Note: percentages reported as decimals.
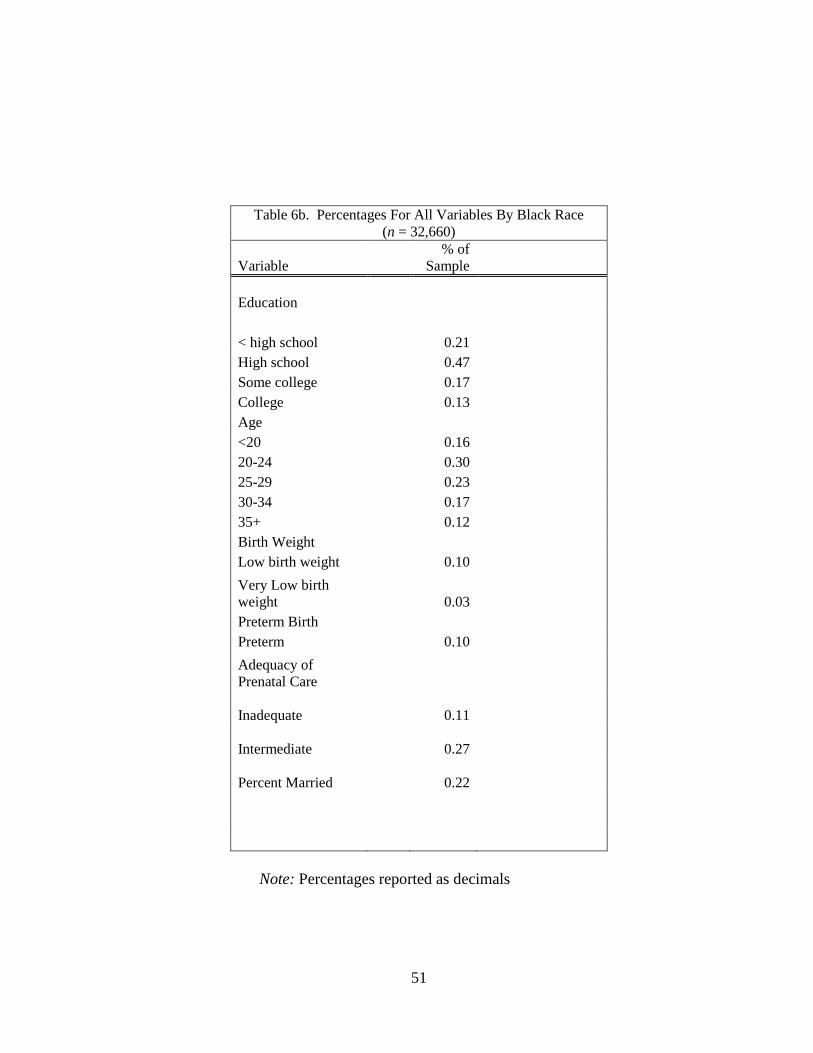
51
Table 6b. Percentages For All Variables By Black Race (n = 32,660)
Variable % of
Sample Education
< high school 0.21 High school 0.47 Some college 0.17 College 0.13 Age <20 0.16 20-24 0.30 25-29 0.23 30-34 0.17 35+ 0.12 Birth Weight Low birth weight 0.10
Very Low birth weight 0.03 Preterm Birth Preterm 0.10
Adequacy of Prenatal Care Inadequate 0.11 Intermediate 0.27 Percent Married 0.22
Note: Percentages reported as decimals
52
Table 6c. Percentages For All Variables By Hispanic Ethnicity (n = 7,967)
Variable % of Sample
Education less than high school 0.59 High school 0.25 Some College 0.06 College 0.08 Age <20 0.12 20-24 0.28 25-29 0.28 30-34 0.18 35+ 0.11 Birth Weight Low birth weight 0.06
Very Low birth weight 0.01 Preterm Birth Preterm 0.06
Adequacy of Prenatal Care Inadequate 0.07 Intermediate 0.32 Married 0.35
Note: Percentages reported as decimals
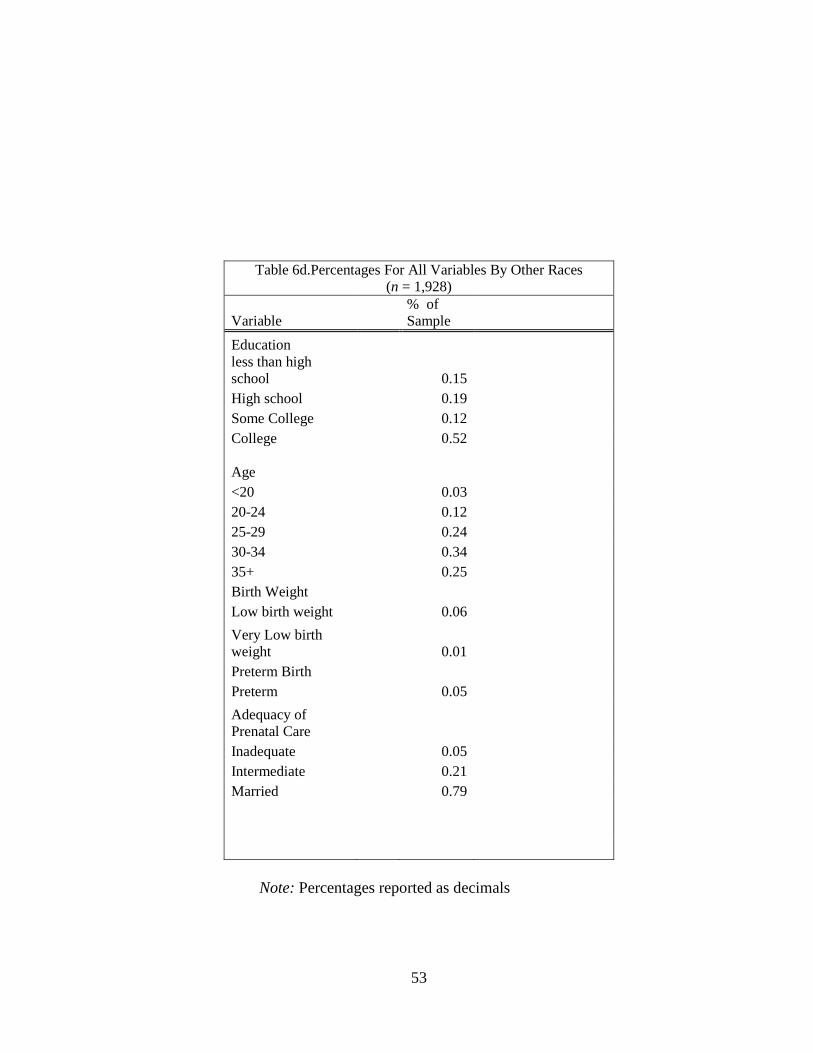
53
Table 6d.Percentages For All Variables By Other Races (n = 1,928)
Variable % of Sample
Education less than high school 0.15 High school 0.19 Some College 0.12 College 0.52 Age <20 0.03 20-24 0.12 25-29 0.24 30-34 0.34 35+ 0.25 Birth Weight Low birth weight 0.06
Very Low birth weight 0.01 Preterm Birth Preterm 0.05
Adequacy of Prenatal Care Inadequate 0.05 Intermediate 0.21 Married 0.79
Note: Percentages reported as decimals
54
Research Question 1
The following hypotheses were tested: a) Rates of infant mortality will differ
by race and by maternal factors such as maternal education, marital status, and
maternal age and b) Controlling for maternal education, maternal age, and marital
status, women will experience different rates of infant mortality by race.
Table 7 displays the results of the analysis. Blacks have the largest rate of
infant mortality, at 15.2 per 1,000 followed by Hispanics at 7.4 per 1,000, the “other”
race category at 7.3 per 1,000 and Whites at 2.8 per 1,000. The chi-square statistics
for Whites, Blacks (< .0001), and Hispanics (< .05) were all statistically significant.
Additionally, for the education variables, the percentage of infants who died varied
with the level of mothers’ education. For instance, at the less than high school level,
the infant mortality rate was 9.7 per 1,000 live births, but for those with a college
degree, the infant mortality rate was 4.0 per 1,000. The results for education are
significant at the < .0001 level. The age category results did not substantiate some of
the previous research on infant mortality. Teen mothers (< 20 years old) had the
highest rates of infant mortality at (14.3 per 1,000). The lowest infant mortality rate is
seen in the oldest age category of women in the sample 30 and over 8.6 per 1,000
experienced an infant death. The results for age are statistically significant at the <
.05 level. The results reveal that women who are not married have higher rates of
infant mortality, at 14.9 per 1,000 with 5.5 per 1,000 infant mortality rate for women
who are married. The results for marital status are significant at the < .0001 level.
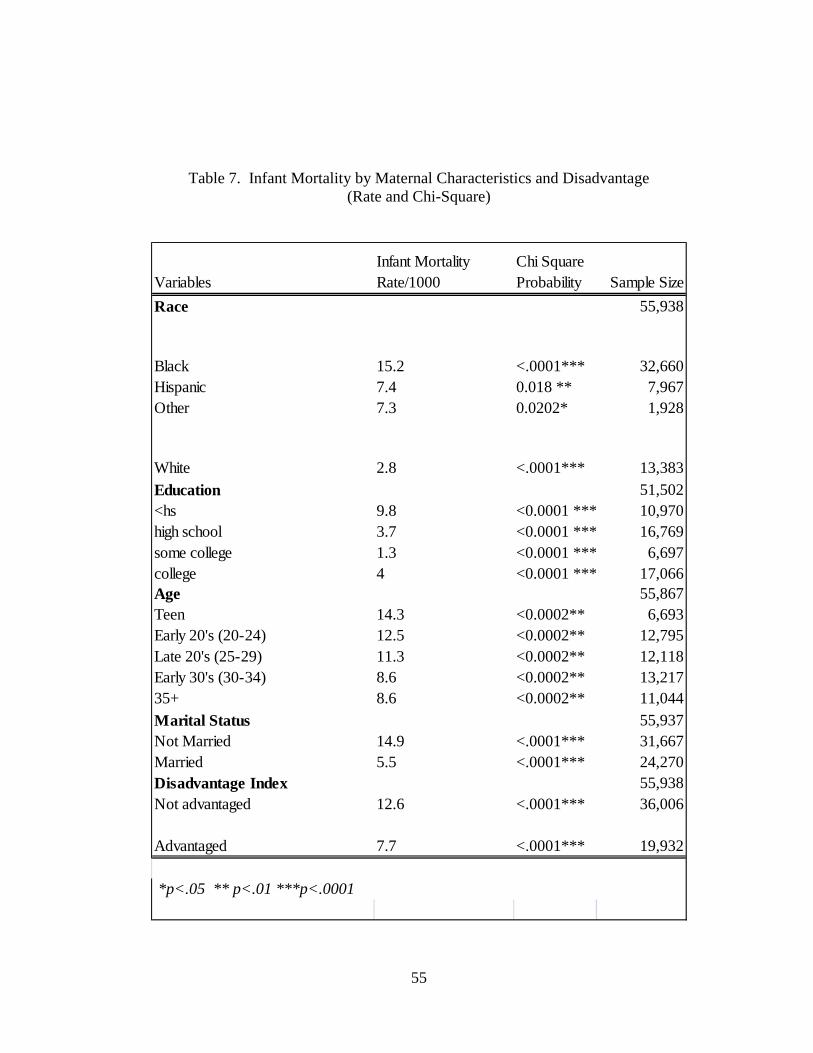
55
Table 7. Infant Mortality by Maternal Characteristics and Disadvantage (Rate and Chi-Square)
Variables Infant Mortality Rate/1000
Chi Square Probability Sample Size
Race 55,938
Black 15.2 <.0001*** 32,660Hispanic 7.4 0.018 ** 7,967Other 7.3 0.0202* 1,928
White 2.8 <.0001*** 13,383
Education 51,502<hs 9.8 <0.0001 *** 10,970high school 3.7 <0.0001 *** 16,769some college 1.3 <0.0001 *** 6,697college 4 <0.0001 *** 17,066Age 55,867Teen 14.3 <0.0002** 6,693Early 20's (20-24) 12.5 <0.0002** 12,795Late 20's (25-29) 11.3 <0.0002** 12,118Early 30's (30-34) 8.6 <0.0002** 13,21735+ 8.6 <0.0002** 11,044
Marital Status 55,937Not Married 14.9 <.0001*** 31,667Married 5.5 <.0001*** 24,270Disadvantage Index 55,938Not advantaged 12.6 <.0001*** 36,006
Advantaged 7.7 <.0001*** 19,932
*p<.05 ** p<.01 ***p<.0001
56
Table 8 presents the results of question 1, hypotheses A and B, analyzed using a
logistic regression. The two hypotheses being tested in research question 1 are: 1a)
infant mortality will differ by race /ethnicity and by maternal factors such as maternal
education, marital status, and maternal age, and 1b) Controlling for maternal
education, maternal age, and marital status, women will experience different rates of
infant mortality by race. In the first model, infant mortality is regressed on race and
Hispanic ethnicity. The odds ratio indicates that Black race and Hispanic ethnicity are
both associated with greater infant mortality. Thus, hypothesis 1a is supported by the
results of the first model. The second model for research question 1b included
race/ethnicity and the control variables of marital status, maternal education, and
maternal age. The results of the second model indicate that race is statistically
significant for Black and Hispanic ethnicity even when maternal education, maternal
age and marital status are added to the model there was an increased risk of infant
mortality for Black race and Hispanic ethnicity.
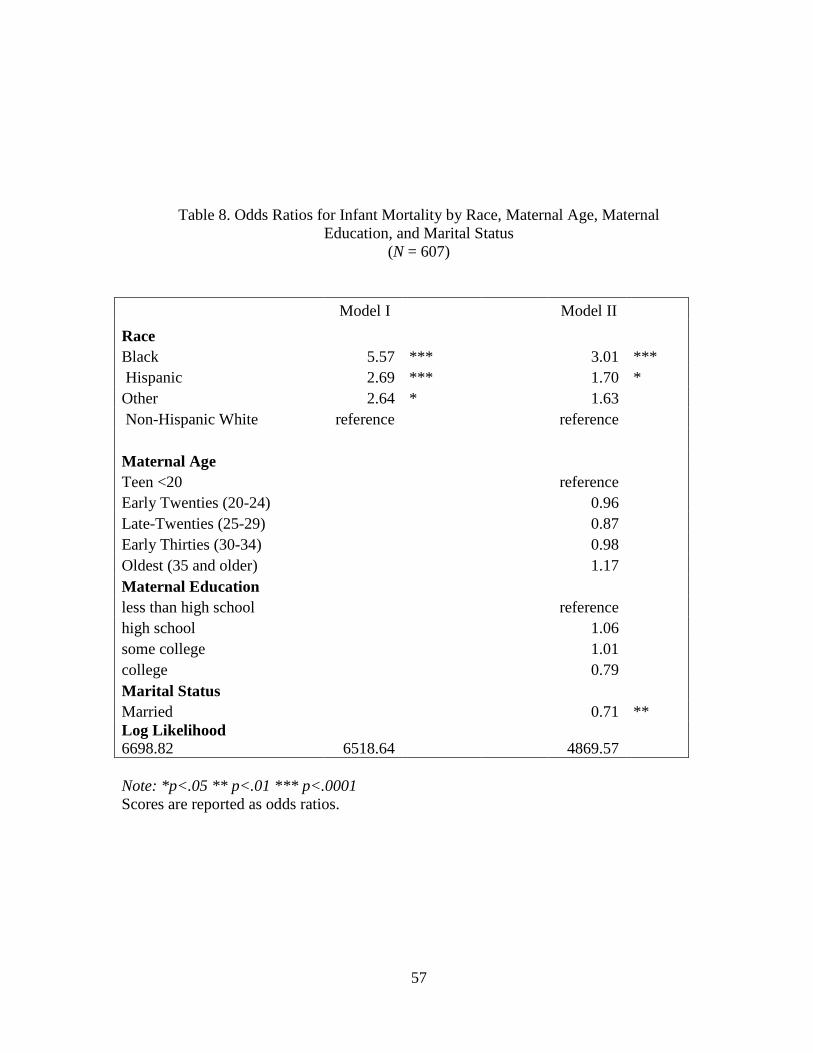
57
Table 8. Odds Ratios for Infant Mortality by Race, Maternal Age, Maternal Education, and Marital Status
(N = 607)
Model I Model II
Race Black 5.57 *** 3.01 *** Hispanic 2.69 *** 1.70 * Other 2.64 * 1.63 Non-Hispanic White reference reference Maternal Age Teen <20 reference Early Twenties (20-24) 0.96 Late-Twenties (25-29) 0.87 Early Thirties (30-34) 0.98 Oldest (35 and older) 1.17 Maternal Education less than high school reference high school 1.06 some college 1.01 college 0.79 Marital Status Married 0.71 ** Log Likelihood 6698.82 6518.64 4869.57
Note: *p<.05 ** p<.01 *** p<.0001 Scores are reported as odds ratios.
58
Research Question 2
Logistic regression is used to examine hypothesis 2a whether- or not women
living in areas of high disadvantage experience higher rates of infant mortality than
women living in areas of lower disadvantage independent of race. Specifically,
hypothesis 2a states that a woman living in a place of high disadvantage as compared
to a place of low disadvantage will have an increased risk of infant mortality. Table 9
displays the results of 2a and 2b.
With regard to hypothesis 2a, the relationship between living in areas of high
disadvantage and infant mortality is statistically significant at the <.0001 level. For
women living in a disadvantaged neighborhood, results indicated a higher risk of
infant mortality; thus hypothesis 2a was supported. To test the second hypothesis in
research question 2, the independent variables of race and the control variables were
added to form the second model. The analysis reveals that when Black race and
Hispanic ethnicity are added to the model, Black and Hispanic are statistically
significant at the < .0001 level. The odds ratio for disadvantage decreases from 1.651
in the first model to 1.149 in the second model albeit no longer achieving statistical
significance. The odds ratio for disadvantage decreases from 1.651 in the first model
to 1.149 in the second model and disadvantage is no longer significantly related to
infant mortality.
Thus, hypothesis 2b was not supported in the results, in that women living in
areas of disadvantage no longer had an increased risk of infant mortality after the
inclusion of the control variables. This finding suggests that, once the race and
ethnicity of the mother are considered, the odds of infant mortality are no longer

59
higher in neighborhoods that are disadvantaged compared to those that are
advantaged.
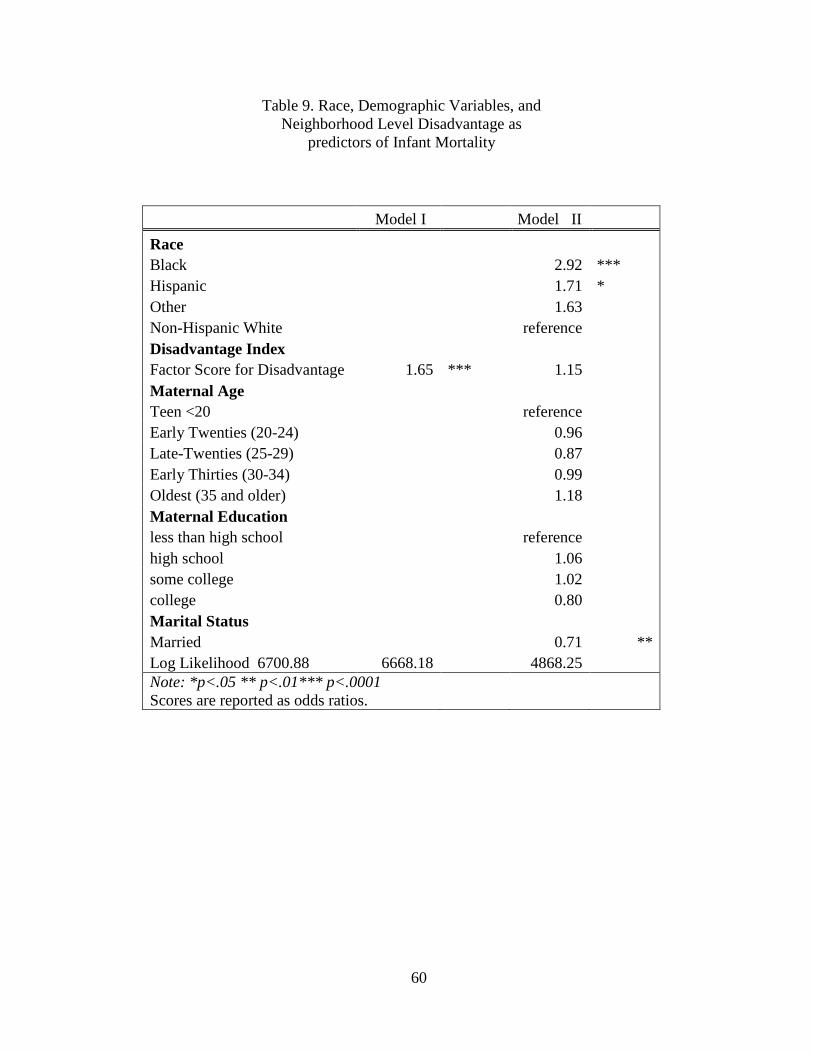
60
Model I Model II
Race Black 2.92 *** Hispanic 1.71 * Other 1.63 Non-Hispanic White reference Disadvantage Index Factor Score for Disadvantage 1.65 *** 1.15 Maternal Age Teen <20 reference Early Twenties (20-24) 0.96 Late-Twenties (25-29) 0.87 Early Thirties (30-34) 0.99 Oldest (35 and older) 1.18 Maternal Education less than high school reference high school 1.06 some college 1.02 college 0.80 Marital Status Married 0.71 ** Log Likelihood 6700.88 6668.18 4868.25
Note: *p<.05 ** p<.01*** p<.0001 Scores are reported as odds ratios.
Table 9. Race, Demographic Variables, and Neighborhood Level Disadvantage as
predictors of Infant Mortality
61
Research Question 3
Logistic regression is used to test hypothesis 3a -the relationship of
race/ethnicity to infant mortality if the mother lives in a disadvantaged neighborhood.
The race/ethnicity variables were interacted with disadvantage to determine the odds
of infant mortality for a racial or ethnic minority mother living in a disadvantaged
neighborhood. Specifically, race/ethnicity, disadvantage, and their interaction were
tested simultaneously to determine if there was a combined effect on infant mortality.
Finally, to test hypothesis 3b, the control variables of maternal age, maternal
education, and marital status were added to the third model. Table 10 reveals the
results of hypothesis 3a and 3b. Model 1 displays the results for disadvantage
controlling only for race and Hispanic ethnicity. Black race and Hispanic ethnicity are
statistically significant (< .0001) and “other” race is significant at the < .01 level. The
disadvantage index is not significant in this model. These results show no association
between disadvantage at the community level and infant mortality when race and
ethnicity are controlled.
The next model includes the effects of race, disadvantage, and the interaction
of race and disadvantage on infant mortality. Model II results are statistically
significant for Black, Hispanic and other race. Disadvantage is now significant at p
<.05. The results of the interactions of race and disadvantage are not statistically
significant for Blacks; however they are significant for Hispanics at p< .05. Thus,
hypothesis 3a is partially supported in model II. Model III testing the main hypothesis
of this study includes the control variables. In this model the interactions between

62
Black race and disadvantage and Hispanic ethnicity and disadvantage are
significantly associated with lower infant mortality (p<.001 and p<.05, respectively). .
Table 11 shows infant mortality by Ward and Race/Ethnicity. Wards 7 and 8 have the
highest rate of infant mortality of all of the wards, in addition to having the highest
concentration of Black infant deaths. Additionally, Wards 1 and 3 have the lowest
rates of infant mortality of all the wards in addition to having the lowest rates of
infant deaths for White infants.
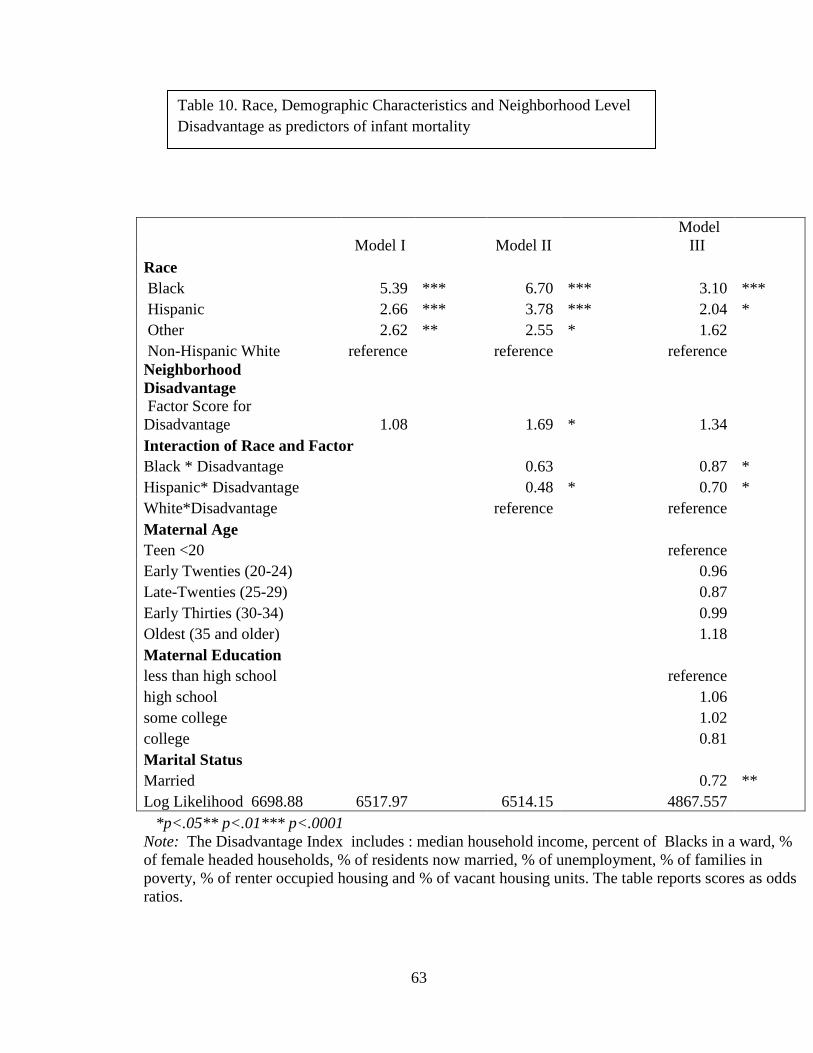
63
Model I Model II Model
III Race Black 5.39 *** 6.70 *** 3.10 *** Hispanic 2.66 *** 3.78 *** 2.04 * Other 2.62 ** 2.55 * 1.62 Non-Hispanic White reference reference reference Neighborhood Disadvantage Factor Score for Disadvantage 1.08 1.69 * 1.34 Interaction of Race and Factor Black * Disadvantage 0.63 0.87 *
Hispanic* Disadvantage 0.48 * 0.70 *
White*Disadvantage reference reference
Maternal Age
Teen <20 reference
Early Twenties (20-24) 0.96
Late-Twenties (25-29) 0.87
Early Thirties (30-34) 0.99
Oldest (35 and older) 1.18
Maternal Education
less than high school reference
high school 1.06
some college 1.02
college 0.81
Marital Status
Married 0.72 **
Log Likelihood 6698.88 6517.97 6514.15 4867.557
*p<.05** p<.01*** p<.0001 Note: The Disadvantage Index includes : median household income, percent of Blacks in a ward, % of female headed households, % of residents now married, % of unemployment, % of families in poverty, % of renter occupied housing and % of vacant housing units. The table reports scores as odds ratios.
Table 10. Race, Demographic Characteristics and Neighborhood Level Disadvantage as predictors of infant mortality
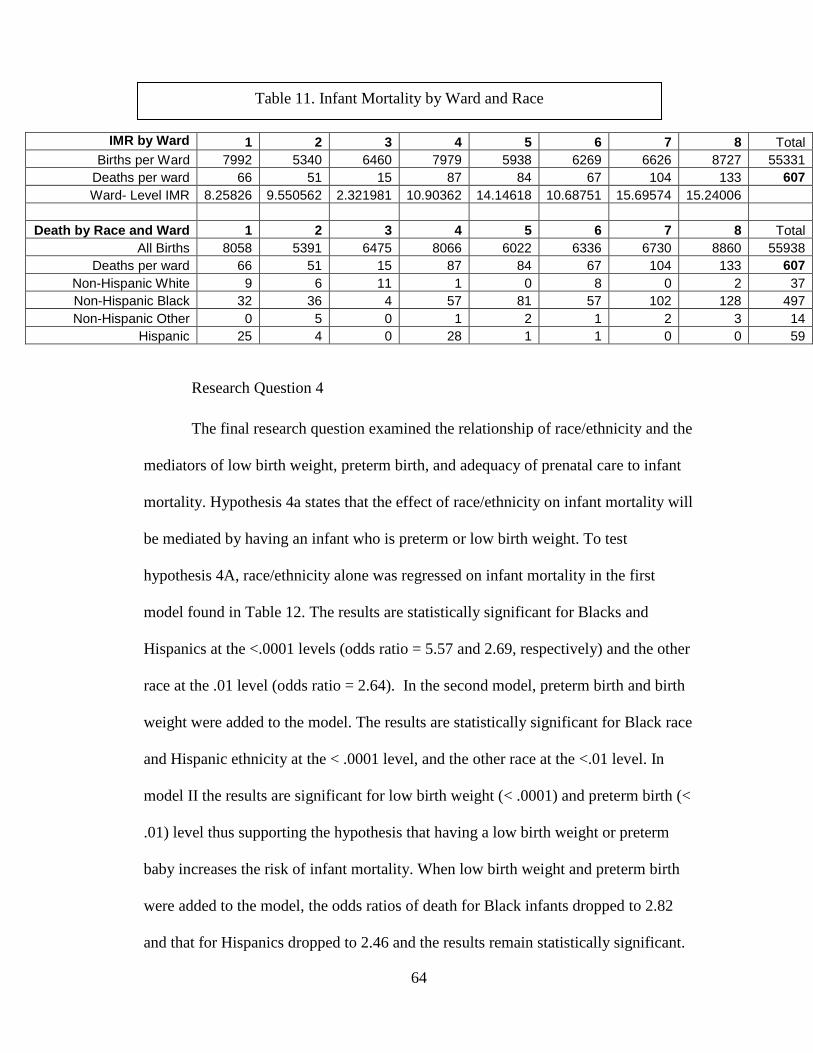
64
IMR by Ward 1 2 3 4 5 6 7 8 Total Births per Ward 7992 5340 6460 7979 5938 6269 6626 8727 55331
Deaths per ward 66 51 15 87 84 67 104 133 607 Ward- Level IMR 8.25826 9.550562 2.321981 10.90362 14.14618 10.68751 15.69574 15.24006
Death by Race and Ward 1 2 3 4 5 6 7 8 Total
All Births 8058 5391 6475 8066 6022 6336 6730 8860 55938 Deaths per ward 66 51 15 87 84 67 104 133 607
Non-Hispanic White 9 6 11 1 0 8 0 2 37 Non-Hispanic Black 32 36 4 57 81 57 102 128 497 Non-Hispanic Other 0 5 0 1 2 1 2 3 14
Hispanic 25 4 0 28 1 1 0 0 59
Research Question 4
The final research question examined the relationship of race/ethnicity and the
mediators of low birth weight, preterm birth, and adequacy of prenatal care to infant
mortality. Hypothesis 4a states that the effect of race/ethnicity on infant mortality will
be mediated by having an infant who is preterm or low birth weight. To test
hypothesis 4A, race/ethnicity alone was regressed on infant mortality in the first
model found in Table 12. The results are statistically significant for Blacks and
Hispanics at the <.0001 levels (odds ratio = 5.57 and 2.69, respectively) and the other
race at the .01 level (odds ratio = 2.64). In the second model, preterm birth and birth
weight were added to the model. The results are statistically significant for Black race
and Hispanic ethnicity at the < .0001 level, and the other race at the <.01 level. In
model II the results are significant for low birth weight (< .0001) and preterm birth (<
.01) level thus supporting the hypothesis that having a low birth weight or preterm
baby increases the risk of infant mortality. When low birth weight and preterm birth
were added to the model, the odds ratios of death for Black infants dropped to 2.82
and that for Hispanics dropped to 2.46 and the results remain statistically significant.
Table 11. Infant Mortality by Ward and Race
65
Thus hypothesis 4a is supported. Model III included race/ethnicity, preterm birth,
birth weight and adequacy of prenatal care. The results for this model are statistically
significant for Black race and Hispanic ethnicity, but not for other race. The
likelihood of infant mortality decreased for Blacks from 2.82 to 2.30 and decreased
for Hispanics from 2.46 to 2.02. The results are statistically significant for low birth
weight (< .0001) preterm birth (< .01), and intermediate prenatal care (p<.05).
Hypothesis 4b is supported. Model IV includes race/ethnicity, preterm birth, and low
birth weight, adequacy of prenatal care, maternal age, maternal education, and marital
status. The results are significant for Black race, maternal age (late twenties and over
35) at the < .05 level. Additionally the results are significant at the < .0001 level for
low birth weight and at the <.01 level for preterm birth and intermediate care.
Furthermore, the likelihood of infant mortality declined for Blacks from 2.30 to 1.57,
remaining significant, and for Hispanics declined from 2.04 to 1.50 but was no longer
significant. The results indicate that low birth weight, preterm birth, and the
adequacy of prenatal care are mediators of the relationship of race/ethnicity to infant
mortality. Interestingly, in model III the results were only significant for intermediate
care and not inadequate care. For a variable to be considered a mediator, it should be
directly related to the dependent variable and, when included in the model, alter the
association between the independent and dependent variable. As evidenced in the
results, the odds of infant mortality for Blacks and Hispanics changed substantially
when the mediator variables were added to the model, though they continued to be
statistically significant. All three variables – low birth weight, preterm birth, and
inadequate prenatal care mediated the effect of race and ethnicity on infant mortality.
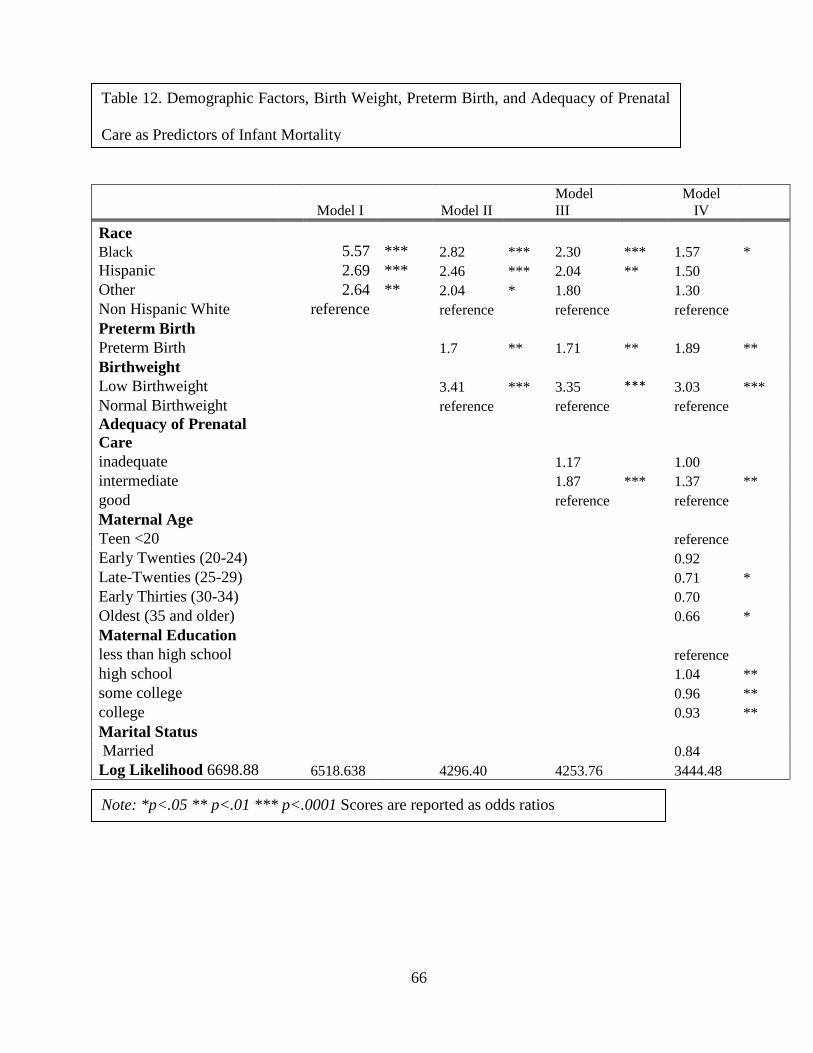
66
Model I Model II Model III
Model IV
Race Black 5.57 *** 2.82 *** 2.30 *** 1.57 * Hispanic 2.69 *** 2.46 *** 2.04 ** 1.50 Other 2.64 ** 2.04 * 1.80 1.30 Non Hispanic White reference reference reference reference Preterm Birth Preterm Birth 1.7 ** 1.71 ** 1.89 ** Birthweight Low Birthweight 3.41 *** 3.35 *** 3.03 *** Normal Birthweight reference reference reference Adequacy of Prenatal Care inadequate 1.17 1.00 intermediate 1.87 *** 1.37 ** good reference reference Maternal Age Teen <20 reference Early Twenties (20-24) 0.92 Late-Twenties (25-29) 0.71 * Early Thirties (30-34) 0.70 Oldest (35 and older) 0.66 * Maternal Education less than high school reference high school 1.04 ** some college 0.96 ** college 0.93 ** Marital Status Married 0.84 Log Likelihood 6698.88 6518.638 4296.40 4253.76 3444.48
.
Note: *p<.05 ** p<.01 *** p<.0001 Scores are reported as odds ratios
Table 12. Demographic Factors, Birth Weight, Preterm Birth, and Adequacy of Prenatal
Care as Predictors of Infant Mortality
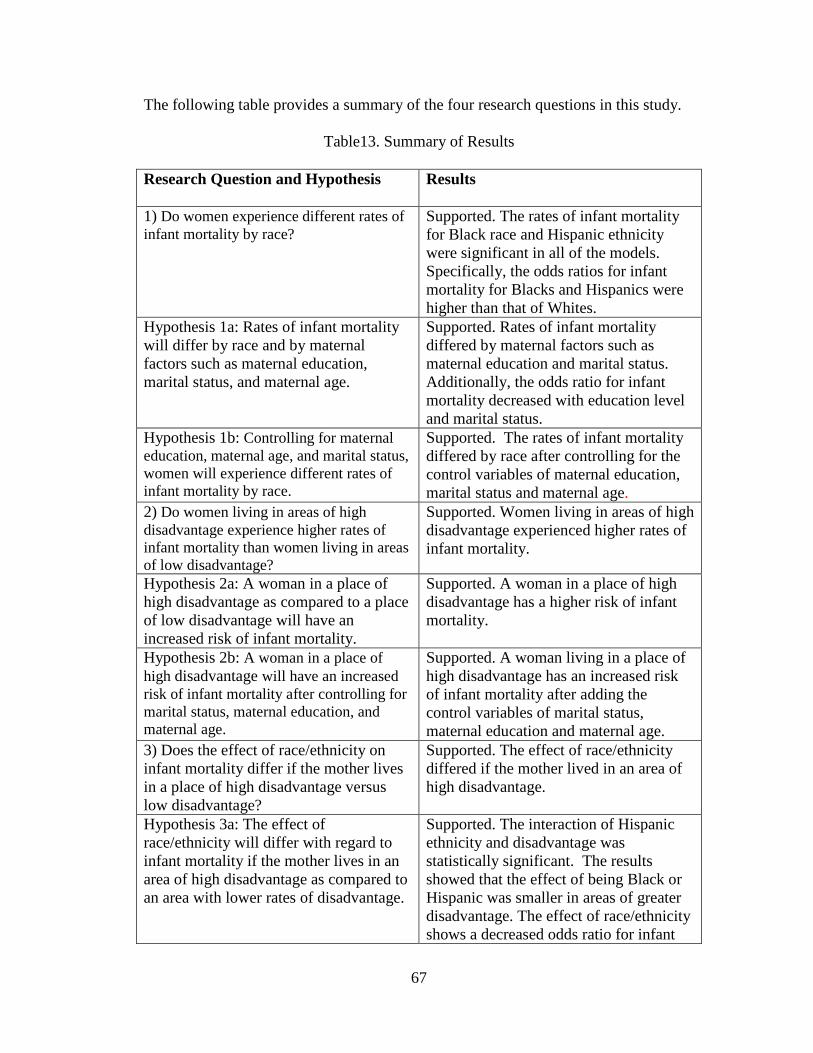
67
The following table provides a summary of the four research questions in this study.
Table13. Summary of Results Research Question and Hypothesis Results
1) Do women experience different rates of infant mortality by race?
Supported. The rates of infant mortality for Black race and Hispanic ethnicity were significant in all of the models. Specifically, the odds ratios for infant mortality for Blacks and Hispanics were higher than that of Whites.
Hypothesis 1a: Rates of infant mortality will differ by race and by maternal factors such as maternal education, marital status, and maternal age.
Supported. Rates of infant mortality differed by maternal factors such as maternal education and marital status. Additionally, the odds ratio for infant mortality decreased with education level and marital status.
Hypothesis 1b: Controlling for maternal education, maternal age, and marital status, women will experience different rates of infant mortality by race.
Supported. The rates of infant mortality differed by race after controlling for the control variables of maternal education, marital status and maternal age.
2) Do women living in areas of high disadvantage experience higher rates of infant mortality than women living in areas of low disadvantage?
Supported. Women living in areas of high disadvantage experienced higher rates of infant mortality.
Hypothesis 2a: A woman in a place of high disadvantage as compared to a place of low disadvantage will have an increased risk of infant mortality.
Supported. A woman in a place of high disadvantage has a higher risk of infant mortality.
Hypothesis 2b: A woman in a place of high disadvantage will have an increased risk of infant mortality after controlling for marital status, maternal education, and maternal age.
Supported. A woman living in a place of high disadvantage has an increased risk of infant mortality after adding the control variables of marital status, maternal education and maternal age.
3) Does the effect of race/ethnicity on infant mortality differ if the mother lives in a place of high disadvantage versus low disadvantage?
Supported. The effect of race/ethnicity differed if the mother lived in an area of high disadvantage.
Hypothesis 3a: The effect of race/ethnicity will differ with regard to infant mortality if the mother lives in an area of high disadvantage as compared to an area with lower rates of disadvantage.
Supported. The interaction of Hispanic ethnicity and disadvantage was statistically significant. The results showed that the effect of being Black or Hispanic was smaller in areas of greater disadvantage. The effect of race/ethnicity shows a decreased odds ratio for infant

68
mortality when interacted with disadvantage.
Hypothesis 3b: Controlling for maternal education, marital status, and maternal age, the effect of race/ethnicity will differ in areas of high poverty versus low disadvantage.
Supported. After controlling for maternal education, marital status, and maternal age the interactions of race/ethnicity and disadvantage remained significant.
4) Will having a preterm birth or a child of low birth weight increase infant mortality?
Supported. Having a low birth weight or a preterm infant birth increased the risk of infant mortality. The results did indicate a meditational effect of preterm birth and low birth weight on the relationship between race and infant mortality.
Hypothesis 4a: The effect of race on infant mortality will be mediated by having an infant who is preterm or low birth weight.
Supported. Low birth weight and preterm birth meditated the effect race/ethnicity on infant mortality. The odds ratio for infant mortality declined after the addition of low birth weight and preterm birth.
Hypothesis 4b: The effect of race/ethnicity on infant mortality will be mediated by the amount of prenatal care a woman received.
Supported. The odds ratio for Blacks and Hispanics declined when adequacy of prenatal care was added to the model. Additionally, prenatal care was related to infant mortality though the results were not statistically significant for inadequate care, just intermediate care. Therefore, the adequacy of prenatal care appeared to be a mediator for the association between race/ethnicity and infant mortality, but not exactly as anticipated.
69
Chapter 5: Discussion
The current study utilized the ecological theory and the social determinants of
health theory to examine predictors of infant mortality in Washington DC. This study
extends public health knowledge about contextual and neighborhood influences on
health disparities and adverse birth outcomes. This research is meaningful to
maternal and child health for multiple reasons.
First, the research highlights the complexities of the urban environment that is
Washington DC. The usage of data at the ward level allows for an examination of the
unique differences of individuals and communities with regards to demographics on
race, marriage, education, and age. Second, this study expands previous research
conducted on the benefits of using multiple levels of data to obtain a clearer and more
specific picture of the relationship between one or many independent variables and a
dependent variable of interest. Furthermore, this study examines low birth weight,
preterm birth and the adequacy of prenatal care as mediators of infant mortality to
examine their protective, null, or increased role in the likelihood of infant mortality
for Washington DC. Finally, unlike other studies that have examined infant mortality
and health disparities, this study also examined race by: 1) studying the interaction of
race/ethnicity at the individual level with neighborhood disadvantage at the ward
level, and 2) studying the relationship of race/ethnicity at the individual level, the
control variables of maternal age, marital status and maternal education at the
individual level, and neighborhood disadvantage at the ward level with infant
mortality.
70
Characteristics of the Sample
The major goal of this study was to examine the relationship of race/ethnicity
and neighborhood level disadvantage to infant mortality in Washington DC. With
regards to the observations in the sample, 58% of the women in the study were Black,
24% White, 14% Hispanic, and 3% other. Having such a large number of Blacks in
the study is a unique advantage in the study of race and health disparities because
Blacks are often underrepresented in our samples. There were other contextual factors
that influenced the results of the study in addition to race. For example, almost 90%
of Whites in the sample had a college degree, compared with 60% of Hispanics with
less than a high school diploma. With regards to Blacks, 21.4% had less than a high
school education, and 13.3% had a college degree. Other variables that influenced
infant mortality outcomes were the large number of White women over the age of 35
having children, (41%) and the large number of black women under the age of 20
having children (17%). Maternal age is an important indicator of birth outcomes, and
previous research has shown that teen mothers are at highest risk for infant mortality,
as was further substantiated in the current study (Geronimus, 1996). No support was
found for a higher rate of infant mortality among older mothers, however.
Predictors of Infant Mortality (Dependent Variable) in Washington DC
The variables utilized at the individual level include: maternal race, maternal age,
maternal education, marital status, low birth weight, preterm birth, and prenatal care.
Variables utilized at the community level include: the percent of renter owned units,
the percent of vacant housing units, the percent of people now married, the
71
unemployment rate, the percent of Blacks in a ward, the percent of families in poverty
and the median household income in a ward.
Independent Variables
Maternal Race
A major goal of this research is to examine the relationship between maternal
race, neighborhood disadvantage and infant mortality. The overall research question
stated that infant mortality would differ by race/ethnicity. As hypothesized, maternal
race proved to be an important indicator of infant mortality in Washington DC.
Specifically, for Blacks, the rate of infant mortality was 15.2 per 1,000. For Whites,
the overall rate of infant mortality was 2.8 per 1,000. Hispanics, the third largest
racial/ethnic group, reported a 7.4 per 1,000 rate of infant mortality. According to the
literature review that was conducted, Blacks have the highest rates of infant mortality
and experience the most adverse birth outcomes (Collins et.al, 2009a). Conversely,
Whites have the lowest rates of infant mortality. Thus this study substantiated
previous research on infant mortality and race/ethnicity. Hispanics have been shown
to have better birth outcomes than Blacks (MacDorman & Matthews, 2009a) and this
was substantiated in this study.
Disadvantage Index
It was hypothesized that living in a disadvantaged neighborhood would have a direct
impact on the rates of infant mortality, such that women in disadvantaged areas would
have higher infant mortality. A large body of previous research supported research
question 2 and its corresponding hypothesis on disadvantage and infant mortality,
72
including earlier work from Collins (2009a) and Roux (2001a). As evidenced by
previous research, the percent of infant deaths was lower in those neighborhoods
considered advantaged, (7.7%) than in those neighborhoods considered disadvantaged
(12.6%). With regards to the regression results, the disadvantage index was
statistically significant at the p<.05 level when infant mortality was regressed on it in
addition to race and with the interaction of race and disadvantage. Specifically, when
disadvantage was regressed on infant mortality by itself, the results showed 69%
higher odds for infant mortality. The interaction between disadvantage and
race/ethnicity however, was negative. Black and Hispanic families living in a
disadvantaged area actually had lower odds of infant mortality than those living in a
more advantaged area. This finding is in direct contrast to previous research. Collins
et.al (2009a) found that racial/ethnic minorities living in neighborhoods of
disadvantage had a greatly increased risk of infant mortality.
The current research found a protective effect for minority women living in
disadvantaged neighborhoods. The protective effect seen in minority populations
could be in the form of community resources such as neighborhood groups, extended
family ties, and informal social networks where older residents/grandparents are an
integral part of the child rearing process. In particular, Hispanic families often live
with extended family members who may be providing the kinds of support to young
mothers in particular that could reduce infant mortality risk. In contrast, for those
living in more advantaged areas, the kinds of familial and other social networks may
not be institutionalized to provide readily available supports. Hence, further
73
exploration of these racial/ethnic differences need to be explored further in order to
best inform programs and policy makers.
Control Variables
Maternal Education
It was hypothesized that maternal education would play a role in the risk of
infant mortality and thus it was controlled in the analysis. The results for infant
mortality with regards to education show significantly different rates for those with a
high school education, (11.4 per 1,000), some college (9.9 per 1,000), or college
degree (4.0 per 1,000). For those with less education, there appears to be increased
odds of infant mortality. Maternal education is an important indicator of future birth
outcomes such as infant mortality due to the increased access to information and
resources that education provides. It is consistent world-wide that women with more
education have better health outcomes and better family well-being.
Hence, it is incumbent that public health and the education system be
encouraged and supported to develop joint initiatives targeted for young girls that
stress the relationship between continued education and improved health and life
circumstances. Such activities could be in the form of public health announcements,
school-based health/education campaigns, parent association initiatives, or materials
offered through health clinics and physician offices. All of these actions could
emphasize that for mothers who have higher levels of education, there is a greater
likelihood of having larger amounts of disposable income, better living arrangements,
safer neighborhoods, and an overall better quality of life.
74
Maternal Age
It was hypothesized that maternal age would influence the likelihood of infant
mortality in the study and thus age was controlled in the analysis. The highest rate of
infant mortality was for women under the age of 20, an overall death rate of 14.3 per
1,000. The lowest rates of infant mortality were seen in women over the age of 30
who had rates of infant mortality at 8.6 per 1,000 for 30-34 year olds, and 8.6 per
1,000 for women over 35 years old. The majority of Black women in the study bore
children at younger ages when compared to Whites. For Blacks, 53% bore children
between the ages of 20-29 and 17.8% of Blacks had children under the age of 20. As
evidenced in the present study, Blacks, who tend to have children at younger ages,
had higher infant mortality rates than Whites. Thus, physicians and programs that
work with Black women should pay close attention to the important role that young
age plays in birth outcomes. Even though age was not statistically significant in the
regression analyses that included controls, young age may contribute to the higher
rate of infant mortality among Black women but could not be separated from the
racial/ethnic variable in the analyses.
Marital Status
The results of the frequency and chi-square analysis reveal a larger rate of
women who were unmarried experiencing an infant death, at 14.9 per 1,000
compared to 5.5 per 1,000 of married women. With regards to the logistic regression,
marital status was significant in most of the models, except for research question 4.
The implications of these results could be attributed to having a support network
during pregnancy for the expectant mother, greater financial resources as a result of a
75
dual income, and less household and personal stress. Therefore, physicians and
midwives should recognize the important part played by the father of the child in the
health of the mother during pregnancy. The data in this study supports the fact that
having a partner and other support people creates a potentially safer environment for
a healthy pregnancy, and this notion should be encouraged in health education classes
for high school and college students in preparation for future motherhood.
Prenatal Care
In research question 4, adequacy of prenatal care was added to the existing
variables of race/ethnicity, preterm birth, and low birth weight. Low birth weight and
preterm birth continue to be risks for infant mortality, low birth weight and preterm
infants showing a continually increased risk of infant death. The results suggest that
for infants who receive an inadequate level of prenatal care, there is a 17% increased
risk of infant death, although this variable is not statistically significant. The
adequacy of prenatal care does play a role in infant mortality. For those who received
intermediate prenatal care, there was an 87% and 37% increased risk of infant
mortality, as seen in models 3 and 4 for research question 4. These findings have
meaning for physicians and public health researchers. Specifically, care must be very
good, not just intermediate in adequacy. There was a limitation to the measurement
of the adequacy of prenatal care. As seen in the present study, there were large
numbers of cases missing data on prenatal care. This presents an opportunity to
improve the reporting and collection of prenatal care utilization for medical
professionals, to allow for a more accurate assessment of how prenatal care affects
infant mortality rates. Further research is necessary to examine why intermediate
76
prenatal care is statistically associated with increased infant mortality but inadequate
care is not. This contrast could perhaps be related to the accuracy of the measurement
of intermediate care. For example, receipt of little to no prenatal care is clearly
defined. However, the measurement of intermediate care may have some ambiguity
in terms of the number of prenatal visits or the number of weeks a woman receives
care. It is also important to note that both intermediate and inadequate care in the
study show increased odds for infant mortality, though only the former is statistically
significant. Therefore, it seems that receiving good prenatal care has the lowest odds
of infant mortality.
Mediator Effect of Birth Weight, and Preterm Birth on Infant Mortality
In research question 4 it was hypothesized that low birth weight, preterm
birth, and the adequacy of prenatal care would explain the relationship of
race/ethnicity to infant mortality by acting as a mediator. This hypothesis was
supported. The findings suggest that the odds of infant mortality for Black race and
Hispanic ethnicity decline as preterm birth, low birth weight, and adequacy of
prenatal care are added to the model. The variables of preterm birth and low birth
weight are important in the study of infant mortality because they provide insight into
the many physiologic, societal, and contextual factors that affect a woman’s health
and birth outcomes, thus placing her at higher or lower risk for infant mortality.
Previous research in this area has demonstrated that there are racial and ethnic
disparities in low birth weight and preterm birth that could benefit from additional
research on the stressors or effects of racial disparity on infant mortality (Collins et.al,
2009b). The implications for low birth weight and preterm birth as mediators in this
77
study provide a foundation for future research on urban mothers who may experience
personal and familial stress, unstable housing situations or employment, and unsafe
environments which may contribute to preterm deliveries or low birth weight infants.
Summary
This study further substantiates the need for modeling based on theories such
as ecological theory and the social determinants of health theory, which both
emphasize the need to consider a person and the positive or negative influences of
their physical, family, social or political environment on their health. The study
builds on previous research conducted with neighborhood level data, race/ethnicity
and infant mortality as seen in the work of Collins (2009a) and Roux (2001a). For
Blacks and Hispanics there was a greatly increased odd for infant mortality.
Moreover it is clear from this study that neighborhood matters; how and to what
extent need further study.
Limitations
The current findings, while important to the maternal and child health field,
urban health disparities, multilevel modeling and the influence of contextual factors
on infant mortality, have limitations that need to be acknowledged. First, a major
limitation of secondary data is the measurement and collection of information, such
as prenatal care utilization. Due to the large amount of missing data for prenatal care,
the results may potentially be biased. Another limitation is that the information while
useful to the District of Columbia health official’s has limited generalizability. As
such, findings may only be generalized to similar urban environments with a similar
78
timeframe. Additionally, the main focus of the study was on Blacks, Hispanics, and
Whites; work on the effect of race/ethnicity and infant mortality with other races
would warrant additional research. It should also be recognized that low birth weight
and preterm birth are overlapping conditions. In future work it would be desirable to
separate these categories. Therefore one should recognize that there may be an
overestimate of the effect of these variables in this study.
In addition, the complexity of using population based data by linking data
sets, combining data from several sources, and the attention to detail and rigor
required for accuracy and multilevel modeling is appreciated and must be
incorporated into all analytic efforts. Even with the aid of computer technology and
advanced analytic methods, traditional public health measures and metrics must be
employed to assure accuracy and understanding of findings. These last items are not
limitations per se, rather they are more like lessons learned, that if not applied they
could threaten the validity and reliability of any study and become a limitation.
Finally, because of the overwhelming disparity between Blacks and Whites in
this sample, the research was unable to explore all of the neighborhood level effects
(advantage/disadvantage) on White infant deaths and Black infant deaths. Thus,
further study is required.
Application to Social Determinants of Health Model and Ecological Theory
The results of the study provide justification as to the need and validity of
theories such as the Social Determinants of Health Model and the Ecological Theory.
The Social Determinants of Health Model posits that women and their babies must be
examined not only as individuals but as members of families, communities and large
79
systems that can have a positive or negative impact on a woman’s psychological and
physical state. As evidenced by the odds of infant mortality for Blacks and Hispanics,
the communities that the women live in have a negative impact on the adverse birth
outcomes that they experience. For women living in disadvantaged neighborhoods,
race/ethnicity changes from a risk factor to a protective factor for Blacks and
Hispanics with regards to infant mortality. This study examined women as individuals
and members of communities in which they live. The results show the complexities of
research on maternal and child health outcomes, based on factors such as
neighborhood environment, marital status, race, and education level.
This study utilized an ecological model to examine the relationship of
individual, and community level factors to infant mortality. The ecological
framework identifies two key concepts: (1) that individual behavior affects and is
affected by the social environment and (2) that behavior both shapes and is shaped by
multiple levels of influence. The ecological model acknowledges that examining the
ecological niche of the family, the community, and the political and social
environments in which a person lives is essential in helping to understand and to
prevent health problems (Alio et al., 2009). The ecological model provides a
framework from which to examine racial disparities and community factors for
women, as well as identify opportunities to improve women’s outcomes. Finally, the
ecological model provides different lenses from which to view the complex issue of
infant mortality.
With regards to the current study, Washington DC is a unique blend of
demographics including diverse races and ethnicities, rates of marriage, education,
80
and neighborhood conditions. Thus, for many residents, Washington DC is not a
typical U.S. environment. DC is a majority Black city and even within the Black race
there is a continuum of incomes, levels of education, and marital status. The
combination of many low and middle income Blacks, middle to high income Whites,
and mostly low income Hispanics creates a cultural and contextual environment
where race alone does not solely influence rates of infant mortality. Consideration of
the multiple components of individual, familial, and community variables is essential
to understand infant mortality in the Washington DC and the United States.
Programmatic and Policy Implications
In spite of the current study’s limitations, the results have implications for
public health agencies, such as non-profits and health departments. From previous
research we know that programs must be designed and implemented to target the
unique characteristics of pregnant women. For example, Black women are most at
risk for having a child that is low birth weight/ and or for not surviving to their first
birthday and are more likely to be teenage mothers who are unmarried. Programming
could be offered within Black communities to target those young girls and their
families who are most at risk. With regards to Hispanics, although they experience
the second lowest rates of infant mortality, their extremely high rates of less than high
school education is associated with an increased risk for infant mortality. However,
Hispanics are more likely to be married, and live in households that include a
grandmother or older woman who may assist with the childrearing (MacDorman,
2008). Education may be associated with the likelihood to access more resources and
needed services, and programs. Further, given the important role of family,
81
programs should be designed that include family members regarding behavior risks
and health interventions.
Finally, the results indicate the importance of targeting neighborhood
environments as part of the development of comprehensive programs in addition to
addressing individual characteristics. Black and Hispanic women experienced lower
rates of infant mortality despite living in a disadvantaged neighborhood, suggesting
there are important but as yet unclear neighborhood strengths and protective factors
derived from the Washington DC environments where they live. Building on the
importance of utilizing community data for the examination of health disparities, a
multi-faceted approach needs to be implemented by DC government to reduce
inequities and improve its residents’ physical and social environment. A collaborative
effort across the health department, housing authority, public schools, and
employment services would help to assure that DC residents have access to services,
housing, and educational resources that will improve their quality of life and
ultimately the birth outcomes of women. The measures of neighborhood disadvantage
that comprised the index used in the study provide opportunities for improvement.
Specifically, the percent of people unemployed, the percent of vacant housing units,
and the percent of renter occupied housing are starting points for improving outcomes
that influence infant mortality. Ward 3 has the highest rates of home ownership and
median income and the least amount of families living below the poverty line. Places
such as Ward 3, should be the gold standard for services, cleanliness, and access to
resources for the entire city.
82
Implications for Black Women in DC
The results of the present study in particular have implications for
Black women in Washington DC. Previous research in the area of neighborhoods,
race/ethnicity and birth outcomes have found results similar to the present study.
Pickett et.al found that maternal characteristics varied by racial density in Chicago.
Mothers who were in predominately Black tracts were significantly more likely to be
teenage mothers and to have had less than a high school education. Additionally, the
Black women in the Pickett study were less likely to be married, and had late or no
prenatal care. Women living in predominately Black neighborhoods were
significantly more likely to have low birth weight and preterm birth infants. As seen
in the current study, Black women were more likely to have low birth weight and
preterm births, as well as infant deaths. Thus the results of both the Pickett study and
the current study have implications for Black women in DC.
The results of the study speak to the need for further research in this
area. Black women have the highest rates of infant mortality and adverse birth
outcomes in Washington DC. Thus, organizations such as the DC Department of
Health’s Healthy Mom Healthy Baby program, community based organizations such
as the DC Birthing Center and the DC Public Schools should work collaboratively to
educate young Black women about healthy pregnancies, infant mortality, and how to
access necessary care and services.
The DC Department of Health’s Community Health Administration
should consider implementing a system to monitor, evaluate, and respond to teenage
83
pregnancy and infant mortality in Washington DC. Collection and accurate tracking
of cases of infant death such as the Fetal Mortality review policy recommendations
and programs to reduce the rates of infant death for women of color will begin to
make an impact. Finally, organizations such as Planned Parenthood and the DC
Department of Health need to create an aggressive social marketing campaign to
educate women of color in DC about prenatal care and other health behaviors in
pregnancy. Through the use of media such as Facebook, Twitter, and radio stations,
pertinent information can be disseminated to the community in a culturally competent
and age appropriate manner that will reflect diversity.
Black women in DC face unique difficulties related to poverty and
disadvantage. Specifically, in certain parts of the city women are not able to access
proper medical care due to a lack of a full-service hospital. Thus, the lack of proper
care in their proximal geographic area makes women’s health and pregnancy a
burdensome situation. For some Black women in DC, the only way to access proper
medical care is to take one or multiple buses across town. The precursor to the
doctor’s visit is that women will need to take time off from work, find a babysitter or
bring other children with them, and wait in crowded waiting rooms to see a physician
who may or may not be culturally competent. All of these logistic challenges add to a
woman’s stress level during her pregnancy and undoubtedly influence her birth
outcomes. Thus, this study is morally and socially relevant to the lives of Black
women in DC.
84
Directions for Future Research
The results of this study indicate that future studies in the realm of
neighborhood level influences on health need to include data on both individual
people and the geographic area where they live. Also, future studies should have
sufficient numbers of neighborhoods and populations to allow for comparisons of
within and between neighborhood variations. Furthermore, these studies should have
a wide variety of types of neighborhoods such as neighborhoods with mixed incomes
and demographics in order to include rates of marriage, college education, and
race/ethnicity in the analysis. A wider variety of neighborhood types would help to
uncover more explicitly the factors that influence adverse birth outcomes. An
additional area of research would be to identify patterns of exposure to different
community conditions such as violence, crime, and trauma with regards to adverse
birth outcomes such as infant mortality. The inclusion of stress in a future index of
neighborhood level data would also determine if there was a relationship between this
contextual factor and infant mortality.
An expansion of a variety of contextual factors such as the location of health
services would elucidate additional health and behavioral factors that may influence
birth outcomes. The impact of increased access to unhealthy habits would
undoubtedly influence infant mortality in a way that has not been thoroughly
examined to date. These results suggest that the amount of social support women
receive during pregnancy, whether from partners, other family members or friends
may be important for their health behaviors and birth outcomes, despite the apparent
85
disadvantage of the neighborhood. Future research should examine the different
types of support women receive and their impact on their well-being. Finally, through
the use of qualitative and quantitative research such as focus groups and long-term
ethnographic observation as well as direct data collection, future studies will need to
further disentangle and discuss the race/ethnic differences in infant mortality and
uncover some of the individual barriers women face.
Conclusion
The major purpose of this study was to examine the influence of race/ethnicity
and neighborhood disadvantage on infant mortality in Washington DC. The results
indicated that both race/ethnicity and neighborhood disadvantage collectively and
separately directly influence infant mortality. Overall, the study substantiated the
research questions and hypotheses that were posed with regards to the main
independent variables of race/ethnicity and neighborhood disadvantage The current
findings underscore the importance for public health providers and policy makers to
focus on all races/ethnicities and the character of the neighborhoods families live in
for the reduction of infant mortality in Washington DC, in addition to focusing on the
unique needs of Black mothers, who display the highest risk.

86
Appendix A – IRB Approval from the University of Maryland

87
Appendix B- Birth Certificate, 2003 Version
GOVERNMENT OF THE DISTRICT OF COLUMBIA DEPARTMENT OF HEALTH CERTIFICATE OF LIVE BIRTH
DATE REGISTERED:
CERTIFICATE/FILE NO:
108-YYYY-000000
CHIL D
1. CHILD’S NAME (First, Middle, Last, Suffix)
2. TIME OF BIRTH
(24 hr)
(24hr)
3. SEX
4. DATE OF BIRTH (Mo/Day/Yr)
5. FACILITY NAME (If not institution, give street and number)
6. CITY, TOWN, OR LOCATION OF BIRTH
6a. COUNTY OF BIRTH
7.
PLACE WHERE BIRTH O CCURRED (Check one) ?
Hospital ?
Freestanding birthing center
? Home Birth: Planned to deliver at home? ? Yes ?
No
? Clinic/Doctor’s office
? Other (Specify)_______________________
8. ATTENDANT’S NAME, TITLE, AND NPI
NAME: _______________________ NPI:_______
TITLE: ? MD ? DO ? CNM/CM ? OTHER MIDWIFE
? OTHER (Specify)___________________
CERTIFIE R 9.
CERTIFIER’S NAME: _______________________________________________
TITLE: ?
MD ?
DO ?
HOSPITAL ADMIN.
? CNM/CM ?
OTHER MIDWIFE
?
OTHER (Specify)_____________________________
10.
DATE CERTIFIED
______/ ______ / __________
MM DD YYYY
11 . DATE FILED BY REGISTRAR
______/ ______ / ________ __
MM DD YYYY
MOTHE R
12a. MOTHER’S CURRENT LEGAL NAME (First, Middle, Last, Suffix)
12b. DATE OF BIRTH (Mo/Day/Yr)
12c. MOTHER’S NAME PRIOR TO FIRST MARRIAGE (First, Middle, Last, Suffix)
1 2d. BIRTHPLACE ( State, Territory, or Foreign Country)
1 2e. RESIDENCE OF MOTHER - STATE
1 2f. COUNTY
1 2g. CITY, TOWN, OR LOCATION
12 h. STREET AND NUMBER
12i. APT. NO.
12 j. ZIP CODE
12k. INSIDE CITY
LIMITS?
?
Yes ?
No
MOTHE R
1 3. MOTHER’S MAILING ADDRESS: ?
Same as residence, or: State: City, Town, or Location:
Street & Number:
Apartment No.: Zip Code:
1 4. MOTHER MARRIED? (At birth, conception, or any time between)
? Yes ?
No
IF NO, HAS PATERNITY ACKNOWLEDGEMENT BEEN SIGNED IN THE HOSPITAL?
?
Yes ?
No
1 5. SOCIAL SECURITY NUMBER REQUESTED
FOR CHILD?
?
Yes ?
No
16. FACILITY ID. (NPI)
1 7. MOTHER’S SOCIAL SECURITY NUMBER:
1 8. FATHER’S SOCIAL SECURITY NUMBER:
FATHE R
19a. FATHER’S CURRENT LEGAL NAME (First, Middle, Last, Suffix)
1 9b. DATE OF BIRTH (Mo/Day/Yr)
19 c. BIRTHPLACE (State, Territory, or Foreign Country)
INFORMANT
20 . I certify that the personal information on this certificate is correct to the best of my knowledge and belief.
Name of Informant::____________________ ____________________
21. RELATIONSHIP TO CHILD
Hospital Copy - Not for Issuance
Confidential - for Statistical Purposes ONLY MOTHER
22 . MOTHER’S EDUCATION (Check the
box that best describes the highest
degree or level of school complet ed at
the time of delivery)
?
8th grade or less
?
9th -
12th grade, no diploma
?
High school graduate or GED
completed
?
Some college credit but no degree
?
Associate degree (e.g., AA, AS)
?
Bachelor’s degree (e.g., BA, AB, BS)
?
Master’s degr ee (e.g., MA, MS,
MEng, MEd, MSW, MBA)
?
Doctorate (e.g., PhD, EdD) or
Professional degree (e.g., MD, DDS,
DVM, LLB, JD)
2 3.
MOTHER OF HISPANIC ORIGIN? (Check
the box that best describes whether the
Mother
is Spanish/Hispanic/Latina. Check the
“No” box if mother is not Spanish/Hispanic/Latina)
?
No, not Spanish/Hispanic/Latina
?
Yes, Mexican, Mexican American, Chicano
?
Yes, Puerto Rican
?
Yes, Cuban
?
Yes, other Spanish/Hispanic/Latina
Specify_____________________________
24 .
MOTHER’S RACE (Check one or more races to indicate
what the mother considers herself to be)
?
White
?
Black or African American
?
American Indian or Alaska Native
(Name of the enrolled or principal tribe)________________
?
Asian Indian
?
Chinese
?
Filipino
?
Japanese
?
Korean
?
Vietnamese
?
Other Asian (Specify)______________________________
?
Native Hawaiian
?
Guamanian or Chamorro
?
Samoan
?
Other Pacific Islander (Specify)______________________
?
Other (Specify)___________________________________
FATHE R
2 5. FATHER’S EDUCATION (Check the
box that best describes the highest
degree or level of school co mpleted at
the time of delivery)
?
8th grade or less
?
9th -
12th grade, no diploma
?
High school graduate or GED
completed
?
Some college credit but no degree
?
Associate degree (e.g., AA, AS)
?
Bachelor’s degree (e.g., BA, AB, BS)
?
Master’s degree (e.g., MA, MS,
MEng, MEd, MSW, MBA)
?
Doctorate (e.g., PhD, EdD) or
Professional degree (e.g., MD, DDS,
DVM, LLB, JD)
2 6.
FATHER OF HISPANIC ORIGIN? (Check
the box t hat best describes whether the
Father is Spanish/Hispanic/Latino. Check the
“No” box if father is not Spanish/Hispanic/Latino)
?
No, not Spanish/Hispanic/Latino
?
Yes, Mexican, Mexican American, Chicano
?
Yes, Puerto Rican
?
Yes, Cuban
?
Yes, other Spanish/Hispanic/Latino
Specify_____________________________
27 .
FATHER’S RACE (Check one or more races to indicate
what the father considers himself to be)
?
White
?
Black or African American
?
American Indian or Alaska Native
(Name of the enrolled or principal tribe)________________
?
Asian Indian
?
Chinese
?
Filipino
?
Japanese
?
Korean
? Vietnamese
?
Other Asian (Specify)______________________________
?
Native Hawaiian
?
Guamanian or Chamorro
?
Samoan
?
Other Pacific Islander (Specify)______________________ ?
Other (Specify)___________________________________
MOTHE R
28 a. DATE OF FIRST PRENATAL CARE VISIT
______ /________/ __________
?
No Prenatal Care
M M D D YYYY
2 8b. DATE OF LAST PRENATAL CARE VISIT
______ /________/ __________
M M D D YYYY
28c . TOTAL NUMBER OF PRENATAL VISITS FOR THIS
PREGNANCY
_________________________ (If none, enter “0".)
2 9. MOTHER’S HEIGHT
_______ (feet/inches)
30 . MOTHER’S PREPREGNANCY WEIGHT
_________ (pounds)
31. MOTHER’S WEIGHT AT DELIVERY
_________ (pounds)
32. DID MOTHER GET WIC FOOD FOR HERSELF
DURING THIS PREGNANCY? ?
Yes ?
No
Not for Issuance

88
33 . NUM BER O F PREVIO US LIVE BIRT HS (Do n ot i nclud e thi s ch ild )
34 . NU MBER O F OT HER PREG NANC Y O UT CO M ES (spon ta neo us or ind uced losse s o r e cto pic pre gna ncie s)
35 . C IG ARET TE SMO KIN G BEF OR E AN D DUR IN G PREG NANC Y F or e ach ti m e peri od, enter ei th er th e numbe r of ci gare ttes or the n um be r o f pa cks o f cig aret tes smoked . IF N ON E, ENT ER “0 ". Ave rage n umbe r o f cig aret tes or packs of ciga ret te s sm oke d pe r d ay.
# of ciga rette s # of p acks T hree M on th s Be fo re Pregn ancy __ ___ ___ _ O R ___ ___ __ Fi rst T hree M on th s o f Preg nan cy ___ ___ ___ O R ___ ___ __ Secon d Th ree Mon ths o f Preg nan cy __ ___ ___ _ OR __ ___ ___ T hird T rimester of P regn ancy __ ___ ___ _ OR __ ___ ___
36 . PRINCIPAL SOU RCE OF PAYMEN T F O R TH IS DEL IVER Y ? Pri vate Insu rance ? Med icai d ? Sel f-pay ? O th er (Spe ci fy)
__ __ ____ __ ____ ___ _
33 a. No w Livi ng Numbe r _ __ __ ? N one
33b . No w Dea d Numb er ___ __ ? No ne
34 a. O th er Ou tco me s N umbe r __ ___ ? No ne
33 c. DAT E O F L AST LIVE B IRT H ___ ___ _/___ ___ __ M M Y Y Y Y
34 b. DAT E OF LAST O T HER PREG NAN CY O UT CO ME _ ___ ___ /_ ___ ___ _ M M Y Y Y Y
37. D ATE LAST N OR M AL MEN SES BEG AN
___ __ /___ ___ __/ ___ ___ ___ _ M M D D YYYY
38 . MO TH ER’S M EDICAL REC OR D NUMBER
3 9. M O T HER T RANSF ERRED F O R MATER NAL MEDICAL O R F ETAL IND IC AT IO NS F O R
D ELIVERY? ? Ye s ? No IF YES, ENT ER NAME OF FAC IL IT Y MOT HER TR ANSF ERRED F RO M: ___ ___ ___ ___ ____ __ ____ __ ____ __ ____ ___ ___ ___ ___ ___ ___ ___ ___ __
M EDICA L AN D
HEAL T H IN FO RMAT IO N
40 . RISK F ACT O RS IN T HIS PR EGN ANCY (C heck all th at a ppl y) D iab etes ? P repre gn ancy ( Diag nosi s p rior to th is preg nan cy)
? G estati on al (Di agn osis in thi s p regn ancy) H yperten sion ? P repre gn ancy (Ch roni c) ? G estati on al (PIH, pree clam p sia)
? Eclamp sia ? Previ ou s pre term b irth ? Oth er previ ous poo r p reg nancy ou tco me (In clud es peri natal d eath, sma ll -fo r-gestation al a ge/ int rau te rine grow th re stri cte d birth) ? Pre gn ancy resul ted fro m i nfert ili ty treatmen t-I f ye s, ch eck all tha t ap ply: ? F ert ili ty- enha ncin g drug s, A rtif icia l inse mi nat i on or Int rau te rine i nsemin at io n ? Assi sted repro duct ive techn olo gy (e.g. , in vi tro fert ili zat ion (IVF ), ga me te i nt ra fa llo pia n transfer (GIF T)) ? Mo th er ha d a p revio us cesare an de live ry I f yes, how man y _ ___ ___ __ _ ? Non e of the a bove
41 . OBST ET RIC PR OC EDUR ES (Check al l th at a ppl y)
? Ce rvical ce rclag e
? T ocol ysis Extern al ce pha lic versi on: ? Succe ssfu l ? F ai led ? N one o f the ab ove
? O th er(Spe cify) _ ___ ___ ___ ___ ___ ___
42 . METH OD O F D ELIVERY A. W as deli very with forcep s a ttem p te d but un successful? ? Yes ? No B. W as del ivery wi th va cuum ext ractio n atte mpted bu t un successful ? ? Yes ? No C. F etal pr esen tat io n at b irth ? Cep hal ic ? B ree ch ? Othe r D. F i nal rou te and metho d of d eli very (Che ck o ne) ? Va gin al/Spo ntane ous ? Va gin al/F orcep s ? Va gin al/Vacu um ? C esare an I f ce sa rean , wa s a t ria l of l abo r a ttem p te d? ? Yes ? No
43 . ON SET O F LABO R (Ch eck a ll that app ly) ? Pre ma tu re Ru pture of th e Me mbran es (pro lon ged =1 2 hrs. ) ? Pre cipi to us Lab or (<3 hrs. ) ? Pro lon ged L abo r (= 2 0 hrs.) ? No ne of th e abo ve
45 . CHAR AC TER IST ICS OF LABO R AND D ELIVERY (Ch eck all tha t app ly)
? In duct io n of l abo r ? Augme ntation o f la bor ? Non -vertex prese ntat ion ? S te roid s (g luco cort icoi ds) fo r fetal l ung
m a tu rat ion recei ve d by th e mother pri or to d eli very
? Ant ibi ot ics recei ved by the mothe r d urin g lab or
? Cli nica l chori oamn ion it is dia gno sed du ri ng l ab or or m a te rnal tem pe rature > 38°C ( 100 .4 °F )
? M ode rate/hea vy m eco ni um stai ni ng of th e A mn iot i c f lui d
? Fe ta l intol eran ce of l abo r su ch th at o ne or m o re of th e fo llo win g act ion s w as ta ken: i n-u te ro r esusci tat i ve me asure s, further fetal a ssessmen t, or ope rative de live ry
? Epid ural o r sp ina l ane sth esia d urin g lab or ? Non e of the a bove
? Othe r(Speci fy) __ ___ ___ ___ ___ ___ __
46 . M ATER NAL MO RBID IT Y (Che ck a ll tha t ap ply) (Co mp li ca ti ons asso ciated w ith lab or and d eli very) ? Ma te rnal tran sfu sion ? T hi rd or fo urth deg ree pe ri ne al la ceration ? R upture d uterus ? U npl ann ed hystere cto my ? Ad mi ssio n to i ntensi ve care uni t ? U npl ann ed op erat in g room proce du re foll owi ng de live ry ? N one o f the ab ove
44 . IN FEC TIO NS PRESENT AN D/OR T REAT ED DUR IN G T HIS PREG NANC Y (C heck al l th at a ppl y) ? G on orrhe a ? Syp hil is ? C hl am ydia ? H epa ti ti s B ? H epa ti ti s C ? HIV ? N one o f the ab ove
NEW B O R N
47 . NEW BOR N MED IC AL RECO RD N UMBER
53 . ABN OR MAL CO NDIT IO NS O F T HE NEW BOR N (Che ck a ll that app ly) ? Assisted ven ti lat io n requ ired i mme dia tely fol lo win g deli very ? Assisted ven ti lat io n requ ired for m ore tha n si x h our s ? NICU ad m issio n ? New born g iven su rfa cta nt re pla cemen t th erap y ? Antibi ot ics recei ved by the ne wbo rn fo r suspe cte d neon atal sep sis ? Seizu re or serio us neu rolo gic dysfun cti on ? S ign if ican t bi rth i nju ry (ske letal fracture (s), pe ri ph eral nerve in jury, a nd /or sof t t i ssu e/soli d orga n hem or rhag e whi ch re qui res i nterven ti on) ? No ne of th e abo ve
? O ther(Sp ecify) ___ ___ ___ ___ ___ ___ _
54 . CO NG ENITAL AN OMAL IES OF T HE NEW BOR N (Che ck a ll that app ly) ? Anen ceph aly ? Meni ngo myelo cele /Sp ina b ifi da ? Cyan ot ic cong eni ta l hea rt di sease ? Con gen ital di aph ragmati c h erni a ? Om ph al ocel e ? Ga stro schisi s ? Lim b re duct io n defect (exclu din g cong enita l am putat i on and d warf in g syndro m es) ? Cle ft Lip w ith or witho ut C lef t Pa late ? Cle ft Pala te a lon e ? Dow n Syndro me ? Ka ryotype con fi rme d
? Ka ryotype pe ndi ng ? Su spected ch romoso ma l di sorde r ? Ka ryotype con fi rme d ? Ka ryotype pe ndi ng ? H yposp adi as ? N one o f the an omal ies li ste d abo ve
? Othe r(Speci fy) __ ___ ___ ___ ___ ___ __
48 . BIR TH WEIG HT (g ram s p referre d, spe cify u nit ) ___ ___ ___ ___ ___ ___ ___ _ ? gra ms ? lb/oz
49 . OBST ET RIC EST IMATE O F G ESTAT ION : _ ___ ___ ___ ___ ___ _ (co mp lete d weeks)
50 . APGAR SCO RE: Score at 5 mi nu te s:_ ___ ___ ___ ___ ____ __ ____ _ If 5 m in ute s co re is less th an 6 , Score at 10 m in utes: _ ___ ___ ___ ___ ___ ____ ___
51 . PLU RALIT Y - Sin gle , T win , T ri ple t, etc.
( Sp ecify)_ ____ __ ____ ___ ___ ___ ___ _
52 . IF NO T SING LE BIRT H - Born F irst , Seco nd, Th ird, etc (Speci fy) __ ___ ___ ___ ___ __
55 . W AS IN FAN T T RANSF ERRED W ITH IN 2 4 HO URS O F DEL IVER Y? ? Ye s ? No
IF YES, N AME O F F ACILITY INF ANT T RAN SFER RED T O:__ ___ ___ ___ ___ ___ ___ ___ ___ ___ ___ ____ __ ____ __ ____ __ ___
56 . IS INF ANT L IVING AT T IME OF REPO RT ? ? Yes ? No ? Infant tra nsferred , status unkn own
I f Infan t Expir ed, enter date o f dea th :
__ ___ / __ ___ _ / __ ___ ____ _ M M D D YYYY
57. IS T HE IN FANT BEIN G BREAST F ED AT DISCH ARG E?
? Yes ? No
58. MO TH ER RE FUSE D VACCIN AT ION ? YE S ? NO
59. VA CCINAT ION GIV EN A T HOS PIT AL ? YE S ? N O
60. HE PB VACCIN AT ION DAT E :
__ __ __/ _ __ ___ / _ ___ ___ ___ M M D D YYYY
61. HE PB VACCINA TIO N TIM E
62 . HE P B VA CCIN AT OR
63. HEP B M ANU FACT URE R
64. HE PB LO T NU MBER
65. HBIG V ACCINAT ION DA TE
__ __ __/ _ __ ___ / _ ___ ___ ___ M M D D YYYY
66. HBIG VACCIN AT ION T IME
67. H BI G V ACCINAT OR
68. HBIG MAN UFACT URE R
69. HBIG L OT N UMBE R

89
Appendix C- Death Certificate 2005 Version

90

91
Appendix D- Definition of Variables
Multi-variate regression models will be run using the following independent variables:
• race of mother o Black o Hispanic o White o Other
• age of mother at birth o <20 years old o 20-24 o 25-29 o 30-34 o 35 and older
• characteristics of the Ward in which the mother lives (Neighborhood disadvantage index)
o Percent Black o Percent unemployed o Percent married o Percent of renter occupied housing o Percent of vacant housing units o Median household income o Percent of families living in poverty o Percent of females who are head of household o Percent of people with a high school or less than high school degree
• Adequacy of prenatal care index (Kessner) o Number of prenatal visits o When prenatal care began o Gestational age o Birth weight
• mother’s marital status o Married o Single
• mother’s education o Less than high school o High school o Some college o College degree
• birth weight of infant (dichotomized) o low birth weight (under 2500 grams) o very low birth weight (under 1500 grams) o normal birth weight
• preterm birth (dichotomized) o preterm birth (birth before 35 weeks of gestation) o no preterm birth (births after 35 weeks of gestation)

92
Appendix E- Factor Analysis for Disadvantage Score by Ward
Appendix E cont.-Factor Score-Recoded for Disadvantage
Factor Score Recoded Frequency Percent
Cumulative
Frequency Cumulative Percent
Not Disadvantaged 19932 35.63 19932 35.63
Disadvantaged 36006 64.37 55938 100
Ward Factor Score Frequency Percent
3 -2.00281439 6475 11.58
4 -0.70367229 8066 14.42
2 -0.59705406 5391 9.64
6 0.01895338 6336 11.33
1 0.215697814 8058 14.41
5 0.31104977 6022 10.77
7 0.751912441 6730 12.03
8 1.145289867 8860 15.84
93
References
Alexander, G., Kogan, M., Bader, D., Carlo, W., Allen, M., & Mor, J. (2003). U.S.
birth Weight/Gestational Age-Specific, Neonatal Mortality: 1995-1997 Rates
for Whites, Hispanics, and Blacks. Pediatrics, 111 (1), 61-66.
Alio, A., Richman, A., Clayton, H., Jeffers, D.,Wathington, D., & Salihu, H. (2009).
An ecological approach to understanding black-White disparities in perinatal
mortality. Journal of Maternal and Child Health, , 13,495-499.
Arrivillaga M.(2009). Social position, gender role, and treatment adherence among
Colombian women living with HIV/AIDS: social determinants of health
approach. Rev Panama Salud Publica , 26 (6), 502-510.
Berger, C. (2001). Infant mortality: A reflection of the quality of health. Health and
Social Work, 26(4), 277-282.
Brosco, J. (1999). The Early History of the Infant Mortality Rate in America: “A
Reflection Upon the Past and a Prophecy of the Future”. Pediatrics, 13 (2), 478-
485.
Collins, J., Wambach, J., David, R., & Rankin, K. (2009a). Women's lifelong
exposure to neighborhood level poverty and low birth weight: A population
based study. Maternal Child Health J, 13, 326-333.
Collins, J., & Richard, W. (2009b). Racial disparity in low birth weight and infant
mortality. Clinical Perinatology, 36, 63-73.
Collins, J., David, R., Rankin, K., & Desireddi, J. (2009c). Transgenerational effects
of neighborhood poverty on low birth weight among African Americans in
Cook County, Illinois. American Journal of Epidemiology, 169(6), 712-717.
94
Centers for Disease Control. (2008). Infant Mortality Statistics from the 2005 Period
Linked Birth/Infant Death Data Set. National Vital Statistics Reports 57(2).
Table 2.http://www.cdc.gov/nchs/data/nvsr/nvsr57/nvsr57_02.pdf
DeCoster, J. (1998). Overview of Factor Analysis. Retrieved July 11th, 2010 from http://www.stat-help.com/notes.html
DeFranco, E., Lian, M., Muglia, L., & Schootman, M. (2008). Area-level poverty and
preterm birth risk: A population-based multi-level analysis. BMC Public Health,
8(316), 1-9.
Geronimus, A. (1996). Black/White differences in the relationship of maternal age to
birth weight: A population-based test of the weathering hypothesis. Social
Science and Medicine, 42(4), 589-597.
Geronimus, A., Hicken, M., Keene, D., & Bound, J. (2006). "Weathering" and age
patterns of allostatic load scores among blacks and Whites in the United States.
American Journal of Public Health, 96(5), 826-833.
Government of the District of Columbia (2007). Profile of Health and Socio-
Economic Indicators. Wards 1-8.
Healthy People 2010 (2009). Chapter on Maternal and Infant Child Health. Retrieved
April 24th, 2009 www.healthypeople.gov/document/pdf/volume2 / 16 mich.pdf
Jackson, F. M. (2007). Race, stress, and social support: Addressing the crisis in black
infant mortality. Washington DC: Joint Center for Political and Economic
Studies Health Policy Institute.
Johnson-Clarke, F. (2009). 2007 Infant Mortality Rate for the District of Columbia.
Washington DC. State Center for Health Statistics.
95
Johnson, A. El-Khorazaty, M. Hatcher, B. Wingrove, B. Milligan, R. Harris, C.
Richards, L.(2003). Determinants of Late Prenatal Care Utilization by African
American women in Washington, DC. Journal of Maternal and Child Health, 7
(2). 103-114.
Kleinman, J., & Kessel, S. (1987). Racial Differences in Low Birth Weight: Trends
and Risk Factors. New England Journal of Medicine, 317, 749-753.
Kotelchuck, M. (1994). An Evaluation of the Kessner Adequacy of Prenatal Care
Index and a Proposed Adequacy of Prenatal Care Utilization Index. American
Journal of Public Health, 84(9), 1414-1420.
Lee, K., Nigel, S., Gartner, L., Pearlman, M., & Gruss, L. (1980). Neonatal Mortality: An Analysis of the Recent Improvements in the United
States. American Journal of Public Health, 70 (1), 15-21.
MacDorman, M., & Matthews, T. (2008). Recent Trends in Infant Mortality in the
United States. Hyattsville: NCHS Data Brief
MacDorman, M., & Mathews, T. (2009a). The Challenge of Infant Mortality: Have
We Reached a Plateau? Hyattsville: Public Health Reports.
MacDorman, M., & Matthews, T. (2009b). Behind International Rankings of Infant
Mortality: How the United States Compares with Europe. Hyattsville: National
Center for Health Statistics.
Martin, J., Hamilton, B., Sutton, P., Ventura, S., Menacker, F., Kirmeyer, S., &
Matthews, T. (2009.) National Vital Statistics Reports. Births: Final Data for
2006. NVSS (57)7. 1-102.
96
Masi, C., Hawkley, L., Piotrowski, Z., & Pickett, K. (2007). Neighborhood economic
disadvantage, violent crime, group density, and pregnancy outcomes in a
diverse, urban population. Social Science and Medicine, 65, 2440-2457.
Matteson, D., Burr, J., & Marshall, J. (1998). Infant mortality: A multi-level analysis
of individual and community risk factors. Social Science and Medicine, 47(11),
1841-1854.
O’Campo, P., Xue, X., Wang, M., & Caughy, M. (1997). Neighborhood risk factors
for low birthweight in Baltimore: A multi-level analysis. American Journal of
Public Health, 87(7), 1113-1118.
Office of Planning, D.C. (2000). Ward 8 Profile www. Planning.dc.gov. Retrieved
October 12th, 2009.
Office of Planning, D.C. (2009).District of Columbia State Data Center, DC Hispanic
or Latino population 2007. www.planning.dc.gov Retrieved April 1st 2010.
Office of Planning, D.C. (2010).District of Columbia State Data Center, Poverty in
the District of Columbia 1970-2008. www.planning.dc.gov Retrieved April 1st
2010.
Paquette, D., Ryan, J. (2001). Brofenbrenners Ecological System Theory.
http://pt3.nl.edu/paquetteryanwebquest.pdf. Retrieved August 25th, 2010.
Pearl, M., Braveman, P., & Abrams, B. (2001). The relationship of neighborhood
socioeconomic characteristics to birth weight among 5 ethnic groups in
California. American Journal of Public Health, 91(11), 1808-1814.
97
Pickett, K., Collins, J., Masi, C., & Wilkinson, R. (2005). The effects of racial density
and income incongruity on pregnancy outcomes. Social Science and Medicine,
60, 2229-2238.
Raux, A. (2001a). Investigating neighborhood and area effects on health. American
Journal of Public Health, 91(11), 1783-1789.
Raux, A. (2001b). The contribution of maternal age to racial disparities
birthweight: A multilevel perspective. American Journal of Public Health,
91(11), 1815-1824.
Rowland-Hogue, C. B., & Douglas J. (2005). Stress model for research into preterm
delivery among black women. American Journal of Obstetrics and Gynecology,
192, s47-55.
Sappenfield, W., Buehler, J., Binkin, N., Hogue, C., Strauss, L., & Smith, J. (1987).
Differences in Neonatal and Postneonatal Mortality By Race, Birth weight, And Gestational Age. Public Health Reports, 102(2), 182-192.
Schempf, A., Branum, A., Lukacs, S., & Schoendforf, K. (2007). The Contribution of
Preterm Birth to the Black-White Infant Mortality Gap, 1990 and 2000.
American Journal of Public Health, 97(7), 1255-1260.
Singh, G., & Kogan, M. (2007). Persistent Socioeconomic Disparities in Infant,
Neonatal, and Postneonatal Mortality Rates in the United States, 1969-2001.
Pediatrics, 119, 928-939.
Taylor, C., Alexander, G., & Hepworth, J. (2005). Clustering of U.S. women
receiving no prenatal care: Differences in pregnancy outcomes and implications
for targeting interventions. Maternal and Child Health J, 9(2), 125-133.
98
Thomas, M. N. (2006). What's missing from the weathering hypothesis? American
Journal of Public Health, 96(6), 955.
U.S. Census Bureau. (2007). Poverty Thresholds. Retrieved from
http://www.census.gov/hhes/www/poverty/data/threshld/index.html
Walton, E. (2009). Residential Segregation and Birth Weight among Racial and
Ethnic Minorities in the United States. Journal of Health and Social Behavior,
50, 427-442.
Young, R., Declerq, E. (2009). Implications of subdividing marital status: Are
unmarried mothers with partners different from unmarried mothers without
partners? An exploratory analysis. Journal of Maternal and Child Health, 14,
209-214.


![Neighborhood Disadvantage, Stress, and Drug Use · PDF fileNeighborhood Disadvantage, Stress, and Drug Use Among ... our study builds on a growing body of ... points out, "[M]any stressful](https://img.pdfslide.net/doc/110x75/5a82a1747f8b9a0c748e3549/neighborhood-disadvantage-stress-and-drug-use-disadvantage-stress-and-drug.jpg)