Embed Size (px)
Citation preview
1
NEIGHBOURHOOD ATTAINMENT AMONG ETHNIC MINORITIES: A TEST OF THE SPATIAL ASSIMILATION THEORY IN ENGLAND AND
WALES
Carolina V. Zuccotti University of Brighton [email protected]
researchgate.net/profile/Carolina_Zuccotti
Draft: please do not cite or quote without permission
INTRODUCTION
The spatial segregation of ethnic minorities in the UK has now been well documented (Catney, 2015a; Catney, 2015b; Catney, 2015c; Johnston et al., 2002a; Johnston et al., 2002b; Johnston et al., 2015; Rees and Butt, 2004; Simpson, 2007; Simpson, 2012). Although few studies would claim the UK has ‘ghettos’ as those found for the black population in the US, there is ample evidence that non-white ethnic minorities ted to live close to other co-ethnics, particularly the Asian communities. There is also increasing research about the changing levels of segregation, with some authors being relatively optimistic about observed decreases in Dissimilarity Indexes (i.e. Catney, 2015a; Catney, 2015b; Catney, 2015c; Simpson, 2007) and others having more reserved opinions, based on observed counter-tendencies that are equally present (Carling, 2008; Johnston et al., 2015; Zuccotti, 2015b). However, less is known about the dynamics behind changes is spatial segregation and the elements involved in those changes.
On top of being connected with migration and natural change (Finney and Simpson, 2009), changes in spatial segregation are a consequence of residential movements. One of the first theorizations around this topic has been the classic and well-known model of spatial assimilation (Massey, 1985; Massey and Denton, 1985). This model states that as minorities integrate into the host society, adapting to the local culture and improving their socio-economic condition, they also move out of areas with high concentration of ethnic groups (which are often areas with high deprivation). Using a more strict definition (Logan and Alba, 1993), spatial assimilation has also been interpreted in terms of ‘equality of opportunities’, meaning that ethnic minorities reach similar chances of residing in or moving to more ‘desirable’ areas as the majoritarian population, given equality of conditions (i.e. socio-economic resources, education, etc.). Spatial assimilation should in principle help reducing the levels of spatial segregation, by making dispersion over space more equal across ethnic groups. However, the processes that this model describes do not always occur. Ethnic groups, and individuals within, have different opportunities and constrains regarding their choice of a place to live, as well as different preferences in terms of what constitutes a desirable location (Bolt and van Kempen, 2010; Crowder et al., 2006). The acknowledgment of these interconnected factors has led to the development of two other models of spatial integration: place stratification and ethnic enclave. These models state, respectively, that either due to external constraints (like discrimination in the housing market or harassment) or because of a preference to live close to co-ethnics, ethnic minorities might not disperse in the space over time. In other words, they might not necessarily move to areas where the white majoritarian predominate, and presumably, deprivation tends to be lower (Alba and Logan, 1993; Bolt and van Kempen, 2010; Logan and Alba, 1993; Schaake et al., 2010).
In this study I use a largescale longitudinal dataset of England and Wales, covering a 40-year period (1971-2011), in combination with aggregated Census data, to explore whether and to what extent ethnic minorities and the white British are equally likely to reside in or move to areas where the
2
share of white British is higher (and deprivation levels lower). In particular, I study transitions to these neighbourhoods (measured in 2011) for individuals with varied socio-economic resources when growing up and raised in areas with different shares of non-white population and deprivation levels (measured in 1971-1991). Furthermore, I explore the mediating role of education, social class and partner’s ethnicity (measured in 2001) in this transition. The focus is on second generation migrants, that is, on individuals who were mostly raised in the UK (i.e. either born in the UK or arrived at a young age). I distinguish the five main minority groups (Indian, Pakistani, Bangladeshi, Caribbean and African) and develop theoretical expectations based on the three models of neighbourhood attainment and on the characteristics of the groups.
The research questions of this paper, which aim at testing spatial assimilation, place stratification and ethnic enclave models, are: 1) Are ethnic minorities as likely as the white British to be in ‘whiter’ neighbourhoods, on equality of individual, household and neighbourhood characteristics? 2) Is the effect of acculturation (measured with education and partner’s ethnicity) and socio-economic resources (measured with social class) on the probability of being in ‘whiter’ neighbourhoods similar across different ethnic groups? 3) For those raised in neighbourhoods with a higher share of non-white population, are ethnic minorities as likely as the white British to move to ‘whiter’ neighbourhoods, given equality of characteristics? To my knowledge, this is the first study that looks at neighbourhood attainment among second generation migrants in the UK by means of combining individual, household and neighbourhood data, and for relatively a long time-span.
THEORY, MODEL OF ANALYSIS AND HYPOTHESES
Spatial assimilation and other models of spatial integration
First envisioned by the members of the Chicago School (Park, 1925) and, later on, formalized by Massey (1985), the model of spatial assimilation states that as immigrants acculturate and improve their socio-economic situation in destination, they also tend to transform these ‘gains’ into residential gains, moving to areas where the segregation of ethnic minorities is lower and where the socio-economic and living conditions are better. After this initial theorization by Massey (1985), the spatial assimilation model started to be widely used in studies of spatial integration of ethnic minorities. These studies have looked at the extent to which measures such as language proficiency, length of residence in the country, generation, education, class or income affect a residential movement (from more) to less deprived areas or (from more) to less ethnically segregated areas (see for example Alba and Logan, 1993; Alba et al., 1999; Bolt and van Kempen, 2010; Crowder et al., 2012; Crowder et al., 2006; Lersch, 2013; Schaake et al., 2013). The idea behind these studies is that ethnic minorities with more ‘assimilation resources’ will become more similar to the majoritarian population in terms of the characteristics of their neighbourhood of residence. This pattern has also been interpreted as ethnic minorities being more motivated to live in better neighbourhoods, and actually doing so once they acquire the means (Schaake et al., 2013). And it is also supported by the finding that more educated minorities are more likely to build relationships outside the own neighbourhood (de Palo et al., 2006), adding hence an extra reason to move out.
More recently, Logan and Alba (1993) argued that a stricter version of spatial assimilation would imply that all individuals have the same residential patterns/locations as the majoritarian population on equality of characteristics (such as socio-economic level or education). In this definition of spatial assimilation the focus is not so much on those who have higher resources to move, but on the entire ethnic minority population (i.e. both with high and low resources) and the opportunities they have when compared to equivalent white people. This definition, more linked to the idea of ‘equality of opportunities’ or ‘equality of outcomes given equality of initial conditions’, is very much
3
in line with later reformulations of the concept of assimilation itself (Alba and Nee, 2003; Portes and Zhou, 1993), where a stronger emphasis is given to initial socio-economic backgrounds.1
However, other factors may also play a role in terms of neighbourhood attainment, such as opportunities and constrains connected to the choice of a place to live, or the preferences of individuals. These factors have been highlighted by two alternative models of spatial integration: place stratification and ethnic enclave (Alba and Logan, 1993; Bolt and van Kempen, 2010; Logan and Alba, 1993). The place stratification model states that neighbourhoods, as social classes, can be hierarchized and therefore associated with different levels of quality of life and life chances for the people living in them (Alba and Logan, 1993). Most importantly, the hierarchy of places is seen as a means by which more affluent groups or groups with certain characteristics, such as a particular ethnicity, separate themselves – and hold fast to this separation – from less-affluent ones or from individuals from other ethnic groups. A way to keep this hierarchy functioning is, for example, through discrimination in the housing market or through harassment, something documented by many studies, including some conducted in the UK (Bolt et al., 2010; Bowes et al., 1997; Bowes et al., 2002; Peach, 1998; Phillips, 1998; Phillips, 2006). In terms of the spatial integration of ethnic minorities, this model then presupposes that even given equality of conditions, such as education or socio-economic resources, ethnic minorities will be less likely to move to more-affluent neighbourhoods or to areas in which the local population predominates. It assumes as well, that some particularly stigmatized groups might also get lower returns to a socio-economic improvement; that is, they will not be able to convert their socioeconomic gains into residential gains as do other groups. This is, for example, the case of black populations in the US (Alba and Logan, 1993; Logan and Alba, 1993). The place stratification model assumes then that ethnic minorities would want to move out of certain areas, or move into some others, but are held to their location by external factors like discrimination or harassment. This keeps segregation – and the hierarchy of areas – functioning, and with it, the possible negative consequences for the members living in those areas with the worst social and economic resources or with higher levels of deprivation (Bolt and van Kempen, 2010).
The ethnic enclave model (Bolt and van Kempen, 2010; Schaake et al., 2010), on the other hand, states that a person’s bonds with his/her own ethnic community will not necessarily weaken in the course of time. This would mean that ethnic minorities are not necessarily motivated to move to a ‘whiter’ area or simply prefer to stay in the ethnic neighbourhood, where they might take advantage of the benefits it offers. In this model, preferences – rather than constraints – play the major role in explaining why, for example, being in a good socio-economic class or having a good income does not necessarily imply moving out of an area with a high share of co-ethnics or an area with high levels of deprivation. Different groups, and even different households, have divergent ideas of what constitutes a desirable housing situation (Özüekren and van Kempen, 2002; Schaake et al., 2010). And for ethnic minorities, in particular, living close to co-ethnics might bring a whole range of benefits – i.e. groceries or restaurants with certain types of food, churches, social centres – that they might not find in an area with a higher share of the majoritarian population. Further, living among co-ethnics might bring a welcome sense of belonging to a certain community, as well as generate an ethnic identity. Note that the definition of ethnic enclave here is more linked to residential location than to work location, although these might be linked in practice (for a discussion on this topic refer to Portes and Jensen, 1989; Portes and Jensen, 1992; Sanders and Nee, 1987; Sanders and Nee, 1992).
1 A few decades earlier, Blau and Duncan (1967) had already emphasized this issue; more recently, studies have also revealed that the social background is important to understand ethnic minority integration (Platt 2007, Zuccotti 2015a).
4
The locational attainment model
In order to carry out the analysis, I follow (with some modifications) a model initially developed by Alba and Logan (Alba and Logan, 1993; Logan and Alba, 1993), called the ‘locational attainment model’. In this model, which they estimate separately for each group or ethnic minority, the characteristics of the neighbourhood of destination (Y) are set as a function of various cultural (X1) and socio-economic (X2) indicators:
Y = a + b1*X1+ b2*X2 + e (Equation 1)
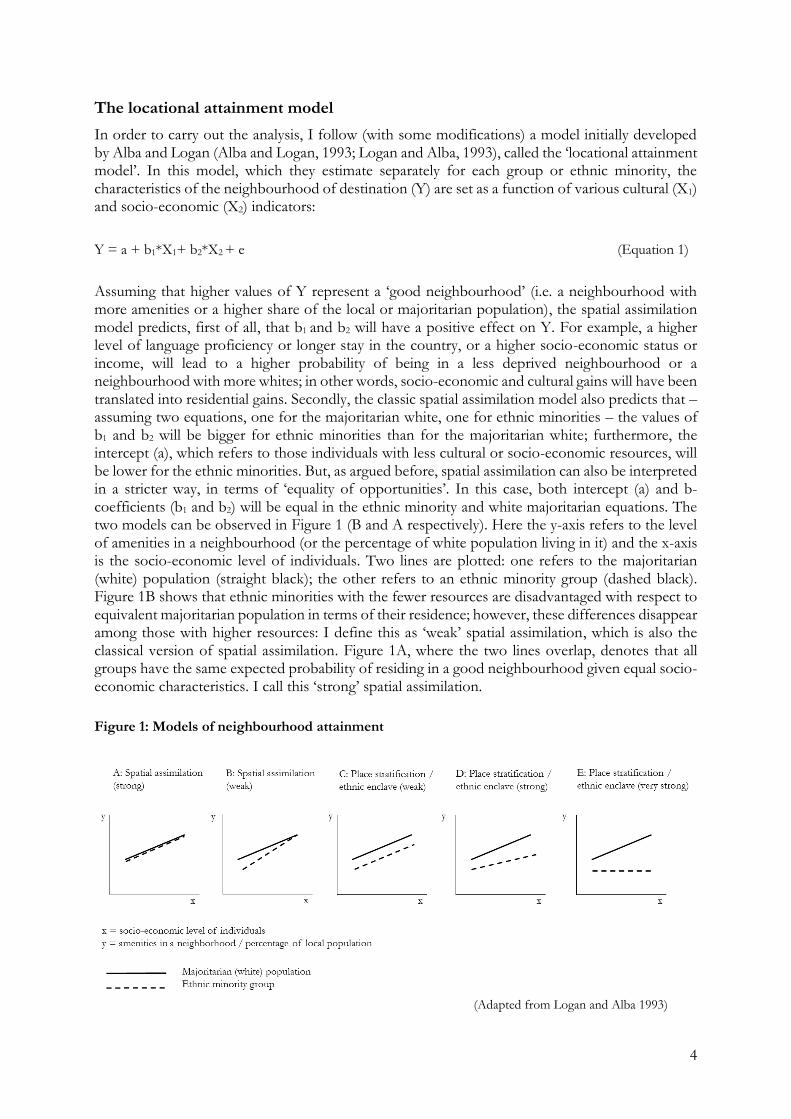
Assuming that higher values of Y represent a ‘good neighbourhood’ (i.e. a neighbourhood with more amenities or a higher share of the local or majoritarian population), the spatial assimilation model predicts, first of all, that b1 and b2 will have a positive effect on Y. For example, a higher level of language proficiency or longer stay in the country, or a higher socio-economic status or income, will lead to a higher probability of being in a less deprived neighbourhood or a neighbourhood with more whites; in other words, socio-economic and cultural gains will have been translated into residential gains. Secondly, the classic spatial assimilation model also predicts that – assuming two equations, one for the majoritarian white, one for ethnic minorities – the values of b1 and b2 will be bigger for ethnic minorities than for the majoritarian white; furthermore, the intercept (a), which refers to those individuals with less cultural or socio-economic resources, will be lower for the ethnic minorities. But, as argued before, spatial assimilation can also be interpreted in a stricter way, in terms of ‘equality of opportunities’. In this case, both intercept (a) and b-coefficients (b1 and b2) will be equal in the ethnic minority and white majoritarian equations. The two models can be observed in Figure 1 (B and A respectively). Here the y-axis refers to the level of amenities in a neighbourhood (or the percentage of white population living in it) and the x-axis is the socio-economic level of individuals. Two lines are plotted: one refers to the majoritarian (white) population (straight black); the other refers to an ethnic minority group (dashed black). Figure 1B shows that ethnic minorities with the fewer resources are disadvantaged with respect to equivalent majoritarian population in terms of their residence; however, these differences disappear among those with higher resources: I define this as ‘weak’ spatial assimilation, which is also the classical version of spatial assimilation. Figure 1A, where the two lines overlap, denotes that all groups have the same expected probability of residing in a good neighbourhood given equal socio-economic characteristics. I call this ‘strong’ spatial assimilation. Figure 1: Models of neighbourhood attainment
(Adapted from Logan and Alba 1993)
5
The place stratification and ethnic enclave models also call the attention to variations in the intercept (a) and in the values of the b-coefficients (b1 and b2) (see Figure 1: C, D and E). In the classical version of these models, defined here as the ‘weak’ version (following Logan and Alba (1993)), we observe that regardless of the socio-economic level of individuals, ethnic minority groups are always more likely to be found in deprived neighbourhoods or neighbourhoods with fewer whites, compared to the majoritarian population (Figure 1C). Following the place stratification model, this could be due, for example, to discrimination mechanisms in the housing market or to the relatively low level of acceptance by the majoritarian white of ethnic minorities; however, following the ethnic enclave model, the gap observed in Figure 1C might also be maintained due to preferences of ethnic minorities to reside close to co-ethnics. Moving to the last two graphs (Figure 1: D and E), Alba and Logan also argue that for the most stigmatized ethnic minority groups, acquiring a higher socio-economic status might give fewer or even no ‘returns’ in terms of the neighbourhood; that is, that they might find it more difficult to transform socio-economic gains into residential gains. We could also think that strong ethnic bonds can cause this phenomenon as well, preventing individuals from or encouraging them to avoid areas where the share of co-ethnics is low. This is what I have called ‘strong’ versions of place stratification and ethnic enclave models (Figure 1D). An extreme case would be the one seen in the last graph (Figure 1E), where there are no gains associated with a higher socio-economic status for the ethnic minority, what I define as ‘very strong’ place stratification and ethnic enclave models. Note, finally, that it could be argued that the ‘weak’ form of spatial assimilation has actually elements of the place stratification and ethnic enclave models, if spatial assimilation is to be interpreted in terms of ‘equality of outcomes given equality of conditions’ (‘strict’ definition).
What is important to capture in these examples is that the extent to which spatial assimilation vs. place stratification/ethnic enclave occur will depend on two (interrelated) factors. First, it will depend on the extent to which belonging to a certain ethnic minority group makes a difference when searching for a new neighbourhood, that is, whether groups differ in terms of the types of neighbourhoods they want/can access. Second, it will depend on the extent to which all groups have the same residential gains when they gain, in the example above, socio-economic status. These mechanisms, as we saw, might be related both to external factors or constraints – such as discrimination in the housing market – or to factors related to cultural differences and group preferences.
A proposal to identify ethnic enclave mechanisms
Following the locational attainment model, I have so far distinguished between spatial assimilation vs. place stratification and ethnic enclave; however, the distinction between the latter two is not theoretically developed in the locational attainment approach. In fact, distinguishing between place stratification and ethnic enclave is a difficult task unless we have specific information on preferences and constrains, for example, through detailed survey data or interviews. Although this information is not available in my data, I do have other information that might help in this task: that is the characteristics of the ‘origin neighbourhood’, i.e. the neighbourhood were individuals lived at a young age. In this study, therefore, I propose a new way to distinguish between mechanisms of place stratification and mechanisms of ethnic enclave.
The possibility of differentiating between preferences and constrains and, hence, between ethnic enclave and place stratification models, stems from the fact that I will study neighbourhood attainment in two different ways. On the one hand, I will study the probability of being in a neighbourhood with certain ‘good’ characteristics in 2011 (i.e. with a higher share of white British population). On the other hand, I will study the probability of improving the neighbourhood in terms of certain characteristics, that is, of moving from less-white areas to whiter ones. I am able
6
to do this thanks to the availability of neighbourhood data at different time points, especially, when individuals are young (in 1971-1991) and when they are adults (in 2011).
Why is the differentiation between an approach that studies ‘being’ in a certain neighbourhood and one that studies the ‘improvement’ of the neighbourhood relevant for identifying the model of ethnic enclave separately from that of place stratification? Think first of the place stratification model. There is no reason to assume that constraints such as discrimination or harassment will be applied unequally to those raised in more or less ethnically concentrated neighbourhoods. In other words, if discrimination, harassment or any other form of intolerance of ethnic minorities – which are the main mechanisms behind the place stratification model – is present, the place where ethnic minorities were raised should matter less, as compared to the fact that they indeed belong to an ethnic minority group.
However, while place stratification – if present – should apply more or less equally to all ethnic minorities no matter where they lived at a young age, I expect the ethnic enclave model to work differently. Specifically, I argue that cultural bonds and the desire for an ‘ethnic community’ will probably be stronger among those raised in areas with a higher share of minorities, given that they have been socialized in that environment. This leads me to infer that if I find that those raised in areas with higher ethnic concentration are particularly unlikely to move to whiter areas, processes related to the ethnic enclave model might be taking place.
Of course, from this study we cannot argue that if we do not observe a stronger penalty for those raised in areas with a high ethnic concentration there are no processes of ethnic enclave taking place. And we cannot disregard either that choices might reflect both the perceived risk of racial harassment outside the ethnic territory and the cultural forces associated with the maintenance of distinctive ethnic identities and lifestyles. (Peach, 1998; Phillips, 1998). Although these problems do not have a clear solution, nor we cannot really know if a constraint has been internalized as a preference, I expect this analysis to shed light on whether or not mechanisms of ethnic enclave are taking place.
Model of analysis
The model of analysis, inspired in Alba and Logan’s work, is based on different equations. These are shown in Table 1, together with a brief explanation of what they test in terms of theory. Y is the dependent variable: the share of non-white population in the neighbourhood of destination (measured in 2011); Z is the ethnic group of the individual (note that, contrary to Alba and Logan, I do not run a separate model for each ethnic group, but use interactions to make specific tests instead); X1, X2 and X3 refer to three key mediating variables (measured in 2001), i.e., what we could consider indicators of cultural/socio-economic assimilation or resources available to the individual, which would allow him/her to attain a ‘good’ neighbourhood or neighbourhood with a high share of white population: education (X1) and partners’ ethnicity (X2) as indicators of cultural assimilation2 and social class (X3) as indicator of socio-economic assimilation; W refers to the
2 Education has been more linked to socio-economic assimilation (Alba and Logan 1993; Alba and Nee 2003) than to acculturation, in as much as a person with more education can usually obtain more economic resources. However, I have two main reasons for assuming that it could be a good proxy of cultural assimilation. First, being more educated also means having spent more time in the educational system, which together with the family is one of the most important places for socialization. The level of education could then reflect the degree to which one is socialized in the culture and norms of the mainstream society. Alongside this, it has also been argued that education can have a separate impact on housing preferences and residential moves by providing, for example, a higher knowledge of how the housing market functions (Özüekren and van Kempen 2002). In the case of ethnic minorities, this might be an extra ‘cultural asset’ in terms knowing better ways of managing the housing market. The second reason is that I will study the effect of education after controlling for both background socio-economic factors and social class, which means that the role of education as a socio-economic asset will be, at least partly, removed. Partner’s ethnicity (or intermarriage), on the
7
characteristics of the ‘origin neighbourhood’, i.e. the share of non-white population of the neighbourhood when individuals were young (measured in 1971-1991); V, finally are other individual and social background controls, including deprivation level of the origin neighbourhood.
Table 1: Equations used in the analysis
Equations Explanation
Main effects
i Y(2011) = a + b1*Z + b2*X1(2001)+ b3*X2(2001) + b4*X3(2001) + b5*W + b6*V + e
‘Weak’ place stratification/ethnic enclave is true when Z is negative, i.e. when ethnic minorities are less likely to be in ‘whiter’ areas as compared to the white British, on equality of conditions. Conversely, ‘strong’ spatial assimilation occurs when the effect of Z is null.
Interactions with key mediating variables
ii Equation i + b7*Z*X1(2001) + e or b7*Z*X2(2001) + e or b7*Z*X3(2001) + e
‘Strong’ and/or ‘very strong’ place stratification/ethnic enclave occur when interactions are negative, i.e. the effects of X1, X2 and X3 are smaller for ethnic groups than for the white British. Conversely, when interactions are positive it speaks of ‘weak’ spatial assimilation.
Interactions with origin neighbourhood
iii Equation i + b6*Z*W + e
Ethnic enclave processes can be delineated when the interaction Z*W is negative, i.e. when the effect of having been raised in an areas with a high share of non-whites decreases the probabilities of being ‘whiter’ areas.
Notation: Y(2011)= share of non-whites in 2011; Z= ethnic group; X1(2001)= education in 2001; X2(2001)= social class in 2001; X3(2001)= ethnicity of the partner in 2001; W= share of non-whites in origin (1971-1991); V= social background variables (1971-1991) and other controls.
Equation i is the baseline equation, and controls for ethnic group (Z), the three key mediating variables, the non-white quintile in origin (W) and social background characteristics and other controls (V), including neighbourhood deprivation and household characteristics in origin. The main rationale behind this equation is: when the effect of being part of an ethnic minority (vs. being a white British person) is negative even after controlling for background characteristics and mediating variables, it indicates the presence of ‘weak’ place stratification or ethnic enclave models. Conversely, when the effect of Z is null, it means that residential opportunities of ethnic minorities are equivalent to that of the white British, and therefore, we can say that they experience ‘strong’ spatial assimilation.
Equation ii refers to three interactions between ethnic group and education, social class and partner’s ethnicity, which I test separately. When interactions are negative, we are in the presence of ‘strong’ and/or ‘very strong’ models of place stratification/ethnic enclave, i.e. education and social class gains and a white British partner have a smaller effect for ethnic minorities than for the white British; conversely, when interactions are positive it speaks of ‘weak’ spatial assimilation taking place, i.e. those better off in terms of education and social class and those with a white partner catch up the residential attainment of equivalent white British.
Equation iii, finally, serves to test the ethnic enclave model by adding an interaction between the ethnic group (Z) and the share of non-whites in the origin neighbourhood (W). If the gap between
other hand, has also been identified by Gordon (1964) as a separate dimension of assimilation; however, I believe it can be treated as a measure of acculturation if we consider having a partner of the majoritarian population as an indicator of a willingness not only to approach the mainstream culture, but also to incorporate elements of it.
8
ethnic minorities and white British is bigger among those raised in areas with higher share of non-whites, I will argue it points to processes of ethnic enclave.
Hypotheses
In general, I expect that more education, a white British partner and a higher social class in 2001 should have (to a greater or lesser extent) a general positive effect on the probability of being in an area with a lower share of non-white population for most groups; however, I believe that a situation like the one observed in Figure 1A is probably not realistic. Previous studies suggest that there are factors that might lead to the emergence of a ‘gap’, or to a difference in the ‘returns’ to cultural or socio-economic factors, between the white British and ethnic minorities. My expectations go, therefore, hand-in-hand with the models of place stratification and ethnic enclave, and with the ‘weak’ version of spatial assimilation.
In line with the place stratification model, the literature has shown that although there have been improvements in terms of discrimination in the housing market, especially after the Race Relations Act was introduced in 1967 and the local authority housing was opened to ethnic minorities in the late 1960s, ethnic minorities continue to experience difficulties when choosing where to live. These are related not only to discrimination by estate agents or housing corporations, but also to harassment that is known to occur in some areas, and that makes these areas, therefore, undesirable to ethnic minorities (Bowes et al., 2002; Phillips, 1998; Phillips, 2006). For example, a study among Caribbean persons living in council housing showed that their relocation decision-making was strongly motivated by fear of harassment (Phillips, 1998). This, according to the author, has helped to maintain racial segregation in the public sector, with minorities living in areas with the worst amenities, a pattern present from the initial settlement of the Caribbean population in public housing. Similarly, in a study in the city of Bradford, Phillips (2006) shows that although agents are aware of the law and unlikely to discriminate explicitly, they did disclose stereotyped views about and mistrust of the Asian (Pakistani and Bangladeshi) population. Moreover, some Asian residents manifested concerns about the social rented sector, as a ‘perpetuator’ of spatial divisions; fear of rejection and victimisation was also a recurrent theme. In relation to this, it is interesting to note that some authors agree on the fact that while the ‘otherness’ in the UK was, some decades ago, focused on the black and South Asian population in general, in more recent years this started to be linked to the Muslims, especially after 9/11 and the 2001 disturbances in northern England (Alexander, 2002; Bolt et al., 2010; Heath and Li, 2010; Phillips, 2006). This has rendered the Pakistani and Bangladeshi populations particularly vulnerable.
In line with the ethnic enclave model, another mechanism that would explain why we might observe a ‘gap’ between groups is that staying in an area with a high share of co-ethnics might bring ‘extra’ benefits. For example, Phillips (1998) showed that living close to family and community was an important consideration for Caribbean persons applying for council housing. This preference for living close to co-ethnics was also found among Pakistani and Bangladeshi populations (Bowes et al., 1997; Bowes et al., 2002; Phillips, 2006), although most strongly among the older populations and married women, who are also likely to move to their husband’s house after marriage (Finney, 2011). In fact, these populations might gain more from spatial concentration in terms their social life; moreover, among married women, living outside the community might mean more dependence on men and fewer possibilities of developing a personal network of acquaintances and friends. Supporting this idea, Peach (2005) has also argued that Asian populations have a strong sense of community, and that concepts of control, family honour and status dominate, for which the role of co-ethnics is likely to be stronger compared to other groups. Moreover, there is evidence that Pakistani and Bangladeshi populations are more likely to move shorter distances as compared to other groups (Finney and Simpson, 2008).
9
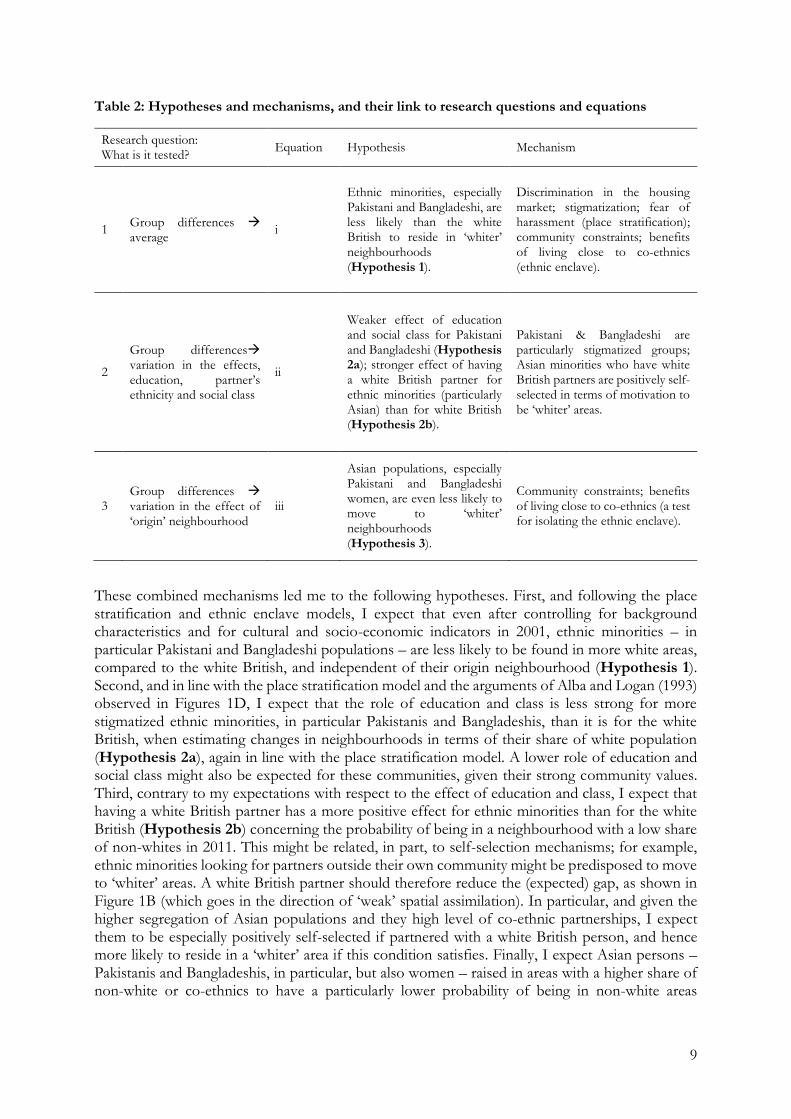
Table 2: Hypotheses and mechanisms, and their link to research questions and equations
Research question: What is it tested?
Equation Hypothesis Mechanism
1 Group differences average
i
Ethnic minorities, especially Pakistani and Bangladeshi, are less likely than the white British to reside in ‘whiter’ neighbourhoods (Hypothesis 1).
Discrimination in the housing market; stigmatization; fear of harassment (place stratification); community constraints; benefits of living close to co-ethnics (ethnic enclave).
2
Group differences variation in the effects, education, partner’s ethnicity and social class
ii
Weaker effect of education and social class for Pakistani and Bangladeshi (Hypothesis 2a); stronger effect of having a white British partner for ethnic minorities (particularly Asian) than for white British (Hypothesis 2b).
Pakistani & Bangladeshi are particularly stigmatized groups; Asian minorities who have white British partners are positively self-selected in terms of motivation to be ‘whiter’ areas.
3 Group differences variation in the effect of ‘origin’ neighbourhood
iii
Asian populations, especially Pakistani and Bangladeshi women, are even less likely to move to ‘whiter’ neighbourhoods (Hypothesis 3).
Community constraints; benefits of living close to co-ethnics (a test for isolating the ethnic enclave).
These combined mechanisms led me to the following hypotheses. First, and following the place stratification and ethnic enclave models, I expect that even after controlling for background characteristics and for cultural and socio-economic indicators in 2001, ethnic minorities – in particular Pakistani and Bangladeshi populations – are less likely to be found in more white areas, compared to the white British, and independent of their origin neighbourhood (Hypothesis 1). Second, and in line with the place stratification model and the arguments of Alba and Logan (1993) observed in Figures 1D, I expect that the role of education and class is less strong for more stigmatized ethnic minorities, in particular Pakistanis and Bangladeshis, than it is for the white British, when estimating changes in neighbourhoods in terms of their share of white population (Hypothesis 2a), again in line with the place stratification model. A lower role of education and social class might also be expected for these communities, given their strong community values. Third, contrary to my expectations with respect to the effect of education and class, I expect that having a white British partner has a more positive effect for ethnic minorities than for the white British (Hypothesis 2b) concerning the probability of being in a neighbourhood with a low share of non-whites in 2011. This might be related, in part, to self-selection mechanisms; for example, ethnic minorities looking for partners outside their own community might be predisposed to move to ‘whiter’ areas. A white British partner should therefore reduce the (expected) gap, as shown in Figure 1B (which goes in the direction of ‘weak’ spatial assimilation). In particular, and given the higher segregation of Asian populations and they high level of co-ethnic partnerships, I expect them to be especially positively self-selected if partnered with a white British person, and hence more likely to reside in a ‘whiter’ area if this condition satisfies. Finally, I expect Asian persons – Pakistanis and Bangladeshis, in particular, but also women – raised in areas with a higher share of non-white or co-ethnics to have a particularly lower probability of being in non-white areas
10
compared to those raised in whiter areas (Hypothesis 3). This would support the argument of the ethnic enclave, which seems to be particularly strong among Muslim populations.
DATA AND METHODS
Data structure and unit of analysis
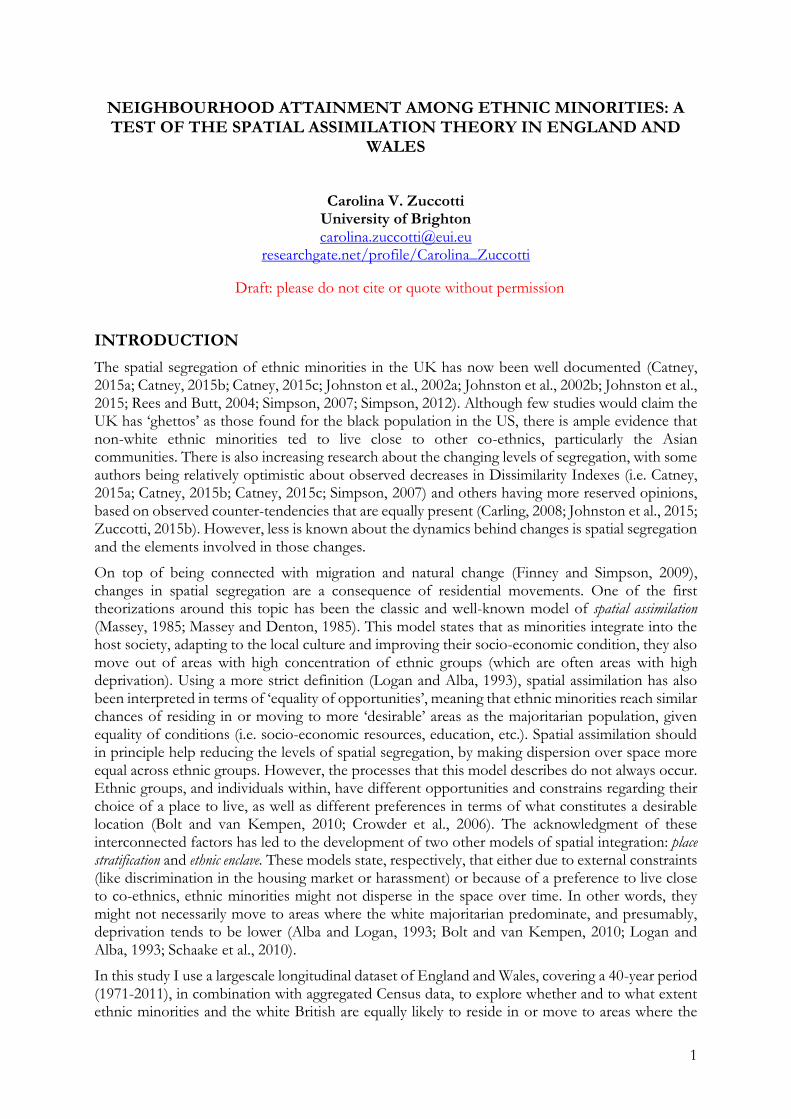
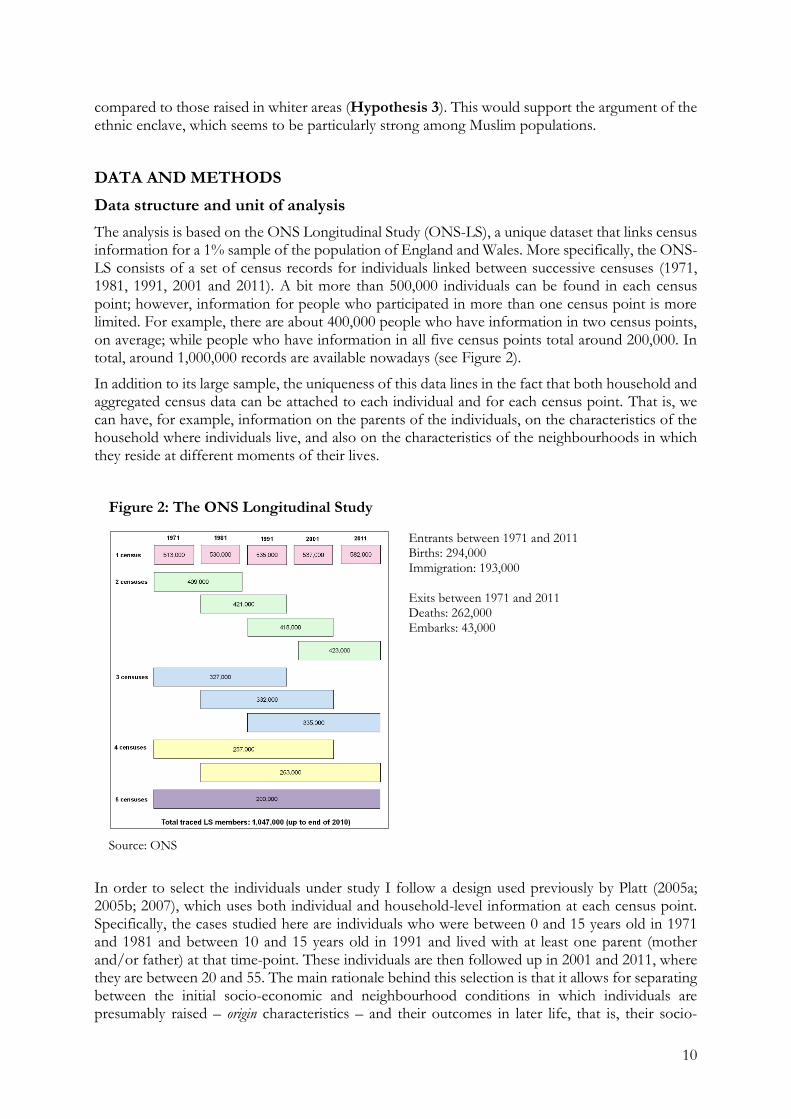
The analysis is based on the ONS Longitudinal Study (ONS-LS), a unique dataset that links census information for a 1% sample of the population of England and Wales. More specifically, the ONS-LS consists of a set of census records for individuals linked between successive censuses (1971, 1981, 1991, 2001 and 2011). A bit more than 500,000 individuals can be found in each census point; however, information for people who participated in more than one census point is more limited. For example, there are about 400,000 people who have information in two census points, on average; while people who have information in all five census points total around 200,000. In total, around 1,000,000 records are available nowadays (see Figure 2).
In addition to its large sample, the uniqueness of this data lines in the fact that both household and aggregated census data can be attached to each individual and for each census point. That is, we can have, for example, information on the parents of the individuals, on the characteristics of the household where individuals live, and also on the characteristics of the neighbourhoods in which they reside at different moments of their lives.
Figure 2: The ONS Longitudinal Study
Source: ONS
Entrants between 1971 and 2011 Births: 294,000 Immigration: 193,000 Exits between 1971 and 2011 Deaths: 262,000 Embarks: 43,000
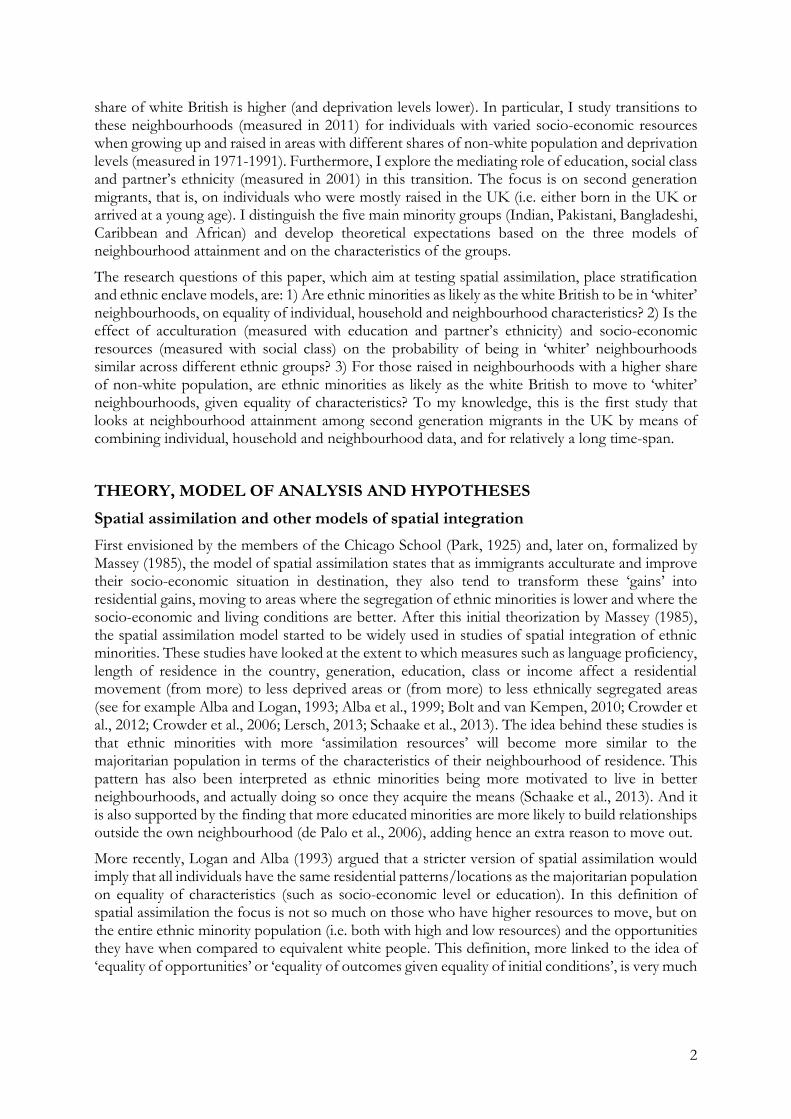
In order to select the individuals under study I follow a design used previously by Platt (2005a; 2005b; 2007), which uses both individual and household-level information at each census point. Specifically, the cases studied here are individuals who were between 0 and 15 years old in 1971 and 1981 and between 10 and 15 years old in 1991 and lived with at least one parent (mother and/or father) at that time-point. These individuals are then followed up in 2001 and 2011, where they are between 20 and 55. The main rationale behind this selection is that it allows for separating between the initial socio-economic and neighbourhood conditions in which individuals are presumably raised – origin characteristics – and their outcomes in later life, that is, their socio-
11
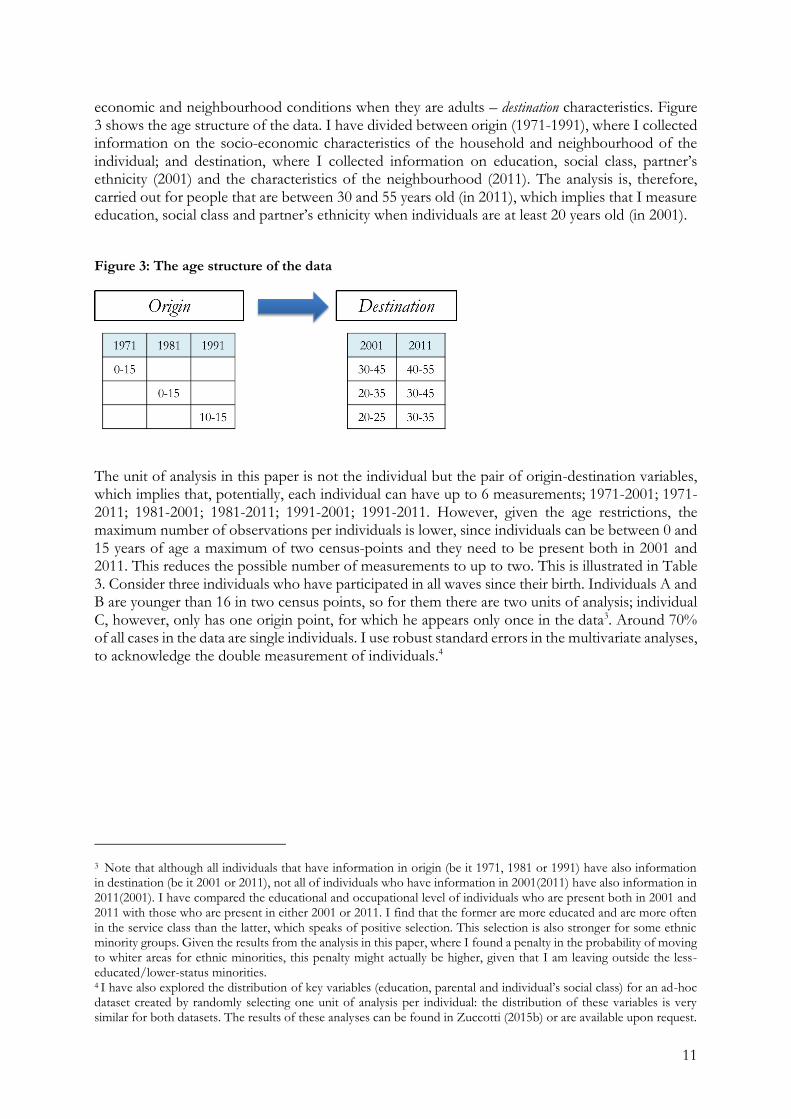
economic and neighbourhood conditions when they are adults – destination characteristics. Figure 3 shows the age structure of the data. I have divided between origin (1971-1991), where I collected information on the socio-economic characteristics of the household and neighbourhood of the individual; and destination, where I collected information on education, social class, partner’s ethnicity (2001) and the characteristics of the neighbourhood (2011). The analysis is, therefore, carried out for people that are between 30 and 55 years old (in 2011), which implies that I measure education, social class and partner’s ethnicity when individuals are at least 20 years old (in 2001).
Figure 3: The age structure of the data
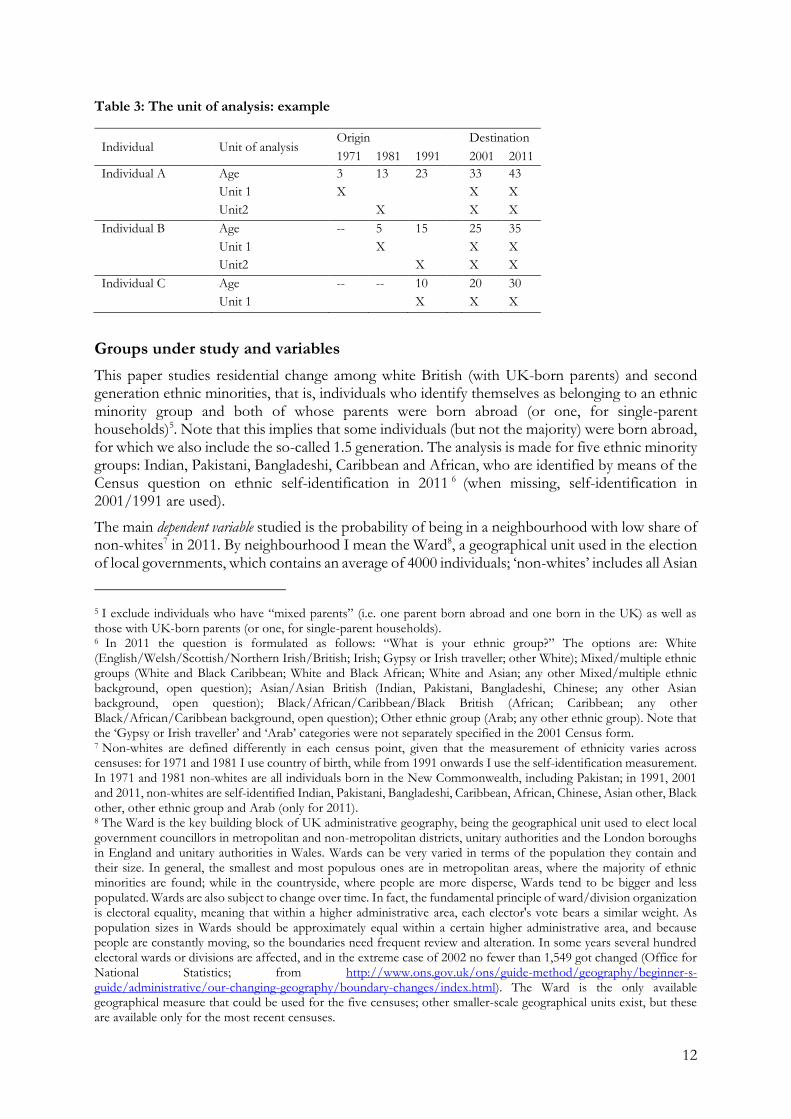
The unit of analysis in this paper is not the individual but the pair of origin-destination variables, which implies that, potentially, each individual can have up to 6 measurements; 1971-2001; 1971-2011; 1981-2001; 1981-2011; 1991-2001; 1991-2011. However, given the age restrictions, the maximum number of observations per individuals is lower, since individuals can be between 0 and 15 years of age a maximum of two census-points and they need to be present both in 2001 and 2011. This reduces the possible number of measurements to up to two. This is illustrated in Table 3. Consider three individuals who have participated in all waves since their birth. Individuals A and B are younger than 16 in two census points, so for them there are two units of analysis; individual C, however, only has one origin point, for which he appears only once in the data3. Around 70% of all cases in the data are single individuals. I use robust standard errors in the multivariate analyses, to acknowledge the double measurement of individuals.4
3 Note that although all individuals that have information in origin (be it 1971, 1981 or 1991) have also information in destination (be it 2001 or 2011), not all of individuals who have information in 2001(2011) have also information in 2011(2001). I have compared the educational and occupational level of individuals who are present both in 2001 and 2011 with those who are present in either 2001 or 2011. I find that the former are more educated and are more often in the service class than the latter, which speaks of positive selection. This selection is also stronger for some ethnic minority groups. Given the results from the analysis in this paper, where I found a penalty in the probability of moving to whiter areas for ethnic minorities, this penalty might actually be higher, given that I am leaving outside the less-educated/lower-status minorities. 4 I have also explored the distribution of key variables (education, parental and individual’s social class) for an ad-hoc dataset created by randomly selecting one unit of analysis per individual: the distribution of these variables is very similar for both datasets. The results of these analyses can be found in Zuccotti (2015b) or are available upon request.
12
Table 3: The unit of analysis: example
Individual Unit of analysis Origin Destination
1971 1981 1991 2001 2011
Individual A Age 3 13 23 33 43
Unit 1 X X X
Unit2 X X X
Individual B Age -- 5 15 25 35
Unit 1 X X X
Unit2 X X X
Individual C Age -- -- 10 20 30
Unit 1 X X X
Groups under study and variables
This paper studies residential change among white British (with UK-born parents) and second generation ethnic minorities, that is, individuals who identify themselves as belonging to an ethnic minority group and both of whose parents were born abroad (or one, for single-parent households)5. Note that this implies that some individuals (but not the majority) were born abroad, for which we also include the so-called 1.5 generation. The analysis is made for five ethnic minority groups: Indian, Pakistani, Bangladeshi, Caribbean and African, who are identified by means of the Census question on ethnic self-identification in 2011 6 (when missing, self-identification in 2001/1991 are used).
The main dependent variable studied is the probability of being in a neighbourhood with low share of non-whites7 in 2011. By neighbourhood I mean the Ward8, a geographical unit used in the election of local governments, which contains an average of 4000 individuals; ‘non-whites’ includes all Asian
5 I exclude individuals who have “mixed parents” (i.e. one parent born abroad and one born in the UK) as well as those with UK-born parents (or one, for single-parent households). 6 In 2011 the question is formulated as follows: “What is your ethnic group?” The options are: White (English/Welsh/Scottish/Northern Irish/British; Irish; Gypsy or Irish traveller; other White); Mixed/multiple ethnic groups (White and Black Caribbean; White and Black African; White and Asian; any other Mixed/multiple ethnic background, open question); Asian/Asian British (Indian, Pakistani, Bangladeshi, Chinese; any other Asian background, open question); Black/African/Caribbean/Black British (African; Caribbean; any other Black/African/Caribbean background, open question); Other ethnic group (Arab; any other ethnic group). Note that the ‘Gypsy or Irish traveller’ and ‘Arab’ categories were not separately specified in the 2001 Census form. 7 Non-whites are defined differently in each census point, given that the measurement of ethnicity varies across censuses: for 1971 and 1981 I use country of birth, while from 1991 onwards I use the self-identification measurement. In 1971 and 1981 non-whites are all individuals born in the New Commonwealth, including Pakistan; in 1991, 2001 and 2011, non-whites are self-identified Indian, Pakistani, Bangladeshi, Caribbean, African, Chinese, Asian other, Black other, other ethnic group and Arab (only for 2011). 8 The Ward is the key building block of UK administrative geography, being the geographical unit used to elect local government councillors in metropolitan and non-metropolitan districts, unitary authorities and the London boroughs in England and unitary authorities in Wales. Wards can be very varied in terms of the population they contain and their size. In general, the smallest and most populous ones are in metropolitan areas, where the majority of ethnic minorities are found; while in the countryside, where people are more disperse, Wards tend to be bigger and less populated. Wards are also subject to change over time. In fact, the fundamental principle of ward/division organization is electoral equality, meaning that within a higher administrative area, each elector's vote bears a similar weight. As population sizes in Wards should be approximately equal within a certain higher administrative area, and because people are constantly moving, so the boundaries need frequent review and alteration. In some years several hundred electoral wards or divisions are affected, and in the extreme case of 2002 no fewer than 1,549 got changed (Office for National Statistics; from http://www.ons.gov.uk/ons/guide-method/geography/beginner-s-guide/administrative/our-changing-geography/boundary-changes/index.html). The Ward is the only available geographical measure that could be used for the five censuses; other smaller-scale geographical units exist, but these are available only for the most recent censuses.
13
and Black groups, excluding mixed-white groups. Neighbourhood information that was attached to individuals comes from the Census, where the number of non-white population was collected at the Ward level. Neighbourhood information is expressed in population-weighted quintiles: quintile 5 contains the Wards with the highest share of non-whites where 20% of the non-white population lives; while quintile 1 contains the Wards with smallest share of non-whites where 20% of non-white individuals live. The drawback of using quintiles is that we lose information: unfortunately, this is a limitation of the data connected to disclosure policies established by the Office for National Statistics, the organism who delivers the data. On the positive side, the use of quintiles facilitates comparisons over time, given that it is a relative measure of neighbourhood composition: in a context where non-white ethnic minorities have increased from 2% (1971) to 12% (2011) of the total population, a relative measure is actually very desirable.
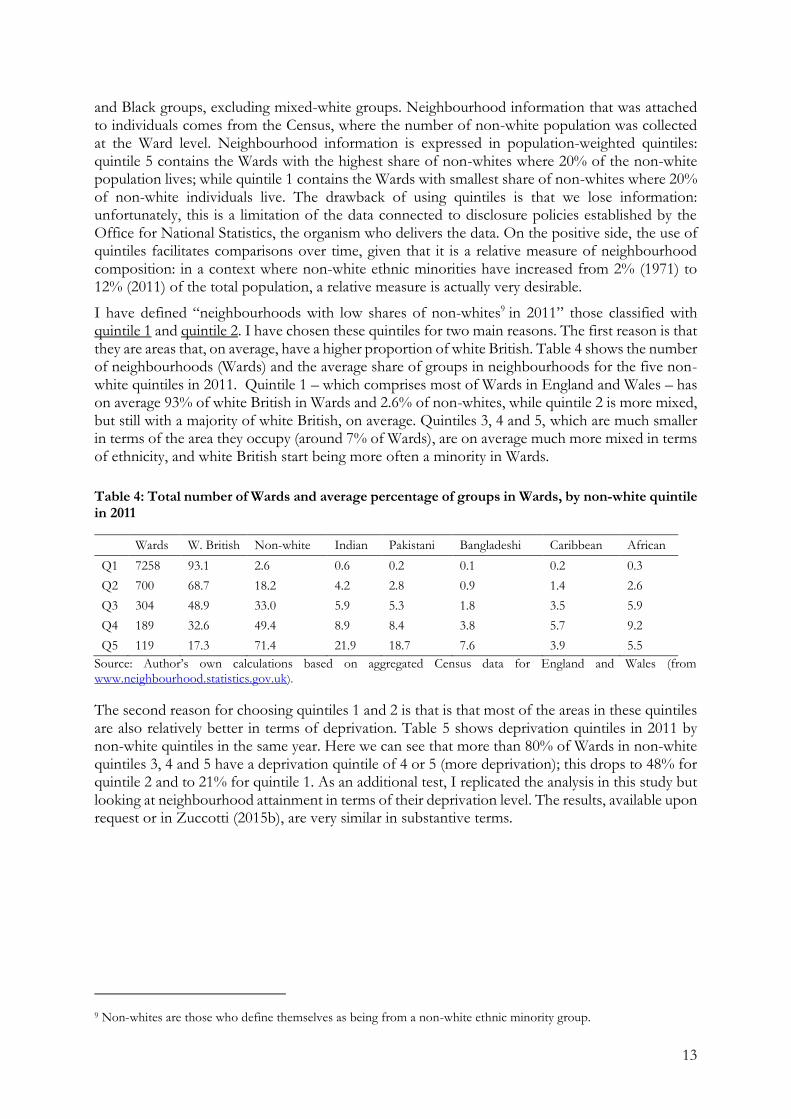
I have defined “neighbourhoods with low shares of non-whites9 in 2011” those classified with quintile 1 and quintile 2. I have chosen these quintiles for two main reasons. The first reason is that they are areas that, on average, have a higher proportion of white British. Table 4 shows the number of neighbourhoods (Wards) and the average share of groups in neighbourhoods for the five non-white quintiles in 2011. Quintile 1 – which comprises most of Wards in England and Wales – has on average 93% of white British in Wards and 2.6% of non-whites, while quintile 2 is more mixed, but still with a majority of white British, on average. Quintiles 3, 4 and 5, which are much smaller in terms of the area they occupy (around 7% of Wards), are on average much more mixed in terms of ethnicity, and white British start being more often a minority in Wards.
Table 4: Total number of Wards and average percentage of groups in Wards, by non-white quintile in 2011
Wards W. British Non-white Indian Pakistani Bangladeshi Caribbean African
Q1 7258 93.1 2.6 0.6 0.2 0.1 0.2 0.3
Q2 700 68.7 18.2 4.2 2.8 0.9 1.4 2.6
Q3 304 48.9 33.0 5.9 5.3 1.8 3.5 5.9
Q4 189 32.6 49.4 8.9 8.4 3.8 5.7 9.2
Q5 119 17.3 71.4 21.9 18.7 7.6 3.9 5.5
Source: Author’s own calculations based on aggregated Census data for England and Wales (from www.neighbourhood.statistics.gov.uk).
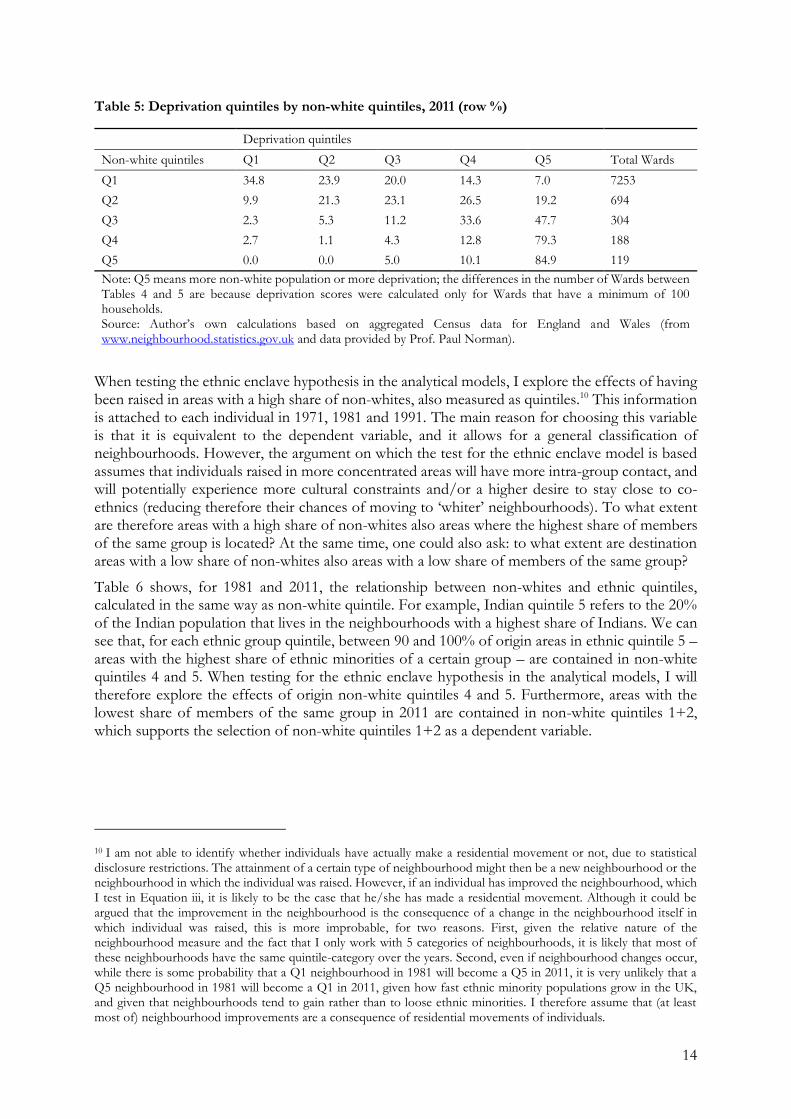
The second reason for choosing quintiles 1 and 2 is that is that most of the areas in these quintiles are also relatively better in terms of deprivation. Table 5 shows deprivation quintiles in 2011 by non-white quintiles in the same year. Here we can see that more than 80% of Wards in non-white quintiles 3, 4 and 5 have a deprivation quintile of 4 or 5 (more deprivation); this drops to 48% for quintile 2 and to 21% for quintile 1. As an additional test, I replicated the analysis in this study but looking at neighbourhood attainment in terms of their deprivation level. The results, available upon request or in Zuccotti (2015b), are very similar in substantive terms.
9 Non-whites are those who define themselves as being from a non-white ethnic minority group.
14
Table 5: Deprivation quintiles by non-white quintiles, 2011 (row %)
Deprivation quintiles
Non-white quintiles Q1 Q2 Q3 Q4 Q5 Total Wards
Q1 34.8 23.9 20.0 14.3 7.0 7253
Q2 9.9 21.3 23.1 26.5 19.2 694
Q3 2.3 5.3 11.2 33.6 47.7 304
Q4 2.7 1.1 4.3 12.8 79.3 188
Q5 0.0 0.0 5.0 10.1 84.9 119
Note: Q5 means more non-white population or more deprivation; the differences in the number of Wards between Tables 4 and 5 are because deprivation scores were calculated only for Wards that have a minimum of 100 households. Source: Author’s own calculations based on aggregated Census data for England and Wales (from www.neighbourhood.statistics.gov.uk and data provided by Prof. Paul Norman).
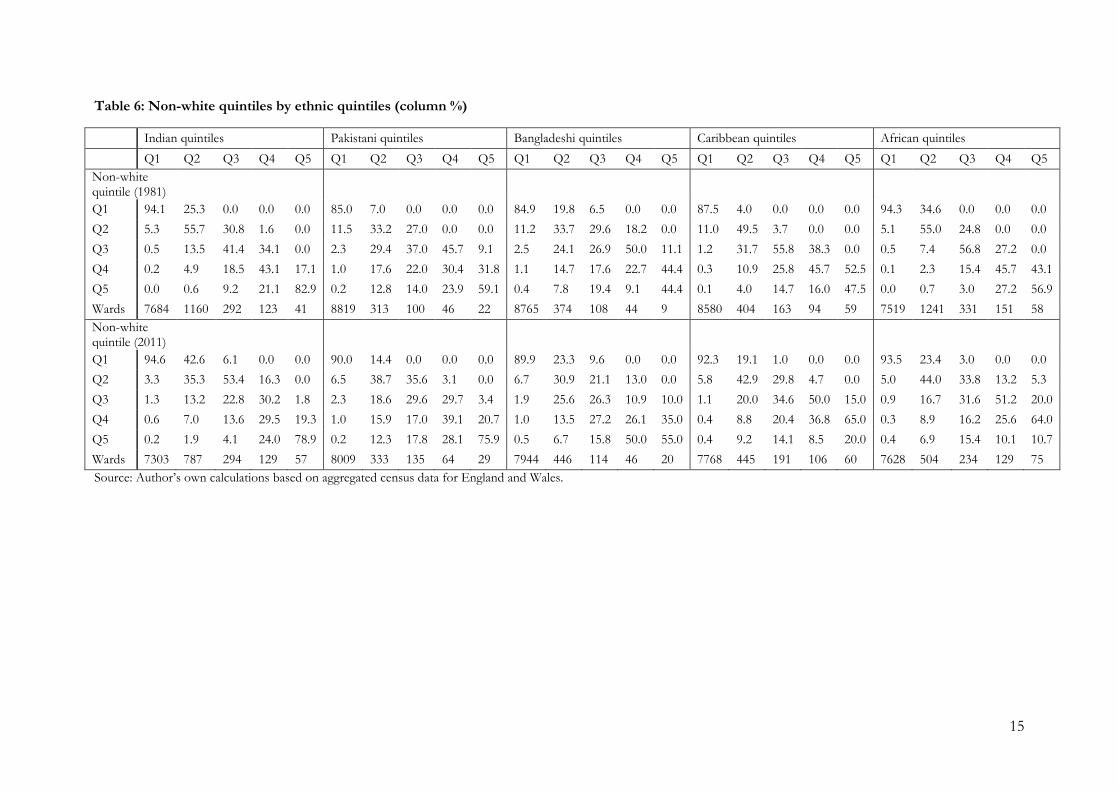
When testing the ethnic enclave hypothesis in the analytical models, I explore the effects of having been raised in areas with a high share of non-whites, also measured as quintiles.10 This information is attached to each individual in 1971, 1981 and 1991. The main reason for choosing this variable is that it is equivalent to the dependent variable, and it allows for a general classification of neighbourhoods. However, the argument on which the test for the ethnic enclave model is based assumes that individuals raised in more concentrated areas will have more intra-group contact, and will potentially experience more cultural constraints and/or a higher desire to stay close to co-ethnics (reducing therefore their chances of moving to ‘whiter’ neighbourhoods). To what extent are therefore areas with a high share of non-whites also areas where the highest share of members of the same group is located? At the same time, one could also ask: to what extent are destination areas with a low share of non-whites also areas with a low share of members of the same group?
Table 6 shows, for 1981 and 2011, the relationship between non-whites and ethnic quintiles, calculated in the same way as non-white quintile. For example, Indian quintile 5 refers to the 20% of the Indian population that lives in the neighbourhoods with a highest share of Indians. We can see that, for each ethnic group quintile, between 90 and 100% of origin areas in ethnic quintile 5 – areas with the highest share of ethnic minorities of a certain group – are contained in non-white quintiles 4 and 5. When testing for the ethnic enclave hypothesis in the analytical models, I will therefore explore the effects of origin non-white quintiles 4 and 5. Furthermore, areas with the lowest share of members of the same group in 2011 are contained in non-white quintiles 1+2, which supports the selection of non-white quintiles 1+2 as a dependent variable.
10 I am not able to identify whether individuals have actually make a residential movement or not, due to statistical disclosure restrictions. The attainment of a certain type of neighbourhood might then be a new neighbourhood or the neighbourhood in which the individual was raised. However, if an individual has improved the neighbourhood, which I test in Equation iii, it is likely to be the case that he/she has made a residential movement. Although it could be argued that the improvement in the neighbourhood is the consequence of a change in the neighbourhood itself in which individual was raised, this is more improbable, for two reasons. First, given the relative nature of the neighbourhood measure and the fact that I only work with 5 categories of neighbourhoods, it is likely that most of these neighbourhoods have the same quintile-category over the years. Second, even if neighbourhood changes occur, while there is some probability that a Q1 neighbourhood in 1981 will become a Q5 in 2011, it is very unlikely that a Q5 neighbourhood in 1981 will become a Q1 in 2011, given how fast ethnic minority populations grow in the UK, and given that neighbourhoods tend to gain rather than to loose ethnic minorities. I therefore assume that (at least most of) neighbourhood improvements are a consequence of residential movements of individuals.
15
Table 6: Non-white quintiles by ethnic quintiles (column %)
Indian quintiles Pakistani quintiles Bangladeshi quintiles Caribbean quintiles African quintiles
Q1 Q2 Q3 Q4 Q5 Q1 Q2 Q3 Q4 Q5 Q1 Q2 Q3 Q4 Q5 Q1 Q2 Q3 Q4 Q5 Q1 Q2 Q3 Q4 Q5
Non-white quintile (1981)
Q1 94.1 25.3 0.0 0.0 0.0 85.0 7.0 0.0 0.0 0.0 84.9 19.8 6.5 0.0 0.0 87.5 4.0 0.0 0.0 0.0 94.3 34.6 0.0 0.0 0.0
Q2 5.3 55.7 30.8 1.6 0.0 11.5 33.2 27.0 0.0 0.0 11.2 33.7 29.6 18.2 0.0 11.0 49.5 3.7 0.0 0.0 5.1 55.0 24.8 0.0 0.0
Q3 0.5 13.5 41.4 34.1 0.0 2.3 29.4 37.0 45.7 9.1 2.5 24.1 26.9 50.0 11.1 1.2 31.7 55.8 38.3 0.0 0.5 7.4 56.8 27.2 0.0
Q4 0.2 4.9 18.5 43.1 17.1 1.0 17.6 22.0 30.4 31.8 1.1 14.7 17.6 22.7 44.4 0.3 10.9 25.8 45.7 52.5 0.1 2.3 15.4 45.7 43.1
Q5 0.0 0.6 9.2 21.1 82.9 0.2 12.8 14.0 23.9 59.1 0.4 7.8 19.4 9.1 44.4 0.1 4.0 14.7 16.0 47.5 0.0 0.7 3.0 27.2 56.9
Wards 7684 1160 292 123 41 8819 313 100 46 22 8765 374 108 44 9 8580 404 163 94 59 7519 1241 331 151 58
Non-white quintile (2011)
Q1 94.6 42.6 6.1 0.0 0.0 90.0 14.4 0.0 0.0 0.0 89.9 23.3 9.6 0.0 0.0 92.3 19.1 1.0 0.0 0.0 93.5 23.4 3.0 0.0 0.0
Q2 3.3 35.3 53.4 16.3 0.0 6.5 38.7 35.6 3.1 0.0 6.7 30.9 21.1 13.0 0.0 5.8 42.9 29.8 4.7 0.0 5.0 44.0 33.8 13.2 5.3
Q3 1.3 13.2 22.8 30.2 1.8 2.3 18.6 29.6 29.7 3.4 1.9 25.6 26.3 10.9 10.0 1.1 20.0 34.6 50.0 15.0 0.9 16.7 31.6 51.2 20.0
Q4 0.6 7.0 13.6 29.5 19.3 1.0 15.9 17.0 39.1 20.7 1.0 13.5 27.2 26.1 35.0 0.4 8.8 20.4 36.8 65.0 0.3 8.9 16.2 25.6 64.0
Q5 0.2 1.9 4.1 24.0 78.9 0.2 12.3 17.8 28.1 75.9 0.5 6.7 15.8 50.0 55.0 0.4 9.2 14.1 8.5 20.0 0.4 6.9 15.4 10.1 10.7
Wards 7303 787 294 129 57 8009 333 135 64 29 7944 446 114 46 20 7768 445 191 106 60 7628 504 234 129 75
Source: Author’s own calculations based on aggregated census data for England and Wales.
16
Moving to the other variables used in the analysis, the three main mediating variables, measured in 2001, are the following: education, measured with a 3-category variable (Level 1 or less, Levels 2+3 and Level 4+); social class, measured with a 4-category variable (Manual, Petit Bourgeoisie, Intermediate and Professional/Managerial; and partner’s ethnicity: measured with a 4-category variable (no partner, white British, non-white and other).
Other controls include background characteristics in origin (measured in 1971-1991) and other individual and census-related variables. Among social-background variables we have: parental social class (measured with the EGP Class Schema (Erikson and Goldthorpe, 1992)), tenure (owner, social rent and private rent), number of cars (0, 1 and 2+), number of persons per room (over 1.5; 1.5; over 1 but less than 1.5; over 0.75 but less than 1; 0.75; over 0.5 but less than 0.75; and 0.5) and neighbourhood deprivation (measured with population-weighted quintiles). They analyses also controls for age, number of census points in which the individual participated and the origin year (1971, 1981, and 1991).
Note: some cell counts, percentages and totals shown in the tables created with ONS-LS data have been modified in order to comply with publication rules established by the Office for National Statistics. These modifications, however, do not affect the main findings derived from the regression models.
The permission of the Office for National Statistics to use the Longitudinal Study is gratefully acknowledged, as is the help provided by staff of the Centre for Longitudinal Study Information & User Support (CeLSIUS). CeLSIUS is supported by the ESRC Census of Population Programme (Award Ref: ES/K000365/1). The authors alone are responsible for the interpretation of the data.
This work contains statistical data from ONS, which is Crown Copyright. The use of the ONS statistical data in this work does not imply the endorsement of the ONS in relation to the interpretation or analysis of the statistical data. This work uses research datasets, which may not exactly reproduce National Statistics aggregates.
ANALYSIS
Descriptive statistics
Table 7 shows the percentage of each ethnic group residing in a neighbourhood with a low share of non-white population (quintiles 1+2) by gender. Most of White British in our sample are located in these quintiles in 2011; around 50% of Indians are also located here, while the proportions reduce for the other ethnic minority groups. These distributions – the starting point for the coming analyses – are, in part, a consequence of the way in which the dependent neighbourhood variable is constructed. Ethnic minorities are spatially segregated, and we expect them to reside in areas where the share of non-whites is lower. The next two tables (Tables 8 and 9) show to what extent the probability of residing in Quintile 1+2 is related to the three selected mediating variables and the share of non-whites in the origin neighbourhood.
Tables 8 shows the role of education, social class and partner’s ethnicity (measured in 2001) in neighbourhood attainment, for pooled ethnic minorities and white British, separated by gender. We observe that all three variables improve the probabilities of being in a neighbourhood with a low share of non-whites in 2011 for the ethnic minorities. Having a Level 4+ education gives ethnic minorities around 12-14% points more chances of being in Q1+2 in 2011 compared to having Level 1 or less. Similarly, ethnic minorities with a service class position in 2001 have around 12% (men) and 17% (women) greater chance of being in a whiter neighbourhood in 2011, compared to having a manual class. Finally, ethnic minorities are also more likely to be in a whiter neighbourhood if partnered with a white British. For the white British population, on the other hand, the probabilities of being in a white neighbourhood in 2011 do not seem to be strongly
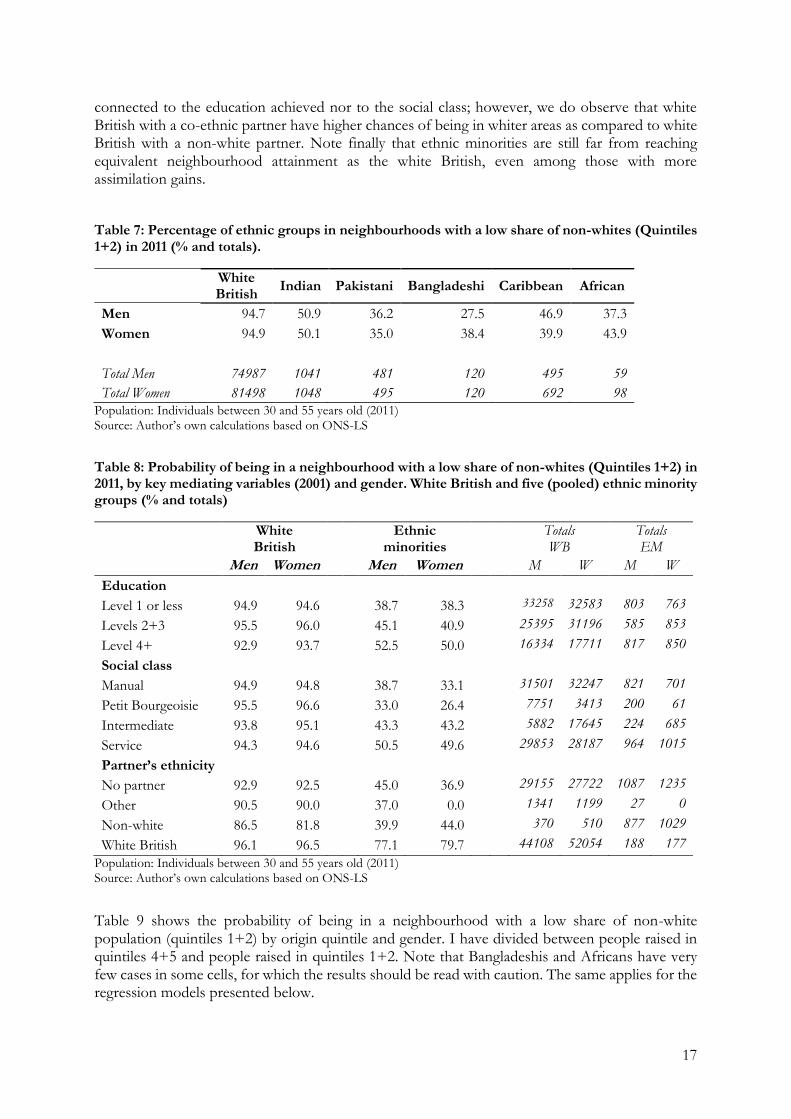
17
connected to the education achieved nor to the social class; however, we do observe that white British with a co-ethnic partner have higher chances of being in whiter areas as compared to white British with a non-white partner. Note finally that ethnic minorities are still far from reaching equivalent neighbourhood attainment as the white British, even among those with more assimilation gains.
Table 7: Percentage of ethnic groups in neighbourhoods with a low share of non-whites (Quintiles 1+2) in 2011 (% and totals).
White British
Indian Pakistani Bangladeshi Caribbean African
Men 94.7 50.9 36.2 27.5 46.9 37.3
Women 94.9 50.1 35.0 38.4 39.9 43.9
Total Men 74987 1041 481 120 495 59
Total Women 81498 1048 495 120 692 98 Population: Individuals between 30 and 55 years old (2011) Source: Author’s own calculations based on ONS-LS
Table 8: Probability of being in a neighbourhood with a low share of non-whites (Quintiles 1+2) in 2011, by key mediating variables (2001) and gender. White British and five (pooled) ethnic minority groups (% and totals)
White British
Ethnic minorities
Totals WB
Totals EM
Men Women Men Women M W M W
Education
Level 1 or less 94.9 94.6 38.7 38.3 33258 32583 803 763
Levels 2+3 95.5 96.0 45.1 40.9 25395 31196 585 853
Level 4+ 92.9 93.7 52.5 50.0 16334 17711 817 850
Social class
Manual 94.9 94.8 38.7 33.1 31501 32247 821 701
Petit Bourgeoisie 95.5 96.6 33.0 26.4 7751 3413 200 61
Intermediate 93.8 95.1 43.3 43.2 5882 17645 224 685
Service 94.3 94.6 50.5 49.6 29853 28187 964 1015
Partner’s ethnicity
No partner 92.9 92.5 45.0 36.9 29155 27722 1087 1235
Other 90.5 90.0 37.0 0.0 1341 1199 27 0
Non-white 86.5 81.8 39.9 44.0 370 510 877 1029
White British 96.1 96.5 77.1 79.7 44108 52054 188 177
Population: Individuals between 30 and 55 years old (2011) Source: Author’s own calculations based on ONS-LS
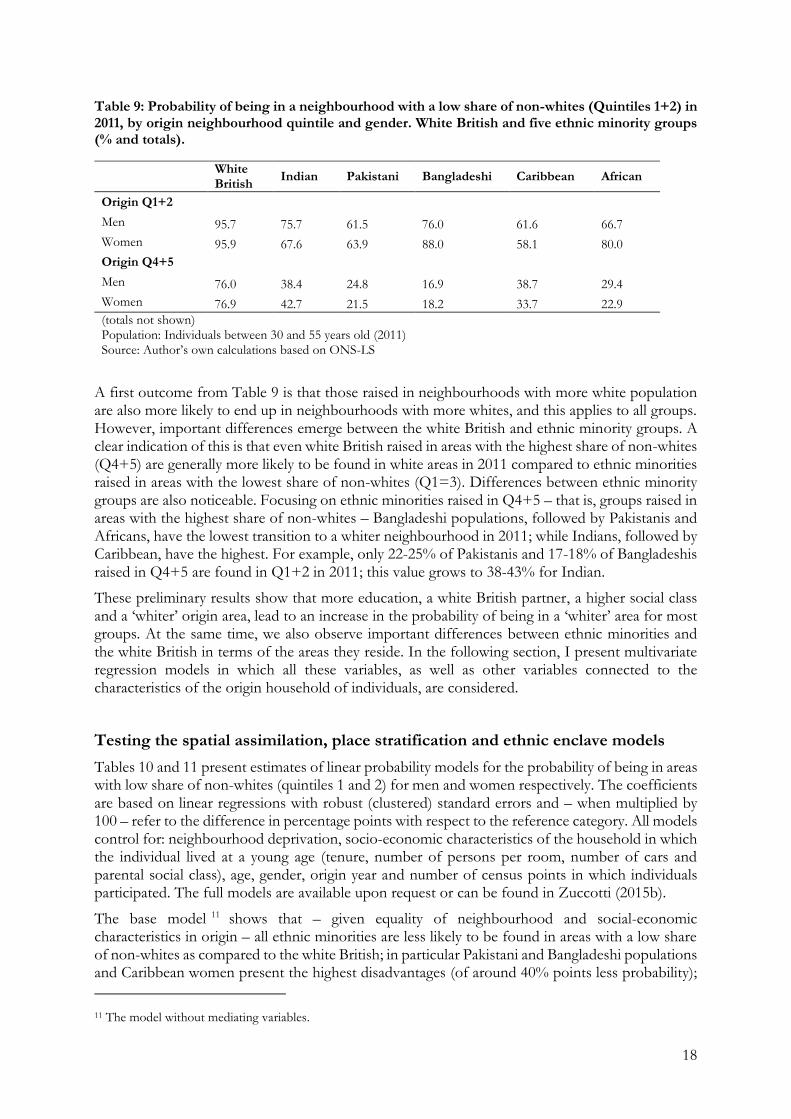
Table 9 shows the probability of being in a neighbourhood with a low share of non-white population (quintiles 1+2) by origin quintile and gender. I have divided between people raised in quintiles 4+5 and people raised in quintiles 1+2. Note that Bangladeshis and Africans have very few cases in some cells, for which the results should be read with caution. The same applies for the regression models presented below.
18
Table 9: Probability of being in a neighbourhood with a low share of non-whites (Quintiles 1+2) in 2011, by origin neighbourhood quintile and gender. White British and five ethnic minority groups (% and totals).
White British
Indian Pakistani Bangladeshi Caribbean African
Origin Q1+2
Men 95.7 75.7 61.5 76.0 61.6 66.7
Women 95.9 67.6 63.9 88.0 58.1 80.0
Origin Q4+5
Men 76.0 38.4 24.8 16.9 38.7 29.4
Women 76.9 42.7 21.5 18.2 33.7 22.9 (totals not shown) Population: Individuals between 30 and 55 years old (2011) Source: Author’s own calculations based on ONS-LS
A first outcome from Table 9 is that those raised in neighbourhoods with more white population are also more likely to end up in neighbourhoods with more whites, and this applies to all groups. However, important differences emerge between the white British and ethnic minority groups. A clear indication of this is that even white British raised in areas with the highest share of non-whites (Q4+5) are generally more likely to be found in white areas in 2011 compared to ethnic minorities raised in areas with the lowest share of non-whites (Q1=3). Differences between ethnic minority groups are also noticeable. Focusing on ethnic minorities raised in Q4+5 – that is, groups raised in areas with the highest share of non-whites – Bangladeshi populations, followed by Pakistanis and Africans, have the lowest transition to a whiter neighbourhood in 2011; while Indians, followed by Caribbean, have the highest. For example, only 22-25% of Pakistanis and 17-18% of Bangladeshis raised in Q4+5 are found in Q1+2 in 2011; this value grows to 38-43% for Indian.
These preliminary results show that more education, a white British partner, a higher social class and a ‘whiter’ origin area, lead to an increase in the probability of being in a ‘whiter’ area for most groups. At the same time, we also observe important differences between ethnic minorities and the white British in terms of the areas they reside. In the following section, I present multivariate regression models in which all these variables, as well as other variables connected to the characteristics of the origin household of individuals, are considered.
Testing the spatial assimilation, place stratification and ethnic enclave models
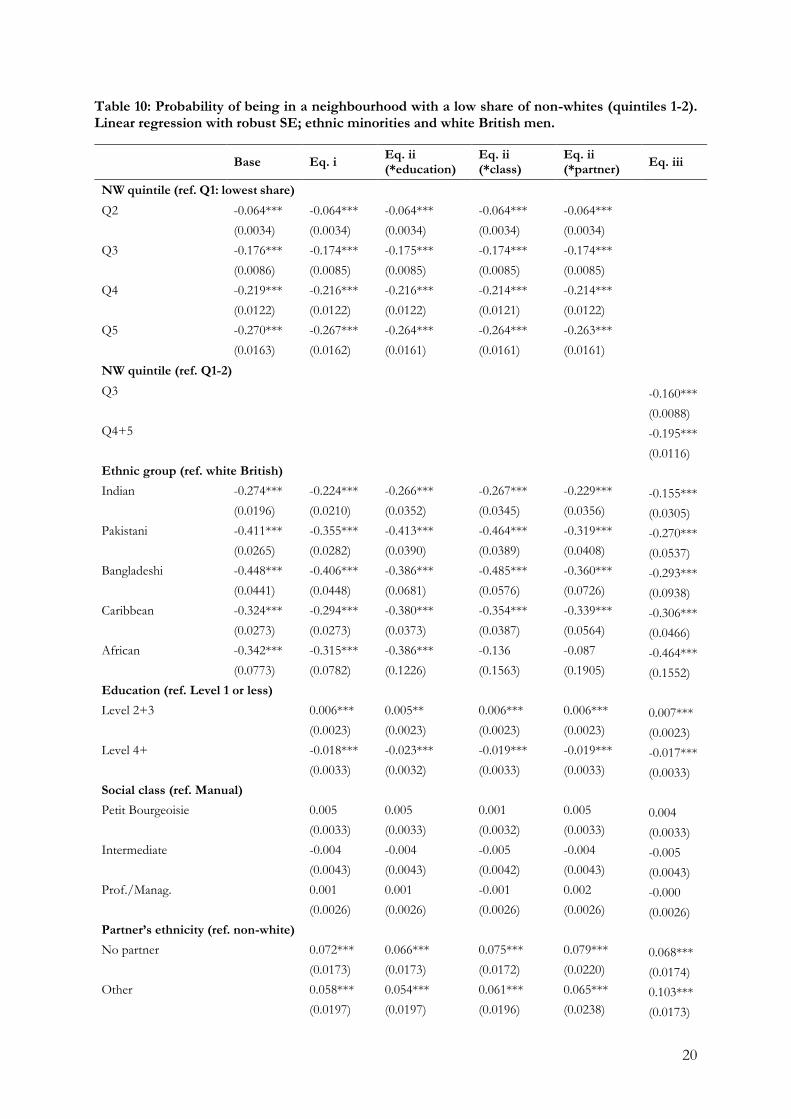
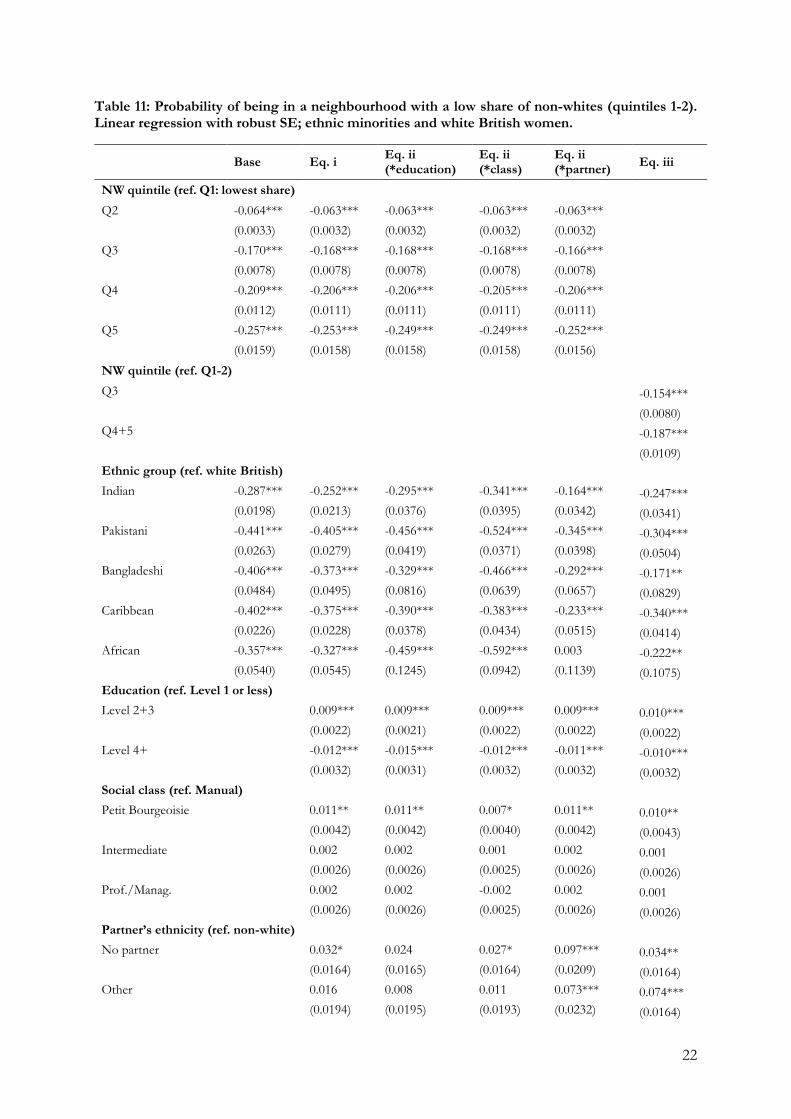
Tables 10 and 11 present estimates of linear probability models for the probability of being in areas with low share of non-whites (quintiles 1 and 2) for men and women respectively. The coefficients are based on linear regressions with robust (clustered) standard errors and – when multiplied by 100 – refer to the difference in percentage points with respect to the reference category. All models control for: neighbourhood deprivation, socio-economic characteristics of the household in which the individual lived at a young age (tenure, number of persons per room, number of cars and parental social class), age, gender, origin year and number of census points in which individuals participated. The full models are available upon request or can be found in Zuccotti (2015b).
The base model 11 shows that – given equality of neighbourhood and social-economic characteristics in origin – all ethnic minorities are less likely to be found in areas with a low share of non-whites as compared to the white British; in particular Pakistani and Bangladeshi populations and Caribbean women present the highest disadvantages (of around 40% points less probability); 11 The model without mediating variables.
19
while Indians the least, but still considerable (almost 30% points less). When adding the three key mediating variables measured in 2001, that is, education, social class and partner’s ethnicity (Equation i) these differences remain practically the same, which points to the presence of mechanisms of place stratification/ethnic enclave. That is, given equality of education, social class and partner’s ethnicity, ethnic minorities are, on average, less likely than white British to reside in quintiles 1+2. Note that the effects observed for the mediating variables are driven by the majoritarian group. Interestingly, having a degree (Level 4+) has a negative effect on the probabilities of being in quintiles 1+2 in 2011; however, this effect is quite small (1-2%) compared, for example, to the effect of having a white British partner (7-10%). The negative effect might be pulled by highly educated white British residing in bigger cities such as London, where most ethnic minorities are located.
The next three models represent the three variations of Equation ii. The first one, adds interactions between ethnic group and education: a Level 4+ (degree) is tested against a Level 1 or less. The models shows that having a higher educational level has a more positive effect for Indian and Pakistani populations, and for Caribbean men, than for the white British. For these ethnic minorities, education – when measured on top of social class – has a greater value in the residential market, giving them a greater chance of being in a whiter area in 2011 (although still not reaching the levels of the white British with high education). This gives some evidence of weak spatial assimilation. For example, while less educated Indian men (Level 1 or less) are around 27% points less likely to be in a non-white area in 2011, compared to an equivalent white British person, this gap reduces to around 19% ((-0.266-0.023+0.092)*100) for those who have at least a degree level (Level 4+).
In the next model, I test for interactions with social class: a professional/managerial position is evaluated against a manual position. Social class, like education, reduces the gap between some ethnic groups (Indians, Pakistanis, Caribbean men and African women) and the white British, in terms of accessing whiter areas. For example, among those who have manual jobs, Pakistani women are around 52% points less likely to be in non-white areas compared to the white British; however, this gap reduces to almost half among those who have a service class position Note that African men is the only group for whom a service position brings a disadvantage; however, given the positive result for women and the low N for this group, I have some concerns regarding the precision of this outcome.
In the third version of Equation ii, I add interactions between ethnic group and partner’s ethnicity: having a white British partner is tested against having a non-white partner. We observe that Indian and Pakistani populations, and Caribbean men, benefit from a white British partner to a greater extent that the white British do. This reduced the ethnic gap in terms of neighbourhood attainment among those who have white British partners. Note also that most Bangladeshis are coupled with co-ethnics, so the negative effect observed for men might be ‘false negatives’. The effect for Africans is also puzzling, and might be connected to a low N (note that, in general, the results for African are not consistent as those observed for the other ethnic groups).
20
Table 10: Probability of being in a neighbourhood with a low share of non-whites (quintiles 1-2). Linear regression with robust SE; ethnic minorities and white British men.
Base Eq. i Eq. ii (*education)
Eq. ii (*class)
Eq. ii (*partner)
Eq. iii
NW quintile (ref. Q1: lowest share)
Q2 -0.064*** -0.064*** -0.064*** -0.064*** -0.064***
(0.0034) (0.0034) (0.0034) (0.0034) (0.0034)
Q3 -0.176*** -0.174*** -0.175*** -0.174*** -0.174***
(0.0086) (0.0085) (0.0085) (0.0085) (0.0085)
Q4 -0.219*** -0.216*** -0.216*** -0.214*** -0.214***
(0.0122) (0.0122) (0.0122) (0.0121) (0.0122)
Q5 -0.270*** -0.267*** -0.264*** -0.264*** -0.263***
(0.0163) (0.0162) (0.0161) (0.0161) (0.0161)
NW quintile (ref. Q1-2)
Q3 -0.160***
(0.0088)
Q4+5 -0.195***
(0.0116)
Ethnic group (ref. white British)
Indian -0.274*** -0.224*** -0.266*** -0.267*** -0.229*** -0.155***
(0.0196) (0.0210) (0.0352) (0.0345) (0.0356) (0.0305)
Pakistani -0.411*** -0.355*** -0.413*** -0.464*** -0.319*** -0.270***
(0.0265) (0.0282) (0.0390) (0.0389) (0.0408) (0.0537)
Bangladeshi -0.448*** -0.406*** -0.386*** -0.485*** -0.360*** -0.293***
(0.0441) (0.0448) (0.0681) (0.0576) (0.0726) (0.0938)
Caribbean -0.324*** -0.294*** -0.380*** -0.354*** -0.339*** -0.306***
(0.0273) (0.0273) (0.0373) (0.0387) (0.0564) (0.0466)
African -0.342*** -0.315*** -0.386*** -0.136 -0.087 -0.464***
(0.0773) (0.0782) (0.1226) (0.1563) (0.1905) (0.1552)
Education (ref. Level 1 or less)
Level 2+3 0.006*** 0.005** 0.006*** 0.006*** 0.007***
(0.0023) (0.0023) (0.0023) (0.0023) (0.0023)
Level 4+ -0.018*** -0.023*** -0.019*** -0.019*** -0.017***
(0.0033) (0.0032) (0.0033) (0.0033) (0.0033)
Social class (ref. Manual)
Petit Bourgeoisie 0.005 0.005 0.001 0.005 0.004
(0.0033) (0.0033) (0.0032) (0.0033) (0.0033)
Intermediate -0.004 -0.004 -0.005 -0.004 -0.005
(0.0043) (0.0043) (0.0042) (0.0043) (0.0043)
Prof./Manag. 0.001 0.001 -0.001 0.002 -0.000
(0.0026) (0.0026) (0.0026) (0.0026) (0.0026)
Partner’s ethnicity (ref. non-white)
No partner 0.072*** 0.066*** 0.075*** 0.079*** 0.068***
(0.0173) (0.0173) (0.0172) (0.0220) (0.0174)
Other 0.058*** 0.054*** 0.061*** 0.065*** 0.103***
(0.0197) (0.0197) (0.0196) (0.0238) (0.0173)
21
Base Eq. i Eq. ii (*education)
Eq. ii (*class)
Eq. ii (*partner)
Eq. iii
White British 0.106*** 0.100*** 0.110*** 0.111*** 0.051***
(0.0173) (0.0173) (0.0172) (0.0219) (0.0197)
Interactions with mediating variables and origin neighbourhood. Effects refer to:
Level 4+ Prof./ Manag.
White British partner
Origin quintile 4+5
Indian 0.092** 0.070* 0.234*** -0.160***
(0.0434) (0.0415) (0.0670) (0.0399)
Pakistani 0.147** 0.183*** 0.289*** -0.177***
(0.0574) (0.0574) (0.1115) (0.0604)
Bangladeshi -0.014 0.123 -0.371*** -0.185*
(0.1048) (0.0942) (0.0727) (0.1050)
Caribbean 0.189*** 0.152*** 0.229*** -0.028
(0.0661) (0.0587) (0.0780) (0.0585)
African 0.189 -0.335* -0.417* 0.173
(0.1778) (0.1846) (0.2507) (0.1847)
Adjusted R-squared 0.152 0.159 0.160 0.162 0.161 0.152
N 77,196 77,196 77,196 77,196 77,196 77,196
Note: All models control for age, gender, origin year, and number of census points, neighbourhood deprivation, tenure, number of persons per room, number of cars and parental social class. The reference categories in models with interaction effects are: Level 1 or less, Manual social class, non-white partner and origin quintiles 1-3. * p-value<.10 ** p-value<.05 *** p-value<.01; robust (clustered) standard errors in parentheses Population: Individuals between 30 and 55 years old (2011) Source: Author’s own calculations based on ONS-LS
22
Table 11: Probability of being in a neighbourhood with a low share of non-whites (quintiles 1-2). Linear regression with robust SE; ethnic minorities and white British women.
Base Eq. i Eq. ii (*education)
Eq. ii (*class)
Eq. ii (*partner)
Eq. iii
NW quintile (ref. Q1: lowest share)
Q2 -0.064*** -0.063*** -0.063*** -0.063*** -0.063***
(0.0033) (0.0032) (0.0032) (0.0032) (0.0032)
Q3 -0.170*** -0.168*** -0.168*** -0.168*** -0.166***
(0.0078) (0.0078) (0.0078) (0.0078) (0.0078)
Q4 -0.209*** -0.206*** -0.206*** -0.205*** -0.206***
(0.0112) (0.0111) (0.0111) (0.0111) (0.0111)
Q5 -0.257*** -0.253*** -0.249*** -0.249*** -0.252***
(0.0159) (0.0158) (0.0158) (0.0158) (0.0156)
NW quintile (ref. Q1-2)
Q3 -0.154***
(0.0080)
Q4+5 -0.187***
(0.0109)
Ethnic group (ref. white British)
Indian -0.287*** -0.252*** -0.295*** -0.341*** -0.164*** -0.247***
(0.0198) (0.0213) (0.0376) (0.0395) (0.0342) (0.0341)
Pakistani -0.441*** -0.405*** -0.456*** -0.524*** -0.345*** -0.304***
(0.0263) (0.0279) (0.0419) (0.0371) (0.0398) (0.0504)
Bangladeshi -0.406*** -0.373*** -0.329*** -0.466*** -0.292*** -0.171**
(0.0484) (0.0495) (0.0816) (0.0639) (0.0657) (0.0829)
Caribbean -0.402*** -0.375*** -0.390*** -0.383*** -0.233*** -0.340***
(0.0226) (0.0228) (0.0378) (0.0434) (0.0515) (0.0414)
African -0.357*** -0.327*** -0.459*** -0.592*** 0.003 -0.222**
(0.0540) (0.0545) (0.1245) (0.0942) (0.1139) (0.1075)
Education (ref. Level 1 or less)
Level 2+3 0.009*** 0.009*** 0.009*** 0.009*** 0.010***
(0.0022) (0.0021) (0.0022) (0.0022) (0.0022)
Level 4+ -0.012*** -0.015*** -0.012*** -0.011*** -0.010***
(0.0032) (0.0031) (0.0032) (0.0032) (0.0032)
Social class (ref. Manual)
Petit Bourgeoisie 0.011** 0.011** 0.007* 0.011** 0.010**
(0.0042) (0.0042) (0.0040) (0.0042) (0.0043)
Intermediate 0.002 0.002 0.001 0.002 0.001
(0.0026) (0.0026) (0.0025) (0.0026) (0.0026)
Prof./Manag. 0.002 0.002 -0.002 0.002 0.001
(0.0026) (0.0026) (0.0025) (0.0026) (0.0026)
Partner’s ethnicity (ref. non-white)
No partner 0.032* 0.024 0.027* 0.097*** 0.034**
(0.0164) (0.0165) (0.0164) (0.0209) (0.0164)
Other 0.016 0.008 0.011 0.073*** 0.074***
(0.0194) (0.0195) (0.0193) (0.0232) (0.0164)
23
Base Eq. i Eq. ii (*education)
Eq. ii (*class)
Eq. ii (*partner)
Eq. iii
White British 0.071*** 0.063*** 0.066*** 0.132*** 0.016
(0.0164) (0.0165) (0.0163) (0.0208) (0.0194)
Interactions with mediating variables and origin neighbourhood. Effects refer to:
Level 4+ Prof./ Manag.
White British partner
Origin quintile 4+5
Indian 0.080* 0.127*** 0.197*** -0.054
(0.0465) (0.0465) (0.0590) (0.0414)
Pakistani 0.176*** 0.217*** 0.242** -0.205***
(0.0633) (0.0590) (0.1218) (0.0581)
Bangladeshi -0.050 0.174 -0.096 -0.349***
(0.1357) (0.1143) (0.3312) (0.0981)
Caribbean 0.048 0.040 0.126 -0.057
(0.0538) (0.0545) (0.0822) (0.0509)
African 0.212 0.320*** -0.099 -0.248*
(0.1419) (0.1183) (0.1936) (0.1305)
Adjusted R-squared 0.168 0.175 0.176 0.177 0.180 0.163
N 83,972 83,972 83,972 83,972 83,972 83,972
Note: All models control for age, gender, origin year, and number of census points, neighbourhood deprivation, tenure, number of persons per room, number of cars and parental social class. The reference categories in models with interaction effects are: Level 1 or less, Manual social class, non-white partner and origin quintiles 1-3. * p-value<.10 ** p-value<.05 *** p-value<.01; robust (clustered) standard errors in parentheses Population: Individuals between 30 and 55 years old (2011) Source: Author’s own calculations based on ONS-LS
24
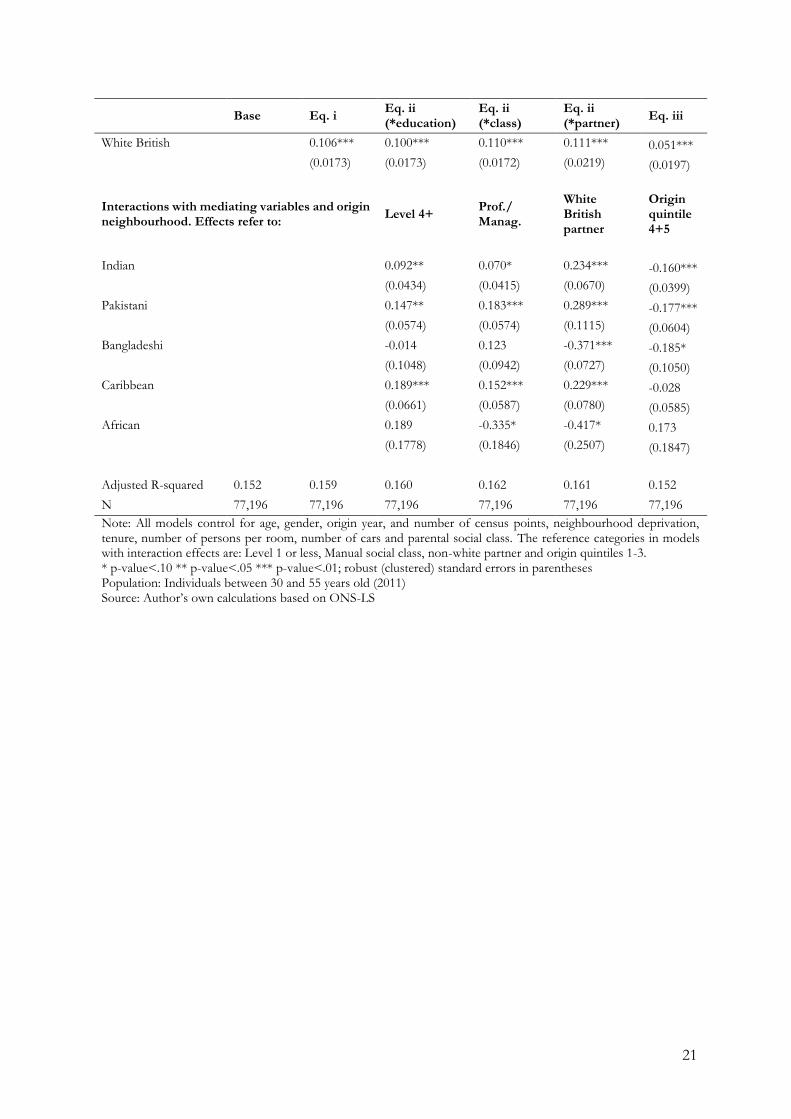
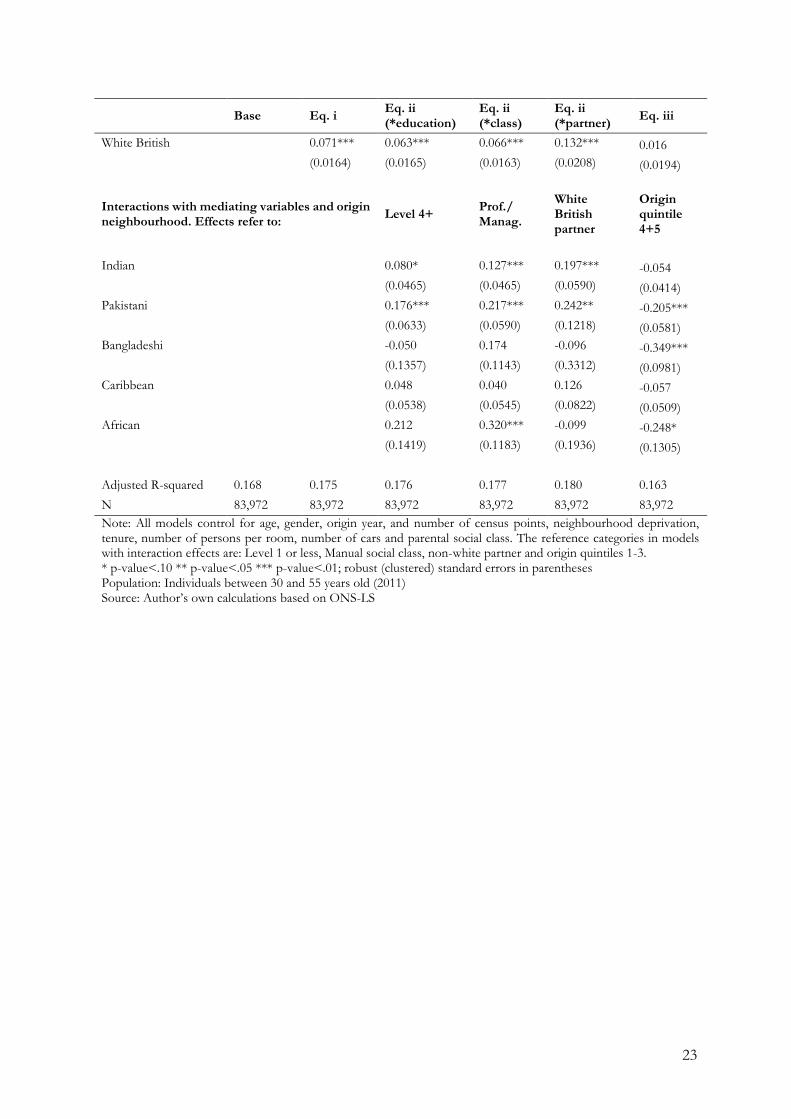
The last model (Equation iii) tests whether the negative effect for ethnic minorities is higher for those raised in areas with a higher share of non-whites (quintiles 4+5) as compared to those raised in areas with a lower share of non-whites (quintiles 1+2). The results so far have shown that all individuals (independently of their ethnicity) raised in areas with higher shares of non-whites are in general less likely to move to areas with low shares of non-whites (as compared to individuals raised in areas with fewer non-whites): this might be related, for example, to unmeasured preferences for certain types of neighbourhoods. However, I argued that if ethnic enclave mechanisms are present, this pattern should be particularly strong for some groups: in practice, I expected a negative interaction between origin neighbourhood and ethnicity. The results show that this is the case for Pakistani and Bangladeshi populations, and also for Indian men (there is also an effect for African women, but again, results are puzzling this group). In other words, if we compare white British and ethnic minorities raised in areas with a high share of non-whites, compared to those raised in the whitest areas, the gap between the two is bigger. For example, for Indian men, having lived at a young age in Q4+5 gives them around 35% points less chance of living in whiter areas in 2011 compared to an equivalent white British; this gap is lower for those raised in Q1+2 (around 18%). Similarly, for Pakistanis and Bangladeshis raised in areas with the least whites, their probability of being in whiter areas in 2011 is around 50-55% points less as compared to the white British; this drops to almost half when comparing individuals raised in whiter areas.12
In order to have another perspective on these results, I have calculated predicted values for ‘ideal types’: individuals with the least education, lowest social class and a non-white partner (type 1), on the one hand, and individuals with the most education, highest social class and a white British partner (type 2), on the other. For illustrative purposes, I show the results for individuals whose origin neighbourhood has a high share of non-whites (quintiles 4+5)13. To calculate these margins, all interactions are included in one equation (table available upon request). The results, separated by gender, are graphed in Figure 4.
Figure 4 illustrates well that differences between ethnic minorities and white British are smaller among those with higher indicators of assimilation: this is clearly observed among Indian, Pakistani and Caribbean populations. For example, as a Pakistani man raised in Q4+5 gains in terms of cultural and socio-economic assimilation (i.e. moves from type 1 to type 2), the gap with respect to an equivalent white British in terms of the probability of being in a neighbourhood with a low share of non-whites reduces from 53% points (66.7-13.7) to 6% points (75.7-69.7). Similarly, as an Indian woman moves from type 1 to type 2, the initial gap of around 30% points in the probability of accessing ‘whiter’ areas transforms into an advantage for the Indian of around 3% points. For Bangladeshis and Africans, the results are very unstable, although they point in general to lower effects of assimilation on residential mobility (and surprisingly a negative effect for African men, probably due to the low N).
12 I have also tested whether this model changed with and without the partner’s ethnicity variable, and with ethnic group*partner’s ethnicity interactions, under the assumption that having a non-white partner (more likely to happen in non-white areas, especially for the ethnic minorities) might be a mechanism that explains the gap: the model, however, remains the same (table available upon request). 13 I have also estimated a model for individuals raised in Q45 only (available upon request) and I found that, although there is a positive effect of the mediating variables, there are fewer statistically significant interactions (especially for men) and hence less evidence in favour of the model of ‘weak’ spatial assimilation. The results in Figure 4 represent an average of what occurs in terms of residential opportunities for different ethnic groups and levels of socio-economic and cultural attainment.
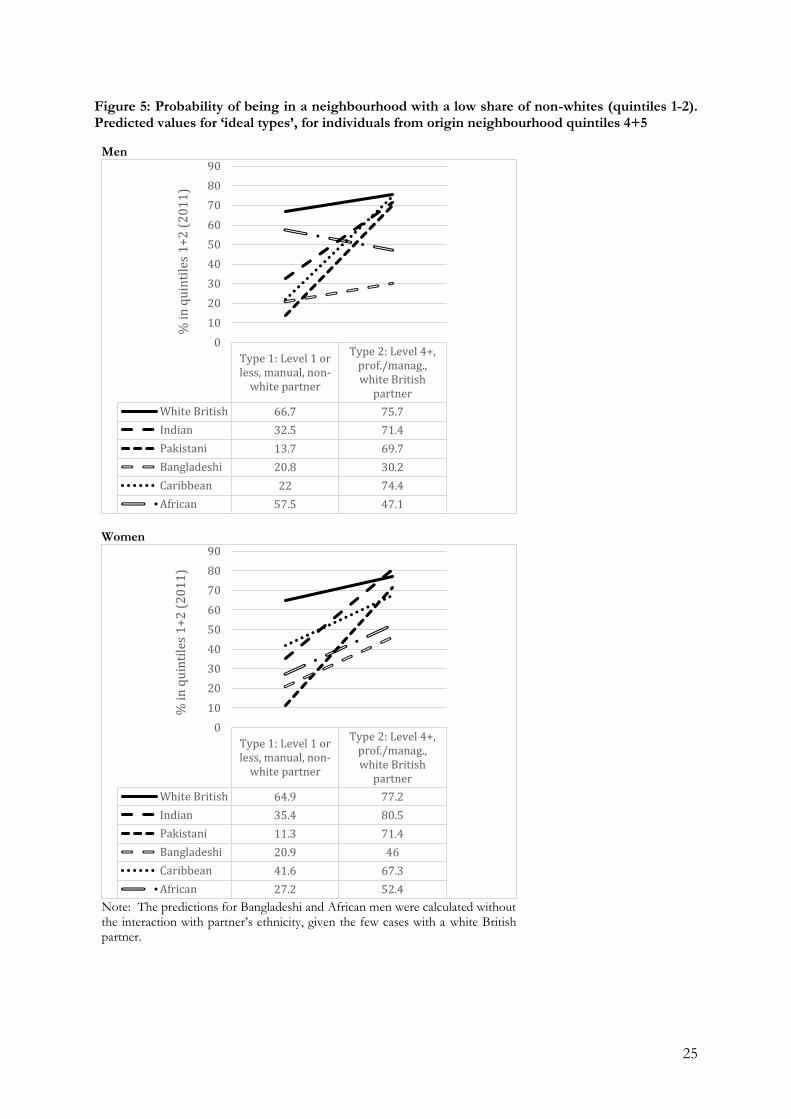
25
Figure 5: Probability of being in a neighbourhood with a low share of non-whites (quintiles 1-2). Predicted values for ‘ideal types’, for individuals from origin neighbourhood quintiles 4+5
Men
Women
Note: The predictions for Bangladeshi and African men were calculated without the interaction with partner’s ethnicity, given the few cases with a white British partner.
Type 1: Level 1 or
less, manual, non-
white partner
Type 2: Level 4+,
prof./manag.,
white British
partner
White British 66.7 75.7
Indian 32.5 71.4
Pakistani 13.7 69.7
Bangladeshi 20.8 30.2
Caribbean 22 74.4
African 57.5 47.1
0
10
20
30
40
50
60
70
80
90
% i
n q
uin
tile
s 1
+2
(2
01
1)
Type 1: Level 1 or
less, manual, non-
white partner
Type 2: Level 4+,
prof./manag.,
white British
partner
White British 64.9 77.2
Indian 35.4 80.5
Pakistani 11.3 71.4
Bangladeshi 20.9 46
Caribbean 41.6 67.3
African 27.2 52.4
0
10
20
30
40
50
60
70
80
90
% i
n q
uin
tile
s 1
+2
(2
01
1)
26
Conclusion and discussion
This paper has aimed at testing spatial assimilation, place stratification and ethnic enclave models for the main second-generation ethnic minority groups in England and Wales. Following three research questions and four hypotheses, I tested to what extent ethnic inequalities are present when studying neighbourhood attainment. In particular, I studied how the probability of being in a neighbourhood with a low share of non-whites (or a ‘whiter’ neighbourhood) varies by ethnicity, gender, levels of economic and cultural integration and the characteristics of the neighbourhood in which individuals lived at a young age.
In the first part of the analysis, I studied to what extent ethnic minorities were as likely as the white British to be in ‘whiter’ neighbourhoods, on equality of individual, household and origin neighbourhood characteristics. This included a consideration of education, social class and partner’s ethnicity, which have been considered here as indicators of socio-economic and cultural resources. Following place stratification and ethnic enclave models, I expected to find penalties for the ethnic minorities, in particular Pakistani and Bangladeshi groups (Hypothesis 1). This was confirmed by my findings. On average, ethnic minorities are between 30% and 40% points less likely to be in ‘whiter’ areas as compared to white British with similar demographic and socio-economic characteristics, and independently of the characteristics of the neighbourhood in which they lived when they were young. Furthermore, Pakistani and Bangladeshi populations were also found to be particularly disadvantaged, together with Caribbean women. Indians were in the opposite case, having the lowest gaps with respect to the white British.
Next I explored whether the effect of education, social class and partner’s ethnicity on the probability of being in ‘whiter’ neighbourhoods was similar across different ethnic groups. I tested whether ethnic minorities with more cultural and socio-economic resources approached the white British in terms of neighbourhood attainment (confirming hence a model of ‘weak’ spatial assimilation) or rather suffered more penalties, following ‘strong’ and ‘very strong’ versions of the place stratification and ethnic enclave models. Here I expected that educational and social class have a lower effect for Pakistanis and Bangladeshis than for the white British, given the increase in islamophobia and the populations’ strong community values (Hypothesis 2a), while I expected a white partner to have a more positive effect for all ethnic minority groups, but particularly Asians (Hypothesis 2b). I found that a higher education, a higher social class and a white British partner have in general a more positive effect for Indian and Pakistani populations and for Caribbean men than for the white British: this supports Hypothesis 2b, and refutes (at least for some groups) Hypothesis 2a.
Finally, in an attempt to separate ethnic enclave from place stratification processes, I investigated whether for those raised in neighbourhoods with a higher share of non-white population, ethnic minorities (especially Pakistanis and Bangladeshis) were particularly less likely to move to ‘whiter’ neighbourhoods, given equality of characteristics. The assumption was that housing discrimination or harassment (the basis for place stratification) should, in principle, affect all ethnic groups equally; while ethnic enclave mechanisms should occur in areas where the share of non-whites is high, affecting those groups with stronger community values (Hypothesis 3). This was confirmed by the data: Pakistani and Bangladeshi populations as well as Indian men, raised in areas with a higher share of non-whites, were less likely to be found in ‘whiter’ areas in 2011, compared to those raised in whiter areas.
All in all, the analysis shows that spatial assimilation is taking place. However, this is only a ‘weak’ form of spatial assimilation. Ethnic minorities with less education, lower social class, partnered with a non-white (indicators of ‘assimilation’) and raised in areas with a higher share of non-whites, are substantively less likely to attain neighbourhoods with lower shares of non-whites, compared to their white British counterparts. As argued before, ‘weak’ spatial assimilation also means that
27
there is no ‘equality of outcomes on equality of conditions’ for everyone: in a way, we might say that mechanisms of place stratification and ethnic enclave are also taking place.
As a final remark, it is interesting to briefly reflect on the meaning of these findings. One the one hand, we could argue that if ethnic minorities prefer to live in areas with a higher share of non-white population, the mere existence of the gap should not be, per se, a problem. I mentioned above the benefits this could bring in terms of social life, and there is also evidence that second generation minorities living in areas with a higher share of co-ethnics score higher in measures of subjective well-being (Knies et al., 2014). Moreover, the finding that Indian men raised in areas with more co-ethnics are relatively less inclined to move to ‘whiter’ areas compared to other groups (which suggested mechanisms of ethnic enclave) might also be seen as a positive outcome, given previous findings showing that spatial concentration has a positive for their occupational gains (Zuccotti, 2015b).
However, other counter-arguments arise. First, the maintenance of spatial inequalities or levels of spatial segregation that these results suggest, can affect negatively the social cohesion of a society, since it prevents individuals who are different from interacting with each other (Cantle, 2012). Second, the fact that the least-assimilated ethnic minorities (especially those with the least education and lowest occupation) are also the least likely to attain a ‘whiter’ neighbourhood can be particularly problematic, since it points to an overlap between the reproduction of ethnic inequalities and the reproduction of social inequalities (Cantle, 2012). In addition, since poorer people typically have fewer opportunities to learn about and actually meet ‘others’ (Cantle, 2012; de Palo et al., 2006), this might, in turn, lead to prejudice and negative attitudes towards those who are unknown, and hence not only promote and reinforce a more conservative residential movement – i.e. within non-white areas – but also add additional negative consequences for social cohesion (note that, as Cantle contends, this does not diminish the fact that the patterns of residential movement among the white British might also help to reinforce spatial inequalities). Third, areas with more non-whites are usually more deprived, which means that staying in or moving to less-white areas also means staying in or moving to more-deprived ones (this was supported by the replicated analysis mentioned earlier). Finally, there is evidence that Pakistani and Bangladeshi women raised in areas with a high share of co-ethnics are less likely to be employed in later life, as compared to equivalent women raised in areas with a low share of co-ethnics (Zuccotti, 2015b). For these groups, at play might be a vicious circle that prevents them both from improving in the labour market and from moving out of ethnic concentration areas. It is likely that factors associated with cultural constraints play a role in this: note that Pakistani and Bangladeshi women who actually manage to achieve assimilation gains are more likely to transform these into residential gains (as compared to the white British).
This study has shown that not all ethnic groups reach similar neighbourhood attainments given similar socio-economic and cultural resources. This suggests that the spatial location of ethnic groups is also the result of preferences and constraints. Thinking in terms of policy, while changing preferences might be a difficult and delicate process, diminishing constraints, that is, promoting the conditions for all groups to be equally free to choose where they want to live, should definitely be part of the government agenda.
28
Bibliography
Alba R and Nee V. (2003) Remaking the American mainstream. Assimilation and contemporary immigration Cambridge: Harvard University Press.
Alba RD and Logan JR (1993) Minority proximity to whites in suburbs: an individual-level analysis of segregation. American Journal of Sociology 98(6): 1388-1427.
Alba RD, Logan JR, Stults BJ, et al. (1999) Immigrant groups in the suburbs: a reexamination of suburbanization and spatial assimilation. American Sociological Review 64(3): 446-460.
Alexander C (2002) Beyond black: re-thinking the colour/culture divide. Ethnic and Racial Studies 25(4): 552-571.
Blau P and Duncan OD. (1967) The American occupational structure, New York: Wiley. Bolt G, Şule Özüekren A and Phillips D (2010) Linking integration and residential segregation.
Journal of Ethnic and Migration Studies 36(2): 169-186. Bolt G and van Kempen R (2010) Ethnic segregation and residential mobility: relocations of
minority ethnic groups in the Netherlands. Journal of Ethnic and Migration Studies 36(2): 333-354. Bowes A, Dar N and Sim D (1997) Tenure preference and housing strategy: an exploration of
Pakistani experiences. Housing Studies 12(1): 63-84. Bowes A, Dar NS and Sim DF (2002) Differentiation in housing careers: the case of Pakistanis in
the UK. Housing Studies 17(3): 381-399. Cantle T. (2012) Interculturalism: the new era of cohesion and diversity, Hampshire: Palgrave Macmillan. Carling A (2008) The curious case of the mis-claimed myth claims: ethnic segregation, polarisation
and the future of Bradford. Urban Studies 45(3): 553-589. Catney G (2015a) The changing geographies of ethnic diversity in England and Wales, 1991–2011.
Population, Space and Place: n/a-n/a. Catney G (2015b) Exploring a decade of small area ethnic (de-)segregation in England and Wales.
Urban Studies. Catney G (2015c) Towards an enhanced understanding of ethnic group geographies using measures
of clustering and unevenness. The Geographical Journal: n/a-n/a. Crowder K, Pais J and South SJ (2012) Neighborhood diversity, metropolitan constraints, and
household migration. American Sociological Review 77(3): 325-353. Crowder K, South SJ and Chavez E (2006) Wealth, race, and inter-neighborhood migration.
American Sociological Review 71(1): 72-94. de Palo D, Faini R and Venturini A. (2006) The social assimilation of immigrants. IZA Discussion
Paper. Erikson R and Goldthorpe J. (1992) The constant flux: a study of class mobility in industrial societies,
Oxford: Clarendon Press. Finney N (2011) Understanding ethnic differences in the migration of young adults within Britain
from a lifecourse perspective. Transactions of the Institute of British Geographers 36(3): 455-470. Finney N and Simpson L (2008) Internal migration and ethnic groups: evidence for Britain from
the 2001 Census. Population, Space and Place 14(2): 63-83. Finney N and Simpson L (2009) Population dynamics: the roles of natural change and migration
in producing the ethnic mosaic. Journal of Ethnic and Migration Studies 35(9): 1479-1496. Gordon MM. (1964) Assimilation in American life: the role of race, religion, and national origins, New York:
Oxford University Press Hattersley L and Creeser R. (1995) Longitudinal Study 1971-1991 History, organisation and quality
of data. Series LS. London: Office of Population Censuses and Surveys. Heath A and Li Y. (2010) Struggling onto the ladder, climbing the rungs: employment and class
position of minority ethnic groups in Britain. In: Stillwell J, Norman P, Thomas C, et al. (eds) Spatial and social disparities. Understanding population trends and processes. London: Springer, 83-97.
Johnston R, Forrest J and Poulsen M (2002a) Are there ethnic enclaves/ghettos in English cities? Urban Studies 39(4): 591-618.
29
Johnston R, Forrest J and Poulsen M (2002b) The ethnic geography of EthniCities: The `American model' and residential concentration in London. Ethnicities 2(2): 209-235.
Johnston R, Poulsen M and Forrest J (2015) Increasing diversity within increasing diversity: the changing ethnic composition of London's neighbourhoods, 2001–2011. Population, Space and Place 21(1): 38-53.
Knies G, Nandi A and Platt L. (2014) Life satisfaction, ethnicity and neighbourhoods: is there an effect of neighbourhood ethnic composition on life satisfaction? CReAM Discussion Paper Series. London: Department of Economics, University College London.
Lersch PM (2013) Place stratification or spatial assimilation? Neighbourhood quality changes after residential mobility for migrants in Germany. Urban Studies 50(5): 1011-1029.
Logan JR and Alba RD (1993) Locational returns to human capital: minority access to suburban community resources. Demography 30(2): 243-268.
Massey DS (1985) Ethnic residential segregation: a theoretical synthesis and empirical review. Sociology and social research 69(3): 315-350.
Massey DS and Denton NA (1985) Spatial assimilation as a socioeconomic outcome. American Sociological Review 50(1): 94-106.
Özüekren AS and van Kempen R (2002) Housing careers of minority ethnic groups: experiences, explanations and prospects. Housing Studies 17(3): 365-379.
Park R. (1925) The urban community as a spacial pattern and a moral order. In: Burgess E (ed) The urban community. Chicago: The University of Chicago Press.
Peach C (1998) South Asian and Caribbean ethnic minority housing choice in Britain. Urban Studies 35(10): 1657-1680.
Peach C. (2005) Social integration and social mobility: spatial segregation and intermarriage of the Caribbean population in Britain. In: Loury GC, Modood T and Teles SM (eds) Ethnicity, social mobility and public policy. Cambridge: Cambridge University Press, 178-203.
Phillips D (1998) Black minority ethnic concentration, segregation and dispersal in Britain. Urban Studies 35(10): 1681-1702.
Phillips D (2006) Parallel lives? Challenging discourses of British Muslim self-segregation. Environment and Planning D: Society and Space 24(1): 25-40.
Platt L (2005a) The intergenerational social mobility of minority ethnic groups. Sociology 39(3): 445-461.
Platt L. (2005b) Migration and social mobility: the life chances of Britain's minority ethnic communities, Bristol: Policy Press
Platt L (2007) Making education count: the effects of ethnicity and qualifications on intergenerational social class mobility. The Sociological Review 55(3): 485-508.
Portes A and Jensen L (1989) The enclave and the entrants: patterns of ethnic enterprise in Miami before and after Mariel. American Sociological Review 54(6): 929-949.
Portes A and Jensen L (1992) Disproving the enclave hypothesis: reply. American Sociological Review 57(3): 418-420.
Portes A and Zhou M (1993) The new second generation: segmented assimilation and its variants. The ANNALS of the American Academy of Political and Social Science 530(1): 74-96.
Rees P and Butt F (2004) Ethnic change and diversity in England, 1981–2001. Area 36(2): 174-186. Sanders JM and Nee V (1987) Limits of ethnic solidarity in the enclave economy. American
Sociological Review 52(6): 745-773. Sanders JM and Nee V (1992) Problems in resolving the enclave economy debate. American
Sociological Review 57(3): 415-418. Schaake K, Burgers J and Mulder C (2010) Ethnicity at the individual and neighborhood level as
an explanation for moving out of the neighborhood. Population Research and Policy Review 29(4): 593-608.
Schaake K, Burgers J and Mulder CH (2013) Ethnicity, education and income, and residential mobility between neighbourhoods. Journal of Ethnic and Migration Studies 40(4): 512-527.

30
Simpson L (2007) Ghettos of the mind: the empirical behaviour of indices of segregation and diversity. Journal of the Royal Statistical Society: Series A (Statistics in Society) 170(2): 405-424.
Simpson L. (2012) More segregation or more mixing? In: ESRC-CoDE (ed) Dynamics of Diversity: evidence from the 2011 Census. Centre on Dynamics of Ethnicity (CoDE).
Zuccotti CV (2015a) Do parents matter? Revisiting ethnic penalties in occupation among second generation ethnic minorities in England and Wales. Sociology 49(2): 229-251.
Zuccotti CV. (2015b) Shaping ethnic inequalities: the production and reproduction of social and spatial inequalities among ethnic minorities in England and Wales European University Institute.