Embed Size (px)
Citation preview
Neil Lee, Hiba Sameen and Marc Cowling
Access to finance for innovative SMEs since the financial crisis Article (Accepted version) (Refereed)
Original citation: Lee, Neil, Sameen, Hiba and Cowling, Marc (2015) Access to finance for innovative SMEs since the financial crisis. Research Policy, 44 (2). pp. 370-380. ISSN 0048-7333 © 2015 The Authors CC-BY-NC-ND This version available at: http://eprints.lse.ac.uk/60052/ Available in LSE Research Online: November 2014 LSE has developed LSE Research Online so that users may access research output of the School. Copyright © and Moral Rights for the papers on this site are retained by the individual authors and/or other copyright owners. You may freely distribute the URL (http://eprints.lse.ac.uk) of the LSE Research Online website.
1
Access to finance for innovative SMEs since the financial crisis
Abstract
In the wake of the 2008 financial crisis, there has been increased focus on access to finance
for small and medium sized firms. Some evidence from before the crisis suggested that it was
harder for innovative firms to access finance. Yet no research has considered the differential
effect of the crisis on innovative firms. This paper addresses this gap using a dataset of over
10,000 UK SME employers. We find that innovative firms are more likely to be turned down
for finance than other firms, and this worsened significantly in the crisis. However,
regressions controlling for a host of firm characteristics show that the worsening in general
credit conditions has been more pronounced for non-innovative firms with the exception of
absolute credit rationing which still remains more severe for innovative firms. The results
suggest that there are two issues in the financial system. First, we find evidence of a structural
problem which restricts access to finance for innovative firms. Second, we show a cyclical
problem has been caused by the financial crisis and impacted relatively more severely on non-
innovative firms.
Keywords: Finance; SME; Entrepreneurship; Recession; Innovation
JEL: O31; G21; G32; L26
2
1. Introduction
The fallout from the 2008 financial crisis has focused attention on access to finance for small
and medium sized enterprises (SMEs). The roots of the financial crisis lay in overvalued
assets, mainly those backed by mortgages. As these assets began to lose value, it was unclear
who owned them and so was exposed to the losses. Bank were unwilling to lend to each
other, and restrictions in lending fed through into the wider economy: the ‘credit crunch’
(Cowling et al., 2012). Five years after the initial shock to the economy, bank lending had still
not recovered – particularly for smaller firms. There is now a general consensus that this held
back the economic recovery of many countries, including the United Kingdom (UK)
(Filippetti and Archibugi, 2011).
However, while policymakers talk in general terms about enterprise and small firms, not all
firms will drive the economic recovery. SMEs constitute almost 60 percent of private sector
employment in the UK and are an important area of government policy (BIS, 2013a).
However, the majority of SMEs create few jobs (Storey 1994; Cowling et al., 2004) with only
a small minority having a disproportionate impact on the national economy (Mason and
Brown, 2013; Nightingale and Coad, 2014). In particular, innovative small firms – those
introducing new products, processes or business models – are most likely to create new
markets, achieve rapid growth, and help the economy recover. External finance may be
particularly important for innovative small firms, as they can lack the internal resources to
succesfully commercialise innovations (Beck and Demirguc-Kunt, 2006; Schneider and
Veugelers, 2010).
Yet it is innovative small firms which often find it the hardest to obtain finance (Freel, 2007;
Schneider and Veugelers, 2010; Hutton and Lee, 2012; Mason, 2013; Mina et al. 2013).
Innovative firms tend to have riskier business models, which are important to create new
markets but are also difficult for banks to value. They are often more reliant on intangible
assets, rather than physical property, but intangibles are difficult to value as they are context
specific, and thus hard to use as collateral for lending. The evidence on this point is not
conclusive, but some authors suggest that the most important firms for the economy often
find it hardest to obtain finance (Freel, 2007).
However, while there is good evidence of a general problem in access to finance in the
economy, there is little evidence on how the credit crunch and its aftermath has impacted
access to finance for innovative small firms in particular. This led Mina et al. (2013: 26) to
argue that the “specific short- term and long-term effects of the post-2007 financial crisis are
an open question on which further research is much needed.” Studies have suggested

3
innovation investments may been reduced in this period. For example, Paunov’s (2012)
important study shows firms with significant public financial support were less likely to
reduce their innovation investments during the crisis.
This paper investigates these issues using the UK Small Business Survey – a government
survey of over 10,000 SME employers – in 2007/8, 2010 and 2012. This gives rich data on
firm characteristics including innovation and applications for finance. It also provides
sufficient sample size and comparability between years to allow us to investigate how
financing for innovative firms changed in the crisis. We use a combination of simple
quantitative analysis and econometric analysis to investigate the link between innovation and
access to finance while controlling for both firm characteristics and likelihood of applying.
We also draw out the policy implications of our research findings.
Our results suggest that innovative SMEs – those introducing entirely new products or
processes – are more likely to apply for finance than other firms (higher demand), but that
they are more likely to find it difficult to access finance (restricted supply). From our
bivariate results, innovative firms who apply for finance are more likely to find it difficult to
obtain. This absolute credit rationing effect has worsened significantly since the crisis. When
controlling for the other characteristics of the firm and their likelihood of applying we find
whilst that access to finance has worsened for innovative firms overall (in absolute terms), but
that in relative terms the gap with non-innovative firms in credit access (quantity rationing)
has generally closed. The one notable, and important, exception is for absolute credit
rationing from all sources which has worsened in absolute and relative terms for innovative
firms.
This suggests that there are two distinct effects operating. First, we find a significant
structural issue in the UK financial system which means it is harder for innovative firms to
access finance per se. Second, we find evidence of a cyclical issue caused by significant
reductions in bank lending since the credit crunch. This cyclical problem has caused problems
for all firms. The worsening absolute credit rationing problem for innovative firms is of
concern. Thus, we have an interesting dual effect at work: less credit is available in general
(quantity rationing), but even though there is a narrowing of the ‘gap’ between innovative and
non-innovative firms, it remains the case that innovative firms still find it harder to access
credit. Of even greater concern is that innovative firms are increasingly more likely to face
absolute credit rationing in the market during and after financial crises.
This paper makes a number of contributions to the literature on access to finance for small
innovative firms. It is the first to empirically consider how access to finance for innovative
4
small firms has changed since the crisis. To date the majority of the finance-innovation
literature has focused exclusively on Venture Capital and other equity instruments (North et
al. 2013). Instead, we focus on more standard, but more widespread, forms of finance. We
also extend the analysis beyond R&D intensive, high-technology industries (Hall, 2002).
Moreover, our measure of innovation is more inclusive than that in other studies which have
tended to focus on R&D activity.
The remainder of this paper is structured as follows. Section two considers the literature on
access to finance for innovative firms. Section three describes the data, the Small Business
Survey, and how we define access to finance and innovation. Section four presents
descriptive results and shows that innovative SMEs are more likely to apply for finance than
other firms (higher loan demand), but find it harder to obtain (lower loan supply). Section five
estimates a series of probit regression models, with selection effects, which investigate this
further. Section six considers implications for research and policy.
2. Access to finance for innovative SMEs
Since the analysis of Schumpeter, finance has been seen as a vital part of innovation
processes (O’Sullivan 2005; Mazzucato 2013). Yet it is not always clear that innovative firms
are able to access the finance they need. For some time, researchers have been concerned
about the potential for structural problems in the UK financial system which make it harder
for innovative firms to access the finance they need (Freel, 2007). In addition, the credit
crunch of 2008 will have had a cyclical effect. Restrictions in credit will have worsened the
availability of finance for all firms and may also have exacerbated problems for certain firms
in particular, such as younger or smaller firms.
Structural problems in the supply of finance for innovative firms
There are three main reasons why there may be a structural problem of access to finance for
innovative small firms. First, the returns to innovation may be uncertain and thus make
innovation riskier to finance (Hall, 2002; Coad and Rao, 2008; Mazzucato 2013). Only a
fraction of firms tend to experience significant growth following investments in innovative
activity, with many products failing to be successfully commercialised or simply failing in the
marketplace. There is no guarantee that investments in research and development (R&D)
activity will lead successfully to new products. Failure rates are often high, making
innovation an inherently risky activity.
5
This problem of uncertainty may be particularly acute for small and medium sized enterprises
(SMEs) who lack the scale to invest in multiple projects and so risk ‘putting all their eggs in
one basket’ (Freel, 2007: 23). Past research has shown that the returns from innovation may
be highly uneven, with a small number innovative projects leading to significant gains but
most yielding little (Coad and Rao, 2008). Large firms are able to field more diverse
portfolios and, even if they have more failures, they are also more likely to achieve at least
one highly profitable innovation.
Second, there may be information asymmetries making it harder for banks to value innovative
investments (O’Sullivan, 2005). In part, this stems from the problems of uncertainty outlined
above. But it might also be because innovative products are by definition new – they may
require specialist valuation, such as that provided by a Venture Capitalist (VC). The skills
needed to evaluate innovative investments may be different from those for other types of
SME lending and investment and may be highly sector specific. As banks are less interested
in the value of the business, compared to VCs or other outside investors, they are less likely
to finance innovation as a key criterion in banks loan evaluation process is the judgement of
‘serviceability’, the ability of the stream of cash-flow generated by an investment to repay the
capital and interest (Mina et al. 2013). One view is that these ‘information opaque’ SMEs
require different sorts of lending focused on long-term relationships – although it may also
make them more reliant on credit scoring technologies (Berger and Udell, 2006). Because
those firm has more information on the potential success of innovations than the financier, in
some cases the market for innovation finance can resemble Akerlof’s (1970) ‘market for
lemons’ – a lack of information on which firms are worth financing increasing the cost of
finance and reducing the probability of successful applications.
Third, new innovations may be highly context specific. Intangible capital produced as part of
a research process may not be useful collateral outside the firm itself (Mina et al. 2013). For
example, a new process innovation may apply only within the firm in which it operates.
Overall, these reasons may make it harder for innovative small firms to access finance, or
may mean banks provide finance at a higher cost (Hall, 2002; Hutton and Nightingale, 2011).
Several studies have found evidence for a structural problem in the supply of finance for
innovative firms. Research has focused more on the ability of firms to access the finance they
need to innovate. Canepa and Stoneman (2007) suggest that finance is more likely to be a
factor hampering innovation for small firms and those in high technology sectors, a finding
echoed by studies using different datasets (Czarnitzki, 2006). Freel (2007) shows that small
firms which apply find it harder to successfully obtain loans than others, although his results
6
are more conclusive for R&D intensive small firms than those which introduce ‘novel’
products and processes (a closer measure to that used in this paper).
A second study with a similar focus on access to finance is Mina et al. (2013), who study both
UK and US firms in the period before the recession. Their results show a considerable degree
of nuance, depending on the measure of innovation used. When using R&D intensity as a
measure, they find firms are no more (or less) likely to apply for finance than other firms.
Using other measures of innovation – whether firms introduce new products, processes or
organisational innovation – they find that innovative firms are actually more likely to obtain
finance than other firms in the United States, but not in the United Kingdom. Alongside this,
a wider literature focusing on new technology based firms also suggest that financing can be a
problem for this sub-set of innovative firms (Revest and Sapio, 2010).
Cyclical changes in access to finance
There is considerably less evidence on the existence of any cyclical effect, at least for
innovative firms specifically. The Schumpeterian process of creative destruction will have
two impacts (Archibugi et al. 2013a). In the first place, firms will replace older products,
processes and services with newer and more efficient versions. Alongside this, weaker firms
and those with less efficient business models will be forced to close. This dual process shows
how recessions can contribute to technological progress, but this Schumpeterian theory also
has implications for financing. In the downturn, firms will experience reduced demand for
their products. In response, they will make investments in innovative products or services
which they will expect to become commercially successful as the economy makes its cyclical
recovery. Because of this, Schumpeterian theory (1939) makes an argument for counter-
cyclical investment in innovation, with increased demand for finance in the downturn.
However, evidence suggests that investment in innovation is strongly pro-cyclical – the
'demand-pull' theory of innovative activity suggested by Schmookler (Kleinknecht and
Verspagen, 1990; Filippetti and Archibugi, 2011). Rather than a Schumpeterian view of
innovative firms seeking external finance as part of a wider system, under this view firms
invest internal resources into innovative activities. Because reductions in demand will also
impact on firm balance sheets, and so the availability of internal finance, recessions may limit
their investments in innovation. A potential effect of this is that innovative firms are forced to
increase their demand for external finance to ensure they can bring products to market and
take advantage of a return to economic growth.
Since the financial crisis of 2008, lending to small firms declined significantly (Cowling et
7
al., 2012; Armstrong et al., 2013; Mason, 2013). There were fewer lenders as foreign
institutions left the market, while existing banks became more risk averse. Different criteria
are often used for lending and with firm size and track records becoming increasingly
important determinants for lending, micro and young business are, in particular, being
restricted in their access to capital (Cowling et al., 2012). Considering the standard risk
assessment measures used by banks, SMEs were, on average, more risky investments than
before the crisis – according to Fraser (2009a), the percentage of high risk SMEs increased
from 4.4% to 21.7% between 2004 and 2008.
The most relevant study on the effect of the crisis is North et al. (2013) who consider finance
gaps for technology based small firms (TBSFs) before and after the crisis, using a survey of
100 firms. They show that the availability of finance for these firms worsened considerably in
the crisis. However, they focus on only a small sample of innovative firms and cannot
compare their experience with the wider business population. No studies have considered
whether this effect is more general, and whether the cyclical effect has impacted particularly
on innovative firms.
In summary, research has suggested a number of theoretical reasons for a structural effect
making it harder for innovative firms to access finance, and a number of studies have
considered this issue empirically. There is less evidence, however, on any cyclical effect
which would disproportionately effect finance for innovative firms changes in a recession. In
the remainder of this paper we set out to investigate these issues.
3. Defining innovative SMEs and finance gaps
3.1 The Small Business Survey
Our data is the Small Business Survey, a UK government dataset of Small and Medium Sized
Enterprises (SMEs). These firms are defined as those with fewer than 250 employees.,
although we exclude those without employees as these firms may face particular issues
relating to finance.1 We use three waves of the data: 2007/8, 2010 and 2012. Our data is
essentially a repeat cross-sectional survey and it is unlikely that firms will have appeared in it
more than once. Note that firms sampled in the 2007/8 survey were surveyed before the
financial crisis (Williams and Cowling 2009).
1 The survey was called the “Annual Small Business Survey” in 2007/8.
8
The sample frame for the SBS is the Dun & Bradstreet database. The survey is conducted
using Computer Assisted Telephone Interviewing (CATI) with interviewers asking to speak
to owners, proprietors, managing directors or other ‘senior decision makers’. The sample is
stratified by nation, size and sector with some boosts (dealt with through weights, which are
provided by the UK Department for Business, Innovation and Skills to make findings
representative of the general business stock). There is no resampling between waves and
given the scale of the sample such resampling is unlikely to be a significant problem. Once
ineligible firms are excluded from the sample, the response rate was just over 58 percent in
2012, up from 52 percent in 2010 (Department for Business, Innovation and Skills, 2013b).2
The sample is divided into two sets: before the recession (2007/8) and after (2010 and 2012).3
To ensure that our statistics are comparable with published statistics we also only include
firms which employ people (‘SME Employers’). The final sample is 10,708 firms,
considerably larger than other similar work.
3.2 Identifying innovative firms
Our measure of innovation is whether a firm has introduced a new product in the previous 12
months, where the innovation is new to the market not just new to the firm. This measure is
relatively tightly defined, as it does not include firms who simply adopt new innovations from
elsewhere. For example, a manufacturing firm which simply copies a product produced
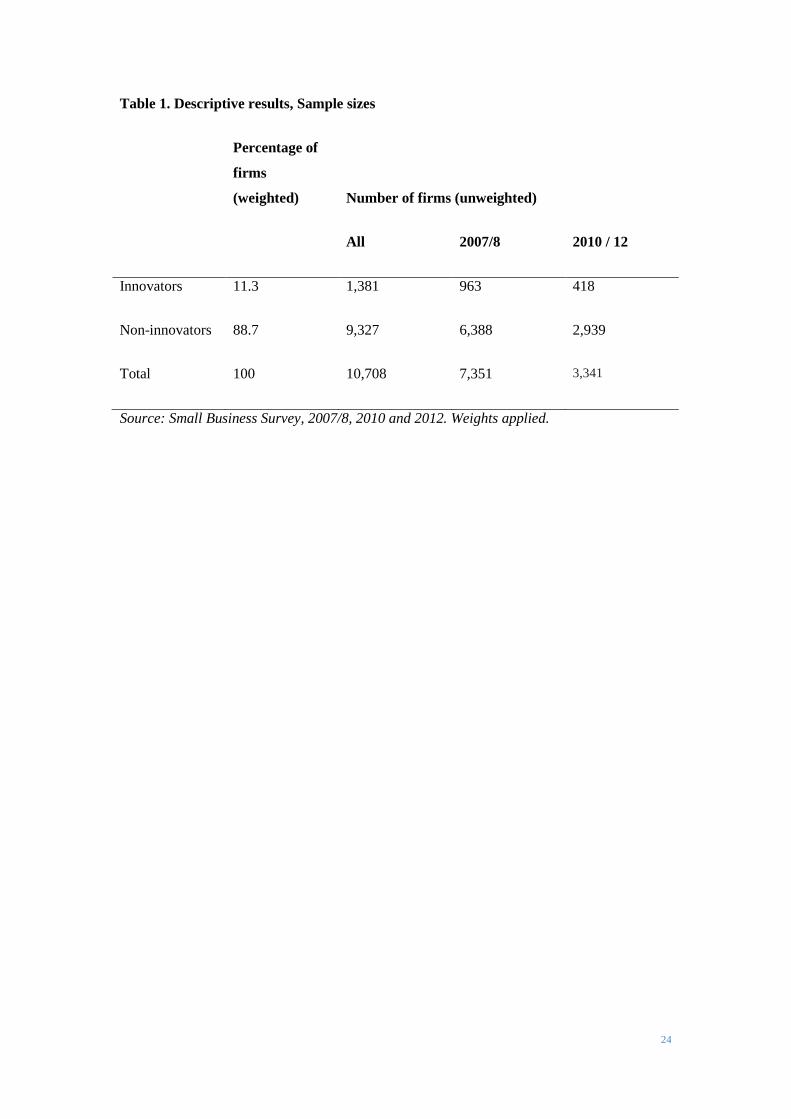
elsewhere will not be included in this measure – but one which develops an entirely new
product will be. In total, 1,381 of 10,708 firms are innovative (a weighted 11 per cent of the
sample).
There are a number of strengths to this measure. First, it is an output measure of innovation,
rather than an input. Because of this, it complements other research which tends to use R&D,
an input measure. It is also similar to the measure of product or process innovation used by
work such as Freel (2007) and Mina et al. (2013). Second, our measure is suitable for more
mundane innovation in services alongside high-technology sectors. An alternative innovation
measure would be patenting, but only 4 per cent of innovation active firms actually do this
(Hall et al. 2013). Similarly, research and development (R&D) spending is likely to have a
distinct sectoral bias. But our measure is also wide enough to include firms who introduce
organisational innovations, innovations which are not patented but which represent new
products or services, or other ‘soft’ innovations. Finally, the measure seems to be a good 2 Response rates are not available for the 2007/8 survey. 3 We do this for two reasons. First, to ensure clarity of interpretation between the pre- and post- recession results. Second, because small samples can can lead to erratic results in probit models, we do it to ensure the results are robust.

9
predictor of subsequent growth.
Table 1 around here
As with all measures of innovation this has some limitations. Firstly, it is not possible to
account for the significance of new products – a significant new drug will seem the same as a
more prosaic new product. In particular, we cannot tell the extent to which firms successfully
commercialise the new innovations and their impact on subsequent business performance. To
address this problem, we use a relatively tight definition of innovation (and one correlated
with subsequent growth). Secondly, the results may be biased by sector. To address this
problem we control for sector in our regressions. All measures of innovation, including R&D,
will be biased towards particular sectors. Our measure is at least broadly applicable across the
economy.
3.3 Identifying problems in accessing finance
We use four measures of both the incidence and severity of credit constraints. In the SBS,
firms are asked first whether they apply for finance: “Have you tried to obtain finance for
your business in the past 12 months?” Firms which have applied for finance are then asked a
second question, “Did you have difficulties obtaining this finance from the first source?”4
This gives three potential levels of difficulty for firms which have applied for finance:
(1) Firms which had trouble getting finance from the first source they tried
(2) Firms which did not get all the finance they needed from the first source they tried
(3) Firms which did not manage to get any finance from the first source they tried
These are not mutually exclusive, so firms which are in the final category will also be
included in the previous two.
Measures (1) – (3) are useful as they give an indication of the difficulty firm’s face in access
to finance. These measures capture quantity rationing, not being able to access all the credit
one sought, and also provides an indication of potential search costs as initial applications are
refused and firms seeks alternative sources. However, some firms may go on to obtain finance
from elsewhere so we supplement it with an additional variable:
4 The SBS asks for finance from a number of sources, the most common being (in 2012): bank loans, overdrafts, grants and leasing and hire purchase. Specialist sources of finance such as Venture Capital are included, but these are only relevant to a small share of SMEs (around 1 percent of those who apply for finance).

10
(4) Whether firms fail to obtain finance from any source
This is the purest measure of difficulties in accessing finance. A key strength of this measure
is that we identify problems faced in accessing finance of any source, and so include banks –
commonly seen as the body least likely to appropriately provide finance for innovative firms
(Freel 2007). This captures absolute credit rationing.
3.4 Bivariate results: Access to finance
First, we consider simple bivariate relationships between innovation and problems accessing
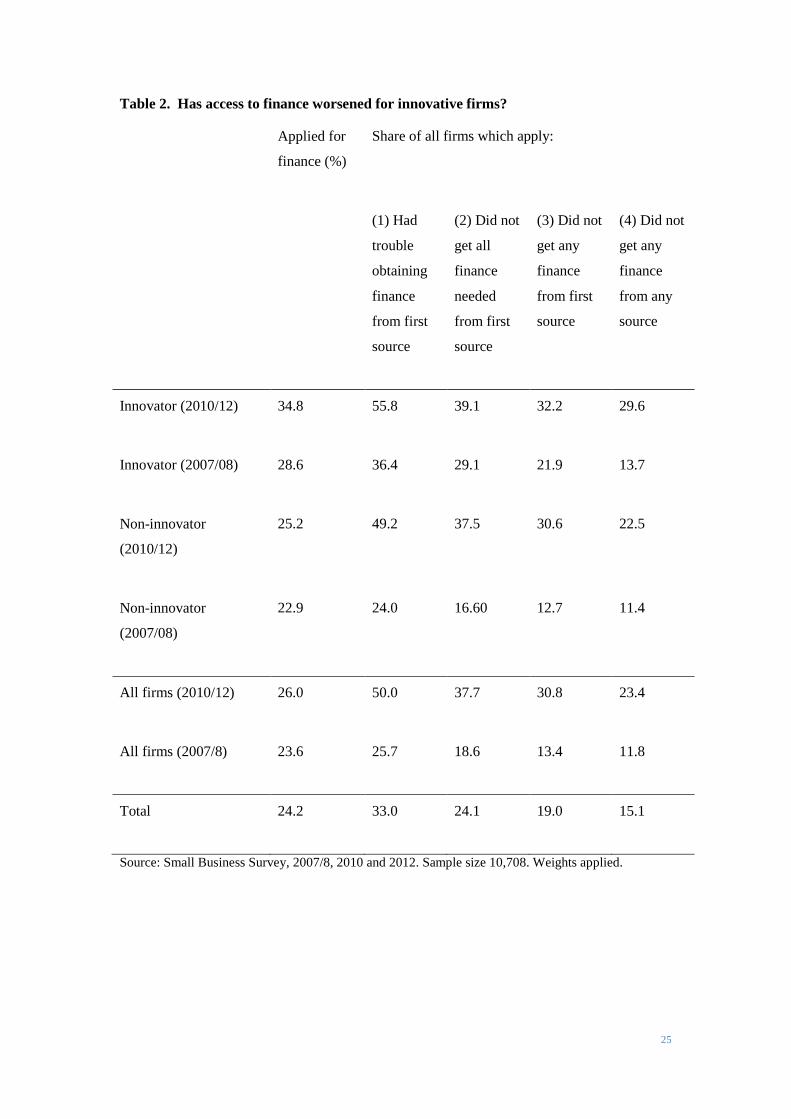
finance. Table 2 gives summary statistics for innovative SMEs and their ability to obtain
finance. The first finding is that innovative firms are more likely to apply for finance than
other firms. Moreover, innovative firms sampled after the recession were slightly more likely
to apply for finance than before the recession: 35 per cent applied in the latter period
compared to 29 per cent beforehand. This reflects a general trend, with applications also
slightly higher for non-innovative firms (from 23 to 25 per cent). Research suggests that
riskier firms may be discouraged from applying for finance in some circumstances (Han et al.
2009). Overall, the results here suggest this innovative firms were not discouraged from
applying for finance and are not consistent with the view that innovative firms are particularly
likely to be discouraged.
Insert table 2 around here
However, while innovative firms are more likely to apply for finance they are also more
likely to have trouble obtaining it – the share of innovative firms finding it hard to obtain
finance has worsened since the crisis. In the period after the recession, 56 per cent of
innovative firms who seek finance had trouble obtaining finance, compared to only 36 per
cent beforehand – a jump of almost 20 percentage points. This highlights a significant
problem faced by innovative firms since the crisis, with a steep increase in the share finding
access to finance hard to obtain. The percentage of innovative firms who get no finance from
any source has more than doubled. Before the recession, 14 per cent of innovative firms who
sought finance were unable to obtain anything. Since the recession, this figure has reached 30
per cent. In simple regressions, this is statistically significant (p=0.001). We can also see that
since the crisis, almost all innovative firms that do not get any finance from the first source do
not subsequently obtain any finance from any other source either. This was not the case
before the crisis, where 22 per cent did not get finance from the first source and 14 per cent
11
did not get finance from any source.5
4. Innovative firms and the crisis
4.1 Empirical strategy
The results above may be driven by other firm characteristics, with innovative firms more
likely to aim to grow or having other, different characteristics which are correlated with
access to finance. To control for this, we estimate a series of probit regression models for
whether firms have difficulty obtaining finance (see Fraser et al. 2009b; Mina et al. 2013; Lee
and Drever, 2014 for similar applications). These take two forms: (1) probit regressions
where the dependent variable is either application for finance or one of the measures access to
finance discussed above, or the choice to apply, and (2) Heckman regressions which also
consider success of application for finance but which also control for selection effects in the
likelihood of firms to apply for finance. In addition, we include a set of independent variables
which control for the other characteristics of the firm which may be associated with both
applications for finance and the success of the applications.
4.2 Independent variables
We also include control variables for a set of these firm characteristics – firm size, age and
sector, the gender, ethnicity and qualifications of the management, the number of directors
and recent changes in firm turnover. While many of these controls are standard (see
Armstrong et al. 2013) we include a fuller set of controls than in some other similar work
(Mina et al. 2013), in part because otherwise our innovation measures may be correlated with
omitted variables. In the following we justify our selection of control variables more closely.
First, firm size is likely to be important. Larger firms are seen as less risky and so preferred
by lenders. Moreover, firm size will influence valuation costs, although it is not clear whether
there will be economies of scale or whether increased complexity of larger firms will raise
costs (Canton et al. 2012). We control for three size categories: micro (1- 9 employees) and
small (10 – 49 employees), with large firms being the reference category (50 + employees).6
5 An important question is differences between the 2010 and 2012 samples. We conducted some exploratory analysis on this point and – while it seemed access to finance had become easier for innovative firms in this period, we found no statistically significant changes. This is an important question for future research on this topic. 6 An alternative would be to insert the variable as a continuous measure of total employment, however we prefer to include these dummy variables to account for potential non-linearities in the data.

12
Second, older firms will tend to have entrenched business models with a steady track record
and reputation and so will be less risky. We control for this with three age categories –
whether firms are aged 5 – 10 years or 11 + years. The reference category is less than five
years. In the recession, older firms found it easier to access credit, although this was
sometimes due to their larger size (Cowling et al., 2012).
Third, we control for a series of owner characteristics. Studies have suggested that gender
discrimination is unlikely to be significant in access to finance, but that gender may be
correlated to other factors – such as different working patterns or childcare responsibilities –
which are associated with reduced access to finance (Carter and Rosa, 1998). Because of this,
we expect the sign on this variable to be negative.
A number of studies have considered ethnic discrimination and whether ethnic run firms are
more, or less, likely to obtain business finance (Fraser, 2009b). These have tended to suggest
that ethnic discrimination is not a significant problem, at least when controlling for the
characteristics of firms and entrepreneurs.
The qualifications of entrepreneurs will be important in determining their access to finance.
Better qualified entrepreneurs may have their own financial resources, and this will change
the type of finance they are applying for. They may be better able to present their case to
banks, and have access to contacts who can help them do so. Yet it may be that qualified
entrepreneurs are more ambitious when applying for finance, and so are more likely to be
refused. Nevertheless, we expect a positive sign on this coefficient.
Additionally we control for the number of directors. We expect larger numbers of directors to
be associated with greater success in accessing external finance, as it will provide access to
better external connections and sources of knowledge.
In addition, we control for whether firms aim to grow. Firms which aim to grow are more
likely to apply for finance, as they will need finance to grow if they cannot fund from internal
sources. However, it is unclear whether they are more likely to achieve access to finance,
controlling for this.
We use two measures of firm finance. The first is whether a firms’ turnover is increasing. If
so, balance sheets are likely to be better and firms are more likely to be applying for growth
capital. We expect this to be associated with greater likelihood of access to finance.
Conversely, firms with decreasing turnover are likely to be riskier and to be borrowing money
for different uses, for example to support declining cash-flows.
13
Finally, we include 13 sector dummies. We expect sector to be a significant determinant of
access to finance, in part because firms in different sectors will be seeking to access finance
for different reasons. For example, manufacturing firms are likely to ask for more money than
service firms because manufacturing is relatively capital intensive and scale of investments
are typically larger.
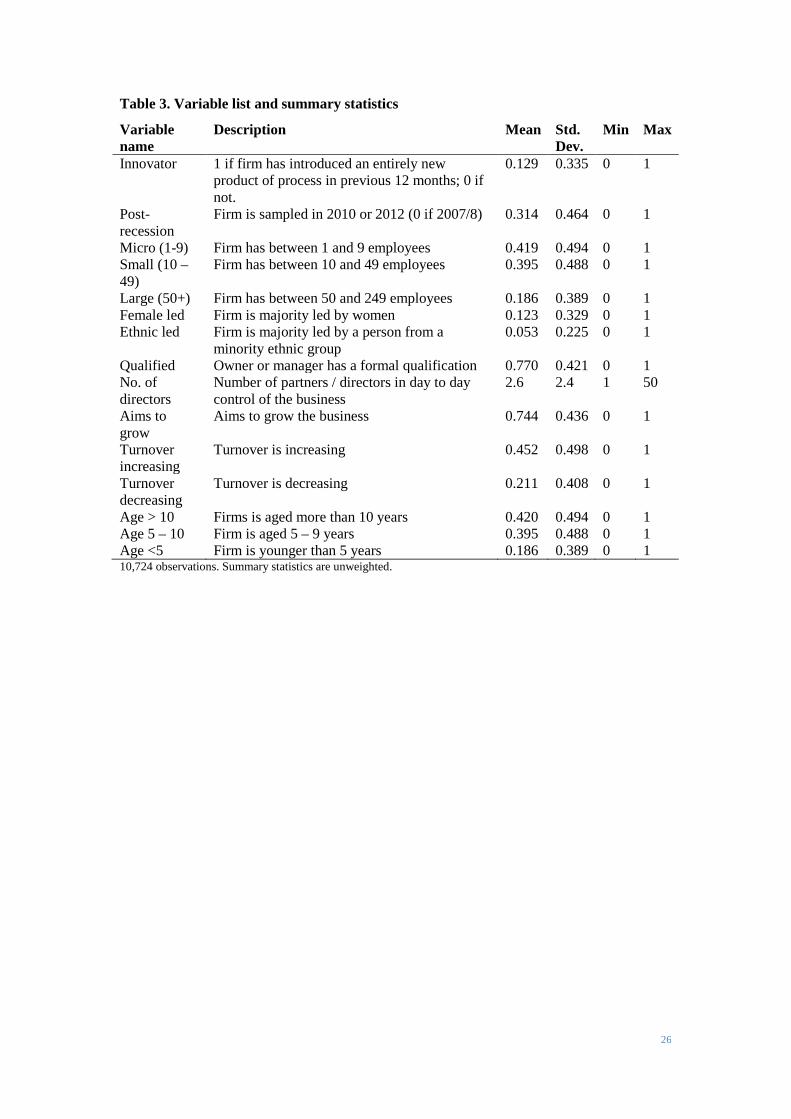
Summary statistics for the sample are given in table 3. Only around 13 percent of the firms in
the sample (a weighted 11.3 percent) are innovators. Most firms were sampled before the
recession, and while there is some bias towards micro firms (42 percent) there are also a
significant number of small (40 percent) and medium sized firms (19 percent). A small share
of firms are majority run by women (12 percent) and members of ethnic minorities (5
percent). A large share have qualifications (77 percent) and aim to grow (74 percent). The
average number of directors or partners is 2.6, and more firms report increasing (45 percent)
than decreasing turnover (21 percent). The firms are generally relatively old, with 42
percentage being older than 10 years, 40 percent being aged between 5 and 9 and a minority
younger than 5 (19 percent).
4.3 Basic results
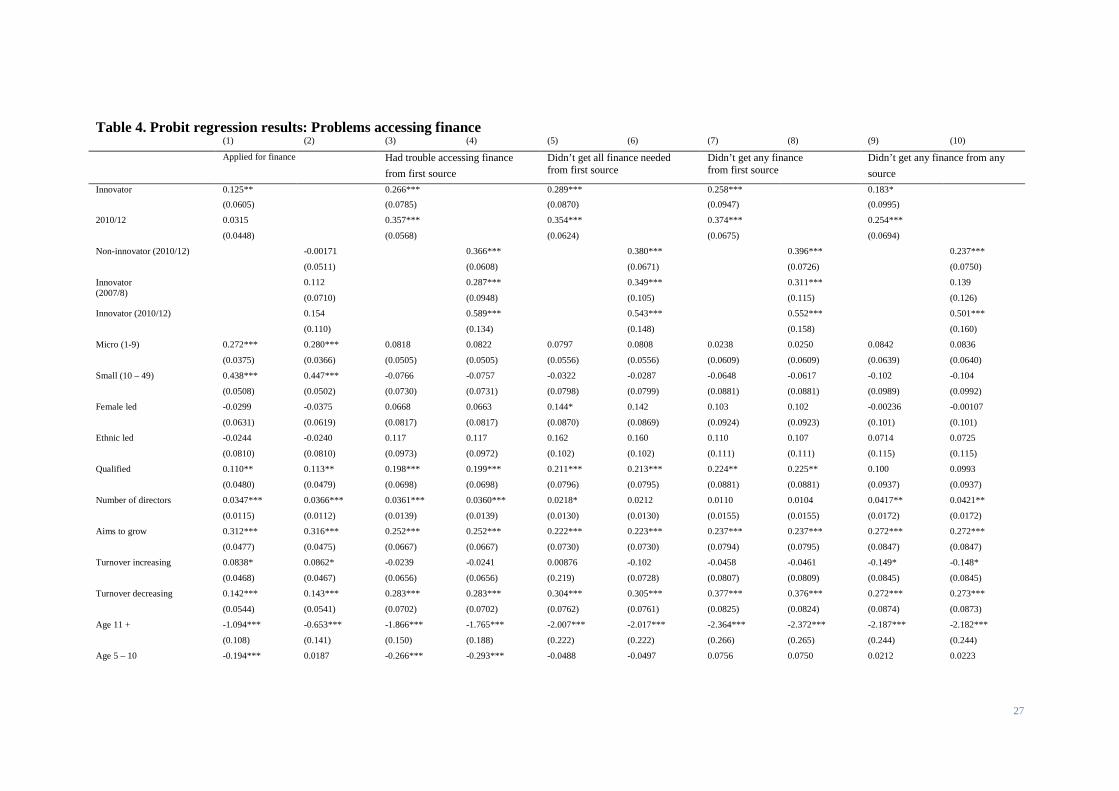
Our basic results are given in table 3, which present probit regressions where the dependent
variable is whether firms have applied for finance (columns 1 and 2) or one of the four
measures of difficulty in accessing finance (columns 3 to 10), and the independent variables
are the set of controls outlined above.
Models one and two consider the likelihood of firms applying for finance. Compared to firms
in the reference category, innovative firms are more likely to apply for finance than other
firms. While the coefficient for the period after the recession is positive, it is not significant at
standard levels. In column 2 we break the sample into the categories of innovative firms
before and after the recession. While the coefficient on both variables is positive, it is not
significant in either case. The magnitude of any effect seems to be slightly larger for
innovators after the recession, however. Micro and small firms are more likely to apply than
larger firms, as are qualified entrepreneurs, SMEs with more directors, those which aim to
grow and those which are either experiencing growth or decline.
The results suggest that innovative firms are more likely to find it difficult to obtain finance
than firms which do not innovate, even controlling for relevant factors such as size and sector.
The coefficient on the ‘innovator’ variable is significant against each of the first three
variables for trouble in accessing finance. We also find that they are more likely to face
14
absolute credit rationing from all sources, although the coefficient is only significant at the 10
per cent significance level. Our results suggest that the inability to finance innovative firms
appears to be a structural problem across the financial system.
Insert table 3 around here
Our evidence also shows that firms in 2010/12 are more likely to be turned down for credit
than those in 2007/8. The coefficient for the ‘2010/12’ dummy is significant in all models.
Credit conditions have worsened in the period for all firms, even controlling for whether they
are innovative or not, reflecting the cyclical impact of the crisis.
Models 4, 6, 8 and 10 include three dummy variables to consider in more detail the links
between innovation and access to finance before and after the crisis (the reference category is
non-innovators in 2007/8). They show that access to finance became worse for non-
innovative firms: the coefficient is positive and significant for all models. However, the
coefficient is largest for innovative firms in the latter period: it is significant and positive
against all four measures of trouble accessing finance. But, whilst it is still the case in
absolute terms that innovative firms are more likely to be rationed in the market, in relative
terms this gap with non-innovative firms closes when considering our measures of quantity
rationing. The notable exception to this general pattern is for absolute rationing from all
sources. Before the financial crisis, innovative firms were not particularly likely to be unable
to find finance from any source – since the crisis, they are much more likely to face absolute
credit rationing.
The control variables yield further insights into the type of firms who have problem accessing
finance. Size seemed only marginally important, with micro firms slightly more likely to
report finding it difficult to access finance, albeit at only the 10 per cent significance level.
There is also some limited evidence that female led firms find it harder – firms run by females
are more likely to claim they do not get all the finance needed, although the coefficient is only
significant at the 10 per cent significance level. The results also support other work which,
controlling for selection, finds little evidence for ethnic discriminations (Fraser, 2009b).
Similarly, firms which have qualified owners, more directors or aim to grow are more likely
to find it hard to apply for finance in various ways. Each of these results is surprising, and so
suggests that selection may be an issue and that these firms may be more likely to apply for
finance. Less surprisingly, firms which are seeing decreasing turnover are more likely to find
it hard across all four measures of difficulty. Finally, we find evidence that age matters and
younger firms are more likely to find it difficult to access finance.
15
4.4 Results with Heckman selection
One potential issue with the results of table 4 is that firms with particular characteristics are
more likely to apply for finance (firms which do not apply for finance cannot be refused). To
deal with this, we use a Heckman selection model to correct for the probability of firms
applying for finance (see Mina et al. 2013 for a similar application). This essentially estimates
two models. The first estimates the probability of a firm applying for finance, based on
observable characteristics. The estimated probability of applying is then used to ‘correct’ the
second model which estimates whether a firm finds it hard to obtain finance. Table 4 presents
the results. Note that we do not include the first stage regressions as these are very similar to
the 'applied for finance' regressions in table 3 (columns 1 and 2).
Insert table 4 around here
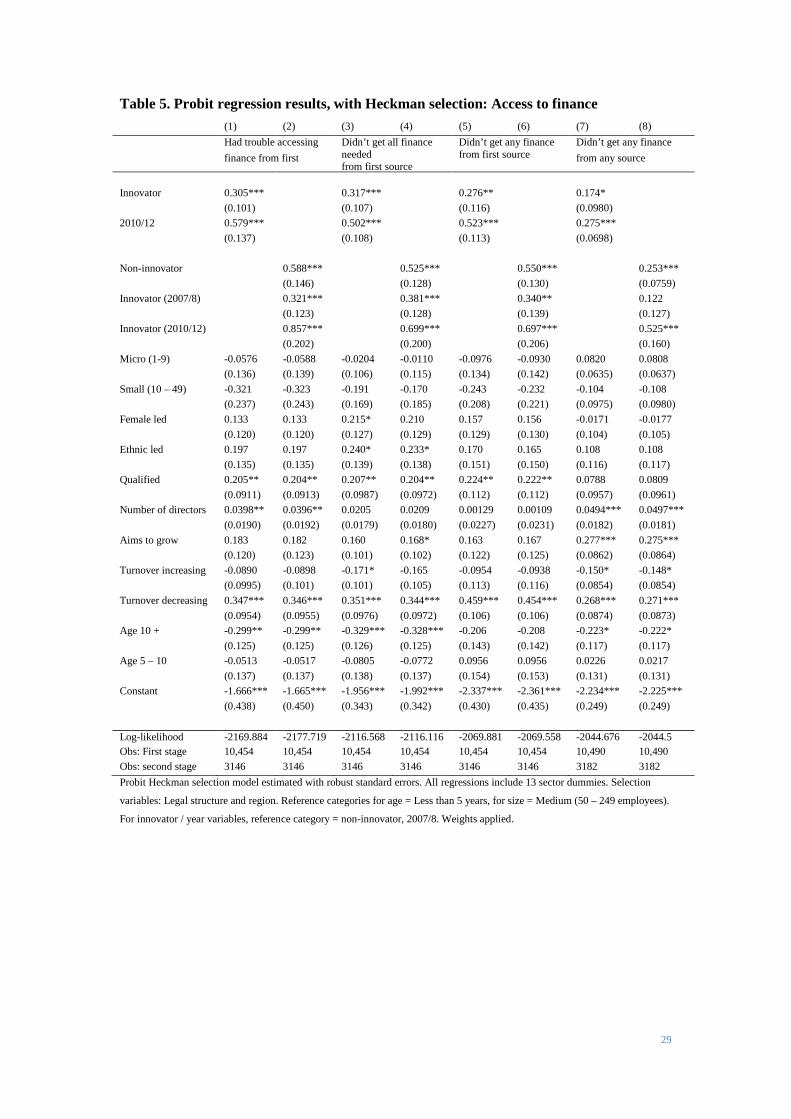
The results controlling for selection support our core result: even controlling for selection
effects, innovative firms are more likely to find it difficult to access finance. The coefficient
is positive and significant in almost every case. We also find that, even controlling for
likelihood of applying, firms in 2010 / 2012 are significantly more likely to find it difficult to
access finance. As other research has suggested, it has become significantly more difficult for
firms to access finance than before the recession (Cowling et al., 2012).7
However, we find less evidence that it has become relatively harder for innovative firms
specifically. In fact there is a general narrowing of the relative gap between innovative and
non-innovative firms, with one notable exception. It is still true that innovative firms are more
likely in all periods to face absolute credit rationing from all sources and importantly that this
effect is exacerbated in periods of crisis. This suggests that the value of additional search,
which imposes a cost to the firm, is lower for innovative firms than their non-innovative
peers. The increased likelihood of innovative firms being turned down for finance since the
crisis which was documented above is due to a general worsening of credit conditions and the
characteristics of innovative firms, rather than their innovative nature per se except for
absolute rationing from all sources.8
7 A referee notes an alternative explanation: a significant reduction in the quality of SMEs since the crisis. While this may be a possibility, given the weak labour market experienced in this period and the increases in self-employment the UK experienced, it is unlikely to account for the scale of the change we identify. Moreover, it is possible that average firm quality actually increased as firms with weaker business models closed during the recessionary period. 8 A reviewer suggests running regression with differential year samples. While the smaller sample size makes the results less robust the results of this approach seem to confirm the results here. When controlling for sample selection and considering the basic measure of problems accessing finance, the coefficient for innovative firms is statistically significant in the earlier but not the later sample
16
The results controlling for selection reveal a number of potential factors. Firms which aim to
grow are particularly likely to come away with no finance, perhaps reflecting a more
ambitious outlook which means they are asking for larger amounts of finance. Once we
control for selection and the increased likelihood of larger firms applying for finance, size
does not matter. There is some evidence that both female led and ethnic led firms are more
likely to not get all the finance needed. Firms with more directors are more likely to have
trouble accessing finance, and are particularly likely to fail to get finance from any source.
Again, this may reflect the finance they apply for, with multiple directors leading to more
ambitious applications.
As expected, firm performance, captured by sales change, is important. Firms with reduced
turnover are more likely to find it difficult to access finance – a result common across all
measures. Older firms were also more likely to find it difficult to get finance, but not
necessarily to come away with nothing, an indication of quantity rationing.
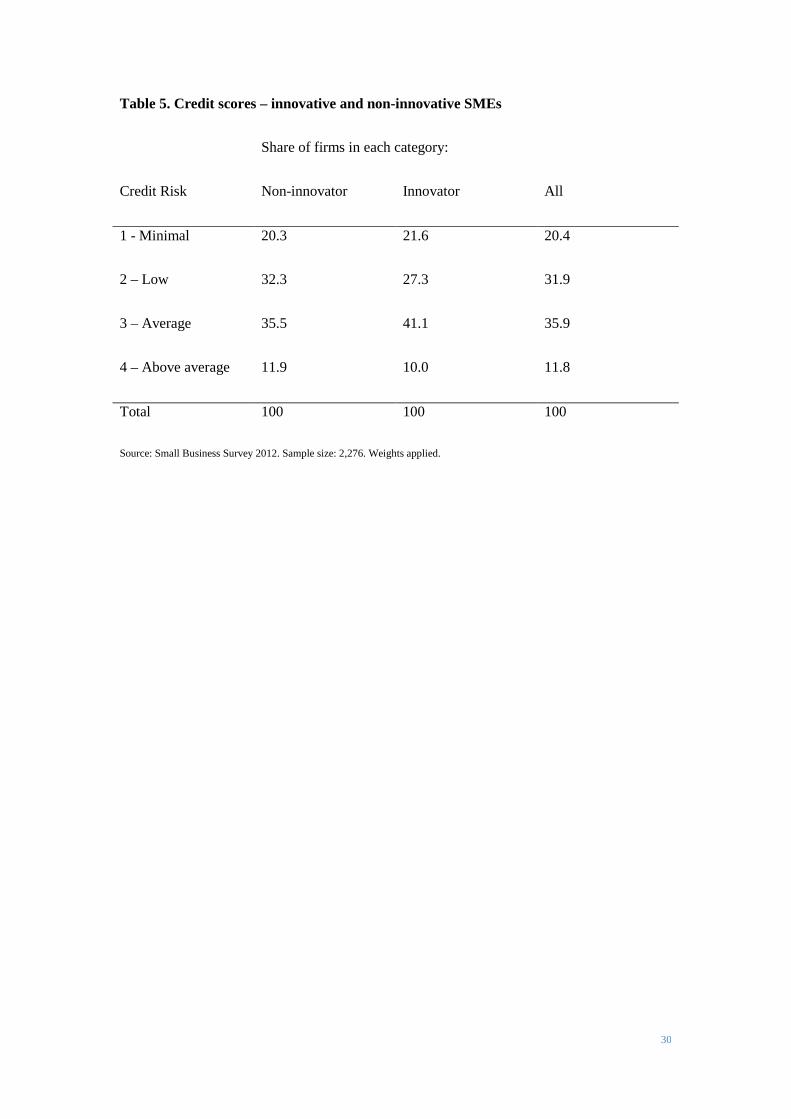
4.4 Credit scores and access to finance
One important issue for the interpretation of our results is that we do not have an objective
measure of the ‘quality’ of the firm and nor do we have full credit details of the firm. It might
be, for example, that innovative firms have worse credit scores and a lack of supply of
external finance results from this, not their innovativeness per se. Unfortunately, the early
versions of the SBS do not have a credit score variable which means we are unable to
compare credit scores before and after the recession. However, the 2012 survey does come
linked to credit scores which allows us to test for these effects. These credit scores are
calculated by Dun & Bradstreet using data on the individual firm, including their past credit
history, legal judgements and the profile of their directors. These are very similar to the actual
credit scores which would be used by banks to evaluate any loans. Table 5 presents results
using these credit scores.
Insert table 5 around here
Overall the results suggest there is little difference in the credit scores of innovative firms
compared to the general SME population. Innovative firms are slightly more likely to be in
the ‘average’ credit rating compared to other firms (41 per cent against 36 per cent). And
they are slightly less likely to be in the ‘low’ credit risk’ (27 per cent against 32 per cent).
These differences are not statistically significant against standard metrics. In short, any (although p = 0.105). The coefficient is significantly smaller in magnitude (0.22 compared to 0.31). This suggests than an interpretation that there has been a convergence of difficulties in accessing finance is correct.

17
difficulties in access to finance faced by innovative firms do not appear to be caused driven
by their objective risk criteria.
5. Conclusions and policy implications
In the wake of a major financial crisis, there are concerns that access to finance is an
increasingly significant barrier to business growth. This is particularly problematic if it
prevents innovative firms from accessing the finance they need to bring innovative products
and processes to market, grow and create jobs in the recovery. This paper has used a large
scale survey of UK SMEs from before and after the crisis to investigate the differential
impact of the ‘credit crunch’ on innovative firms. The results show that innovative firms find
it harder to access finance than other firms, but that the worsening in the availability of credit,
and more specifically the amounts available, over the past two years has been systemic, for all
firms rather than specifically for innovative SMEs. However, these general findings do not
hold when we explicitly consider absolute credit rationing from any source (i.e. firms unable
to obtain any finance at all). Innovative firms start at an absolute disadvantage compared to
their non-innovative peers. Yet while financing has worsened for both types of firms,
innovative firms have done relatively worse and are particularly likely to face absolute credit
rationing.
Our findings have some implications for theory in this area. Our univariate evidence strongly
shows that innovative firms have higher demand for external capital, and that this demand
seems to have increased since the finance: before the crisis, 28.6 percent of innovative firms
had applied in the year previously; after the crisis, 34.8 percent had. These findings accord to
a Schumpterian (1939) view of counter-cyclical investment in innovation, with firms
investing after the crisis to take advantage of the cyclical return to economic growth.
However, these results are not statistically significant once controlling for other firm
characteristics. Indeed, part of the effect may be due to the changed composition of firms, as
some firms close in the crisis period. They are also consistent with the demand-pull theory
with worsened balance sheets reducing the potential for firms to make investments using
internal capital, and so ensuring they seek finance from outside.
These theories are also consistent with our finding that while access to finance has worsened
overall the relative gap between innovative and non-innovative firms has closed. With
reduced credit availability, banks may have been looking more closely at firms which were
able to make an increased investment in growth. Yet it is harder to reconcile them with our

18
finding that absolute credit rationing has worsened for innovative firms in both absolute and
relative terms. The explanation may be more mundane, with banks willing to provide a
certain amount of incremental capital for growth but not willing to provide the larger the
sums requested by innovative firms.
Our results suggest that problems remain for innovative small firms, and that this is not
simply due to risk profiles. In fact, using standard credit scores, there are very few substantive
differences in risk profiles between innovative and non-innovative firms. This means they add
a new level to long-standing concerns about the nature of bank finance for innovative
companies in the UK (Mina et al., 2013). In particular, there is a risk of discouragement with
innovative firms being increasingly less likely to seek finance (Hutton and Nightingale,
2011). Our results suggest that innovative firms are, if anything, more likely to apply for
finance now than before the recession. We cannot tell, however, whether this is driven by an
increased demand for working capital rather than long-term finance.
The results have implications for policy. First, they have implications for the financial system.
They suggest that access to credit may be restricting the growth of innovative firms. But firms
do not have a ‘right’ to access to finance, and if firms are not receiving credit this is not
necessarily a problem - indeed, oversupply of credit before the crisis may have been a more
significant issue (Mason 2013). As Freel (2007: 32) notes, there is “little or no evidence” that
bank lending decisions are not “rational and legitimate appraisals of the risk profile of
innovative small firms”. Yet, while clearly the decisions may be rational for the bank, there
may be a public good argument for investments in innovative firms. One way of addressing
this would be through efforts to diversify types of lending, either through increasing diversity
in the banking system or newer forms of finance such as crowdfunding.
A second implication is for economic policy. In times of crisis, new firms may introduce new
products and enter markets, with this being an important driver of growth (Archibugi et al.,
2013b). If access to finance is not available, this may lead to a long-term drag on the
economy, particularly if firms are then deterred from introducing new products in response
(D’Este et al. 2012). Policies to address this may include those which help ensure new
innovative companies are established, although identifying the firms likely to innovate and
grow may be challenging (Archibugi et al., 2013b; Mason and Brown, 2013).
The results of this paper suggest some important areas for future research. First, our results
are for SMEs only and we lack data on the availability of finance for larger firms. Yet large
firms may face different challenges in applying for finance than larger firms. Future work
may consider this issue and also consider disaggregating our results according to different

19
ages of firms, sectors and so on. When data with larger samples become available, an
important application would be to consider how things changed in the period since the crisis.
Second, researchers may want to test these findings using other measures of innovation, such
as R&D. It would also be valuable to test for the significance of innovations and the extent to
which they are successfully commercialised.9 An important limitation of our research is that
we have only limited information on the quality of both the innovation and, more broadly, the
firm. While we have tried to address this using credit scores, future work may be able to
address it using better data as it becomes available. A third useful extension would also to be
to consider whether the results are UK specific or more general. It might be the case, for
example, that firms in countries such as Germany with more diversified banking systems will
find it easier to access finance (Filippetti and Archibugi, 2011). Comparative work would
help address this gap.
9 A reviewer adds the useful suggestion that the Community Innovation Survey could be used to undertake research along these lines.
20
References
Akerlof, GA.1970. "The Market for 'Lemons': Quality Uncertainty and the Market Mechanism" Quarterly Journal of Economics 84(3): 488-500
Archibugi, D., Filippetti, M and Frenz, M. 2013a. “The impact of the economic crisis on innovation: Evidence from Europe” Technological Forecasting and Social Change 80(7): 1247 – 1260.
Archibugi, D., Filippetti, M and Frenz, M. 2013b. “Economic crisis and innovation: Is destruction prevailing over accumulation?” Research Policy 42(2): 303 – 314.
Armstrong, A., P. Davis, I. Liadze, and C. Rienzo. 2013. “Evaluating changes in bank lending to UK SMEs over 2001 - 2012 - Ongoing tight credit?” NIESR Discussion Paper 408.
Beck, T. and Demirguc-Kunt, A. 2006. "Small and medium-size enterprises: Access to finance as a growth constraint." Journal of Banking and Finance, 30. 2931-2943.
Behr, P. and Guttler, A. 2007. "Credit risk assessment and relationship lending." Journal of Small Business Management, 45 (2). 194-213.
Berger, A. and Udell, G. 2006. “A more complete conceptual framework for SME finance.” Journal of Banking and Finance, 30 (11), 2945-2966.
Canepa, A., and P. Stoneman. 2007. “Financial constraints to innovation in the UK: evidence from CIS2 and CIS3.” Oxford Economic Papers 60(4):711–30.
Canton, E., I. Grilo, J. Monteagudo, and P. Zwan. 2012. “Perceived credit constraints in the European Union.” Small Business Economics DOI 10.100.
Carter, S., and P. Rosa. 1998. “The financing of male – and female – owned businesses.” Entrepreneurship & Regional Development 10(3):225–42.
Coad, A., and R. Rao. 2008. “Innovation and firm growth in high-tech sectors: A quantile regression approach.” Research Policy 37(4):633–48.
Cowling, M., W. Liu, and A. Ledger. 2012. “Small business financing in the UK before and during the current financial crisis.” International Small Business Journal 30(7):778–800.
Cowling, M., Taylor, M, Mitchell, P. 2004. "Job Creators." Manchester School, 72(5), September. 601-617.
Czarnitzki, D. 2006. “Research and development in small and medium-sized enterprises: The role of financial constraints and public funding.” Scottish Journal of Political Economy 53(3):335–57.
21
D’Este, P., Iammarino, S., Savona, M. and von Tunzelmann, N. 2012. “What hampers innovation? Revealed barriers versus deterring barriers” Research Policy 41(2), 482-488.
Department for Business, Innovation and Skills (BIS). 2013a. Business population estimates for the UK and regions. HMSO, London.
Department for Business, Innovation and Skills (BIS). 2013b. Small Business Survey 2012: SME Employers. HMSO, London.
Department for Business, Innovation and Skills (BIS). 2013c. Small Business Survey 2012: Credit risk analysis special report. HMSO, London.
Filippetti, A. and Archibugi, D. 2011. “Innovation in times of crisis: National systems of Innovation, structure and demand." Research Policy. 40: 179 – 192.
Fraser, S. 2009a. “Small firms in the credit crisis: Evidence from the UK Survey of SME finance.” Warwick Business School Working Paper.
Fraser, S. 2009b. “Is there Ethnic Discrimination in the UK Market for Small Business Credit?” International Small Business Journal, 27(5):583–607.
Freel, M. S. 2007. “Are Small Innovators Credit Rationed?” Small Business Economics 28(1):23–35.
Hall, B. H. 2002. “The Financing of Research and Development.” Oxford Review of Economic Policy 18(1):35–51.
Hall, B. H., Helmers, C., Rogers, M. and Sena, V. 2013. “The importance (or not) of patents to UK firms.” Oxford Economic Papers 65(3): 603-629.
Han, L., Fraser, S. and Storey, D. 2009. “Are good or bad borrowers discouraged from applying for loans? Evidence from the US small business credit markers.” Journal of Banking and Finance, 33(2): 415-424.
Hutton, W. and N. Lee. 2012. “The City and the cities: ownership, finance and the geography of recovery.” Cambridge Journal of Regions, Economy and Society 5(3):325–37.
Hutton, W. and P. Nightingale. 2011. The discouraged economy. London: Big Innovation Centre.
Kamien MI and Schwartz NL. 1982. Market Structure and Innovation. Cambridge University Press: Cambridge
Kleinknecht, A. and Verspagen, B. 1990. “Demand and innovation: Schmookler re-examined”. Research Policy 19(4):387-394.
Kon, Y. and Storey, D. 2003. “A theory of discouraged borrowers”. Small Business Economics 21, 37-49.
22
Lee, N. and Drever, E. 2014. “Do SMEs in deprived areas find it harder to access finance” Entrepreneurship and Regional Development, 26 (3-4): 337-356
Mason, C. 2013. “Access to finance” A ‘thought piece’ for the North East LEP Independent Economic Review.” Available from: http://www.nelep.co.uk/media/2705/Colin-Mason-Access-to-Finance.pdf [Accessed 19th May 2014]
Mason, C., and R. Brown. 2013. “Creating good public policy to support high-growth firms.” Small Business Economics 40(2):211–25.
Mazzucato, M. 2013. “Financing innovation: creative destruction vs. destructive creation.” Industrial and Corporate Change, 22(4), 851-867.
Mina, A., H. Lahr, and A. Hughes. 2013. “The Demand and Supply of External Finance for Innovative Firms.” Industrial and Corporate Change, 22 (4), 869-901.
Nightingale, P. and Coad, A. 2014. “Muppets and Gazelles: Political and Methodological Biases in Entrepreneurship Research” Industrial and Corporate Change, 23 (1), 113-143.
North, D., R. Baldock, and F. Ullah. 2013. “Funding the growth of UK technology-based small firms since the financial crash: are there breakages in the finance escalator?” Venture Capital 15(3):237–60.
O’Sullivan, M. 2005. “Finance and Innovation” in Fagerberg, J., Mowery, D. and Nelson, R. (eds). The Oxford Handbook of Innovation, Oxford: Oxford University Press, 240 – 265.
Paunov, C (2012) "The global crisis and firms’ investments in innovation." Research Policy 41(1):24-35.
Petersen, M and Rajan, P (1994) "The benefits of lending relationships: evidence from small business data." The Journal of Finance, 44 (1). 3-37
Revest, V., and A. Sapio. 2010. “Financing technology-based small firms in Europe: what do we know?” Small Business Economics 39(1):179–205.
Schneider, C., and R. Veugelers. 2010. “On young highly innovative companies: why they matter and how (not) to policy support them.” Industrial and Corporate Change 19(4):969–1007.
Schumpeter, J A. 1939. Business cycles: a theoretical, historical, and statistical analysis of the capitalist process, McGraw-Hill.
Stiglitz, J, Weiss, A. 1981. "Credit rationing in markets with imperfect information." American Economic Review, 71: 393-410.
Storey, D. 1994. Understanding the small business sector. London, Routledge.

23
Teece DJ. 1986. "Profiting from technological innovation: implications for integration, strategic partnering, licensing, and public policy." Research Policy 16:285–305.
Williams, M., and M. Cowling. 2009. Annual Small Business Survey 2007/8. Department for Business, Innovation and Skills London.
Zenger, Todd R. and Sergio G. Lazzarini. 2004. "Compensating for Innovation: Do Small Firms Offer High-powered Incentives that Lure Talent and Motivate Effort." Managerial and Decision Economics. 25: 329–345.
24
Table 1. Descriptive results, Sample sizes
Percentage of
firms
(weighted) Number of firms (unweighted)
All 2007/8 2010 / 12
Innovators 11.3 1,381 963 418
Non-innovators 88.7 9,327 6,388 2,939
Total 100 10,708 7,351 3,341
Source: Small Business Survey, 2007/8, 2010 and 2012. Weights applied.
25
Table 2. Has access to finance worsened for innovative firms?
Applied for
finance (%)
Share of all firms which apply:
(1) Had
trouble
obtaining
finance
from first
source
(2) Did not
get all
finance
needed
from first
source
(3) Did not
get any
finance
from first
source
(4) Did not
get any
finance
from any
source
Innovator (2010/12) 34.8 55.8 39.1 32.2 29.6
Innovator (2007/08) 28.6 36.4 29.1 21.9 13.7
Non-innovator
(2010/12)
25.2 49.2 37.5 30.6 22.5
Non-innovator
(2007/08)
22.9 24.0 16.60 12.7 11.4
All firms (2010/12) 26.0 50.0 37.7 30.8 23.4
All firms (2007/8) 23.6 25.7 18.6 13.4 11.8
Total 24.2 33.0 24.1 19.0 15.1
Source: Small Business Survey, 2007/8, 2010 and 2012. Sample size 10,708. Weights applied.
26
Table 3. Variable list and summary statistics
Variable name
Description Mean Std. Dev.
Min Max
Innovator 1 if firm has introduced an entirely new product of process in previous 12 months; 0 if not.
0.129 0.335 0 1
Post-recession
Firm is sampled in 2010 or 2012 (0 if 2007/8) 0.314 0.464 0 1
Micro (1-9) Firm has between 1 and 9 employees 0.419 0.494 0 1 Small (10 – 49)
Firm has between 10 and 49 employees 0.395 0.488 0 1
Large (50+) Firm has between 50 and 249 employees 0.186 0.389 0 1 Female led Firm is majority led by women 0.123 0.329 0 1 Ethnic led Firm is majority led by a person from a
minority ethnic group 0.053 0.225 0 1
Qualified Owner or manager has a formal qualification 0.770 0.421 0 1 No. of directors
Number of partners / directors in day to day control of the business
2.6 2.4 1 50
Aims to grow
Aims to grow the business 0.744 0.436 0 1
Turnover increasing
Turnover is increasing 0.452 0.498 0 1
Turnover decreasing
Turnover is decreasing 0.211 0.408 0 1
Age > 10 Firms is aged more than 10 years 0.420 0.494 0 1 Age 5 – 10 Firm is aged 5 – 9 years 0.395 0.488 0 1 Age <5 Firm is younger than 5 years 0.186 0.389 0 1 10,724 observations. Summary statistics are unweighted.
27
Table 4. Probit regression results: Problems accessing finance (1) (2) (3) (4) (5) (6) (7) (8) (9) (10)
Applied for finance
Had trouble accessing finance from first source
Didn’t get all finance needed from first source
Didn’t get any finance from first source
Didn’t get any finance from any source
Innovator 0.125** 0.266*** 0.289*** 0.258*** 0.183* (0.0605) (0.0785) (0.0870) (0.0947) (0.0995)
2010/12 0.0315 0.357*** 0.354*** 0.374*** 0.254***
(0.0448) (0.0568) (0.0624) (0.0675) (0.0694)
Non-innovator (2010/12) -0.00171 0.366*** 0.380*** 0.396*** 0.237***
(0.0511) (0.0608) (0.0671) (0.0726) (0.0750)
Innovator (2007/8)
0.112 0.287*** 0.349*** 0.311*** 0.139
(0.0710) (0.0948) (0.105) (0.115) (0.126)
Innovator (2010/12) 0.154 0.589*** 0.543*** 0.552*** 0.501***
(0.110) (0.134) (0.148) (0.158) (0.160)
Micro (1-9) 0.272*** 0.280*** 0.0818 0.0822 0.0797 0.0808 0.0238 0.0250 0.0842 0.0836
(0.0375) (0.0366) (0.0505) (0.0505) (0.0556) (0.0556) (0.0609) (0.0609) (0.0639) (0.0640)
Small (10 – 49) 0.438*** 0.447*** -0.0766 -0.0757 -0.0322 -0.0287 -0.0648 -0.0617 -0.102 -0.104
(0.0508) (0.0502) (0.0730) (0.0731) (0.0798) (0.0799) (0.0881) (0.0881) (0.0989) (0.0992)
Female led -0.0299 -0.0375 0.0668 0.0663 0.144* 0.142 0.103 0.102 -0.00236 -0.00107
(0.0631) (0.0619) (0.0817) (0.0817) (0.0870) (0.0869) (0.0924) (0.0923) (0.101) (0.101)
Ethnic led -0.0244 -0.0240 0.117 0.117 0.162 0.160 0.110 0.107 0.0714 0.0725
(0.0810) (0.0810) (0.0973) (0.0972) (0.102) (0.102) (0.111) (0.111) (0.115) (0.115)
Qualified 0.110** 0.113** 0.198*** 0.199*** 0.211*** 0.213*** 0.224** 0.225** 0.100 0.0993
(0.0480) (0.0479) (0.0698) (0.0698) (0.0796) (0.0795) (0.0881) (0.0881) (0.0937) (0.0937)
Number of directors 0.0347*** 0.0366*** 0.0361*** 0.0360*** 0.0218* 0.0212 0.0110 0.0104 0.0417** 0.0421**
(0.0115) (0.0112) (0.0139) (0.0139) (0.0130) (0.0130) (0.0155) (0.0155) (0.0172) (0.0172)
Aims to grow 0.312*** 0.316*** 0.252*** 0.252*** 0.222*** 0.223*** 0.237*** 0.237*** 0.272*** 0.272***
(0.0477) (0.0475) (0.0667) (0.0667) (0.0730) (0.0730) (0.0794) (0.0795) (0.0847) (0.0847)
Turnover increasing 0.0838* 0.0862* -0.0239 -0.0241 0.00876 -0.102 -0.0458 -0.0461 -0.149* -0.148*
(0.0468) (0.0467) (0.0656) (0.0656) (0.219) (0.0728) (0.0807) (0.0809) (0.0845) (0.0845)
Turnover decreasing 0.142*** 0.143*** 0.283*** 0.283*** 0.304*** 0.305*** 0.377*** 0.376*** 0.272*** 0.273***
(0.0544) (0.0541) (0.0702) (0.0702) (0.0762) (0.0761) (0.0825) (0.0824) (0.0874) (0.0873)
Age 11 + -1.094*** -0.653*** -1.866*** -1.765*** -2.007*** -2.017*** -2.364*** -2.372*** -2.187*** -2.182***
(0.108) (0.141) (0.150) (0.188) (0.222) (0.222) (0.266) (0.265) (0.244) (0.244)
Age 5 – 10 -0.194*** 0.0187 -0.266*** -0.293*** -0.0488 -0.0497 0.0756 0.0750 0.0212 0.0223

28
(0.0507) (0.0780) (0.0670) (0.0926) (0.108) (0.108) (0.120) (0.120) (0.128) (0.128)
Obs 10,560 10,560 10,476 10,476 10,476 10,476 10,476 10,476 10,497 10,497 Pseudo R2 0.0397 0.0397 0.0638 0.0638 0.0718 0.0723 0.0745 0.0749 0.0612 0.0614
Probit model estimated with standard errors 13 sector dummies included. Age = Less than 5 years and ACT = Agriculture, hunting and forestry. For innovator / year variables, reference category = non-innovator,
2007/8. Weights applied. Regressions 1 and 2 also include variables for legal status.
29
Table 5. Probit regression results, with Heckman selection: Access to finance (1) (2) (3) (4) (5) (6) (7) (8) Had trouble accessing
finance from first
Didn’t get all finance needed from first source
Didn’t get any finance from first source
Didn’t get any finance from any source
Innovator 0.305*** 0.317*** 0.276** 0.174* (0.101) (0.107) (0.116) (0.0980) 2010/12 0.579*** 0.502*** 0.523*** 0.275*** (0.137) (0.108) (0.113) (0.0698)
Non-innovator
0.588*** 0.525*** 0.550*** 0.253***
(0.146) (0.128) (0.130) (0.0759) Innovator (2007/8) 0.321*** 0.381*** 0.340** 0.122
(0.123) (0.128) (0.139) (0.127) Innovator (2010/12) 0.857*** 0.699*** 0.697*** 0.525***
(0.202) (0.200) (0.206) (0.160) Micro (1-9) -0.0576 -0.0588 -0.0204 -0.0110 -0.0976 -0.0930 0.0820 0.0808 (0.136) (0.139) (0.106) (0.115) (0.134) (0.142) (0.0635) (0.0637) Small (10 – 49) -0.321 -0.323 -0.191 -0.170 -0.243 -0.232 -0.104 -0.108 (0.237) (0.243) (0.169) (0.185) (0.208) (0.221) (0.0975) (0.0980) Female led 0.133 0.133 0.215* 0.210 0.157 0.156 -0.0171 -0.0177 (0.120) (0.120) (0.127) (0.129) (0.129) (0.130) (0.104) (0.105) Ethnic led 0.197 0.197 0.240* 0.233* 0.170 0.165 0.108 0.108 (0.135) (0.135) (0.139) (0.138) (0.151) (0.150) (0.116) (0.117) Qualified 0.205** 0.204** 0.207** 0.204** 0.224** 0.222** 0.0788 0.0809 (0.0911) (0.0913) (0.0987) (0.0972) (0.112) (0.112) (0.0957) (0.0961) Number of directors 0.0398** 0.0396** 0.0205 0.0209 0.00129 0.00109 0.0494*** 0.0497*** (0.0190) (0.0192) (0.0179) (0.0180) (0.0227) (0.0231) (0.0182) (0.0181) Aims to grow 0.183 0.182 0.160 0.168* 0.163 0.167 0.277*** 0.275*** (0.120) (0.123) (0.101) (0.102) (0.122) (0.125) (0.0862) (0.0864) Turnover increasing -0.0890 -0.0898 -0.171* -0.165 -0.0954 -0.0938 -0.150* -0.148* (0.0995) (0.101) (0.101) (0.105) (0.113) (0.116) (0.0854) (0.0854) Turnover decreasing 0.347*** 0.346*** 0.351*** 0.344*** 0.459*** 0.454*** 0.268*** 0.271*** (0.0954) (0.0955) (0.0976) (0.0972) (0.106) (0.106) (0.0874) (0.0873) Age 10 + -0.299** -0.299** -0.329*** -0.328*** -0.206 -0.208 -0.223* -0.222* (0.125) (0.125) (0.126) (0.125) (0.143) (0.142) (0.117) (0.117) Age 5 – 10 -0.0513 -0.0517 -0.0805 -0.0772 0.0956 0.0956 0.0226 0.0217 (0.137) (0.137) (0.138) (0.137) (0.154) (0.153) (0.131) (0.131) Constant -1.666*** -1.665*** -1.956*** -1.992*** -2.337*** -2.361*** -2.234*** -2.225*** (0.438) (0.450) (0.343) (0.342) (0.430) (0.435) (0.249) (0.249) Log-likelihood -2169.884
-2177.719 -2116.568 -2116.116 -2069.881 -2069.558 -2044.676 -2044.5
Obs: First stage 10,454 10,454 10,454 10,454 10,454 10,454 10,490 10,490 Obs: second stage 3146 3146 3146 3146 3146 3146 3182 3182 Probit Heckman selection model estimated with robust standard errors. All regressions include 13 sector dummies. Selection
variables: Legal structure and region. Reference categories for age = Less than 5 years, for size = Medium (50 – 249 employees).
For innovator / year variables, reference category = non-innovator, 2007/8. Weights applied.
30
Table 5. Credit scores – innovative and non-innovative SMEs
Share of firms in each category:
Credit Risk Non-innovator Innovator All
1 - Minimal 20.3 21.6 20.4
2 – Low 32.3 27.3 31.9
3 – Average 35.5 41.1 35.9
4 – Above average 11.9 10.0 11.8
Total 100 100 100
Source: Small Business Survey 2012. Sample size: 2,276. Weights applied.

31