Embed Size (px)
Citation preview

Univ
ers
ity L
ibra
ry F
reib
urg
, G
erm
an
y
Arc
hite
cts
: D
eg
elo
Arc
hite
cts
, B
ase
l, S
witze
rla
nd
| I
ma
ge
: A
nd
rea
Se
cci | R
ea
lize
d w
ith
GR
AP
HIS
OF
T
Company Presentation
January 2020 | Dr. Axel Kaufmann, Spokesman & CFOO
Nemetschek Group

Nemetschek’s Key Figures: 5 Years - 5 Achievements
Company Presentation
JANUARY 2020
| We generate high
shareholder returns1
$
5-year TSR1:| Nemetschek: ~700%
| Peer group2: ~95%
| TecDAX : ~110%
| We outperform our peers
in terms of growth2
5-year revenue CAGR:| Total growth: 20.0%
| Organic growth: 13.4%
| Peer group2: <10%
| Strong EPS
development
5-year EPS CAGR:| 26%
| We have become
a truly global player
5-year US revenue CAGR:| 49% in the world’s largest and
most competitive AEC market
| Sustainable dividend policy
with continuous growth
5-year CAGR:| 20%
1 TSR: Total shareholder return: Share price performance + dividend | 2013–2018 | 2 Peer group: International software companies
2

59%32%
3% 6%
80%
8%
3%9%
CAGR
+20%
5 years12013 2018
5-Years Development: Positioned to Provide Strong Growth
Company Presentation
JANUARY 2020
28%
31%
32%
9%
40%
40%
11%
9%
CAGR
+20%
5 years12013 2018
Design
Build
Manage
Media & Entertainment
Recurring revenues Maintenance and rental models such as subscription, SaaS
Software licenses
Consulting & Hardware
Germany
Europe (w/o Germany)
Americas
Asia/Pacific
Global mixAEC business mix Revenue mix
49%47%
4%
2018
1 2013–2018
3

Innovative
Customer
focused
Internationally
successful
Why We are Successful – A Unique Approach Similar to German Mittelstand
Company Presentation
Highly specialized small or midsized companiesGoing to market with
16 strong, entrepreneurial brands (5–100m €)
Long-term focus Every brand is a world leader in its discipline
Holding 5× as many patents per
employee as major corporations
Our brands are pioneers
in Building Information Modeling
37% of all employees have regular customer
contact (only 7% in major corporations)
All brands are developing their solutions
in close cooperation with the customers
Almost 50% of all small world
market leaders are German
No 1 AEC software provider in Europe,
one of the largest worldwide
JANUARY 20204

NEMETSCHEK GROUP Provides Expertise Along the Complete AEC Value Chain
Program
Management,
Planning
Structural
Design & Analysis
Detailing,
Engineering
Consultants,
Fabrication
Quality Control,
Clash Detection,
Collaboration,
Documentation
Property
Management
IWMS/
Smart Buildings
Operate & ManageBuild & ConstructPlanning & Design
Modeling &
Design
Development
Estimation &
Scheduling
NEMETSCHEK GROUP COMPANY PRESENTATION 5
Media: AEC Renderings, Animation & Visual Effects for Gaming, Movies
JANUARY 2020
Company Presentation
5

01 Financial Results Q3 2019
Port
House,
Antw
erp
, B
elg
ium
Engin
eering o
ffic
e:
Stu
die
buro
Mouto
n,
Ghent, B
elg
ium
| I
mage:
Andre
a S
ecci |
Realiz
ed w
ith S
CIA

Key Business Highlights 9M 2019: Excellent Basis for Achieving Upper End of Targets in FY 2019
Company Presentation
JANUARY 2020
Strong Performance YTD 2019 M&A / Sale Successes
+22.7% to € 406.0m
Revenues:
IFRS 16 adjusted: 26.7%
EPS:
+81.3% to 0.83 EUR
Recurring revenues:
+33.9%
Subscription/SaaS revenues:
+129.6%
Revenues abroad:
+27.9%
EBITDA margin:
29.4%
High cash conversion
95.5%
01/2019
Axxerion by MCS, renamed afterwards in Spacewell
Brand-level acquisitions:
Manage Division
04/2019
Redshift by Maxon
Media & Entertainment Division
$
7
08/2019
Value-generating sale of DocuWare with a
strong positive one-time effect on EPS in Q3
Sale of minority interest:

88,2
119,4
9M 2018 9M 2019
330,9
406,0
9M 2018 9M 2019
162,4
217,5
9M 2018 9M 2019
0,46
0,83
9M 2018 9M 2019
Top Key Figures 9M 2019: On the Way to Another Record Year
Company Presentation
JANUARY 2020
Revenues
m€
EBITDAm€
Recurring revenuesm€
EPS€
| Organic growth of +17.2%
(+14.1% cc1)
| High EBITDA margin: 29.4%
(previous year: 26.7%)
| Adjusted IFRS 16 margin: 26.7%
| Adjusted EPS w/o DocuWare sale:
0.57 (+24.5%)
| Tax rate: 18.5%
| Adjusted tax rate w/o DocuWare
effect: 24.8% below previous year
level (26.0%)
+81.3%
+22.7%
+19.6% cc1
+33.9%
+30.8% cc1 +35.4%
+30.7% cc1
| Strong organic growth in 9M: +26.8%
(+23.7% cc1)
| Growth driver subscription in 9M:
+129.6%
1 Constant currency
8
2 for better comparability, EPS has been presented after the stock split
2

Strong Growth in Recurring Revenues: Subscription is Key Driver
Company Presentation
JANUARY 2020
Recurring revenues Software services and rental models
such as subscription/SaaS
Software licenses
Consulting & Hardware
Revenue distribution 9M 2019
53,6%41,2%
5,2%
(49,1%)2
(3,8%)2
(47,1%)2
Software licenses yoy
Recurring revenues yoy
+33.9%
+30.8% cc1
Subscription yoy
+129.6%
+124.5% cc1
+7.4%
+4.2% cc1
9M 2019
1 Constant currency | 2 Previous year
9
Software licenses yoy
Recurring revenues yoy
+31.5%
+29.0% cc1
Subscription yoy
+119.0%
+115.1% cc1
+5.1%
+2.7% cc1
Q3 2019

Segment Overview: Build Segment Remains in Strong Growth Mode
Company Presentation
JANUARY 2020
100,7
128,8
9M 2018 9M 2019
203,6226,5
9M 2018 9M 2019
24.9%
7,7
27,2
9M 2018 9M 2019
18,9
23,5
9M 2018 9M 2019
29.0% 27.6% 32.7% 22.0% 18.1%* 41.9% 35.1%
EBITDA Margin
Design BuildMedia &
EntertainmentManage
Revenues in m€
+11.3%
+ 9.4% cc1
| Adjusted EBITDA margin (IFRS 16): 29.5%| Adjusted EBITDA margin (IFRS 16): 26.4%
| Reclassification of Solibri from Build to Design| *Adjusted EBITDA margin w/o € 1.5m
acquisition related cost
| Reported EBITDA margin: 12.6%
| Organic growth: +14.1%
| Very strong performance while moving to
subscription
| Effects on EBITDA: Acquisition related costs
of Redshift and cost for subscription move
+27.9%
+22.2% cc1
+24.3%
+20.9% cc1+251.4%
+250.9% cc1
1 Constant currency
10

02 AEC Market Opportunities
BIM Market Potential
Independent
Bank H
eadquart
ers
, M
cK
inney,
US
A
Genera
l contr
acto
r: R
ogers
-O’B
rien C
onstu
ction,
Dalla
s,
US
A | I
mage:
Justin H
earn
| R
ealiz
ed w
ith B
luebeam

Challenges in Construction Industry
Company Presentation
JANUARY 2020
However at least 20% is waste
The worldwide construction market
is estimated at
€10 trillion(€3.5 trillion exc. residential)
of jobsite work
is unproductive
of projects are
over budget
of projects
are late
~40%~40% ~90%
Mostly due to Ineffective Communication, Planning and Collaboration
materials
are wasted
~10%of construction
is rework
~30%
Source: Engineering-News Record 2017
12

Construction Projects: Running out of Time and Cost
Company Presentation
JANUARY 2020
Type of Project Average Cost Overrun1
Bridges 11%
Roads 27%
Railways 30%
Buildings 39%
Airports 56%
Waterways 68%
Tunnels 149%
Construction
1 Source: Herite School of governance (2015), 170 infrastructure projects analyzed | 2 Flyvbjerg et al. (2013): Underestimating Costs in Public Works Projects: Error or Lie?
Cost and time overruns occur in ~90% of the projects
13
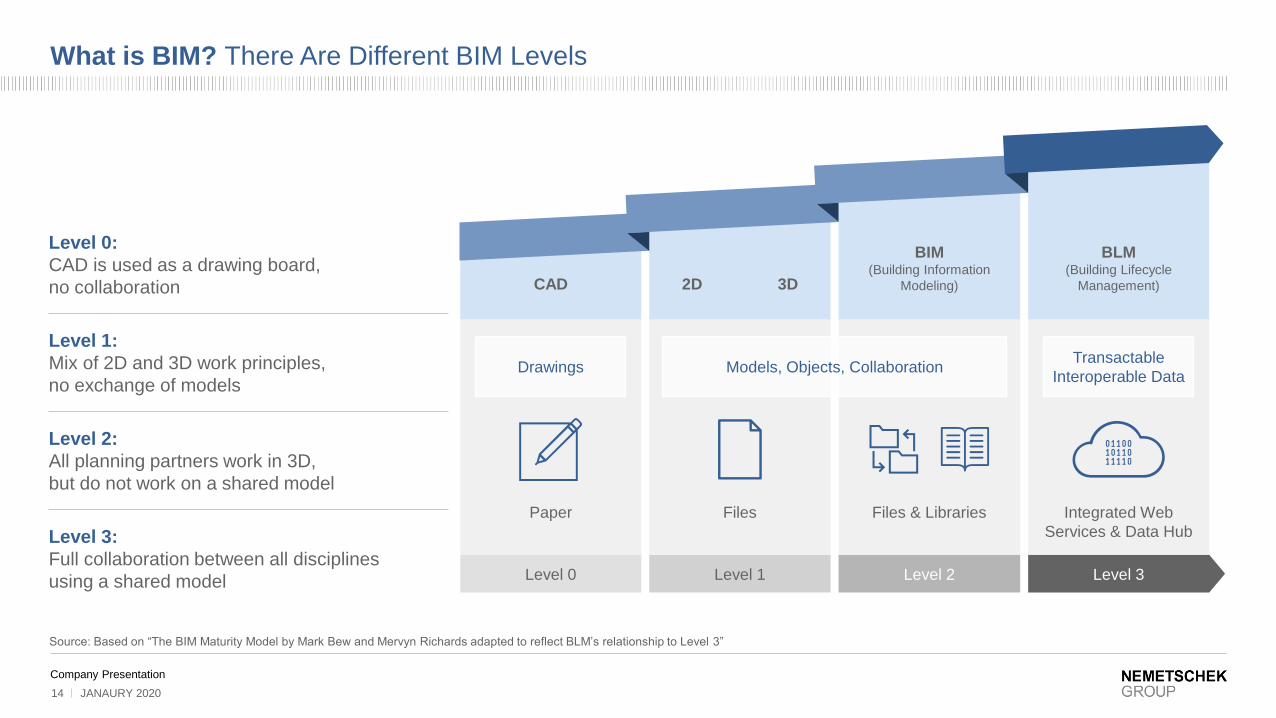
What is BIM? There Are Different BIM Levels
Company Presentation
CAD 2D 3D
BIM(Building Information
Modeling)
BLM(Building Lifecycle
Management)
Drawings Models, Objects, CollaborationTransactable
Interoperable Data
Paper Integrated Web
Services & Data Hub
Files Files & Libraries
Level 0 Level 3Level 1 Level 2
Level 0:
CAD is used as a drawing board,
no collaboration
Level 1:
Mix of 2D and 3D work principles,
no exchange of models
Level 2:
All planning partners work in 3D,
but do not work on a shared model
Level 3:
Full collaboration between all disciplines
using a shared model
JANAURY 2020
Source: Based on “The BIM Maturity Model by Mark Bew and Mervyn Richards adapted to reflect BLM’s relationship to Level 3”
14

Huge Market Potential: The AEC BIM Software Market Will Grow to €10 billion in 2022
Company Presentation
Source: Cambashi BIM Design Observatory and internal research
JANUARY 2020
321Top 3 Countries
per Region
APAC
EUE (2019)
Australia
€ 149m
China
€ 397m
Japan
€ 698m
Americas
EUE (2019)
Brazil
€ 61m
US/Canada
€ 2,141m
EMEA
EUE (2019)
France
€ 307m
UK/I
€ 448m
DACH
€ 1,075m
Europe€ 1,830
Europe€ 3,900
Americas€ 1,640
Americas€ 3,530
APAC€ 1,200
APAC€ 2,000
ROW
€ 4,800
€ 9,900
2015 2022
CAGR:
+11%
15
End-user expenditure (EUE) in m€EUE 2019: ~€ 7bn

Montfort
hau
s,
Feld
kirch,
Austr
ia
HA
SC
HE
R J
EH
LE
Arc
hitektu
r, G
erm
any
| Im
ages:
David
Matthie
ssen |
realiz
ed w
ith
NE
VA
RIS
03 Financial Outlook
Falc
on H
ospital, G
uangzhou,
Chin
a
Vis
ualiz
ation:
Sla
shcube,
Sw
itzerland |
Realiz
ed w
ith M
AX
ON

Outlook 2019: Reaching the Guidance on the Upper End
Company Presentation
JANUARY 2020
Revenues € 461.3m
Target range:
540 – 550 m€
Growth:
17% – 19%
2018
2019
EBITDA margin* 25% – 27%*
27% – 29% incl. IFRS 16
Result
Outlook
9-month results are an extremely solid basis to reach the upper end of the guidance 2019
| Revenues range: € 540 – 550m, strong double-digit growth of 17% – 19%
| EBITDA margin: in between 25% – 27%*, 27% – 29% incl. IFRS 16
26.3%*
17
* Without effects from IFRS 16

Contact
NEMETSCHEK SE
Investor Relations
Konrad-Zuse-Platz 1
81829 Munich
Germany
www.nemetschek.com
Company Presentation
JANUARY 2020
Port
House,
Antw
erp
, B
elg
ium
Engin
eering o
ffic
e:
Stu
die
buro
Mouto
n,
Ghent, B
elg
ium
| I
mage:
Andre
a S
ecci |
Realiz
ed w
ith S
CIA
18

Safe Harbor StatementEach of the presentations today will contain forward-looking statements about our strategies, products, future
results, performance or achievements, financial, operational and otherwise, including statements about our
strategic priorities, guidance and our mid-term goal, our M&A strategy, and our capital allocation initiatives. These
statements reflect management’s current expectations, estimates and assumptions based on the information
currently available to us. These forward-looking statements are not guarantees of future performance and involve
significant risks, uncertainties and other factors that may cause our actual results, performance or
achievements to be materially different from results, performance or achievements expressed or implied by the
forward-looking statements contained in these presentations.
Nemetschek undertakes no obligation to publicly update or revise any forward looking statements. All forward
looking statements are subject to various risks and uncertainties that could cause actual results to differ materially
from expectations. Readers are cautioned not to place undue reliance on these forward looking statements, which
speak only as of their dates.
Ingenuity
Cente
r, N
ottin
gham
, G
reat
Brita
in
Arc
hitects
: B
ond B
ryan A
rchitects
, G
reat
Brita
in | R
ealiz
ed w
ith G
RA
PH
ISO
FT
JANUARY 2020
Company Presentation
19