Embed Size (px)
Citation preview

Journal of Location Based ServicesVol. 3, No. 2, June 2009, 118–145
NeoGeography and Web 2.0: concepts, tools and applications
Andrew Hudson-Smith*, Andrew Crooks, Maurizio Gibin,Richard Milton and Michael Batty
Centre for Advanced Spatial Analysis, University College London, London, UK
(Received 30 May 2008; final version received 4 February 2009; accepted 6 April 2009)
In this article, we explore the concepts and applications of Web 2.0 throughthe new media of NeoGeography and its impact on how we collect, interactand search for spatial information. We argue that location and space arebecoming increasingly important in the information technology revolution.To this end, we present a series of software tools which we have designed tofacilitate the non-expert user to develop online visualisations which areessentially map-based. These are based on Google Map Creator, which canproduce any number of thematic maps which can be overlaid on GoogleMaps. We then introduce MapTube, a technology to generate an archive ofshared maps, before introducing Google Earth Creator, Image Cutter andPhotoOverlay Creator. All these tools allow users to display and shareinformation over the web. Finally, we present how Second Life has thepotential to combine all aspects of Web 2.0, visualisation and NeoGeo-graphy in a single multi-user three-dimensional collaborative environment.
Keywords: GIS; NeoGeography; Web 2.0; Second Life; Google
1. Introduction
The world of geographic information and analysis is undergoing a transformation.Mapping services, hacks and task-specific software have emerged that are changingthe way we share, communicate and distribute data. These changes are to such deepextent that we stand on the edge of a new geography based on a digitally connectedworld at whose core lies citizen-created data organised at an increasingly finegeographic scale.
Central to these changes and the explosion in available data organised by itsgeography is the concept of Web 2.0, a term adapted by O’Reilly Media in 2004 tosummarise the rise of services from web-based communities focusing on technologiesof social networking, social booking marking, blogging, Wikis and RSS/XML feeds(Graham 2007). In the past five years, we have witnessed the emergence of usercreated web content in the spirit of Web 2.0, as evidenced by the growing popularityof sites such as MySpace, Facebook, Flickr, YouTube, etc. This growth relies on ourability to communicate and share data and information through simple, freelyavailable tools. These can be learnt quickly and effectively without immersion inprofessional activities (Hudson-Smith et al. 2007) with some describing this as thecult of the amateur (Keen 2007). As such, these tools and the way they can be used
*Corresponding author. Email: [email protected]
ISSN 1748–9725 print/ISSN 1748–9733 online
� 2009 Taylor & Francis
DOI: 10.1080/17489720902950366
http://www.informaworld.com
Downloaded By: [Hudson-Smith, Andrew] At: 10:18 12 August 2009
are redefining the very disciplines that traditionally have made sense of suchphenomena –sociology and geography – in the same way that economics is beingredefined in Web 2.0 as Wikinomics (Tapscott and Williams 2006).
At the heart of this growth is the desire to tag data to specific locations. Wewould argue that location and space now represent a third force in informationtechnology besides computers and communications. Tagging not only the type ofdata but also where such data is produced, who uses it and at what time, is becomingone of the core applications of web-based services.
This re-emergence of the importance of geography within Web 2.0 technologies isbecoming known as ‘NeoGeography’. Whereby people use Web 2.0 techniques tocreate and overlay their own locational and related data on and into systems thatmirror the real world. The term is derived from Eisnor (2006) one of the founders ofwww.platial.com where she defines it (NeoGeography) as: ‘. . . a diverse set ofpractices that operate outside, or alongside, or in the manner of, the practices ofprofessional geographers. Rather than making claims on scientific standards,methodologies of NeoGeography tend towards the intuitive, expressive, personal,absurd and/or artistic, but may just be idiosyncratic applications of ‘real’ geographictechniques. This is not to say that these practices are of no use to the cartographic/geographic sciences, but that they just usually do not conform to the protocols ofprofessional practice’.
One of the characteristics of NeoGeography and Web 2.0 is the term mashup,originally used to describe the mixing together of musical tracts on DJ DangerMouse’s The Grey Album; the term now refers to websites that weave data fromdifferent sources into a new integrated single user service (Hoff 2005). This has beenmade possible through companies granting access to their platforms throughapplication programming interfaces (APIs) with the use of such mashups becomingincreasingly popular for plotting data on maps. For example, the release of theGoogle Maps API enables users to mix Google stream-based data with otherspatially referenced material. These data can then be served as bespoke applicationsthrough the Google Map interface. A number of different terms have been used todescribe these applications, including ‘map mashups’ (Purvis et al. 2006), ‘maphacks’ (Erle et al. 2005) and ‘Mapplets’ (Google 2008). The mixing of various datasources through common and open standards is central to Google Maps’ positionwithin the concept of Web 2.0. NeoGeography could therefore be argued as beingabout people using and creating their own maps, on their own terms and bycombining elements of an existing toolset (Turner 2006). In time, some believe thatmashups could change science if researchers could be persuaded to share their data(Butler 2006a) despite the reluctance of many research labs and agencies to considerdoing science in this fashion.
In many ways, NeoGeography and mashups go hand in hand (Hudson-Smithet al. 2007). One of the most important innovations in the development ofNeoGeography and the mashups that accompany it is the concept of the DigitalEarth. A term popularised by former US Vice President Al Gore for describing avirtual representation of the Earth on the Internet, that is spatially referenced andinterconnected with digital knowledge archives from around the world. GoogleEarth and to an increasing extent Microsoft’s Virtual Earth and NASA’s WorldWind (collectively known as geobrowsers) have produced 3D worlds at a speed andresolution that was unimaginable only a few years ago.
Journal of Location Based Services 119
Downloaded By: [Hudson-Smith, Andrew] At: 10:18 12 August 2009

Until Google Earth and other geobrowsers, geographical information systems(GIS) remained largely the preserve of specialists. Google Earth has increasedawareness of GIS potential and encourages researchers to explore more powerfultechniques (Butler 2006b). ‘Just as the PC democratised computing, so systems likeGoogle Earth will democratise GIS.’ (Goodchild quoted in Butler 2006b). TheGoogle Earth phenomena has opened up some of the more straight forwardcapabilities of GIS to the general public, making it easy to deploy GI acrosscomputer platforms through a standard, easy to navigate graphic user interface.They provide a base layer on which to overlay data whereby users can pan (bydragging the mouse) and zoom (by using the mouse wheel) onto mapping dataalmost anywhere in the world. It has opened GI to the masses and is leading the wayto NeoGeography, Crowdsourcing (Howe 2006), Volunteered GeographicInformation (VGI) (Goodchild 2007) and Collective Intelligence. Creating andvisualising data is now a central part of the web experience. Indeed, geography isimportant again and the rapid diffusion of geobrowsers are simply in the vanguardof a whole series of software systems providing a geographically enabled Web 2.0service that promise to bring geo-location to the fore and of course to everyone(Hudson-Smith 2008).
There has been an explosion in the amount of GI available and just as Web 2.0relies on user generated content, NeoGeography relies on user generated content thatis locationally tagged (i.e. VGI). Sites such as Wikimapia and OpenStreetMap areempowering citizens often with no formal qualifications to volunteer to create aglobal patchwork of GI, which for a long time has been reserved for official agencies.Other virtual globes are encouraging volunteers to develop interesting applicationswith their own data (Goodchild 2007). With the rise in citizen level mapping hascome the demand for data, issues of copyright, questions over accuracy (includingmetadata), issues over coverage and resolution of data and threats to individualprivacy. While these are issues that have faced the more traditional GIS user for anumber of years, it is new to the world of NeoGeography. Accuracy is withoutquestion changed when data is collated by the non-professional geographer, yetperhaps questions over accuracy are superseded by the shear wealth and diversity ofdata emerging online. Indeed, a number of ‘classic’ NeoGeography websites havefilters built in to ensure quality control, as sites such as OpenStreetMap are able tooffer high-quality data free of charge and are starting to threaten the moreestablished data providers. As the business model of GI is changing, the world ofWikinomics is becoming geo-coded.
As with Web 2.0 in general, the popularity of superimposing GI from sourcesover the web, many of which are created by amateurs, is growing rapidly. As a result,the number of available mashups has reached over the hundreds of thousands andthe number of downloads of Google Earth software exceeds 100 million (Goodchild2007). This change allows cartographers to acquire new tools and methods capableof enhancing static maps and introducing multiple layering, interactivity andmultimedia (Dransch 2000). This increased use of computers has also lead to agrowing interest in geovisualisation (Buckley et al. 2004) in terms of concepts, toolsand applications (Dodge et al. 2008) but with these new tools rarely conforming tothe protocols of existing professional practice (Eisnor 2006).
The remainder of this article presents a series of software tools we have developedin our group (CASA) at University College London as part of the National Centre
120 A. Hudson-Smith et al.
Downloaded By: [Hudson-Smith, Andrew] At: 10:18 12 August 2009

for e-Social Science’s node on Geographic Visualisation of Urban Environments(GeoVUE). These tools compromise a GeoVUE toolset which includesGMapCreator, MapTube, Google EarthCreator, Image Cutter and PhotoOverlayCreator. We relate how the toolset has been used and indeed become part of theNeoGeography movement allowing the non-professional user to effectively shareand visually compare GI. Finally, we present how real-time collaboration in a three-dimensional environment a la Second Life has the potential to combine all aspects ofWeb 2.0, visualisation and NeoGeography.
2. Tools and applications
NeoGeography is about people using their own maps, on their own terms andcombining the maps with elements of an existing toolset. The following sectionbriefly outlines a number of tools that we have developed, the concepts behind themand the application domains of such tools. It should be noted that our tools are inthe mindset of Web 2.0 and NeoGeography, allowing the non-professional user tointegrate their data, creating and exploring GI anywhere, anyplace at anytime.
2.1. Google Map Creator
Placing your own data onto Google Maps used to mean getting your hands dirty viathe Google Maps API and a request to Google for a licence key. This restricted mapmaking to those determined to visualise data or those already at ease with basic codeediting, as for example in our own shortest path Mashup entitled the UniversityCollege London (UCL) Campus Route Finder (UCL, 2008).
Google allowed users’ access to the Google Maps API in order to create theirown map applets, or ‘Mapplets’ in 2005. Chicagocrime.org (now part of theEveryBlock.com) produced one of the first mashups combing Google Maps with theChicago Police Department’s Citizen ICAM web site to show incidents of crimewithin the Chicago region. Crimes were plotted directly upon Google Maps. In 2007,Google launched MyMaps, essentially built on the same product as Google Mapsbut allowing users to create their own maps via a simple point and click interface.One can draw lines and shapes, embed text photos and videos – all using a simpledrag and drop interface. This is possibly one of the most important innovations inmapping since the development of GIS (Hudson-Smith 2008). While not ascustomisable as using the full Google Maps API, MyMaps is, in our view, thepurest example of a NeoGeography and Web 2.0 application currently available,allowing citizens to add, edit and share geographical data en masse.
One of the first high-profile applications of MyMaps in the UK was the BBCRadio Berkshire Flood Map (2007). Created in the wake of the floods which sweptacross the region in July 2007, BBC Radio Berkshire put together a Google Mapwhich showed a multitude of different information about the extent andcharacterisation of local flooding. These included locations of emergency centres,audio clips from news correspondents, and pictures and videos (e.g. taken frommobile phones and posted on YouTube) sent by listeners, thus providing views ofinformation in the flood-hit area as shown in Figure 1. At the time, MyMaps werelimited to single user editing, listeners stories, and locations were emailed to the BBC
Journal of Location Based Services 121
Downloaded By: [Hudson-Smith, Andrew] At: 10:18 12 August 2009

and subsequently entered on the map accordingly. MyMaps is now collaborativeallowing real-time editing ranging from invited individuals and groups up to a globaluser base.
However, Google Maps is not without its problems. Google is not a GI providerfor it is in essence a marketing company, and thus maps are merely a means toprovide geographical context to business data. As such, any data within GoogleMaps in their Keyhole Markup Language (KML) format is accessible, and indeedmust be on a public server as part of the license agreement. Data confidentially istherefore limited with Google Map mashups focused on the interestedNeoGeographer rather than on the professional GIS user. Furthermore, buildingrich cartographic websites with KML files is currently limited to 1MB due todownload limits.
Further to this, a commonality between many mashups is that they only displayspatial point data, as thematic maps cannot be easily created within suchapplications. The problem is that these point objects are often misleadingly usedto summarise an areal distribution (Gibin et al. 2008) and as such, they are instancesof what Martin (2001) describes as spatial object transformations. Viewed from thisperspective, many choropleth maps also entail spatial object transformations, sincespatially referenced data are aggregated into artificially bounded areas.
For mashups, there are relatively few choropleth maps. This most likely arisesbecause Google Maps API neither supplies nor supports tools to incorporate areal
Figure 1. BBC Berkshire’s flood map highlighting photographic and video content.
122 A. Hudson-Smith et al.
Downloaded By: [Hudson-Smith, Andrew] At: 10:18 12 August 2009
aggregated data into the Google Maps interface. For this reason, we have created afree tool called Google Map (GMap)Creator1 which enables the creation ofchoropleth thematic layers which can be quickly and easily integrated into GoogleMaps.
External data displayed by Google Maps may originate from and in a variety ofsources and formats. Typically data relates to the classic GIS data objects of points,polylines and polygon vectors or rasters. However, GIS files common across desktopGIS software such as ESRI shapefiles cannot be directly mapped into Google Mapsmashups. While building polygons is possible in Google Maps using the GoogleMaps API, building polylines and polygons is difficult, slows down the applicationand as we have already noted, is limited to 1MB KML files (see Gibin et al. 2008 formore information). Therefore, Google Maps mashups showing polygon datathematised by a particular attribute is uncommon. In order to help this situation,the freeware application, GMapCreator, enables us to simplify thematic mapping inGoogle Maps.
GMapCreator is the simplest solution possible to create thematic maps as it isrooted in a tile-based approach to allow it to handle large amounts of data.GMapCreator enables a user to take a map which consists of vector data (ashapefile) describing the physical configuration of objects and features that make upthe map together with attributes that relate to these geometric features, and thengenerate a layer that can be displayed or overlaid in a Google Map. GMapCreatorwas developed to publish shapefiles files in a simple ‘point and click’ manner as wehighlight in Figure 2. The software, like others in today’s Google-led world, is freesoftware with high levels of functionality but requiring relatively low levels ofexpertise to make it work.
Unlike the Google Maps API method for displaying points, lines and polygons,which requires arrays of vertices and coordinates to be specified in the HTML,GMapCreator reads data from the shapefile as a series of raster image tiles (256 by256 pixels) whose frequency depends on the zoom level selected. The higher the zoomlevel, the greater the frequency of tiles required to cover any given geographic area.The use of this architecture has the added benefit of avoiding the infringement ofmany intellectual property rights. The raw data is never shared or placed online, onlythe data visualisation. Furthermore, it is practically impossible to recover theoriginal vector data from the image tiles. Even if an image processing algorithm wereused to extract the data from the images, the recovered data would only be a scaledapproximation to the original; and thus the original dataset cannot be recovered.
Using GMapCreator, it is possible to overlay pre-rendered thematic tiles on topof street and satellite views of Google Maps, making it possible to show complexareal coverages. The client’s browser only has to download and display the pre-rendered tiles rather than complex vector data consisting of multiple points, lines andpolygons. For wider dissemination, one can build individual websites to show thedata, and to aid this, the software also renders a basic webpage that contains theGoogle mapping interface. This can be built upon like the LondonProfiler or it canbe used to link the data to MapTube for wider dissemination (as we describe below).
The purpose of such a tool is to publish extensive geospatial data for lightbrowsing and exploring rather than for more formal exploratory spatial dataanalysis (ESDA).2 It is envisaged that the main use of GMapCreator will be by dataproviders and local agencies using maps. GMapCreator reduces the thematic map
Journal of Location Based Services 123
Downloaded By: [Hudson-Smith, Andrew] At: 10:18 12 August 2009

Figure 2. Google Map Creator. (a) Initial screen when GMapCreator is first opened;(b) uploading a shapefile and selection the required level of zoom; (c) selecting the scales forthe thematic data.
124 A. Hudson-Smith et al.
Downloaded By: [Hudson-Smith, Andrew] At: 10:18 12 August 2009

into a dataset of files, thus making it possible for the data to be served using simplefile transfer. This offers the facility to display thematic maps to those who do nothave access to a programmable GIS web server. Since being released it has beendownloaded over 9000 times and is continuously being developed, most recently withits integration into MapTube which we explore later.
Software packages in a Web 2.0 world have a short shelf life. GMapCreator is ofits time and currently meets the needs of local councils, government organisationsand interested individuals to quickly and easily publish thematic maps. Software isarguably moving towards a service in what is increasingly being called ‘The Cloud’where files are saved, processed and manipulated on a remote server and yet madeaccessible on any machine. The premise comes from the fact that services andarchitecture should be on servers. We call it ‘cloud computing’ for it assumes thatthese data and services should be in a ‘cloud’ somewhere. And that if you have theright kind of browser or the right kind of access, it does not matter whether you havea PC or a Mac or a mobile phone or a BlackBerry or any device yet to be developed,you can still get access to the cloud (Schmidt 2006). Indeed this article was writtenusing ‘Buzzword’ from Adobe, a word processor in ‘The Cloud’ which allowsmultiple users to edit and amend a file without that file ever being saved to a localhard drive. Google’s MyMaps is a similar service with data added, edited and heldvia a remote server, a geographical service that is geography neutral in terms ofcomputing power.
We envisage GMapCreator and similar applications morphing into a cloud-basedservice, holding and serving data remotely, ironically rather like traditional GIS-based web services. This points towards the future; in the present using our toolset, itis possible to build feature rich cartographic websites that may easily be used andinterpreted by individuals who have limited experience of spatial data handling. Thisis to which we now turn, location-specific maps using GMapCreator, specifically theLondon Profiler.
2.1.1. Usage: London Profiler
The purpose of the London Profiler website (http://www.londonprofiler.org/) is tocreate a resource on which spatial data from a variety of public sector domain ofpublic sector sources can be displayed against the backcloth of Google Maps, suchdata facilitating online exploratory cartographic visualisation in a range of areas ofpolicy concern (Gibin et al. 2008). To achieve this, the site uses image tiles createdwith GMapCreator.
Currently the London Profiler is a beta test site and contains data sets includingthe Multicultural Atlas of London (Mateos et al. 2007), the E-Society Classification(Longley et al. 2006), the HEFCE POLAR Classification and Associated HE data(Corver 2005), Hospital Episode Statistics,3 the Index Multiple Deprivation (DCLG2007), crime statistics (Metropolitan Police Service 2008) and the National StatisticsOutput Area Classification (Vickers and Rees 2007). Travel information fromTransport for London including a Tube map, public transport accessibility andtravel card zones, are also displayed.
The interface was designed to allow different stakeholders access to a variety ofdifferent information through a common visual interface. Designed to be interactive,the interface to the site shown in Figure 3 is similar to Google Maps with panning
Journal of Location Based Services 125
Downloaded By: [Hudson-Smith, Andrew] At: 10:18 12 August 2009

and zooming facilities (Figure 3A). However, to refine the search capability, userscan search and select from the map by borough or unit postcode (Figure 3B), andenable different views (map, satellite or hybrid maps) to act as a background forwhich thematic maps can be overlaid at different levels of transparency (Figure 3C).Furthermore, to display the different datasets, several tabs arranged by themes, forexample health, E-Society, Crime, Transport, etc., have been added where the usercan select a dataset, see a legend and access a help section which provides details onhow the source data was created. This has links to Spatial Analysis Online, anindependent source for geospatial reference material, also available in de Smith et al.(2007) which is a further example of how Google is promoting GIS with links tomore detailed information as shown in Figure 3D.
Through the use of Google Maps API 2 released in 2006, this site also allowsKML files to be rendered on top of the Google Maps background data. Therefore apublicly available Uniform Resource Locator (URL) can be entered into thedisplay box and third party KML files can be displayed on top of the thematic map,thus allowing user interaction such as displaying third party boundaries and pointdata or the integration of disparate data feeds. One such link has been formalised asa tab, a link to the Nestoria website, a UK site that produces aggregated informationof property prices and related data. For example, Figure 3E shows the 2007 Index ofMultiple Deprivation for a selected part of London, overlaid on top of which areproperties for sale from the Nestoria site. These properties for sale can be queriedand further information about them can be highlighted as we show in Figure 3E.
Figure 3. The London Profiler interface. Note that the features in the figure identified as A toE match details in the text.
126 A. Hudson-Smith et al.
Downloaded By: [Hudson-Smith, Andrew] At: 10:18 12 August 2009

The site has numerous potential policy applications. For example, an educational
practitioner may be interested in widening participation and in finding the
percentage of 18–19 years old cohort that participate in education. The user could
enter a URL to a KML file showing the location of schools and see which schools
have low participation rates, while others interested in crime can explore burglaries
in an area and then see how this relates to deprivation. A member of the general
public can search for a new home and use all this information in their residential
decision making process.The London Profiler is a good example of online exploratory cartographic
visualisation of thematic maps. Through the use of GMapCreator a cheap and
effective platform for visual communication of health and education data is provided
to both internal and external users. London Profiler and indeed any maps created
using GMapCreator are not meant to be classified as GIS maps or indeed as web-
based GIS applications for they do not result from the usual functionality used in
GIS but simply sit between Google MyMaps and more traditional web-based GIS
server systems thus illustrating once again, the essential difference between the
activities of a NeoGeographer compared to a geographic professional.The London Profiler is a site written for the task of portraying information
related to a specific location. To widen out the concept and add in the ability to
create, mix, match and visually compare maps on a global scale a change in concept
is required, and it is this to which we now turn in the form of MapTube.
2.2. MapTube: ‘a place to put maps’
MapTube (www.maptube.org) combines the generic idea of YouTube where users
can share information with the ability of GMapCreator to create thematic maps.
MapTube provides a ‘place to put maps’ as we highlight on its homepage in Figure 4
which shows the most viewed maps currently on the MapTube site. MapTube acts as
a portal for geographic data, data which is not stored on the site. Every map hosted
on MapTube is held on an outside server, and pulled in using the XML file which is
automatically created when it is first generated using GMapCreator. This allows
data creators to maintain ownership of the data, an important nod back to
professional GIS providers in light of today’s Web 2.0 environment where there are
increasingly hazy views about what constitutes copyright and legitimate data use.As with other Web 2.0 applications, the content within MapTube relies on users
submitting content. Users can submit their own maps to MapTube via a simple user
interface which we demonstrate in Figure 5 where users are asked for several pieces
of information: the URL of where the map is located (i.e. the XML file), the title of
the map, keywords which describe the map, for example, 2001 population density
London which is used when others are searching for maps, a brief description of the
map along with information (metadata) about the data portrayed on the map, for
example, how was the data collected and when was it collected, etc. This does raise
issues about the quality of the data and as with traditional GIS metadata, it is
difficult to persuade those responsible for creating geographic data to produce
adequate documentation.MapTube allows one to view and compare different datasets as a series of layers
(i.e. a mashup) through the Google Map interface, as we highlight in Figure 6, which
Journal of Location Based Services 127
Downloaded By: [Hudson-Smith, Andrew] At: 10:18 12 August 2009

Figure 4. The MapTube home page showing the most popular maps.
Figure 5. MapTube interface where members can add their own maps.
128 A. Hudson-Smith et al.
Downloaded By: [Hudson-Smith, Andrew] At: 10:18 12 August 2009

shows house prices with London underground lines overlaid on top. Once therequired visualisation has been created, it can be saved and shared and disseminatedvia a unique URL.
2.2.1. Mapping the credit crunch
Not only does MapTube allow people to share and view other peoples maps but it
can also be used in more innovative ways. For example, as web surveys are oftenaspatial (e.g. surveymonkey.com), the ability to use GMapCreator and MapTubeoffers a simple solution to build spatial surveys for large areas. A pilot study was
carried out as an experiment to create a mood map of the credit crunch within theUK in conjunction with BBC Radio 4 iPM show (Figure 7a).4 Based on what is the
singly most significant factor hurting the person the most about the credit crunch,participants were asked to enter the first part of their postcode (postcode sector) sotheir responses could be geotagged along with one of the six options to choose from:
mortgage or rent, fuel, food prices, holidays, other, or the credit crunch is notaffecting me as shown in Figure 7(b).
No personal data was collected and participants were reassured that actuallocations could not be identified. This was ensured through the use of postcode
sector rather than the postcode unit or building address, therefore preserving dataconfidentiality. Each response updated the database element of the underlying
Figure 6. Viewing maps in MapTube with the London Underground (tube) lines overlaid onhouse prices.
Journal of Location Based Services 129
Downloaded By: [Hudson-Smith, Andrew] At: 10:18 12 August 2009

Figure 7. Mapping the Credit Crunch. (a) Link from the BBC Radio 4 iPM Show; (b)choosing the singly most important factor hurting people the most concerning the creditcrunch and entering their postcode; (c) maps of the mood; (d) changes to the map of the moodas more people enter their information.
130 A. Hudson-Smith et al.
Downloaded By: [Hudson-Smith, Andrew] At: 10:18 12 August 2009

Figure 7. Continued.
Journal of Location Based Services 131
Downloaded By: [Hudson-Smith, Andrew] At: 10:18 12 August 2009

shapefile with GMapCreator running in the background every 30min to create a newmap which was subsequently updated on MapTube as shown in Figure 7(c). Overtime, as more participants enter data, the map went from blank to different shadesdepending what people are worried the most about in the postcode sector asdemonstrated in Figure 7(d). Used in conjunction with MapTube, it allowsparticipants and other users to take other information and lay the maps on top ofone other. The potential of this approach for gathering spatial data is enormous, asfor example, it could be easily used to gather other data such as fear of householdburglary, the quality of primary school education, access to local health facilities andso on.
Mapping the Credit Crunch represents one of the first near real-time geographicsurveys of a nation’s mood. As such the time element is also of importance as eachresponse includes a time stamp allowing the nations mood to be visualised in bothtime and space. At the time of writing the experiment is ongoing with over 22,000submissions made over a 10-day period in May 2008. We consider this in manysenses to be Web 2.0 and NeoGeography in action.
2.3. Other tools
Both GMapCreator and MapTube provide easy ways for non-expert users to createand disseminate data. However, we have also created several other tools that takeadvantage of multimedia and spatial location in Web 2.0 technologies and it is tothese that we now turn.
2.3.1. Google Earth Creator
Google Earth was developed for non-GIS users and thus the level of functionality iscompromised compared to a more traditional web-based GIS (e.g. ArcExplorer), butthe ability to navigate and overlay other data sets is vastly increased. Google Earthand other geobrowsers provide a base map on which to overlay, query and zoom inand out of the geographically organised data. It allows anyone to visualise data forfree unlike many professional GIS applications and has enormous potential. Forexample, the MODIS (2008) Active Fire Mapping Program by the US Forest Serviceprovides near real time satellite maps of currently active fires in various map formatsincluding KML.
As with Google Maps, displaying thematic data in Google Earth requires acertain amount of ‘hacking’. Google EarthCreator, pencilled for release in the thirdquarter of 2009, aims to reduce this at the same time providing a more advancedvisualisation of data than with Google Maps. Representing geographic data in threedimensions is a step on from GMapCreator. Google EarthCreator is currently beingdeveloped based on the same ideas of GMapCreator; it is intended to be a freelyavailable simple toolset to import shapefiles into Google Earth through KML. Aswith GMapCreator, various datasets (points, lines and polygons) can be uploadedand linked to attributes, as we show in Figure 8 which represents population countsextruded by London boroughs. However as noted in Section 2.1 the use of KMLallows others access to data and therefore copyrighted material cannot be freelyshared, for example, 3D virtual cities. Our Virtual London model (Batty andHudson-Smith 2005) at CASA is a case in point, created to inform the public at large
132 A. Hudson-Smith et al.
Downloaded By: [Hudson-Smith, Andrew] At: 10:18 12 August 2009

on issues relating to the city using a 3D model but the use of KML is problematicdue to copyright issues. As such, Virtual London can be seen as limited to a Web 1.0environment due to issues over data ownership. This is a common tale, especiallywhen national datasets are involved, and it throws into stark relief the wholemotivations for the development of Web 2.0 technologies
The publishing of geographical data from professional packages into any numberof online mapping services is an emerging field. Yahoo Maps, Microsoft Live,OpenStreetMap to name but a few, all allow data to be overlaid using varioussoftware routes. One such example is a feature in LandSerf (Wood 2007) that allowsthe user to export a shapefile to a KML and shade the polygons by attribute values,while the Arc2Earth5 exports ArcGIS data to view in Google Earth, Google Maps orVirtual Earth. Indeed the professional packages are also playing catch-up bybuilding in KML export direct, for example, the recently released product ArcGIS9.3 by ESRI.
These packages or extensions can be seen as professional GIS compared to sayGMapCreator and Google EarthCreator which are more aimed at the non-expertuser or NeoGeographer. Of note in these times of fast moving software whichaddresses emerging needs, the low-end software often has more functional than theircorporate counterparts due to the shorter development times compared with largerpackages.
2.3.2. Google Map Image Cutter
While Google EarthCreator uses points, lines and polygons, our next applicationGoogle Map Image Cutter6 is designed to take any image or digital photo andcut it into a series of smaller tiles (256 by 256 pixels) using a similar quad treealgorithm as in GMapCreator, the tiles then being displayed on a Google Map.
Figure 8. Visualising three-dimensional data of London via Google EarthCreator.
Journal of Location Based Services 133
Downloaded By: [Hudson-Smith, Andrew] At: 10:18 12 August 2009

Aimed at distributing gigapixel images in a plug-in free environment, GoogleMap Image Cutter automatically chooses the depth of the maximum zoom levelto correspond with the original size of the image. Using this software tool, largeimages can be published on the web in a format that allows the user to pan andzoom using the standard Google Maps interface. We illustrate this in Figure 9where Image Cutter is used to display classical Greek Manuscripts (HarvardUniversity 2008). Although publishing large digital photos is the most obviousapplication, this technique can also be used for annotated maps of an area thatare not to scale, e.g. directions for how to get to the office. While an unexpecteduse is the visualisation of high-resolution microscope work or Google-oscopy anddemonstrates how technologies and applications from different fields can be usedtogether.
At the time of writing the application has been downloaded over 3700 times.While it was produced in essence to distribute images of the city resultingfrom our gigapixel image research, its use by classical scholars at Harvard andparts of the medical world to share data with one another over the web is ofnote. With the use of blogs and other online publication systems, our software isable to easily reach an audience much wider than its target market, in our caseanyone interested in geography and cities in general. This begs the questionwhether there are emerging groups of other domains such as neomedical or aneohistorical group of users and so on. This of course is the promise of aWeb 2.0 world.
Figure 9. An example of the usage of Google Map Image Cutter to display a classical greekmanuscript (Harvard University 2008).
134 A. Hudson-Smith et al.
Downloaded By: [Hudson-Smith, Andrew] At: 10:18 12 August 2009

2.3.3. PhotoOverlay Creator
In a similar vein to Image Cutter, PhotoOverlay Creator7 has been created to allowhigh-resolution imagery to be imported into Google Earth, including 360� 180panoramas. Working in a similar manner to GMapCreator, the program tiles thedata, in this case images, and creates a KML file ready to place on a server. KML is
Figure 10. High resolution panorama images within Google Earth. (a) Chapel of St Peter andSt Paul in Greenwich, London created using PhotoOverlay Creator; (b) Panoramic sphere ofTrafalgar Square, London.
Journal of Location Based Services 135
Downloaded By: [Hudson-Smith, Andrew] At: 10:18 12 August 2009

simply a file based on the XML language for 3D geospatial data in Google Earth.
Just as web browsers display HTML files, Digital Earth browsers such as Google
Earth display KML files. PhotoOverlay Creator essentially allows one to place any
imagery into Google Earth on a 3D surface and in its correct geo-location as we
highlight in Figure 10(a). The ability to embed an image such as a panorama into
Google Earth allows an instant sense of location and space.Furthermore, the use of PhotoOverlay Creator allows one to create panoramic
spheres where the panorama is draped onto a sphere in x–y–z three-dimensional
space as shown in Figure 10(b). The images are placed on the reverse face of the
sphere allowing the user to look inside, while wrapping around a user when the user
enters the nodal point of the view, thus providing an exact replica of the human eye’s
line of sight from that location. These panoramas or ‘Urban Spheres’ as we call
them, are open source files linking to imagery outside Google Earth on sites such as
Flickr and this quickly enables us to create a sense of location and place. At the time
of writing, PhotoOverlay Creator has been downloaded over 1100 times.
3. NeoLives
Our discussion of Web 2.0 and NeoGeography naturally moves towards immersive
digital environments such as Second Life. Second Life and other similar virtual
environments are easy to dismiss as pure distraction and entertainment. However,
such worlds have a great potential for research (Bainbridge 2007). For example,
Second Life has the potential to combine all the aspects of Web 2.0, visualisation and
NeoGeography in a single multi-user, 3D collaborative environment where location
and place are of utmost importance.The idea behind virtual worlds like Second Life is to engage a community of users
through the web which opens their use to whoever is connected (with obvious limits
of membership and censorship). This ability of many to engage and interact is the
key feature that defines Web 2.0 where interaction is key and where most interaction
is currently achieved through graphical user interfaces (GUIs) (Hudson-Smith et al.
2007).Second Life is but the tip of an iceberg. It represents a glimpse into the future of
collaboration and visualisation. Overlapping with systems such as Google Earth and
toying with the concept of populated space, within the next few years the predictions
are for a ‘Second Earth’: a merger of Google Earth and Second Life (Roush 2007).
Second Earth is in short, an occupied version of Digital Earth. However this will be
difficult to achieve in Second Life, for while Second Life is a visual world, it does not
collate to cities or places in Google Earth. And nor could it, due to technology
constraints (Roush 2007), the lack of gravity, and the ability of its Avatars to fly or
teleport to areas. This creates a world whose physics is considerably different to the
real world.Second Life currently represents the most successful social/visual environment on
the web and differs from other more game-based systems such as the World of
Warcraft, as it does not have any overriding quests or goals. Launched in 2003 with
little more than a few kilometres of simulated computer space, it now covers more
than 750 km2 (Ondrejka 2007).8 Created by Linden Labs, the world of Second Life
has been created almost in its entirety by its users. For example, residents spend
136 A. Hudson-Smith et al.
Downloaded By: [Hudson-Smith, Andrew] At: 10:18 12 August 2009

a total of 23,000 h a day creating things (Hoff 2006) and therefore represent anexcellent example of crowd sourcing. The users have created digital geography in itspurest geographic sense. The rolling fields, rivers, valleys, mountains, hamlets andtowns that occupy the ever growing space have been created piece by piece by themillions of users and every part of Second Life’s visual space is editable.
It is free to enter Second Life, chat and begin exploring but if one wants to start‘building’ one has to register and purchase land. Many companies, organisations andacademic institutions have bought land in Second Life, including IBM, Sony-Ericsson, Oxford University and Nature Publishing, to name but a few, buildingstore fronts or head quarters where their employees’ avatars can do business. Oursection of land in Second Life can be found on Nature Island (Nature 2008), a plot ofland set up by Nature publishing group to encourage scientific research andoutreach. Our interest in Second Life is exploring this geographic space and to whatextent we can use it as a urban laboratory, exploring issues of urban planning andpublic debate in a visually collaborative environment. To this extent we are workingon three main themes within Second Life. The first is the importation ofgeographically tagged data including buildings, the second is real time feeds andthird is the visualisation of the built environment including building facades and‘step inside’ urban spheres, all of which provide a sense of place.
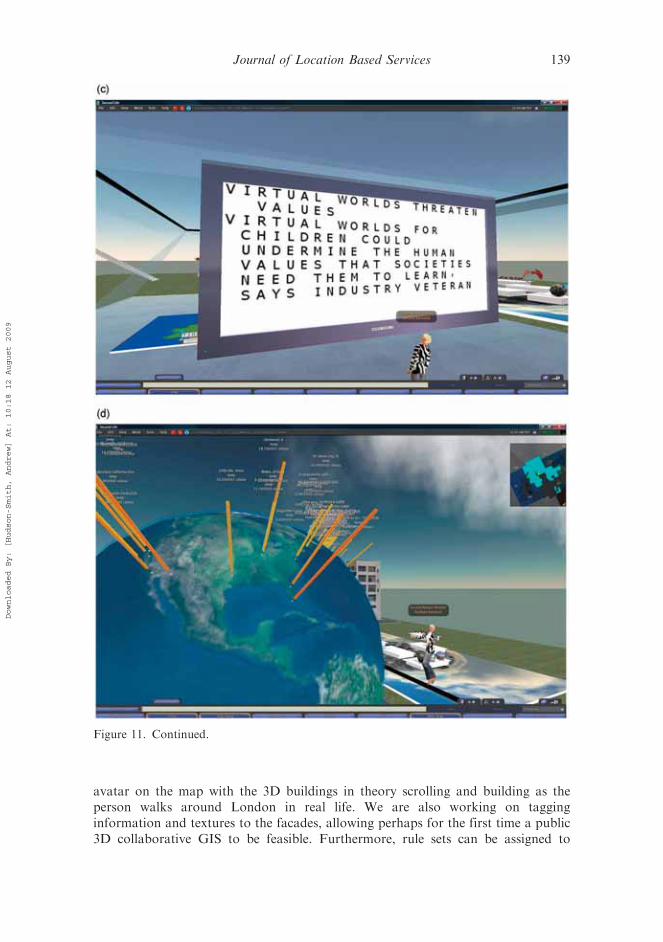
Second Life provides a synchronous platform with the ability to tie information,actions and rules to objects opening the possibility of a true multi-user GIS. We havebeen working on importing GI into Second Life such as physical terrain dataallowing ‘table top’ models of the earth’s physical geography to be viewed anddiscussed within a collaborative environment. Furthermore, one can import 3D datainto Second Life; for example we imported our Virtual London model (Batty andHudson-Smith 2005) which contains over three million buildings, of which pieceshave been laid out onto a scrolling map at a scaled down level. Created around asimple North/South/East/West interface the city has been split up into sections withdata loaded as and when required as we show in Figure 11(a). While in thebackground of Figure 11(a) buildings with facades are directly imported as JPEG’sfrom graphic packages. This shows how different scales can be represented withinsuch an environment from building blocks to ‘life’ size buildings. The importation ofGIS data has a huge potential for the display, quarrying and discussion of data eitherdirectly from native GIS formats (e.g. shapefiles) or by creating map boards. Forexample, Figure 11(b) illustrates a map display for global literacy rates directlylinked from MapTube. This ability opens up all sorts of possibilities for importinggeographical data into an environment that is ripe for public participation andcollaboration-type outreach activities.
While the visualisation and querying of GI is one avenue of research. Theacquisition of real time data is also of interest. For this first we experimented withimporting an RSS feed running on a text board within our section of Second NatureIsland. For example linked to the BBC News feed, updating every 20 s with the latestnews as we demonstrate in Figure 11(c). Second, we link near real time feeds togeographic places. For example, in Figure 11(d) we show weather data in SecondLife – global maps in our space on Second Nature Island displaying temperature,rainfall, wind speed, barometric pressure and humidity round the world. The globaldata is updated every 15min with the data for the UK on the local map updatedevery 10 s, allowing the 3D visualisation to morph between values.
Journal of Location Based Services 137
Downloaded By: [Hudson-Smith, Andrew] At: 10:18 12 August 2009

While the Second Life environment offers a whole host of possibilities, it is stillexperimental and there is still a major challenge in assembling informationcoherently and then using it collectively. Another stumbling block revolves aroundcopyright within virtual worlds. For example, Ordnance Survey asked us to removeour London Model from Second Life (Cross 2007). We are currently working onother avenues of research within Second Life. One is to import a live globalpositioning system (GPS) feed of a tagged person within London onto a scaled
Figure 11. Visualisation of data within Second Life. (a) Importing and visualising virtualcities; (b) visualising GI data; (c) RSS feed running on a text board; (d) real-time weather feedsfrom around the world.
138 A. Hudson-Smith et al.
Downloaded By: [Hudson-Smith, Andrew] At: 10:18 12 August 2009
avatar on the map with the 3D buildings in theory scrolling and building as theperson walks around London in real life. We are also working on tagginginformation and textures to the facades, allowing perhaps for the first time a public3D collaborative GIS to be feasible. Furthermore, rule sets can be assigned to
Figure 11. Continued.
Journal of Location Based Services 139
Downloaded By: [Hudson-Smith, Andrew] At: 10:18 12 August 2009

sub-objects allowing for agent-based models to be integrated into the system (e.g.
Maher and Merrick 2005).What we hear you ask is all this for? Second Life provides a rich environment for
teaching and learning as for example, in the National Oceanic and Atmospheric
Administration’s (NOAA) ‘Science on a Sphere’ which informs the public about how
weather, climate change and human disturbance affect our world (Hackathorn
2006). While one of our colleagues is building a tourist information system for
Phuket in Thailand using the traditional GIS, planning and decision support which istargeted at decision-makers, planners and tourists themselves. Bringing a great
diversity of material together in digital form and co-locating it in a form that
resembles the geography of the area is what Second Life offers. Moreover, it provides
an easy entry to space which is attractive and interactive from which users can
download material and search for related items of information and perhaps this is at
the core of the whole concept behind NeoGeography.
4. Discussion
The key to Web 2.0 and NeoGeography is the ability to communicate and share data
through simple, freely available tools that can be learnt quickly and effectively
without immersion in professional activities. For example, Google’s MyMaps makes
it possible to create one’s own map in a matter of minutes, with points, lines and
polygons and to integrate both images and video via either Google Video or
YouTube. These themes are complementary to GIS as one of the traditional roles of
GIS has been to provide data to support decision making, such as in public debates.
In essence, this is key to the success of MapTube in its ability to mix professionally
derived GIS information with the NeoGeographers at large. Tools for spatial
analysis are increasingly being delivered in a manner suitable for wider consumption,The growth in geobrowsers and tools to collect and manipulate geographic data
demonstrates that a decrease in knowledge is required to create and presentgeographical information and hint at the potential of geospatial technology to
maintain virtual communities and to revolutionise the production, distribution and
consumption of media products (Scharl 2007). We are but at the starting point of a
NeoGeography and the wealth of information that will come with it. The
incorporation of fast network links via WI-FI, 3G and Edge-based services
combined with location aware devices is moving NeoGeography away from the
desktop and into the field. Indeed, the Nokia N95 mobile phone with its built in
GPS, 5 megapixel camera and 3G is perhaps the first true NeoGeography tool.
Where once a geographer would pack a map, compass and notepad, the
NeoGeographer merely needs a mobile device to explore, navigate, document,
capture and log the environment.Mobile devices, especially mobile phones, are becoming increasingly locationally
aware, potentially paving the way for augmented reality and augmented services such
as Mediascape,9 freely available software released by Hewlett Packard which allowsthe development of simple location-based information applications. Defined by
Sterling (2007) as ‘hyperlocal’, these devices point to the future of NeoGeography
where geo-tagging items, people and objects will simply be common practice. It
should be noted that the development of computer graphics, broadband
140 A. Hudson-Smith et al.
Downloaded By: [Hudson-Smith, Andrew] At: 10:18 12 August 2009

communication and the widespread access to the internet does provide a digital
differential (Longley et al. 2008) and coverage tends to be better in cities.Mashups and virtual globes facilitate in the communication of spatial
information between stakeholders and government agencies and as such, mashups
provide a low cost and easy to use solution to this as we have shown with the London
Profiler. Combining different datasets within cities and overlaying them on aerial
photos and maps gives a visual understanding of our built environment. The
geographical world has changed. Google, perhaps more than any other company
before it, has done more for geography than any other, and it is not even a company
with geography at its core business. Geography has merely become a given and with
it have risen the tools and applications we have explored.Applications such as Google’s MyMaps or Yahoo Maps allow for the
visualisation of the ‘where’ with the ‘what’, but with this there is still a need for
careful design when creating the maps (Tufte 1990) and it still remains an art. As
Gibin et al. (2008) note for geovisualisation, the choice of colour scheme for the
thematic overlay must avoid tones that can be confounded with the underlying
Google map. Placing the thematic map data and putting on the street layer on top
allows essential GI to be conveyed along with additional attribute data.Sites such as Wikimapia or OpenStreetMap allow people to be converted
from being passive users to becoming active producers of geospatial information
(Sui 2007). However, this rise in personally gathered data, compared to data as
we would traditionally view it in large information sets from a central
repository, often government-based, raises several concerns, specifically accuracy,
privacy and liability with respect to VGI especially when one comes to share such
data.While the number of tools available for the NeoGeographer as highlighted within
this article is growing, analytic tools for ESDA such as those that enable brushing
and highlighting across a series of maps are still missing For example, Google Earth
has no analytic functions and it is not designed to replace professional GIS software
such as ArcGIS Explorer which comes equipped with a series of analytic tools (and
which is free for the end-user) that allows users of ArcGIS to publish virtual globes
(Butler 2006b).Google Maps is useful for a data publishing solution, however a ‘browse-tool’
would be useful. For example, with GMapCreator the pre-rendered data stored
makes it possible to publish geographically extensive data on the web but its tile-
based architecture as described earlier makes it more suited to browsing rather than
interrogating the data. Using pre-rendered tiles it is possible to dynamically overlay
different thematic layers and make comparisons manually based on values contained
in the raster layer similar to Map Algebra (Tomlin 1990). Boolean comparison of
thematic regions from pre-rendered layers can be done as this can be reduced to a
pixel operation between map tiles from different sources on the web server based on
user-specified criteria. For example, a system has been tested that renders a
demographic classification for areas where house prices are greater than a specified
threshold. The inputs to this system are two pre-rendered thematic maps built using
the GMapCreator with the output a hybrid overlay (CASA 2007). This opens up
some interesting possibilities in which people can publish data that may be explored
interactively by a large numbers of users.
Journal of Location Based Services 141
Downloaded By: [Hudson-Smith, Andrew] At: 10:18 12 August 2009

The applications we have presented within this article lie at the centre ofNeoGeography and Web 2.0. They demonstrate the importance of space, place and
allow public participation in mapping endeavours. Web 2.0 and innovations likeSecond Life continue to point the way to a rich and multifaceted info-space with
Web 2.0 changing the ways companies work, embracing the consumer, allowingsocial networks to build content and therefore add value to their systems. In manyways, this combination of ideas, work hours and mass collaborative efforts is like the
emergence of a digital frontier, a bottom up model for an interconnected system ofrelatively simple elements which self organise themselves into a form of intelligent,adaptive behaviour (Johnson 2001).
In essence, we are at the beginning of what will be a revolution in social, visual
and informational data plotted geographically by general users. The world of theNeoGeographer is currently mashup, freeware, mobile device and informationcreation led. The NeoGeographer is in essence a data-logger using the latest
technologies and software to collect and share GI. The future is neoinformation,whereby the everyday person uses this collated data simply as part of everyday life.Information is becoming hyperlocal and with it so are we.
Acknowledgements
The authors are grateful to the Economic and Social Research Council (ESRC) for fundingthrough the National Centre for e-Social Science (NCeSS). The authors would also like toacknowledge the support of GLA Economics. Richard Milton is the creator of GMapCreator,Image Cutter, PhotoOverlay Creator, MapTube and Google EarthCreator; Maurizio Gibin isthe creator and designer of the London Profiler. Joel Dearden provided programmingexpertise for the Second Life applications. Finally, we would like to express our appreciationto the Nature Publishing group for the provision of land in Second Life. Further informationpertaining to our work within Second Life can be found at http://digitalurban.blogspot.com/.
Notes
1. Google Map Creator is available from http://www.casa.ucl.ac.uk/software/googlemapcreator.asp.
2. This is at the crux of what distinguishes a NeoGeographer from a GIS professional.3. More information can be found at http://www.hesonline.nhs.uk/.4. Link to the radio show http://www.bbc.co.uk/blogs/ipm/2008/04/mapping_the_
credit_crunch.shtml.5. http://www.arc2earth.com/6. Google Map Image Cutter is available from http://www.casa.ucl.ac.uk/software/
googlemapimagecutter.asp.7. PhotoOverlay Creator is available from http://www.casa.ucl.ac.uk/software/
photooverlaycreator.asp.8. Further statistics about Second Life can be found at http://secondlife.com/whatis/
economy_stats.php (last accessed 12th May 2008).9. Mediascape is available at http://www.hpl.hp.com/mediascapes/.
References
Bainbridge, W.S., 2007. The Scientific Research Potential of Virtual Worlds. Science, 317,
472–476.
142 A. Hudson-Smith et al.
Downloaded By: [Hudson-Smith, Andrew] At: 10:18 12 August 2009

Batty, M. and Hudson-Smith, A., 2005. Urban Simulacra. Architectural Design, 75 (6),
42–47.BBC Radio Berkshire, 2007. Flood Map. Available from: http://www.bbc.co.uk/berkshire/
content/articles/2007/07/23/flood_map_feature.shtml [Accessed 28 April 2008].Buckley, A.R., Gahegan, M., and Clarke, K., 2004. Geographic visualization.
In: R.B. McMaster and E.L. Usery, eds. A research agenda for geographic information
science. Boca Raton, FL: CRC Press, 313–334.
Butler, D., 2006a. Mashups mix data into global service. Nature, 439, 6–7.Butler, D., 2006b. The web-wide world. Nature, 439, 776–778.CASA, 2007. Combining Google Maps Tile Layers. CASA Blog: thoughts from the Centre for of
Advanced Spatial Analysis. Available from: http://blog.casa.ucl.ac.uk/ [Accessed
13 May 2008].
Corver, M., 2005. Young participation in higher education. HEFCE 2005/03. Bristol: HEFCE.Cross, M., 2007. Does this sound familiar? Virtual London removed from second life - at
ordnance survey request. Available from: http://www.freeourdata.org.uk/blog/
[Accessed 21 May 2008].
DCLG, 2007. Department of Communities and Local Government: index of multiple deprivation
[online]. Available from: http://www.communities.gov.uk/communities/neighbourhoo-
drenewal/deprivation/deprivation07/ [Accessed 19 May 2008].de Smith, M.J., Goodchild, M.F., and Longley, P.A., 2007. Geospatial analysis: a
comprehensive guide to principles, techniques and software tools. 2nd ed. Winchelsea,
UK: The Winchelsea Press.Dodge, M., McDerby, M., and Turner, M., 2008. Geographic visualization: concepts, tools and
applications. Hoboken, NJ: Wiley.Dransch, D., 2000. The use of different media in visualizing spatial data. Computer &
Geosciences, 26 (1), 5–9.Eisnor, D., 2006. Neogeography. Available from: http://www.platial.com [Accessed 23 April
2008].Erle, S., Gibson, R., and Walsh, J., 2006. Mapping hacks: tips & tools for electronic
cartography. Sebastopol, CA: O’Reilly Media.Gibin, M., Singleton, A., Milton, R., Pablo Mateos, P., and Longley, P., 2008. Collaborative
mapping of London using Google maps: the London profiler, Working Paper 132,
London, UK: Centre for Advanced Spatial Analysis, University College London.Goodchild, M.F., 2007. Citizens as sensors: the world of volunteered geography. GeoJournal,
69 (4), 211–221.Google, 2008. Google Mapplets API. Available from: http://code.google.com/apis/maps/
documentation/mapplets/ [Accessed 15 May 2006].Graham, P. 2007. Web 2.0. Available from: http://www.paulgraham.com/web20.html
[Accessed 1 May 2008].Hackathorn, E.J., 2006. Designing an educational island inside second life for the National
Oceanic and Atmospheric Administration (NOAA) Earth System Research Laboratory
(ESRL). In: D. Livingstone J. Kemp, eds. Proceedings of the second life education
workshop at the second life community convention, 20 August 2006 San Francisco, 12.
University of Paisley, UK. Available from: http://eric.ed.gov/ERICDocs/data/
ericdocs2sql/content_storage_01/0000019b/80/1b/ef/03.pdf.Harvard University, 2008. The Homer Multitext project, The Center for Hellenic Studies,
Harvard University. Available from: http://chs75.harvard.edu/manuscripts/index.html
[Accessed 16 May 2008].Hoff, R.D., 2005. Mix, match, and mutate: ‘mash-ups’ – homespun combinations of
mainstream services – are altering the net, Business Week. Available from: http://
www.businessweek.com/magazine/content/05_30/b3944108_mz063.htm [Accessed 23
April 2008].
Journal of Location Based Services 143
Downloaded By: [Hudson-Smith, Andrew] At: 10:18 12 August 2009

Hoff, R.D., 2006. A virtual world’s real Dollars, Business Week. Available from:
http://www.businessweek.com/technology/content/mar2006/tc20060328_688225.htm
[Accessed 23 April 2008].Howe, J., 2006. The Rise of crowdsourcing. Wired Magazine, 14 (6), 161–165.Hudson-Smith, A., 2008. Digital geography: Geographic visualisation for urban environ-
ments. London, UK: Centre for Advanced Spatial Analysis, University College
London.
Hudson-Smith, A., Milton, R., Dearden, J., and Batty, M., 2007. Virtual cities: Digital mirrors
into a recursive world, Working Paper 124. London, UK: Centre for Advanced Spatial
Analysis, University College London.Johnson, S., 2001. Emergence: The connected lives of ants, brains, cities and software.
New York, NY: Scribner.Keen, A., 2007. The cult of the amateur: How today’s internet is killing our culture. New York,
NY: Currency.Longley, P.A., Ashby, D.I., Webber, R., and Li, C., 2006. Geodemographic classifications, the
digital divide and understanding customer take-up of new technologies. BT Technology
Journal, 24, 67–74.Longley, P.A., Webber, R., and Li, C., 2008. The UK Geography of the E-Society: A national
classification. Environment and Planning A, 40 (2), 362–382.Maher, M.L. and Merrick, K., 2005. Agent models for dynamic 3D virtual worlds’. In: T.L.
Kunii, S.H. Soon and A. Sourin, eds. Proceedings of the 2005 International Conference
on Cyberworlds. Nanyang Technological University, Singapore. IEEE Computer
Society, 27–34.Martin, D., 2001. Geographic information systems: Socioeconomic applications. London, UK:
Routledge.Mateos, P., Webber, R., and Longley, P.A., 2007. The cultural, ethnic and linguistic
classification of populations and neighbourhoods using personal names, Working Paper
116, London, UK: Centre for Advanced Spatial Analysis, University College London.
Metropolitan Police Service, 2008. Crime statistics. Available from: http://www.met.police.uk/
crimestatistics/ [Accessed 6 May 2008].MODIS, 2008. Active fire mapping program. Available from: http://activefiremaps.fs.fed.us/
[Accessed on 21 May 2008].Nature, 2008. Second nature. Available from: http://www.nature.com/secondnature/ [Accessed
16 May 2008].Ondrejka, C., 2007. Collapsing geography, second life, innovation and the future of national
power. Innovations: Technology, Governance, Globalization, 2 (3), 27–54.Purvis, M., Sambells, J., and Turner, C., 2006. Beginning Google maps applications with PHP
and Ajax. Berkeley, CA: APress.Roush, W., 2007. Second earth: The World Wide Web will soon be absorbed into the World
Wide Sim: An environment combining elements of second life and Google Earth,
technology review. Available from: http://www.technologyreview.com/Infotech/18911/
?a¼f [Accessed 6 May 2008].Scharl, A., 2007. Towards the geospatial web: Media platforms for managing geotagged
knowledge repositories. In: A. Scharl and K. Tochtermann, eds. The geospatial web –
how geo-browsers, social software and the Web 2.0 are shaping the network society.
London, UK: Springer, 3–14.Schmidt, E., 2006 in Bogatin, D., 2006. Google CEO’s new paradigm: ‘Cloud computing and
advertising go hand-in-hand’. Available from: http://blogs.zdnet.com/micro-markets/
?p¼369 [Accessed 21 May 2008].Sterling, B., 2007. Dispatches from the hyperlocal future. Wired, 15 (7), 161–165.
Sui, D., 2007. Volunteered geographic information: A tetradic analysis using McLuhan’s Law
of the media. Position paper for the specialist meeting on volunteered geographic
144 A. Hudson-Smith et al.
Downloaded By: [Hudson-Smith, Andrew] At: 10:18 12 August 2009

information, Santa Barbara, CA. University of California, Santa Barbara. Availablefrom: http://www.ncgia.ucsb.edu/projects/vgi/[Accessed 8 May 2008].
Tapscott, D. and Williams, A.D., 2006. Wikinomics: How mass collaboration changeseverything. New York, NY: Portfolio.
Tomlin, D.C., 1990. Geographic information systems and cartographic modelling. New Jersey:Prentice-Hall.
Tufte, E., 1990. Envisioning information. Cheshire, CT: Graphic Press.
Turner, A., 2006. Introduction to neogeography, O’Reilly, PDF Publication, Sebastopol, CA.Available from: http://www.oreilly.com/catalog/neogeography/ [Accessed 23 April2008].
UCL, 2008. University College London Campus Route Finder. Available from: http://crf.casa.ucl.ac.uk/ [Accessed 15 May 2008].
Vickers, D. and Rees, P., 2007. Creating the national statistics 2001 output area classification.
Journal of the Royal Statistical Society, Series A, 170 (2), 379–403.Wood, J., 2007. LandSerf. Available from: http://www.soi.city.ac.uk/�jwo/landserf/land-
serf230/ [Accessed 14 May 2008].
Journal of Location Based Services 145
Downloaded By: [Hudson-Smith, Andrew] At: 10:18 12 August 2009