Embed Size (px)
Citation preview

Page 1/21
Less rain and rainy days - lessons from 45 years ofrainfall data (1971 to 2015) in the Kathmandu Valley,NepalRajaram Prajapati ( [email protected] )
Smartphones For Water Nepal (S4W-Nepal) https://orcid.org/0000-0002-1644-9991Rocky Talchabhadel
Smartphones For Water Nepal (S4W-Nepal), and Kyoto UniversityPriya Silwal
Smartphones For Water Nepal (S4W-Nepal)Surabhi Upadhyay
Smartphones For Water Nepal (S4W-Nepal)Brandon Ertis
SmartPhones4WaterBhesh Raj Thapa
Smartphones For Water Nepal (S4W-Nepal), and Universal Engineering and Science CollegeJeffrey C. Davids
SmartPhones4Water, and California State University
Research Article
Keywords: rainfall pattern, spatio-temporal variability, Kathmandu Valley, Nepal
Posted Date: February 18th, 2021
DOI: https://doi.org/10.21203/rs.3.rs-167685/v1
License: This work is licensed under a Creative Commons Attribution 4.0 International License. Read FullLicense

Page 2/21
AbstractUnderstanding spatio-temporal variability in rainfall patterns is crucial for evaluating water balances needed forwater resources planning and management. This paper investigates spatio-temporal variability in rainfall andassesses the frequency of daily rainfall observations from seven stations in the Kathmandu Valley, Nepal, from1971–2015. Daily rainfall totals were classi�ed into �ve classes, namely, A (light rain, daily rainfall < 10 mm in aday), B (between 10–50 mm), C (between 50–100 mm), D (between 100–150 mm) and E (> 150 mm). Therelationship between daily rainfall and rainfall frequency of various rainfall rate classes were analysed. Krigingmethod was used for interpolation in interpreting seasonal and annual rainfall data and spatial maps weregenerated using QGIS. The Mann-Kendall (MK) test was performed to determine the temporal trends and Theil-Sen’s (TS) slope estimator was used in quantifying the magnitude of trends. Mountain stations showed adecreasing trend in rainfall for all seasons, ranging from − 8.4 mm/year at Sankhu to -21.8 mm/year at Thankot,whereas, a mixed pattern was found on the Valley �oor. Mean annual rainfall in the Valley was 1610 mm. Bothannual rainfall and the number of rainy days decreased in the Kathmandu Valley over the study period. The studyindicated a signi�cant reduction in rainfall after 2000. Since springs and shallow groundwater are the primarysources of water supply for residents in the Kathmandu Valley, it is apparent that decreasing rainfall will have(and is already having) an adverse impact on domestic, industrial, and agricultural water supplies, and thelivelihoods of people.
1. IntroductionRainfall, one of the major components of the hydrological cycle, in�uences life on earth (Shrestha and Sthapit2015). A sound understanding of spatio-temporal rainfall variability is vital for evaluating water balances atvarious scales, which in turn are prerequisites for effective water resources planning and management (Wong etal. 2009; Thapa et al. 2017). An assessment of rainfall variability is a frequent practice in hydrology and hasimportant applications in hydrologic modeling, water resource assessments, agricultural planning, �oodfrequency analysis (Buytaert et al. 2006), �ood hazard mapping, climate change impacts and otherenvironmental assessments (Ngongondo et al. 2011).
In particular, studies on rainfall variability have signi�cant roles in urban hydrology, where the hydrologicresponse is sensitive to rainfall distribution in both space and time, due to the dominant impervious surfaces,medium-sized catchment and high spatial heterogeneity of urban land use (Emmanuel et al. 2012; Cristiano et al.2017). Further, the study of rainfall variability in urban areas is necessary to learn about the impact of globalclimate change as well as the in�uence of local urbanization and development on rainfall (Karki et al. 2017).
In Nepal, the summer monsoon rainfall (from June to September), which accounts for approximately 80% of thetotal annual rainfall, is governed by the South Asian Monsoon originating from the Bay of Bengal (Panthi et al.2015). Signi�cant spatio-temporal variations in the rainfall pattern have been illustrated in previous studies(Ichiyanagi et al. 2007; Karki et al. 2017; Bohlinger and Sorteberg 2018; Dahal et al. 2019). The summer monsoonis more active in eastern and central Nepal, whereas winter rainfall, caused by western disturbances originatingfrom the Mediterranean Sea (Shrestha and Sthapit 2015; Talchabhadel et al. 2018a), is more active in westernNepal (Ichiyanagi et al. 2007; Sigdel and Ikeda 2012). The climatic regime varies from subtropical near Nepal’ssouthern border, to warm and cool in the hills, to cold on the mountains; this climatic variability occurs in lessthan 200 km moving from India-Nepal border northward (Shankar and Shrestha 1985; Chalise 1994; Karki et al.

Page 3/21
2016). Diverse topography over the latitudinal distance of 193 km causes a high variation of rainfall throughoutNepal due to intense orographic lifting and subsequent rain shadowing. Interestingly, two signi�cant rainfallpeaks appear over the southern slope of the Himalayas across Nepal due to its unique topographical setting; the�rst peak appears along 500 – 700 meters above sea level (masl), and the second peak appears along 2000–2200 masl (Shrestha and Sthapit 2015; Talchabhadel et al. 2018a). The substantial �uctuation in rainfall is thereason for the water crisis during the drier months and extreme precipitation events resulting in �oods, landslides,and other water-induced disasters in monsoon months (Tuladhar et al. 2020).
To date, perhaps due to limited data availability, only a few studies have analyzed observed rainfall data in Nepal(Shrestha and Aryal 2010). Dhital and Kayastha (2013) performed frequency analysis of future rainfall and peak�ood events in the Bagmati catchment. A study on rainfall intensity of the Kathmandu Valley was done byPokharel and Hallet (2015). Bohlinger and Sorteberg (2018) analyzed the trends in monsoon rainfall and extremeevents in Nepal. Shrestha and Sthapit (2015) identi�ed the temporal trend of rainfall in Bagmati River basin usingtime series data for the period of 1981-2008. Karki (2015) studied the daily rainfall pattern of summer monsoonin the Kathmandu Valley. Tuladhar et al. (2020) analyzed local variability in rainfall distributions as well as long-term trends of monthly and annual rainfall in the Bagmati River catchment.
The Kathmandu Valley (Valley) is the most populated urban center in Nepal. Uncontrolled urban expansion in theValley has increased water demand and also reduced groundwater recharge potential by lowering surfacein�ltration capacities (Davids et al. 2018). Springs originating from the upper portions of the mountainouswatersheds surrounding the Valley along with groundwater are the primary sources of freshwater supply in theValley. Summer monsoon rain is the main source of these springs, surface water, and groundwater recharge(Shrestha and Sthapit 2015). Degradation of both quality and quantity of surface water supplies led to excessiveextraction of groundwater (Shrestha et al. 2012). To deal with the current water crisis, the Kathmandu ValleyWater Supply Management Board (KVWSMB), a government agency responsible for water supply and sanitationmanagement in the Valley, is planning to augment groundwater recharge in the Valley. Urban �ooding due toshort-duration intense rainfall coupled with increased built land use has become an emerging issue in theValley. Improving the understanding of temporal and spatial structures of rainfall is, therefore, integral to thesustainable livelihood of people. Variation in rainfall patterns may signi�cantly affect the springs, streams, andgroundwater of surrounding headwater catchments, the lifeline of water supplies for downgradient urbandwellers, industry, and agriculture. Thus, the assessment of the annual rainfall pattern and its seasonal variationsis critical for sustainable water resource management and planning. The major objective of our study was toimprove our understanding of the rainfall in the Valley by:
1. Assessing the frequency of rain events and rainfall accumulated by events of various intensity
2. Investigating and quantifying the spatial and temporal trends in annual and seasonal rainfall variability
The present study includes an investigation of spatio-temporal variability of rainfall in the Kathmandu Valleyfrom 1971 to 2015, using data available from the Department of Hydrology and Meteorology (DHM), Governmentof Nepal.
2. Study Area

Page 4/21
The Kathmandu Valley lies between 27°32′13″ - 27°49′10″N latitude and 85°11′31″ - 85°31′38″ E longitude (Fig. 1).The Kathmandu Valley watershed has an area of approximately 587 square kilometers (km2) (Davids et al.2018). The Valley is surrounded by hills: Phulchowki in the South East, Chandragiri/Champa Devi in the SouthWest, Shivapuri in the North West, and Nagarkot in the North East. The Valley is a roughly circular intermontanebasin with an approximate diameter of 25 km and an average altitude of 1350 meters above sea level (masl)while the surrounding hills reach as high as approximately 2800 masl in elevation (Shrestha et al. 2016; Thapa etal. 2017). The Valley consists mainly of alluvial plains, alluvial and colluvial fans, �uvial and lacustrine terraces,and steep to very steep sloping mountains. The Valley lies in a semi-tropic zone and is characterized by a warmand temperate climate (Karki et al. 2016) having a rainy season from June through September.
3. Methods3.1 Data
Daily rainfall data for the period between 1971 and 2015 were obtained from the Department of Hydrology andMeteorology, Government of Nepal (DHM 2019). Although there are 20 rainfall stations in the Kathmandu Valleywith elevation ranging from 1212 m at Khokana, Lalitpur to 2163 m at Nagarkot, Bhaktapur, the present studyconsidered the daily rainfall data only for seven spatially distributed stations due to incomplete time-series datafor the study period in other stations. Additionally, available data of the Bagmati River Basin (BRB) for the period1986-2015 of 41 stations, including those stations that lie in the Valley, were analyzed for a broader perspectiveon basin level seasonal and annual rainfall series. Table 1 provides a brief description of the rainfall stationsused, including their location, elevation, mean annual rainfall, standard deviation and year of installation. Missingdata were replaced with the daily rainfall data of the nearest station.
3.2 Spatial and temporal characteristics
3.2.1 Distribution pattern of daily rainfall
Rainfall was classi�ed into �ve rainfall rate classes based on the amount of daily rainfall (Table 2). The amountof rainfall contributed in percentage (% of total rainfall) by various rainfall rate classes for various stations of theKathmandu Valley was calculated. Similarly, the frequency of rainy days in percentage (% of total rainy days in ayear) by various classes of rainfall rate was also calculated. A combo-chart of a bar graph and a line graph wasprepared to demonstrate the relationship between daily rainfall and rainfall frequency of various rainfall rateclasses. Further, the temporal distribution of rainfall amount of various rainfall rate classes was analyzed for �vesub-periods.
3.2.2 Local and Valley-wide rainfall distribution
The total rainfall days were categorized into two major categories: (a) Local rainfall and (b) Valley-wide rainfall.When all the rainfall stations record daily rainfall > 0.1 millimeters (mm) per day, it is termed as Valley-widerainfall. When some rainfall stations record daily rainfall > 0.1 mm per day but remaining stations record rainfall< 0.1 mm per day, it is termed as Local rainfall. When all the stations record 0 mm rainfall per day, it is termed asDry and the number of maximum consecutive dry days is termed as Maximum Consecutive Dry Days (MCDD).The number of maximum consecutive rainfall days were classi�ed into Maximum Consecutive Local RainfallDays (MCLRD) and Maximum Consecutive Valley-wide Rainfall Days (MCVRD). Local Rainfall Index (LRI) is the

Page 5/21
ratio of rainfall contributed by Local rainfall to the annual rainfall whereas Valley-wide Rainfall Index (VRI) is theratio of rainfall contributed by Valley-wide rainfall to the annual rainfall. Local and Valley-wide rainfalldistribution was analyzed using line plots.
3.2.3 Annual and seasonal rainfall series
The average daily rainfall was split per month and then per season. The seasons considered were March to Mayas pre-monsoon, June to September as monsoon, October to November as post-monsoon and December toFebruary as winter. The time series was divided into �ve sub-periods: (a) 1971-1980, (b) 1981-1990, (c) 1991-2000, (d) 2001-2010, and (e) 2011-2015. However, depending on the availability of data, the time series weredivided into four sub-periods for the Bagmati River Basin i.e. 1986-1990, 1991-2000, 2001-2010, and 2011-2015.The average values for different sub-periods for different seasons were then calculated. Kriging method was usedfor the interpolation of the seasonal and annual rainfall average as it is an advanced, computationally intensive,geostatistical estimation method (Buytaert et al. 2006). Spatial maps for different seasons for each sub-periodwere prepared using the Quantum Geographic Information System (QGIS). A box-plot of mean annual rainfall(1971-2015) was prepared to analyze the temporal variation of rainfall in the Kathmandu Valley. The sameanalyses were repeated for the Bagmati River Basin with data from 1986-2015.
3.3 Trend analysis
Mann−Kendall (MK) test was used to determine the signi�cance of temporal trends whereas Theil−Sen’s (TS)slope estimator was used to quantify the magnitude of trends (Mann 1945; Kendall 1975; Talchabhadel et al.2018b). The World Meteorological Organization (WMO) recommends the non-parametric MK test for assessmentof trends in meteorological data as it is simple, robust and insensitive to missing data and outliers (Ngongondo etal. 2011).
4. Results And Discussion4.1 Spatial and temporal characteristics
4.1.1 Distribution pattern of daily rainfall
Our study showed two distinct types of daily rainfall distributions (mountain and valley) in the Kathmandu Valley.The amount and frequency (number of days) of rainfall contributed in percentage (% of total annual rainfall) byvarious rainfall rate classes is shown in Fig. 2 for all stations. Although 60% of total rain events were of class ‘A’,these events contributed only 17% of total rainfall. The frequency of class ‘B’ was about 37%, but it contributedaround 63% of total rainfall. While class ‘C’ only had a frequency of around 3%, it contributed about 15% of totalrainfall. Extreme rainfall events of classes ‘D’ and ‘E’ were very infrequent (< 0.5%) contributing about 2% to totalrainfall.
The result shows that more than half of all rainy days were class ‘A’ (light rain), but its contribution was less thanone-�fth of total rainfall. Around 80% of total rainfall was contributed by classes ‘B’ and ‘C’ whereas thefrequency of these classes was about 40% of the total number of rainy days.
The frequency of class ‘B’ was almost equal to the frequency of class ‘A’ in mountain areas, while on the valley�oor, the frequency of class ‘B’ was lower than the frequency of class ‘A’. The frequency of class ‘C’ is higher in

Page 6/21
mountain areas (4.5%) than on the valley �oor (2.5%). Similarly, the rainfall contribution of class ‘C’ is higher inmountain areas and lower on the valley �oor than class ‘A’. These results show a higher frequency of heavyrainfall events and fewer light rainfall events in mountain areas, resulting in a higher amount of rainfall inmountain areas than on the valley �oor.
In a study by Karki (2015), 51% of total rain events had rainfall rates between 0.1-10 mm/day (Class A) whichaccounted for just 13% of the total rainfall. On the contrary, the frequency of rainfall events declined to 17% forrainfall rate between 30-90 mm/day (class B and C) but contributed to 46% of the total rainfall. Heavy rainfallevents i.e. rainfall rate more than 90 mm/day (class D and E) were less frequent and contributed to less than 2%of the rainfall received. The �ndings from the study are similar to what we observed i.e. higher amounts ofrainfall were received in the mountain parts (higher frequency of rainfall events i.e. between 10-100) compared tothe Valley �oor which might be because of the orographic effect.
4.1.2 Annual rainfall series
Annual rainfall had high spatial variation across the Kathmandu Valley. The mean annual rainfall was 1610 mm(1880 mm in mountain areas and 1410 mm on the valley �oor) for the study period. Along with spatial variability,the temporal variation was also substantial. The highest observed rainfall was 3425 mm in Sankhu station in1978 where the mean annual rainfall was 1865±247 mm for 1971-2015. And, the lowest observed rainfall was827 mm in Khumaltar station in 1992 where the mean annual rainfall was 1237±67 mm for the study period.Despite a substantial year to year variation, we observed spatial and topographical insights that the mountainstended to receive higher rainfall than the valley �oor, meaning the valley is drier than mountains. Sankhu station,located in the north-eastern part of the valley at the elevation of 1449 m, received the highest annual mean of1946 mm, whereas, Khumaltar station, located in the central part of the valley at the elevation of 1350 m, receivedthe lowest annual mean of 1228 mm (Fig. 4). Similar �ndings were observed in a study by Karki (2015), where thestations located in the mountains received an average of 1978 mm rainfall while that of the valley �oor received1151 mm on average. The northern part of the Valley receives most of the rainfall; when the moisture-laden airentering the Valley sinks into the southern part of the Valley �oor, the air warms resulting in less rainfall in thatarea compared to the mountainous northern parts (Karki 2015).The nature of rainfall distribution in the valleysuggests that local factors like topography, elevation, etc. play an important role in the spatial distribution ofrainfall.
4.1.3 Seasonal rainfall series
Around 80% of the total annual rainfall occurs in the monsoon season from June to September. Pre-monsooncontributes around 14% and post-monsoon and winter contribute around 6% of the total annual rainfall. Thepattern of the spatial distribution of seasonal rainfall was similar to the annual rainfall as mountains receivedmore rainfall than the valley �oor. The difference of monsoonal rainfall among the time series spatial maps (Fig.4) for different sub-periods indicated a signi�cant reduction in rainfall after 2000. The reduction of rainfall inmountain areas is quite higher compared to the valley �oor. Similarly, Fig. 4 showed a decrease in post-monsoonrainfall with time. The decrease in monsoon precipitation and subsequent increase in evapotranspiration resultsin low �ow in rivers (Sharma and Shakya 2006). In a study by Sharma and Shakya (2006), the river �owdecreased in the monsoon season; however, there was no signi�cant change in the pre- and post-monsoon.
4.1.4 Local and Valley-side rainfall distribution

Page 7/21
Fig. 5 shows the temporal distribution of Local rainfall days (LRD) and Valley-wide rainfall days (VRD) in theKathmandu Valley. For the �rst two decades (1971-1980 and 1981-1990), the average VRD was 52 and itincreased to 63 during 1991-2000. Then, it decreased to 47 and 40 in 2001-2010 and 2011-2015, respectively. Forthe �rst two decades (1971-1980 and 1981-1990), the average dry days (DD) was around 165 which increased to181 in 1990-2000. Then, it decreased to 171 and 178 in 2001-2010 and 2011-2015, respectively. Although therewas some decrease in LRD (120) in 1991-2000, the average LRD remained almost constant in other decades(146). But, the average VRD was decreasing and the average DD was increasing with time with an exception in1991-2000.
The average MCVRD decreased from 7.5 (in 1971-1980 and 1981-1190) to 6.5 (in 2000-2010 and 2011-2015)with an exceptional increase up to 10 in 1991-2000. The average MCDD was increasing in the last few decades.The average VRI decreased from 0.59 in 1971-1980 to 0.52 in 2000-2015 with an exception of 0.69 in 1991-2000.The average LRI increased from 0.41 in 1971-1980 to 0.48 in 2000-2015 with an exception of 0.31 in 1991-2000.It shows that the contribution of valley-wide rainfall to the annual rainfall is decreasing with time whereas thecontribution of local rainfall to the annual rainfall is increasing with time. The results indicate a micro-climaticfeature is more pronounced in recent times.
4.2 Trend analysis
The MK test was used to test the signi�cance of monotonic trends in the whole time series to the rainfallfrequency and rainfall amount for annual rainfall, different rainfall rate classes and seasonal rainfall. The testwas performed at 10% signi�cance level. Spatial distribution of long-term rainfall trends and their magnitudesbased on the MK test and Sen’s slope for annual rainfall is shown in Fig. 6. All stations (except KathmanduAirport) showed a falling trend for annual rainfall. All the mountain stations showed falling trends, ranging from8.4 mm/year at Sankhu to 21.8 mm/year at Thankot, though the trend at Sankhu was not signi�cant. A risingtrend of 4.3 mm/year was observed at Kathmandu Airport station located at the central part of the Kathmanduvalley. The magnitude of falling trends in the valley �oor is lower compared to the mountain areas. Panipokhariand Khumaltar showed falling trends of 0.5 mm/year and -1.3 mm/year respectively. Sankhu (-0.7 count/year),Panipokhari (-0.9 count/year) and Godavari (-0.9 count/year) stations showed statistically signi�cant fallingtrends whereas Bhaktapur and Kathmandu Airport station had a statistically insigni�cant falling trend of -0.2count/year for annual rainfall frequency. Thankot (0.1 count/year) and Khumaltar (0.3 count/year) stationswhich are located at the western part of the Kathmandu valley showed rising trends for annual rainfall frequency;however, only the rising trend at Khumaltar station was statistically signi�cant. The trend of rainfall frequency ismostly dependent on the rainfall frequency of class ‘A’ whereas rainfall amount of classes ‘B’ and ‘C’ dominatesthe trend of total annual rainfall.
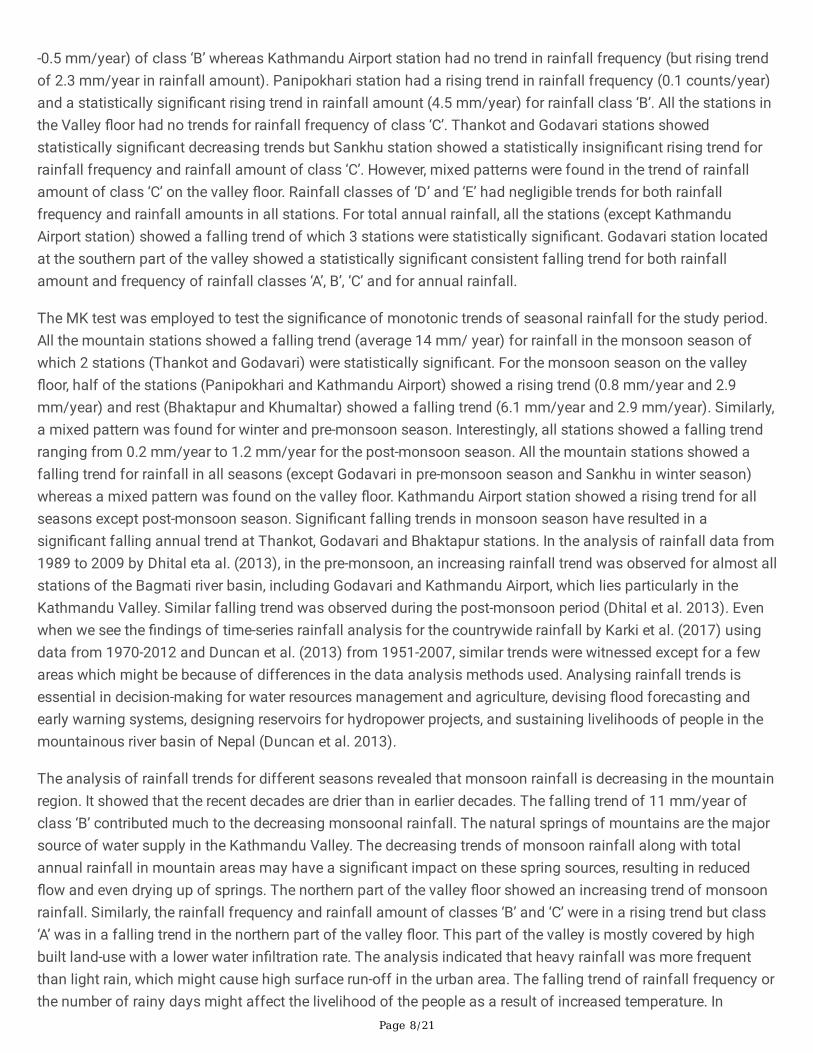
The spatial distribution of trend results of rainfall frequency and rainfall amount of different rainfall rate classesare shown in Fig. 6. In the rainfall frequency of class ‘A’, statistically signi�cant trends were identi�ed in �vestations with two rising (Sankhu and Khumaltar) and three falling trends (Godavari, Panipokhari and KathmanduAirport). The rainfall frequency of class ‘A’ at Sankhu station showed a falling trend (-0.3 count/year) whereasBhaktapur station had a constant trend. The falling trends in rainfall frequency (ranging from -0.3 count/year to-0.6 count/year) and rainfall amount (ranging from -13.9 mm/year to -6 mm/year) of class ‘B’ in mountainstations were statistically signi�cant. Two stations (Bhaktapur and Khumaltar stations) in the valley �oor had afalling trend in rainfall frequency (-0.2 count/year and -0.1 count/year) and rainfall amount (-6.1 mm/year and
Page 8/21
-0.5 mm/year) of class ‘B’ whereas Kathmandu Airport station had no trend in rainfall frequency (but rising trendof 2.3 mm/year in rainfall amount). Panipokhari station had a rising trend in rainfall frequency (0.1 counts/year)and a statistically signi�cant rising trend in rainfall amount (4.5 mm/year) for rainfall class ‘B’. All the stations inthe Valley �oor had no trends for rainfall frequency of class ‘C’. Thankot and Godavari stations showedstatistically signi�cant decreasing trends but Sankhu station showed a statistically insigni�cant rising trend forrainfall frequency and rainfall amount of class ‘C’. However, mixed patterns were found in the trend of rainfallamount of class ‘C’ on the valley �oor. Rainfall classes of ‘D’ and ‘E’ had negligible trends for both rainfallfrequency and rainfall amounts in all stations. For total annual rainfall, all the stations (except KathmanduAirport station) showed a falling trend of which 3 stations were statistically signi�cant. Godavari station locatedat the southern part of the valley showed a statistically signi�cant consistent falling trend for both rainfallamount and frequency of rainfall classes ‘A’, B’, ‘C’ and for annual rainfall.
The MK test was employed to test the signi�cance of monotonic trends of seasonal rainfall for the study period.All the mountain stations showed a falling trend (average 14 mm/ year) for rainfall in the monsoon season ofwhich 2 stations (Thankot and Godavari) were statistically signi�cant. For the monsoon season on the valley�oor, half of the stations (Panipokhari and Kathmandu Airport) showed a rising trend (0.8 mm/year and 2.9mm/year) and rest (Bhaktapur and Khumaltar) showed a falling trend (6.1 mm/year and 2.9 mm/year). Similarly,a mixed pattern was found for winter and pre-monsoon season. Interestingly, all stations showed a falling trendranging from 0.2 mm/year to 1.2 mm/year for the post-monsoon season. All the mountain stations showed afalling trend for rainfall in all seasons (except Godavari in pre-monsoon season and Sankhu in winter season)whereas a mixed pattern was found on the valley �oor. Kathmandu Airport station showed a rising trend for allseasons except post-monsoon season. Signi�cant falling trends in monsoon season have resulted in asigni�cant falling annual trend at Thankot, Godavari and Bhaktapur stations. In the analysis of rainfall data from1989 to 2009 by Dhital eta al. (2013), in the pre-monsoon, an increasing rainfall trend was observed for almost allstations of the Bagmati river basin, including Godavari and Kathmandu Airport, which lies particularly in theKathmandu Valley. Similar falling trend was observed during the post-monsoon period (Dhital et al. 2013). Evenwhen we see the �ndings of time-series rainfall analysis for the countrywide rainfall by Karki et al. (2017) usingdata from 1970-2012 and Duncan et al. (2013) from 1951-2007, similar trends were witnessed except for a fewareas which might be because of differences in the data analysis methods used. Analysing rainfall trends isessential in decision-making for water resources management and agriculture, devising �ood forecasting andearly warning systems, designing reservoirs for hydropower projects, and sustaining livelihoods of people in themountainous river basin of Nepal (Duncan et al. 2013).
The analysis of rainfall trends for different seasons revealed that monsoon rainfall is decreasing in the mountainregion. It showed that the recent decades are drier than in earlier decades. The falling trend of 11 mm/year ofclass ‘B’ contributed much to the decreasing monsoonal rainfall. The natural springs of mountains are the majorsource of water supply in the Kathmandu Valley. The decreasing trends of monsoon rainfall along with totalannual rainfall in mountain areas may have a signi�cant impact on these spring sources, resulting in reduced�ow and even drying up of springs. The northern part of the valley �oor showed an increasing trend of monsoonrainfall. Similarly, the rainfall frequency and rainfall amount of classes ‘B’ and ‘C’ were in a rising trend but class‘A’ was in a falling trend in the northern part of the valley �oor. This part of the valley is mostly covered by highbuilt land-use with a lower water in�ltration rate. The analysis indicated that heavy rainfall was more frequentthan light rain, which might cause high surface run-off in the urban area. The falling trend of rainfall frequency orthe number of rainy days might affect the livelihood of the people as a result of increased temperature. In

Page 9/21
Kathmandu Airport station, the annual rainfall is increasing but the number of rainy days is decreasing, indicatingmore heavy rainfall events. Similar �ndings were revealed in a study by Dhital et al. (2013), where a decreasingtrend in the frequency of rainfall days was observed while intensity of maximum precipitation was increasing inthe Kathmandu Airport station. Alteration in the rainfall pattern, accompanied by changes in temperature anddischarge, might result in water quality deterioration, decline in agricultural yield and hydropower generation,effect in aquatic biodiversity, etc. (Dhital et al. 2013). Furthermore, the decreasing post-monsoon and winterrainfall might have a negative impact on seasonal agricultural production like paddy rice, wheat, barley, potato,etc. (Panthi et al. 2015).
4.3 Seasonal and annual rainfall series for the Bagmati River Basin
Similar seasonal and trend analyses were performed for a larger scale i.e. in the BRB, analysing data from 41stations. The basin is divided into three parts, covering Kathmandu Valley in the upper, mountain and hills in themiddle and Terai plain in the lower parts of the basin (Babel et al. 2014). In the upper part of the basin, there is acritical water quality and quantity issue year-round, especially in winter, moving downward into the middle andlower part, landslides and monsoonal �oods are prevalent, respectively.
In between 1986-2015, the average rainfall was found to be 1676 mm. The highest observed rainfall was 3746mm in Makwanpur gadhi (Index No. 919) in the year 1999. From Figure 8, it can be clearly seen that the annualrainfall has been decreasing over time with 1775 mm between 1986-1990 and 1505 mm between 2011-2015. Inthe pre-monsoon season, precipitation patterns are almost constant and haven't varied signi�cantly over years.However, the monsoonal rainfall has increased from around 1390 mm between 1986-1990 to 1463 mm between1991-2000. In recent years (2011-2015), the average rainfall dropped below 1200 mm. Since the lower part of thebasin is Terai plain and has high agricultural potential, most of the people’s livelihood is connected to cropproduction. The declining monsoonal precipitation directly affects the river �ow impacting the irrigation systemspresent. In the study by Sharma and Shakya (2006), due to less water availability in the lower part of the basin,the yield of crops, particularly rice and wheat, declined. In the BRB, the winter season received the least rainfallfollowed by post-monsoon, pre-monsoon, and monsoon seasons. On average, the driest month seen in the studyperiod was November, while the wettest months were July and August. Also, it is clearly observed from Fig. 8 thatrecent years are dryer compared to past decades.
The �ndings in our analysis showed an alike trend with other basin studies of the country. A study by Dahal et al.(2019) showed alteration in precipitation patterns in the Rosi river basin and witnessed effects on the river �owand water insecurity in the river basin. Unlike the BRB, in the Gandaki basin, the monsoon precipitation increasedwith time. However, no signi�cant trend was observed which suggests that the basin has a high annual andseasonal rainfall variability. Due to an increase in rainfall in the monsoon season, the basin is likely to face water-induced disasters (Panthi et al. 2015). On the other hand, decreasing post-monsoonal and winter rainfall affectedwinter crops production due to soil moisture de�ciency (Panthi et al. 2015). In a study by Khatiwada et al. (2016),in the Karnali Basin, the average rainfall declined by 4.91 mm/year and similar effects on food and livelihood ofpeople were observed. Similar effects might be observed in the mountainous part of the Bagmati river basin.
Analysing seasonal rainfall patterns, particularly in the BRB as illustrated by Shrestha and Sthapit (2015), isessential in circulating data-driven �ndings to relevant authorities like government and non-governmentinstitutions for constructing water infrastructures like barrage wherever required, initiation for �ood control orevacuation, irrigation purposes, etc. The aforementioned water-induced disasters are major threats to

Page 10/21
infrastructure, agricultural land, and livelihoods throughout the basin. Therefore, it is crucial to cope with thehydro-climatic variability to minimize livelihood impacts and improve water security.
5. Conclusions And RecommendationsThe study investigated the spatial and temporal characteristics of rainfall at seven stations in the KathmanduValley. We performed the trend analysis of daily, seasonal and annual rainfall patterns using the MK test. Dailyrainfall analysis over the Kathmandu Valley clearly indicated the higher frequency of heavy rainfall events(rainfall class ‘B’ and ‘C’) and fewer light rainfall events (rainfall class ‘A’) in mountain areas resulting in higherrainfall amount of rainfall in mountain compared to the valley �oor. The trend of rainfall frequency is mostlydependent on the rainfall frequency of class ‘A’ whereas rainfall amount of classes ‘B’ and ‘C’ dominates the trendof total annual rainfall. Annual rainfall had high spatial variation across the valley with higher rainfall in themountains compared to the valley �oor. The observations of this study depict a falling trend of an average of 14mm/year in both monsoonal as well as annual rainfall in the mountains. In the valley �oor, half of the stationsshowed a rising trend and rest showed a falling trend in monsoon season whereas all the stations exceptKathmandu Airport showed a falling trend for annual rainfall.
The study showed that both annual rainfall and the number of rainy days decreased in the Kathmandu Valleyover the study period. Our current study considered seven rainfall stations (1971 - 2015) which seem insu�cientto assess the rainfall variability at small-scales. Monitoring and understanding spatio-temporal rainfalldistribution at small-scales is vital for local and regional water resource management; this study only representsan initial step towards evaluating this in the Kathmandu Valley.
New technologies and practices have been developed to monitor the spatio-temporal variability of rainfallpatterns at a higher resolution. Satellite-based rainfall estimation (Talchabhadel et al., 2021) and use of thecitizen science approach (Davids et al. 2018; Davids et al. 2019) in rainfall measurement can be an alternativeway to �ll the spatial gaps and to cover the spatial heterogeneity. However, evaluation of the performance ofsatellite-based rainfall estimates is vital and these products can be blended with the rainfall data from raingauges to improve the overall accuracy. In particular, rainfall monitoring networks in urban areas in valleys suchas Kathmandu and Pokhara have some limitations due to strong microclimatic variation, highlighting the needfor dense monitoring networks. Installation of highly technical X-radar is quite demanding. Most importantly,citizen science may be considered as a suitable approach to address such issues at the present time. At the sametime, the quality assurance of citizen science-based data should also be considered. The current study could bereplicated to the other river basins to assess the spatio-temporal rainfall variability. The study of long-term rainfalltrends in conjunction with other meteorological parameters like temperature would be our future work. We believesuch studies could be useful to understand the impact of climate change in the mountains.
DeclarationsNot applicable
References
Page 11/21
Babel MS, Bhusal SP, Wahid SM, and Agarwal A (2014) Climate change and water resources in the Bagmati RiverBasin, Nepal. Theoretical and Applied Climatology 115(3-4): 639-654. https://doi.org/10.1007/s00704-013-0910-4
Bohlinger P and Sorteberg A (2018) A comprehensive view on trends in extreme precipitation in Nepal and theirspatial distribution. International Journal of Climatology 38(4): 1833-1845. https://doi.org/10.1002/joc.5299
Buytaert W, Celleri R, Willems P, Bievre BD, Wyseure G (2006) Spatial and temporal rainfall variability inmountainous areas: A case study from the south Ecuadorian Andes. Journal of Hydrology 329(3-4): 413-421.https://doi.org/10.1016/j.jhydrol.2006.02.031
Chalise SR (1994) Mountain Environments and Climate Change in the Hindu Kush- Himalayas. In: MountainEnvironments in Changing Climate (ed.M. Beniston), London, pp.382-404
Cristiano E, Veldhuis MCT, Giesen NVD (2017) Spatial and temporal variability of rainfall and their effects onhydrological response in urban areas–a review. Hydrology and Earth System Sciences 21(7): 3859-3878.https://doi.org/10.5194/hess-21-3859-2017
Dahal N, Shrestha UB, Tuitui A, Ojha HR (2019) Temporal changes in precipitation and temperature and theirimplications on the stream�ow of Rosi River, Central Nepal. Climate 7(1): 3. https://doi.org/10.3390/cli7010003
Davids JC, Devkota N, Pandey A, Prajapati R, Ertis BA, Rutten MM, Lyon SW, Bogaard TA, Van De Giesen N (2019)Soda bottle science: citizen science monsoon precipitation monitoring in Nepal. Frontiers in Earth Science 7: 46.https://doi.org/10.3389/feart.2019.00046
Davids JC, Rutten MM, Shah RDT, Shah DN, Devkota N, Izeboud P, Pandey A, Van De Giesen N (2018) Quantifyingthe connections—linkages between land-use and water in the Kathmandu Valley, Nepal. Environmentalmonitoring and assessment 190(5): 304. https://doi.org/10.1007/s10661-018-6687-2
DHM (2019) Department of Hydrology and Meteorology (DHM), Government of Nepal, Ministry of Energy, WaterResources and Irrigation, Kathmandu.
Dhital YP and Kayastha RB (2013) Frequency analysis, causes and impacts of �ooding in the Bagmati RiverBasin, Nepal. Journal of Flood Risk Management 6(3): 253-260. https://doi.org/10.1111/jfr3.12013
Dhital YP, Tang Q, and Shi J (2013) Hydroclimatological changes in the Bagmati River basin, Nepal. Journal ofGeographical Sciences 23(4): 612-626. https://doi.org/10.1007/s11442-013-1032-8
Emmanuel I, Andrieu H, Leblois E, Flahaut B (2012) Temporal and spatial variability of rainfall at the urbanhydrological scale. Journal of hydrology 430: 162-172. https://doi.org/10.1016/j.jhydrol.2012.02.013
Ichiyanagi K, Yamanaka MD, Muraji Y, Vaidya BK (2007) Precipitation in Nepal between 1987 and 1996.International Journal of Climatology: A Journal of the Royal Meteorological Society 27(13): 1753-1762.https://doi.org/10.1002/joc.1492
Karki R (2015) A Study of Daily Rainfall Pattern and Its Changes in Kathmandu Valley Nepal during SummerMonsoon Season. Department of Hydrology and Meteorology, Nepal.
Page 12/21
Karki R, Schickhoff U, Scholten T, Böhner J (2017) Rising precipitation extremes across Nepal. Climate 5(1): 4.https://doi.org/10.3390/cli5010004
Karki R, Talchabhadel R, Aalto J, Baidya SK (2016) New climatic classi�cation of Nepal. Theoretical and AppliedClimatology 125: 799–808. https://doi.org/10.1007/s00704-015-1549-0
Kendall MG (1975) Rank correlation methods.
Khatiwada KR, Panthi J, Shrestha ML, and Nepal S (2016) Hydro-climatic variability in the Karnali River basin ofNepal Himalaya. Climate 4(2): 17. https://doi.org/10.3390/cli4020017
Mann HB (1945) Nonparametric tests against trend. Econometrica: Journal of the Econometric Society 13(3):245-259. https://doi.org/10.2307/1907187
Ngongondo C, Xu CY, Gottschalk L, Alemaw B (2011) Evaluation of spatial and temporal characteristics of rainfallin Malawi: a case of data scarce region. Theoretical and applied climatology 106(1-2): 79-93.https://doi.org/10.1007/s00704-011-0413-0
Panthi J, Dahal P, Shrestha M, Aryal S, Krakauer N, Pradhanang S, Lakhankar T, Jha A, Sharma M, Karki R (2015)Spatial and temporal variability of rainfall in the Gandaki River Basin of Nepal Himalaya. Climate 3(1): 210-226.https://doi.org/10.3390/cli3010210
Pokharel AK and Hallett J (2015) Distribution of rainfall intensity during the summer monsoon season overKathmandu, Nepal. Weather 70(9). https://doi.org/10.1002/wea.2544
Shankar K and Shrestha PB (1985) Climate. In: Nepal – Nature’s Paradise: Insight into diverse facets ofTopography, �ora and ecology (Ed. TC. Majupuria), White Lotus Co.Ltd, Bangkok, pp. 39-44.
Sharma RH and Shakya NM (2006) Hydrological changes and its impact on water resources of Bagmatiwatershed, Nepal. Journal of Hydrology 327(3-4): 315-322. https://doi.org/10.1016/j.jhydrol.2005.11.051
Shrestha AB and Aryal R (2010) Climate change in Nepal and its impact on Himalayan glaciers. RegionalEnvironment Change 11: 65-77. https://doi.org/10.1007/s10113-010-0174-9
Shrestha S, Pradhananga D, Pandey VP (2012) Kathmandu Valley Groundwater Outlook. Asian Institute ofTechnology (AIT), The Small Earth Nepal (SEN), Center of Research for Environment Energy and Water (CREEW),International Research Center for River Basin Environment-University of Yamanashi (ICRE-UY), Kathmandu, Nepal.
Shrestha S, Semkuyu DK, Pandey VP (2016) Assessment of groundwater vulnerability and risk to pollution inKathmandu Valley, Nepal. Science of the Total Environment 556: 23-35.https://doi.org/10.1016/j.scitotenv.2016.03.021
Shrestha RM and Sthapit AB (2015) Temporal variation of rainfall in the Bagmati River basin, Nepal. NepalJournal of Science and Technology, 16(1), 31-40. https://doi.org/10.3126/njst.v16i1.14355
Sigdel M and Ikeda M (2012) Seasonal contrast in precipitation mechanisms over Nepal deduced fromrelationship with the large-scale climate patterns. Nepal Journal of Science and Technology 13(1): 115-123.https://doi.org/10.3126/njst.v13i1.7450

Page 13/21
Talchabhadel R, Aryal A, Kawaike K, Yamanoi K, Nakagawa H, Bhatta B, Karki S, Thapa BR (2021). Evaluation ofprecipitation elasticity using precipitation data from ground and satellite-based estimates and watershedmodeling in Western Nepal. Journal of Hydrology: Regional Studies.;33:100768.
Talchabhadel R, Karki R, Thapa BR, Maharjan M, Parajuli B (2018a) Spatio-Temporal Variability of ExtremePrecipitation in Nepal. International Journal of Climatology 38: 4296–4313. https://doi.org/10.1002/joc.5669
Talchabhadel R, Nakagawa H, Kawaike K (2018b) Spatial and temporal variability of precipitation inSouthwestern Bangladesh. Journal of Japanese Society of Civil Engineers, Ser B1 (Hydraulic Engineering) 74(5):289-294. https://doi.org/10.2208/jscejhe.74.5_I_289
Thapa BR, Ishidaira H, Pandey VP, Shakya NM (2017) A multi-model approach for analyzing water balancedynamics in Kathmandu Valley, Nepal. Journal of Hydrology: Regional Studies 9: 149-162.https://doi.org/10.1016/j.ejrh.2016.12.080
Tuladhar D, Dewan A, Kuhn M, Corner RJ (2020) Spatio-temporal rainfall variability in the Himalayan mountaincatchment of the Bagmati River in Nepal. Theoretical and Applied Climatology 139(1): 599-614.https://doi.org/10.1007/s00704-019-02985-8
Wong CL, Venneker R, Uhlenbrook S, Jamil ABM, Zhou Y (2009) Variability of rainfall in Peninsular Malaysia.Hydrology and Earth System Sciences Discussions 6(4): 5471-5503. https://doi.org/10.5194/hessd-6-5471-2009
TablesTable 1
Summary information on rainfall stations used in the study
S.N. Stationname
IndexNo.
Type of station District Long. Lat. Elevation(m)
InstallationYear
1 Thankot 1015 Precipitation Kathmandu 85.2 27.68 1630 1967
2 Sankhu 1035 Precipitation Kathmandu 85.48 27.75 1449 1971
3 Bhaktapur 1052 Precipitation Bhaktapur 85.42 27.67 1330 1971
4 Godavari 1022 Precipitation Lalitpur 85.4 27.58 1400 1953
5 KathmanduAirport
1030 Aeronautical Kathmandu 85.37 27.7 1337 1968
6 Khumaltar 1029 Agrometeorology Lalitpur 85.33 27.67 1350 1967
7 Panipokhari 1039 Climatology Kathmandu 85.33 27.73 1335 1971

Page 14/21
Table 2Classi�cation of rainfall rate based on rainfall amount
per day (mm)
Rainfall rate class Rainfall amount per day (mm)
A 0.1–10
B 10–50
C 50–100
D 100–150
E > 150
Figures
Figure 1

Page 15/21
Kathmandu Valley Watershed with SRTM DEM at 30-meter resolution and rainfall stations of Department ofHydrology and Meteorology, Nepal. Note: The designations employed and the presentation of the material on thismap do not imply the expression of any opinion whatsoever on the part of Research Square concerning the legalstatus of any country, territory, city or area or of its authorities, or concerning the delimitation of its frontiers orboundaries. This map has been provided by the authors.
Figure 2
Contribution of rainfall frequency (%) and cumulative rainfall (%) for various classes of rainfall rate at differentstation locations, a) Thankot, b) Sankhu, c) Bhaktapur, d) Godavari, e) Kathmandu airport, f) Khumaltar, g)

Page 16/21
Panipokhari, and h) areal average across the Kathmandu valley (The areal average value was computed usingThiessen weightage method). A description of different classes is shown in Table 2
Figure 3
Box plot showing medians, �rst and third quartiles, and spatial distributions of annual rainfall (mm) distributedacross the study area. We show temporal variation of annual precipitation for the period of 1971 – 2015

Page 17/21
Figure 4
Annual and seasonal rainfall distribution in different time periods. Note: The designations employed and thepresentation of the material on this map do not imply the expression of any opinion whatsoever on the part ofResearch Square concerning the legal status of any country, territory, city or area or of its authorities, orconcerning the delimitation of its frontiers or boundaries. This map has been provided by the authors.

Page 18/21
Figure 5
Line plots of temporal distribution (1971-2015) of a) Dry Days (DD: blue) and Maximum Consecutive Dry Days(MCDD: orange), b) Local Rainfall Days (LRD: blue) and Valley-wide Rainfall Days (VRD: orange), c) MaximumConsecutive Local Rainfall Days (MCLRD: blue) and Maximum Consecutive Valley-wide Rainfall Days (MCVRD:orange), and d) Local Rainfall Index (LRI: blue) and Valley-wide Rainfall Index (VRI: orange)

Page 19/21
Figure 6
Station-wise trends for rainfall frequency, and rainfall amount for (a) Annual rainfall, (b) Rainfall class ‘A’, (c)Rainfall class ‘B’, (d) Rainfall class ‘C’, and (e) Rainfall class ‘D’ over the period of 1971–2015 (signi�cance at0.1). The unit of trend is mm/year and count/year for rainfall amount and rainfall frequency respectively. Note:The designations employed and the presentation of the material on this map do not imply the expression of anyopinion whatsoever on the part of Research Square concerning the legal status of any country, territory, city orarea or of its authorities, or concerning the delimitation of its frontiers or boundaries. This map has been providedby the authors.

Page 20/21
Figure 7
Spatial distribution of long-term seasonal rainfall trend at stations in the Kathmandu valley over the period of1971–2015 (signi�cance at 0.1). The unit of rainfall trend is mm/year. Note: The designations employed and thepresentation of the material on this map do not imply the expression of any opinion whatsoever on the part ofResearch Square concerning the legal status of any country, territory, city or area or of its authorities, orconcerning the delimitation of its frontiers or boundaries. This map has been provided by the authors.

Page 21/21
Figure 8
Annual and seasonal rainfall distribution in different time periods (1986-2015) for the Bagmati River Basin. Note:The designations employed and the presentation of the material on this map do not imply the expression of anyopinion whatsoever on the part of Research Square concerning the legal status of any country, territory, city orarea or of its authorities, or concerning the delimitation of its frontiers or boundaries. This map has been providedby the authors.


![[Urban Management Program City Paper : Kathmandu, Nepal]](https://img.pdfslide.net/doc/110x75/55862592d8b42a4c578b4630/urban-management-program-city-paper-kathmandu-nepal.jpg)


![[Waterworks] City Presentation - Kathmandu(Nepal)](https://img.pdfslide.net/doc/110x75/557c65b1d8b42a757c8b50e4/waterworks-city-presentation-kathmandunepal.jpg)