Embed Size (px)
Citation preview
NERC Load Modeling ActivitiesRyan D. Quint, PhD, PESenior Engineer, System Analysis, NERCMRO Fall Reliability ConferenceNovember 2016
RELIABILITY | ACCOUNTABILITY2
Introduction
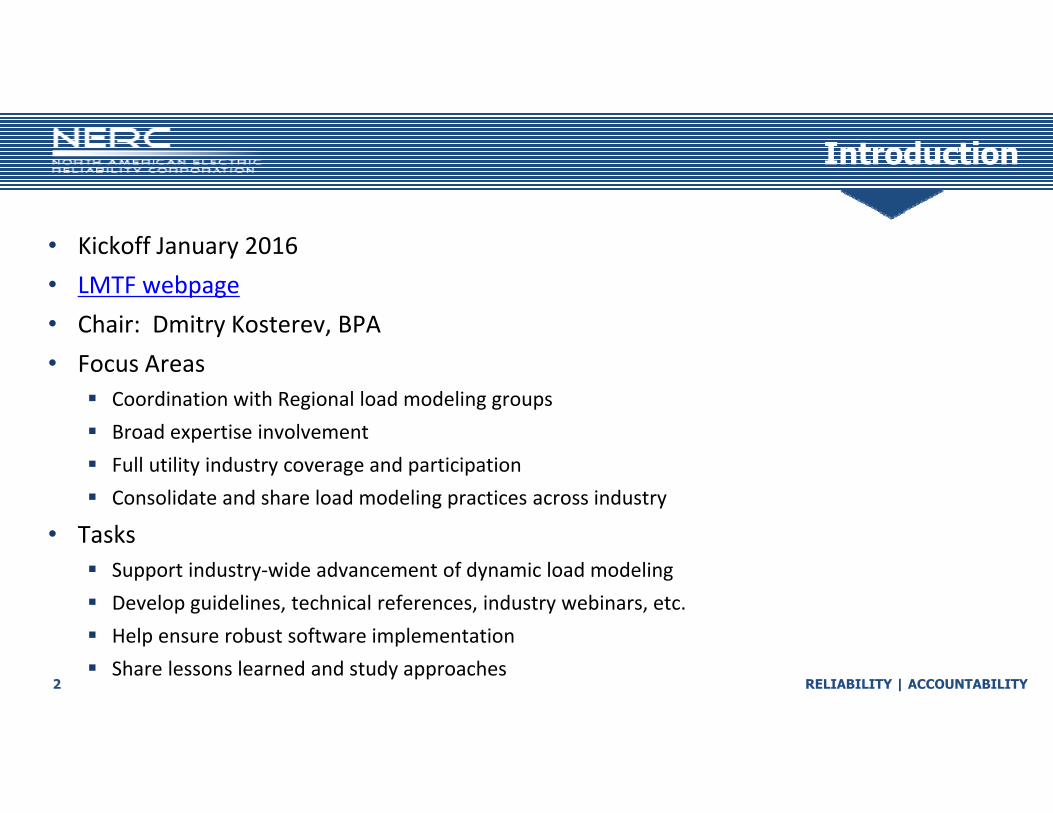
• Kickoff January 2016• LMTF webpage• Chair: Dmitry Kosterev, BPA• Focus Areas
Coordination with Regional load modeling groups Broad expertise involvement Full utility industry coverage and participation Consolidate and share load modeling practices across industry
• Tasks Support industry‐wide advancement of dynamic load modeling Develop guidelines, technical references, industry webinars, etc. Help ensure robust software implementation Share lessons learned and study approaches

RELIABILITY | ACCOUNTABILITY3
History & Background
Why is this important?How did we get to where we are today?
RELIABILITY | ACCOUNTABILITY4
Why Dynamic Load Modeling?
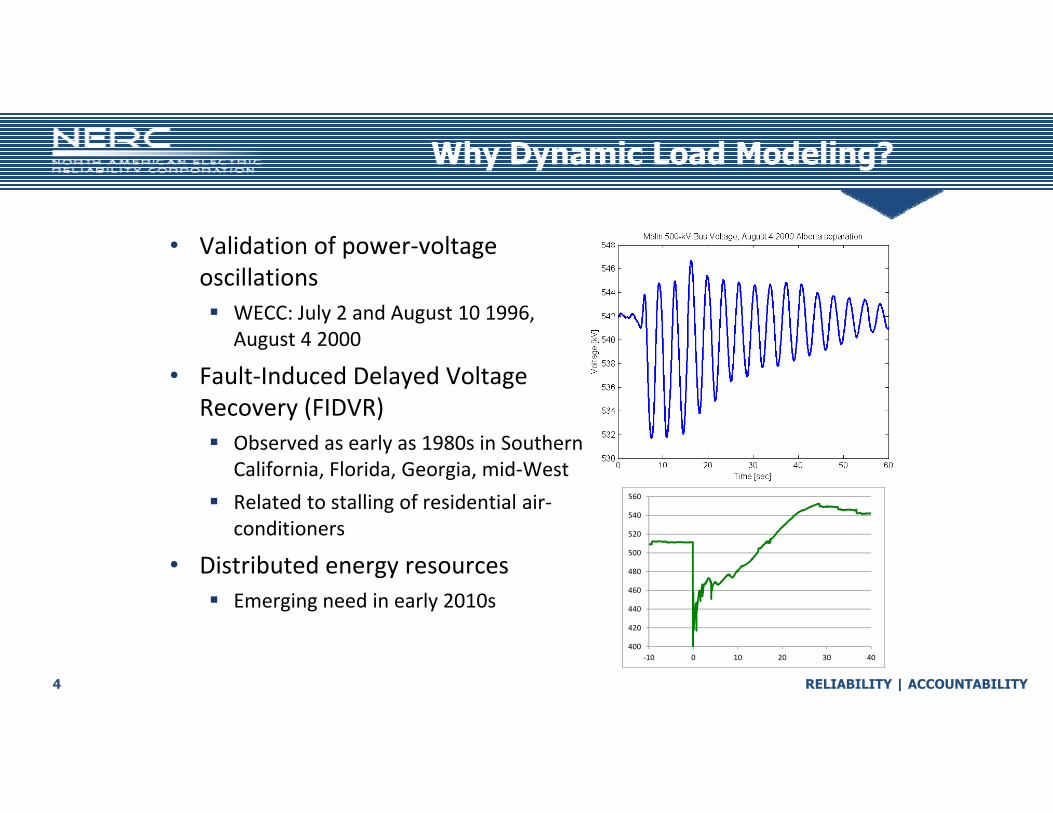
• Validation of power‐voltage oscillations WECC: July 2 and August 10 1996,
August 4 2000
• Fault‐Induced Delayed Voltage Recovery (FIDVR) Observed as early as 1980s in Southern
California, Florida, Georgia, mid‐West Related to stalling of residential air‐
conditioners
• Distributed energy resources Emerging need in early 2010s
400
420
440
460
480
500
520
540
560
‐10 0 10 20 30 40
RELIABILITY | ACCOUNTABILITY5
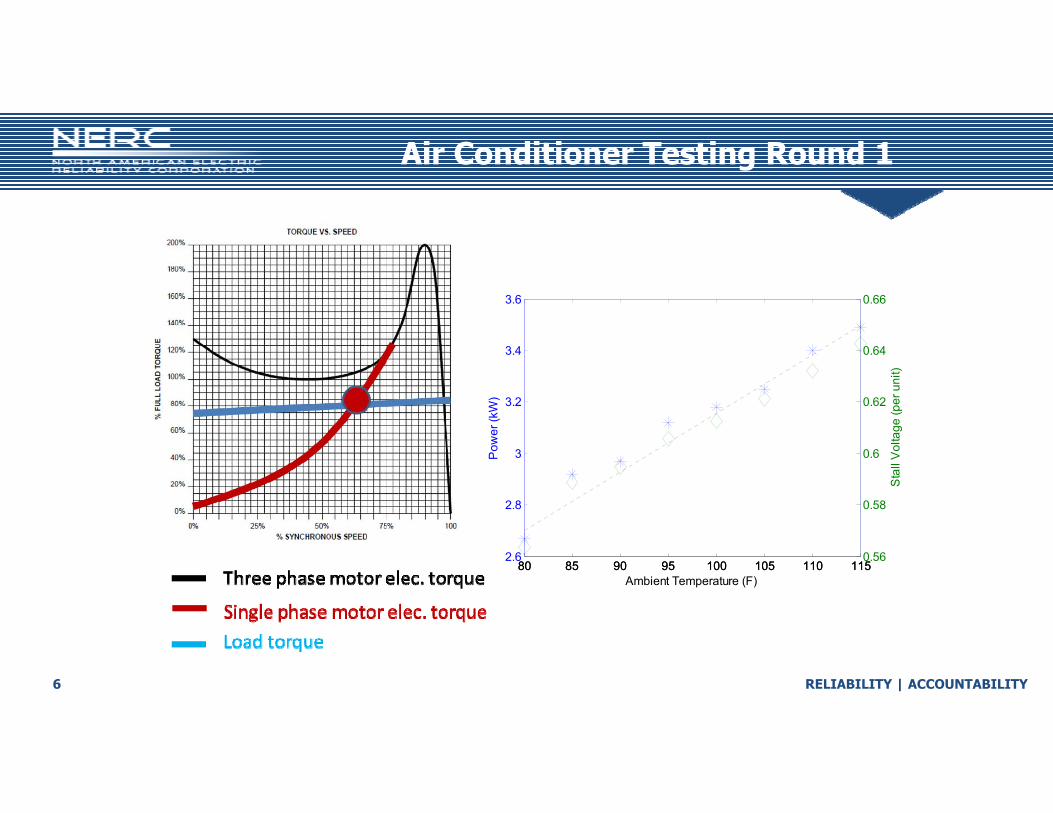
Air Conditioner Testing Round 1
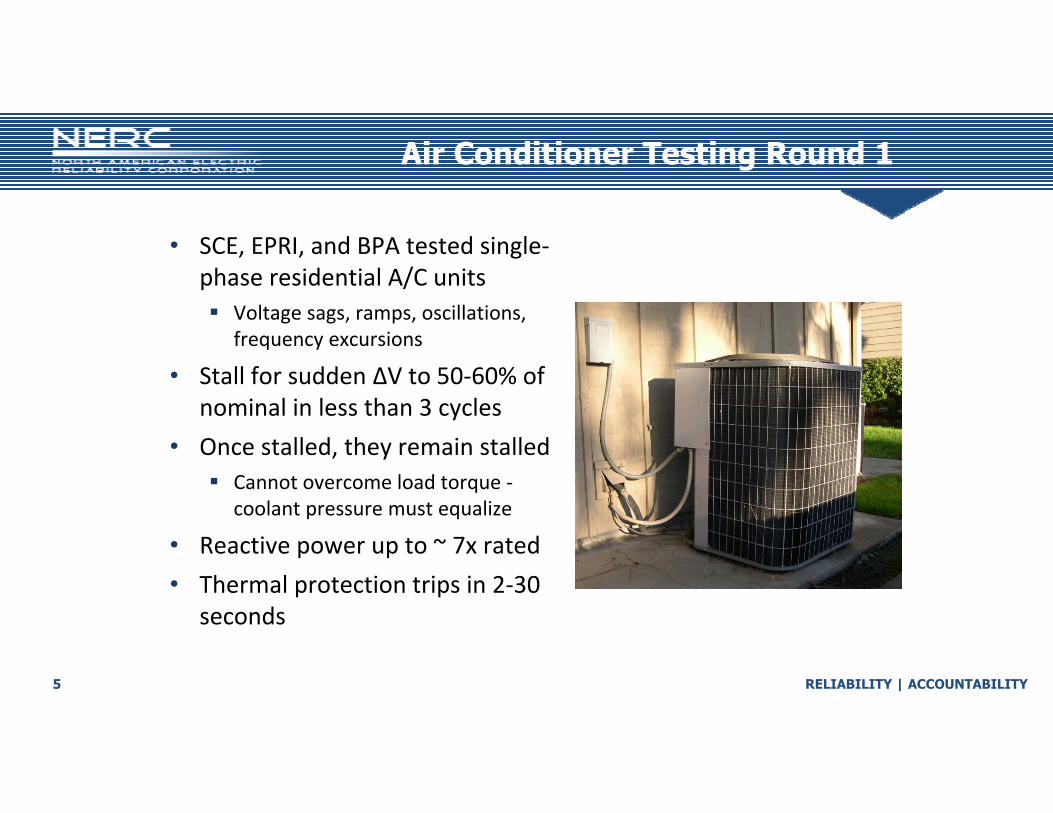
• SCE, EPRI, and BPA tested single‐phase residential A/C units Voltage sags, ramps, oscillations,
frequency excursions
• Stall for sudden ΔV to 50‐60% of nominal in less than 3 cycles
• Once stalled, they remain stalled Cannot overcome load torque ‐
coolant pressure must equalize
• Reactive power up to ~ 7x rated• Thermal protection trips in 2‐30
seconds
RELIABILITY | ACCOUNTABILITY6
Air Conditioner Testing Round 1
80 85 90 95 100 105 110 1152.6
2.8
3
3.2
3.4
3.6
Pow
er (k
W)
Ambient Temperature (F)80 85 90 95 100 105 110 115
0.56
0.58
0.6
0.62
0.64
0.66
Sta
ll V
olta
ge (p
er u
nit)
RELIABILITY | ACCOUNTABILITY7
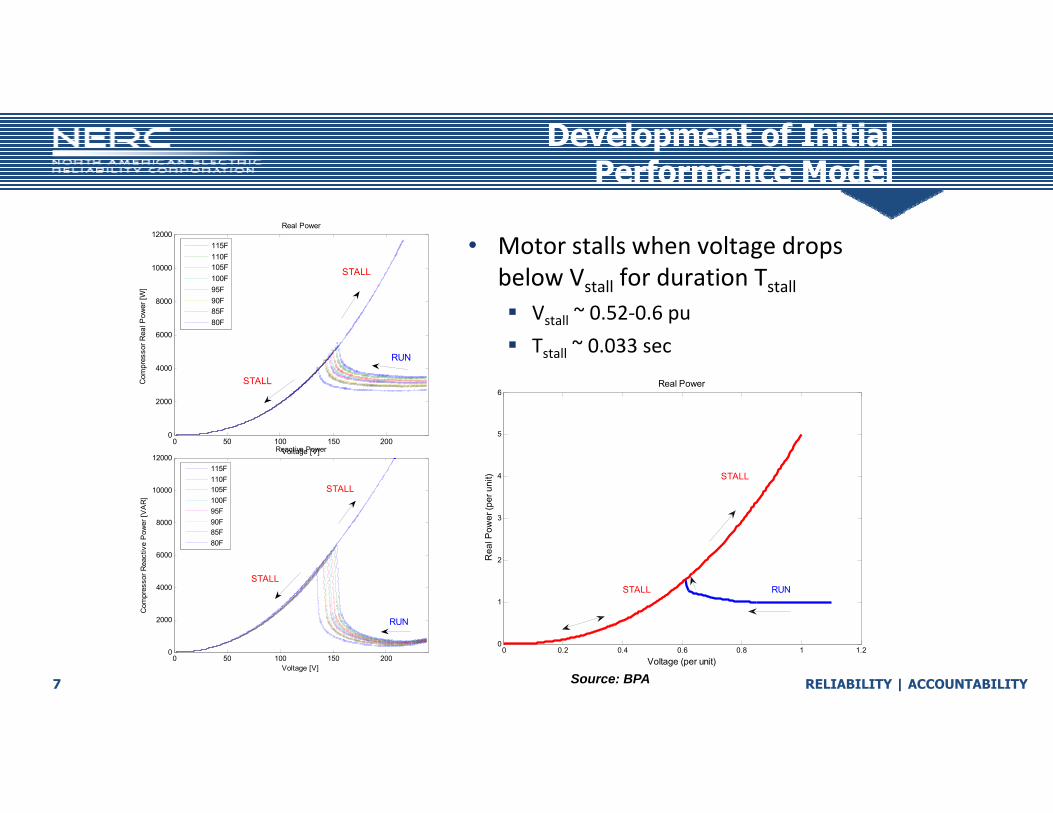
Development of Initial Performance Model
• Motor stalls when voltage drops below Vstall for duration Tstall Vstall ~ 0.52‐0.6 pu Tstall ~ 0.033 sec
0 50 100 150 2000
2000
4000
6000
8000
10000
12000
Voltage [V]
Com
pres
sor R
eal P
ower
[W]
Real Power
RUN
STALL
STALL
115F110F105F100F95F90F85F80F
0 50 100 150 2000
2000
4000
6000
8000
10000
12000
Voltage [V]
Com
pres
sor R
eact
ive
Pow
er [V
AR
]
Reactive Power
RUN
STALL
STALL
115F110F105F100F95F90F85F80F
0 0.2 0.4 0.6 0.8 1 1.20
1
2
3
4
5
6Real Power
Rea
l Pow
er (p
er u
nit)
Voltage (per unit)
RUNSTALL
STALL
Source: BPA
RELIABILITY | ACCOUNTABILITY8
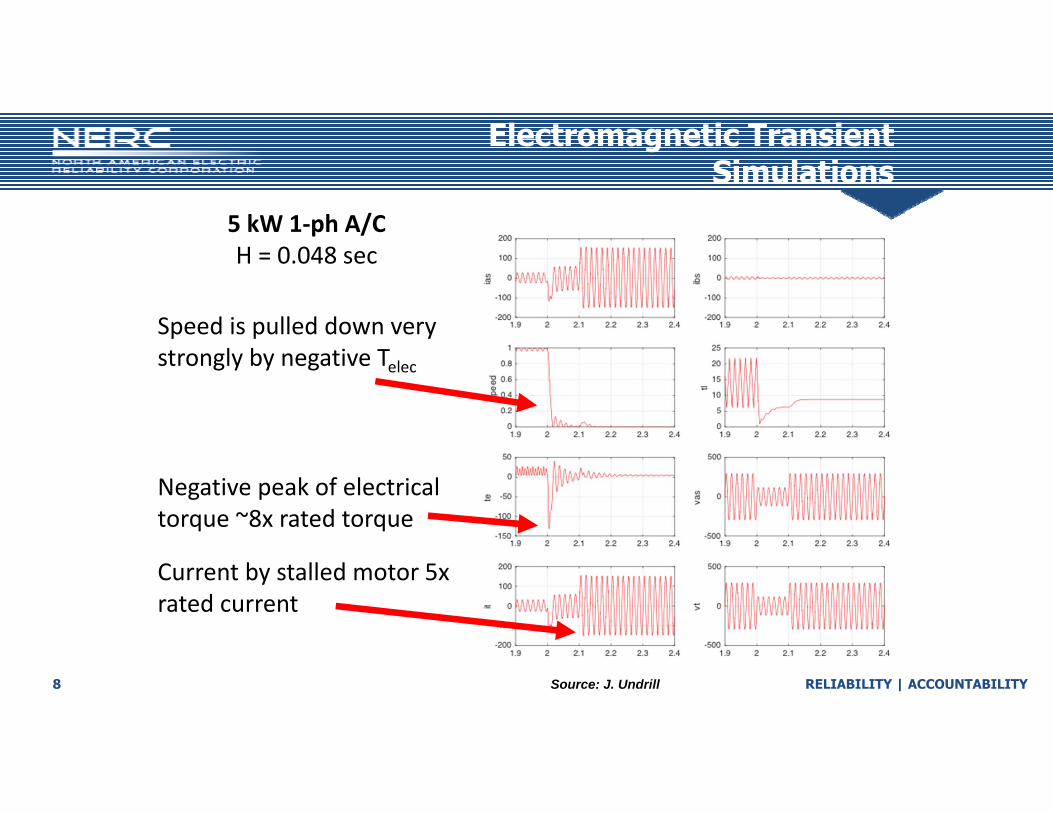
Electromagnetic Transient Simulations
Negative peak of electrical torque ~8x rated torque
Speed is pulled down very strongly by negative Telec
Current by stalled motor 5x rated current
5 kW 1‐ph A/CH = 0.048 sec
Source: J. Undrill

RELIABILITY | ACCOUNTABILITY9
Electromagnetic Transient Simulations
Negative peak of electrical torque ~1‐2x rated torque
Speed minimally pulled down by negative Telec
Current returns to near rated current
100 kVA 3‐ph MotorH = 0.3 sec
Source: J. Undrill
RELIABILITY | ACCOUNTABILITY10
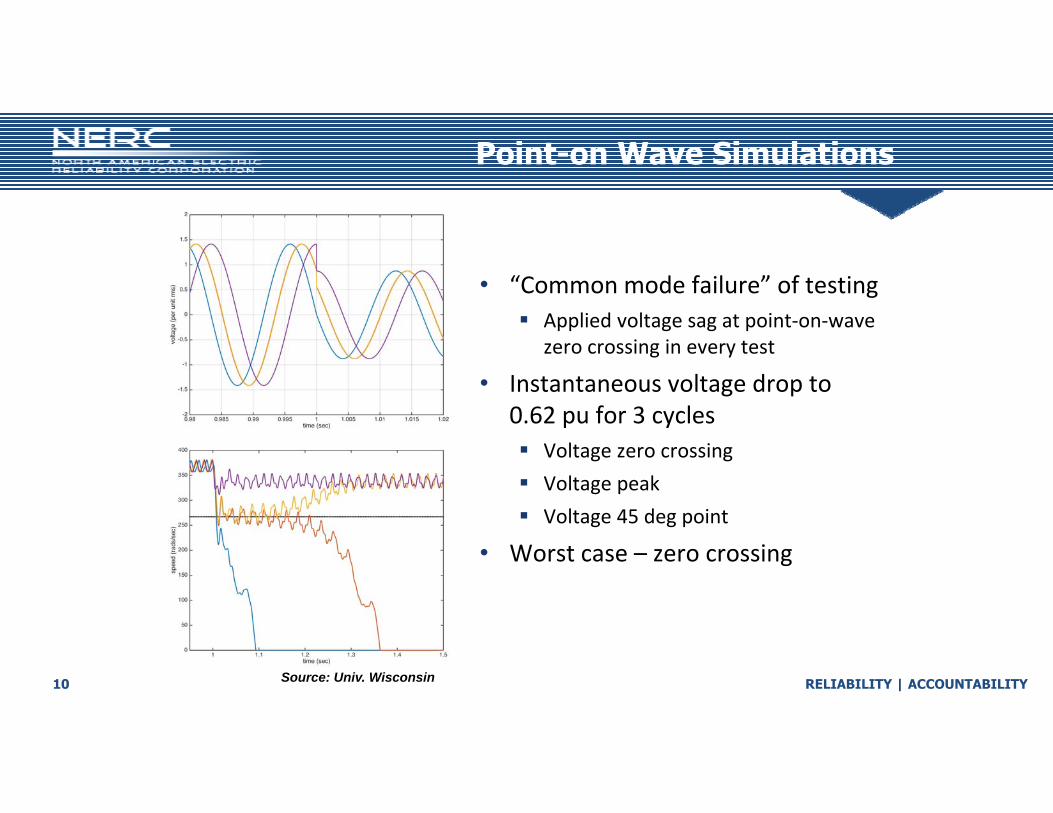
Point-on Wave Simulations
• “Common mode failure” of testing Applied voltage sag at point‐on‐wave
zero crossing in every test
• Instantaneous voltage drop to 0.62 pu for 3 cycles Voltage zero crossing Voltage peak Voltage 45 deg point
• Worst case – zero crossing
Source: Univ. Wisconsin
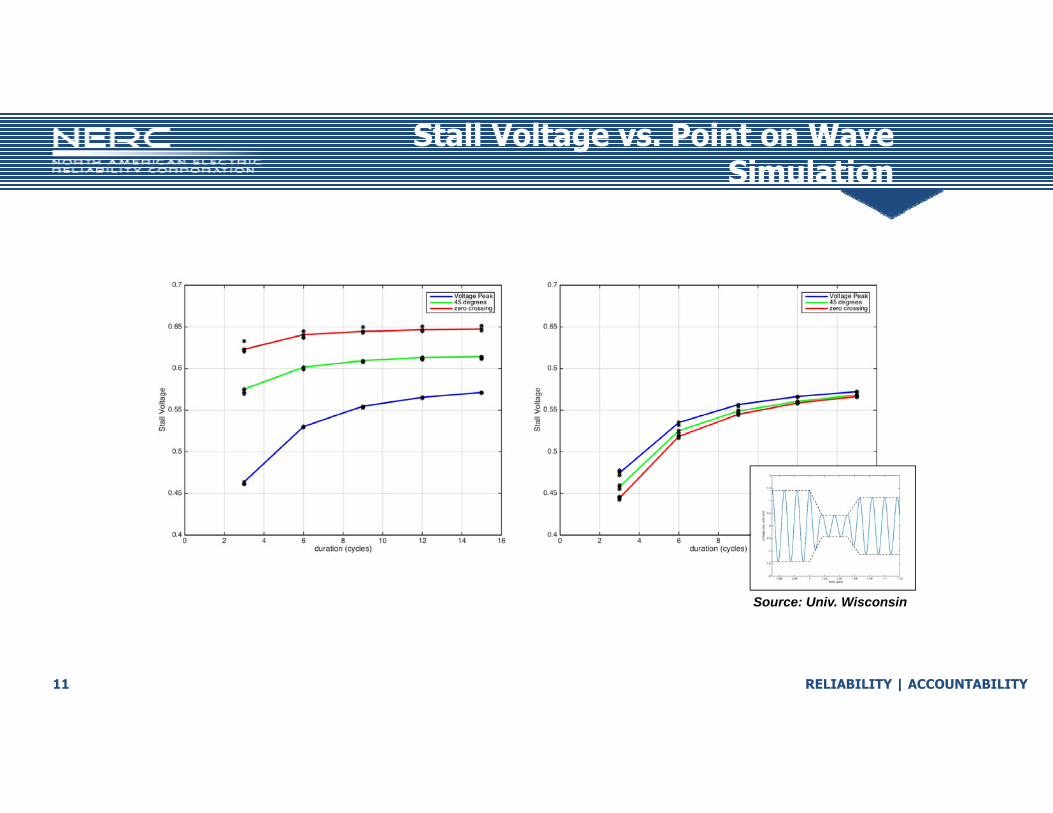
RELIABILITY | ACCOUNTABILITY11
Stall Voltage vs. Point on WaveSimulation
Source: Univ. Wisconsin
RELIABILITY | ACCOUNTABILITY12
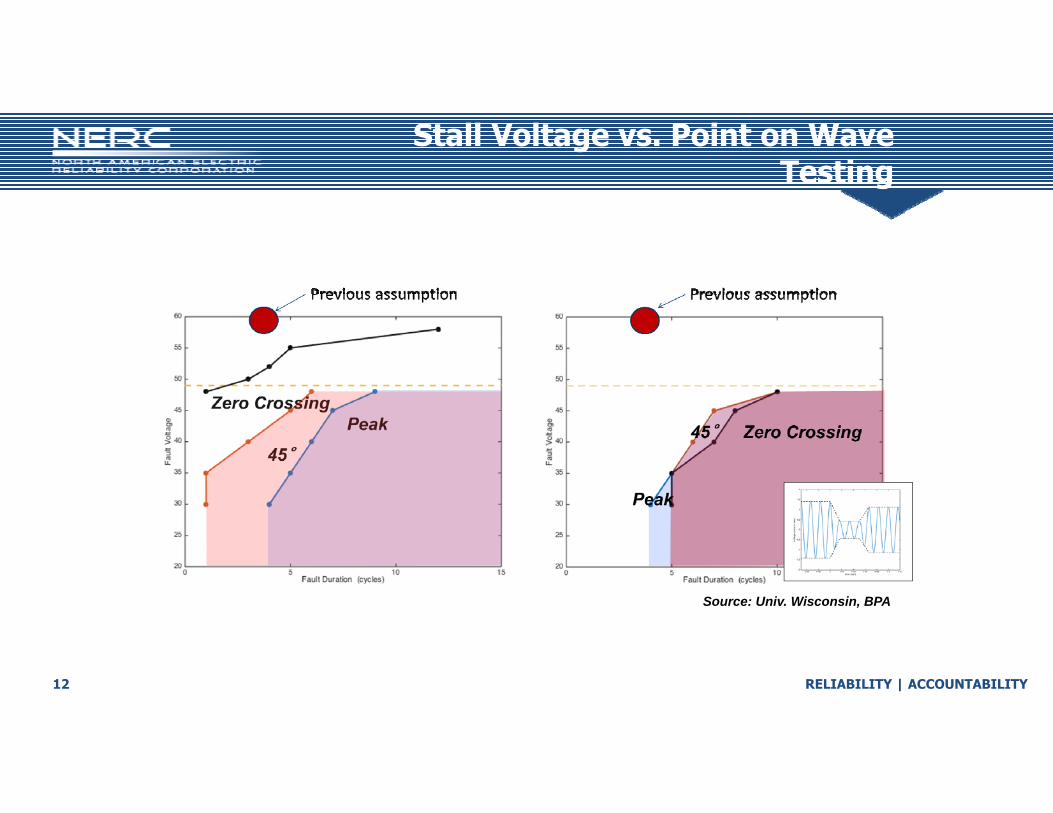
Stall Voltage vs. Point on WaveTesting
Source: Univ. Wisconsin, BPA
RELIABILITY | ACCOUNTABILITY13
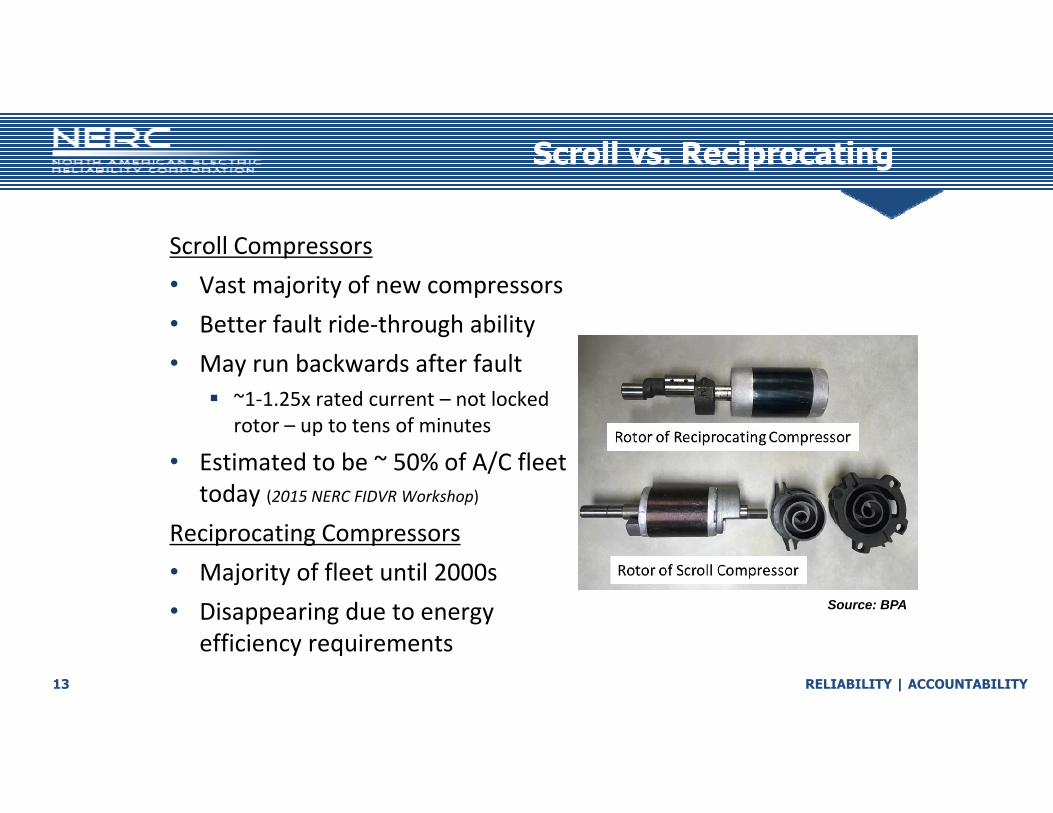
Scroll vs. Reciprocating
Scroll Compressors• Vast majority of new compressors• Better fault ride‐through ability• May run backwards after fault
~1‐1.25x rated current – not locked rotor – up to tens of minutes
• Estimated to be ~ 50% of A/C fleet today (2015 NERC FIDVR Workshop)
Reciprocating Compressors• Majority of fleet until 2000s• Disappearing due to energy
efficiency requirements
Source: BPA
RELIABILITY | ACCOUNTABILITY14
Meeting the Needs of TODAYfor Dynamic Load Modeling
Addressing issues and practiceswith the existing dynamic load models
RELIABILITY | ACCOUNTABILITY15
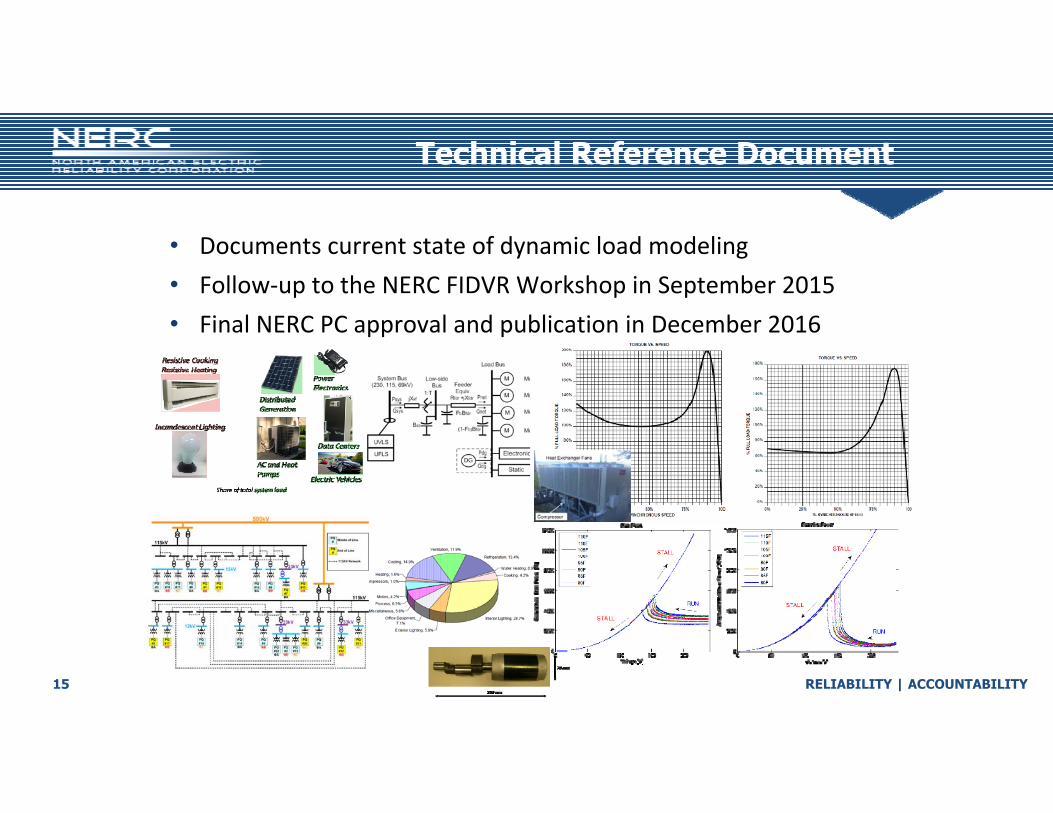
Technical Reference Document
• Documents current state of dynamic load modeling• Follow‐up to the NERC FIDVR Workshop in September 2015• Final NERC PC approval and publication in December 2016
RELIABILITY | ACCOUNTABILITY16
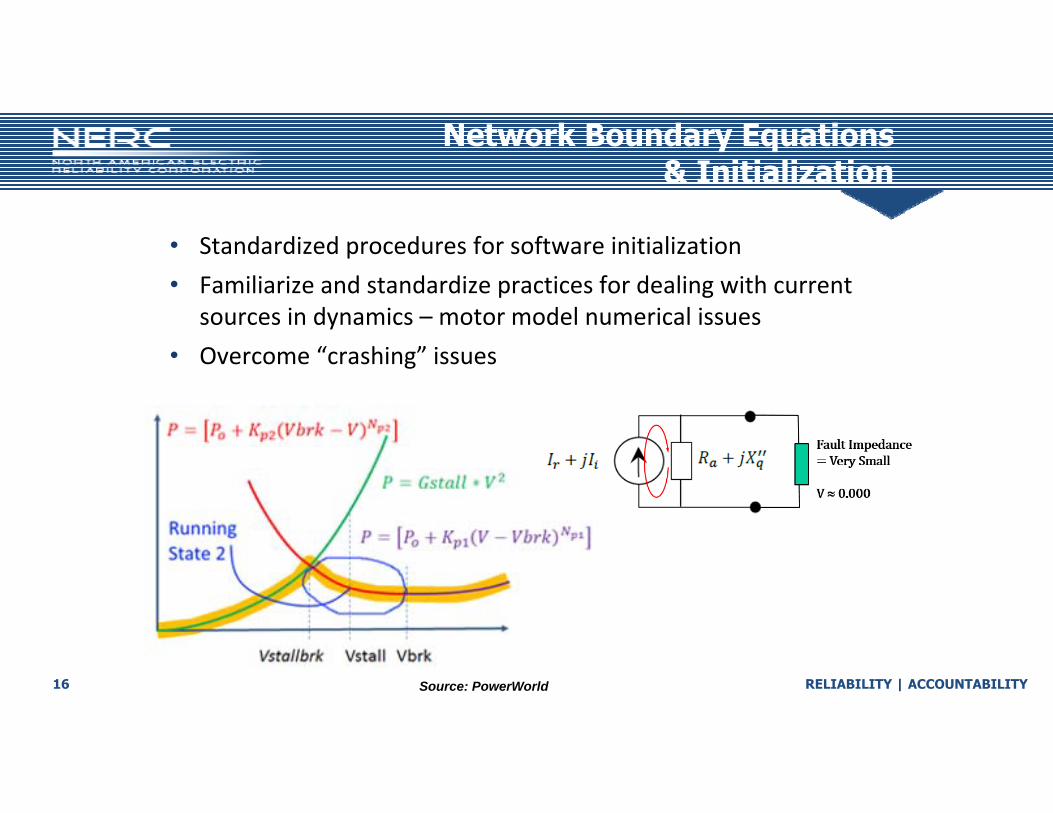
Network Boundary Equations & Initialization
Source: PowerWorld
• Standardized procedures for software initialization• Familiarize and standardize practices for dealing with current
sources in dynamics – motor model numerical issues• Overcome “crashing” issues
RELIABILITY | ACCOUNTABILITY17
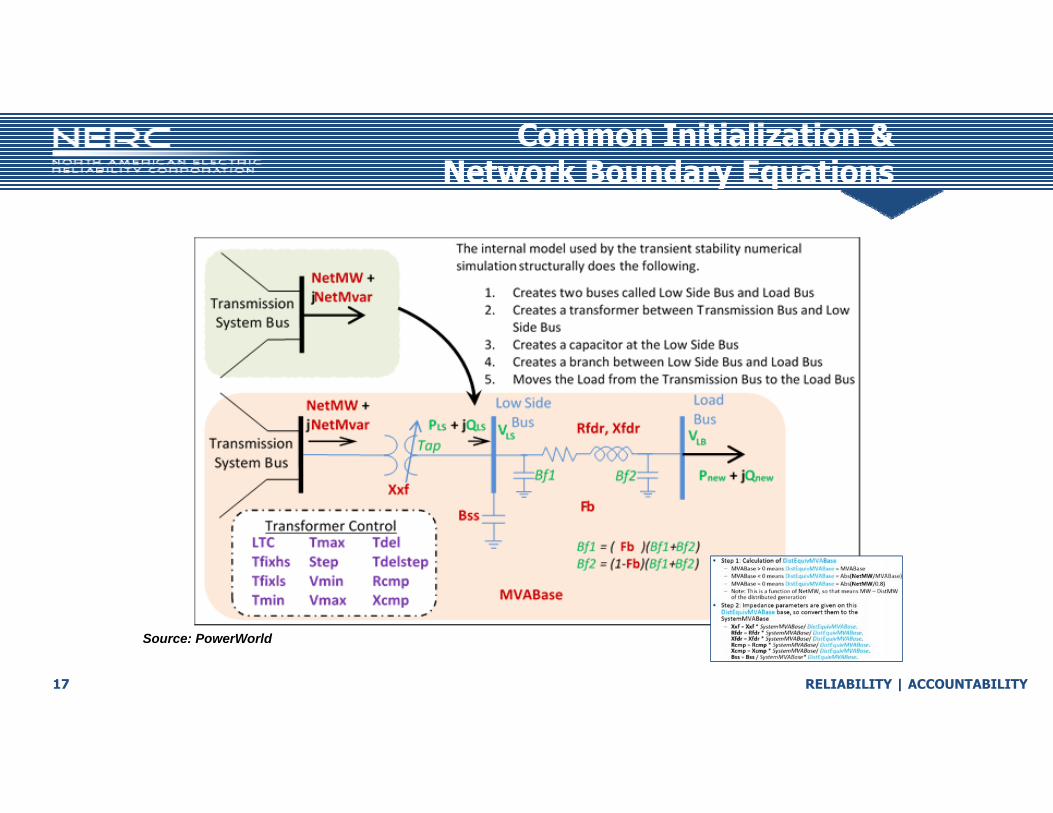
Common Initialization & Network Boundary Equations
Source: PowerWorld
RELIABILITY | ACCOUNTABILITY18
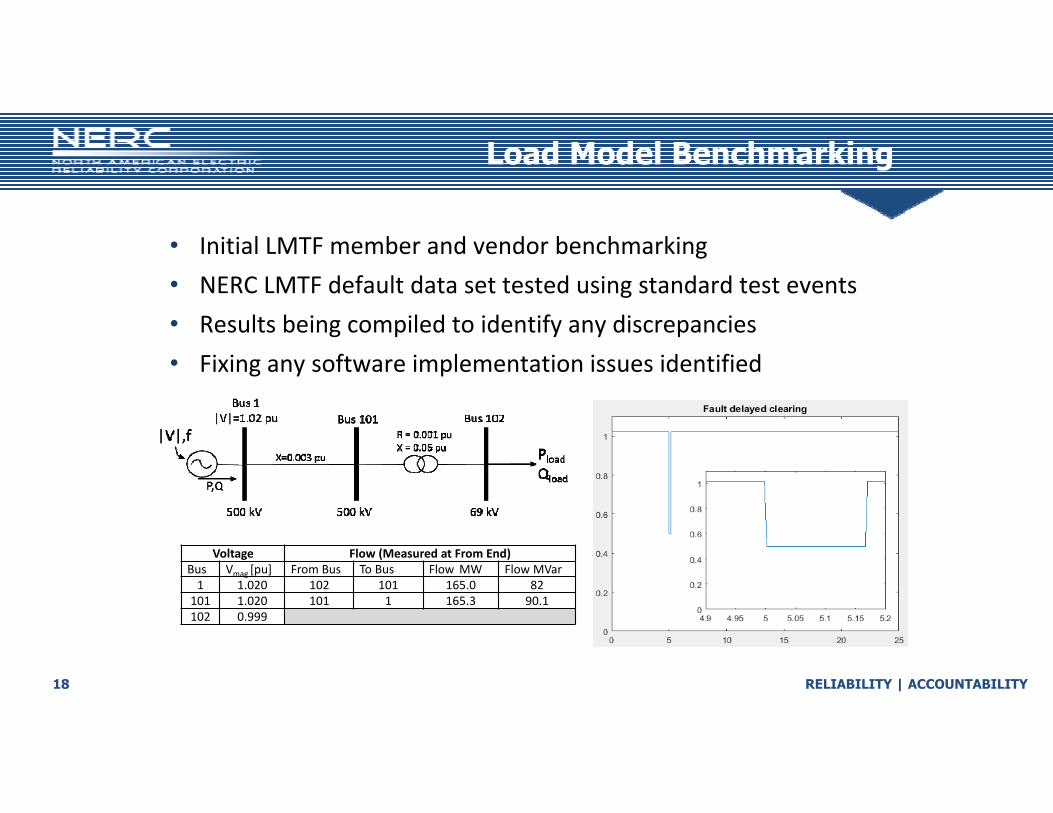
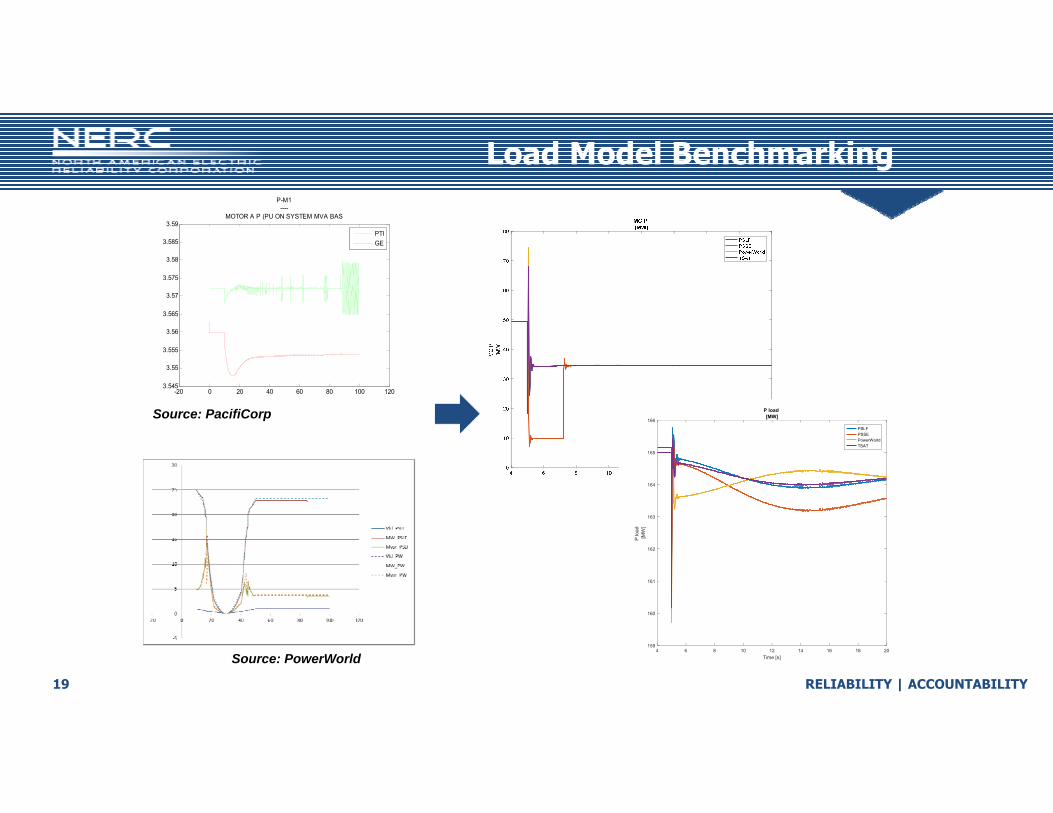
Load Model Benchmarking
• Initial LMTF member and vendor benchmarking• NERC LMTF default data set tested using standard test events• Results being compiled to identify any discrepancies• Fixing any software implementation issues identified
Voltage Flow (Measured at From End)Bus Vmag [pu] From Bus To Bus Flow MW Flow MVar1 1.020 102 101 165.0 82
101 1.020 101 1 165.3 90.1102 0.999
RELIABILITY | ACCOUNTABILITY19
Load Model Benchmarking
-20 0 20 40 60 80 100 1203.545
3.55
3.555
3.56
3.565
3.57
3.575
3.58
3.585
3.59
P-M1----
MOTOR A P (PU ON SYSTEM MVA BAS
PTIGE
Source: PacifiCorp
Source: PowerWorld4 6 8 10 12 14 16 18 20
Time [s]
159
160
161
162
163
164
165
166
P lo
ad
[MW
]
P load[MW]
PSLFPSSEPowerWorldTSAT
RELIABILITY | ACCOUNTABILITY20
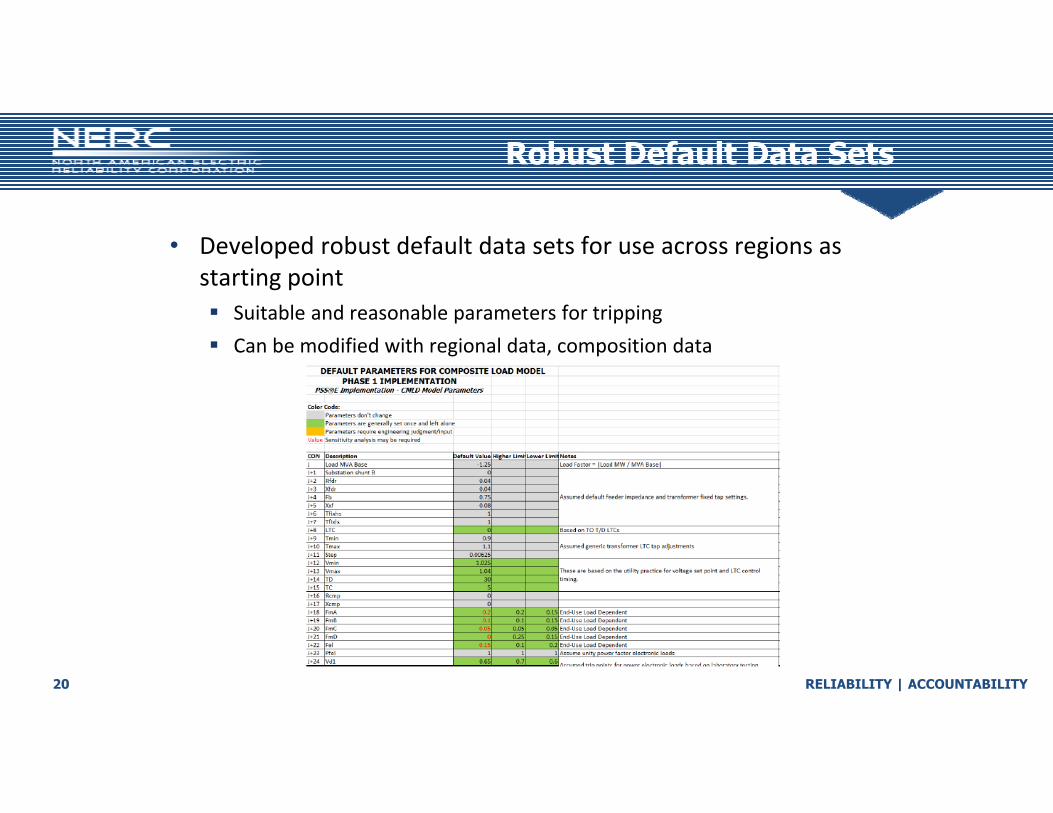
Robust Default Data Sets
• Developed robust default data sets for use across regions as starting point Suitable and reasonable parameters for tripping Can be modified with regional data, composition data
RELIABILITY | ACCOUNTABILITY21
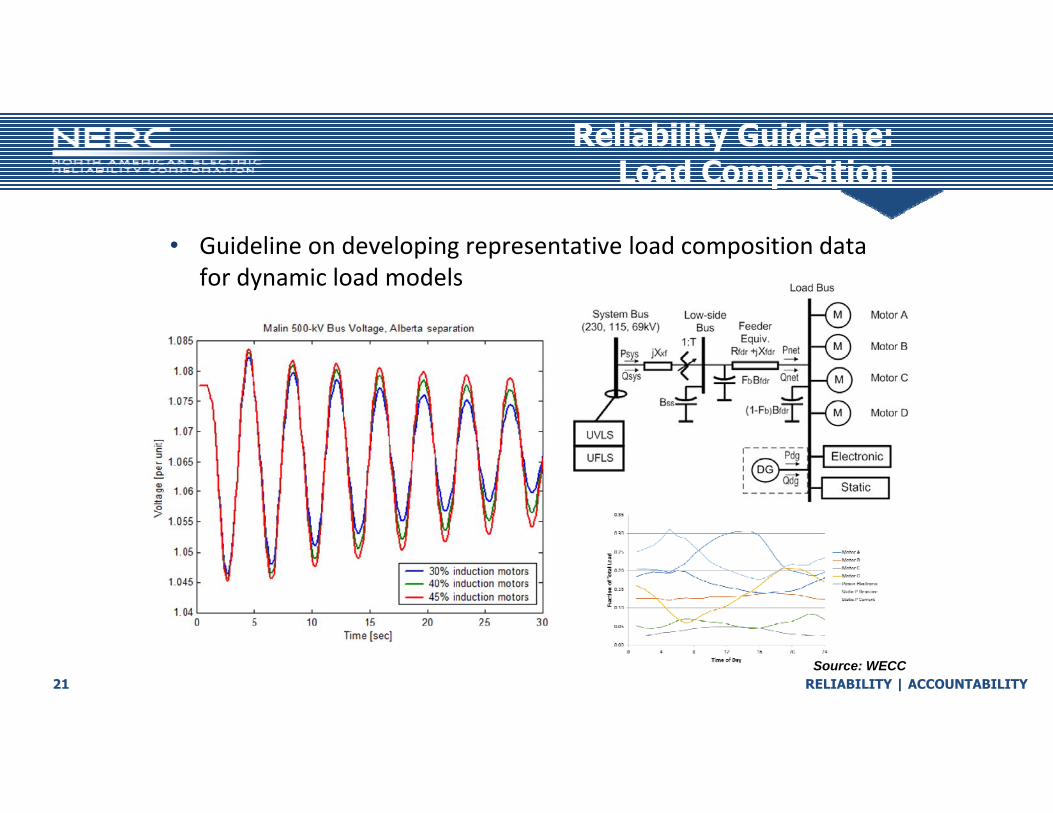
Reliability Guideline: Load Composition
• Guideline on developing representative load composition data for dynamic load models
Source: WECC
RELIABILITY | ACCOUNTABILITY22
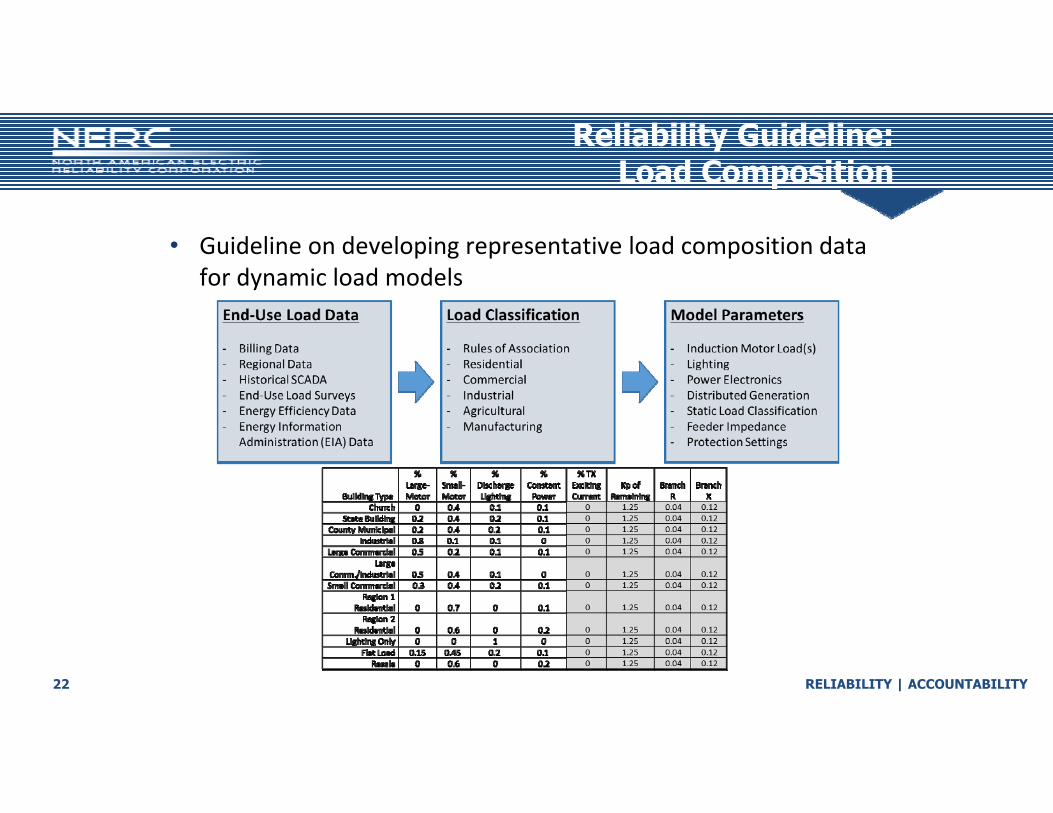
Reliability Guideline: Load Composition
• Guideline on developing representative load composition data for dynamic load models
RELIABILITY | ACCOUNTABILITY23
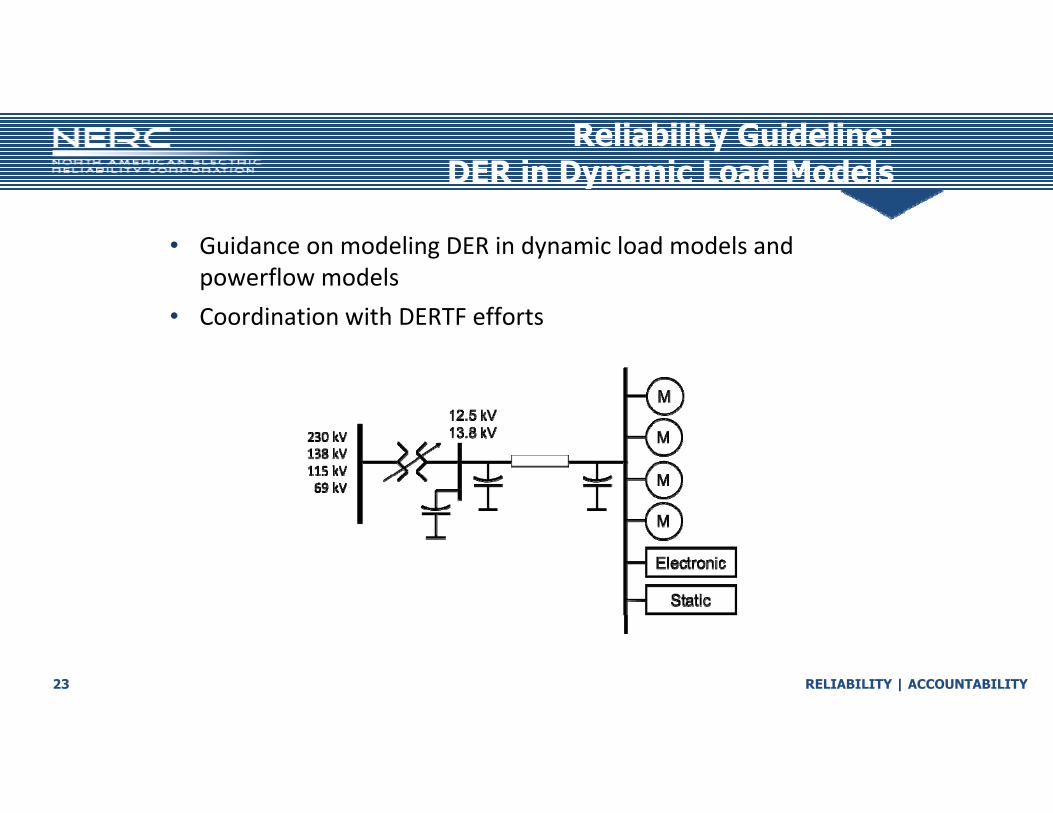
Reliability Guideline:DER in Dynamic Load Models
• Guidance on modeling DER in dynamic load models and powerflow models
• Coordination with DERTF efforts
RELIABILITY | ACCOUNTABILITY24
Reliability Guideline:DER in Dynamic Load Models
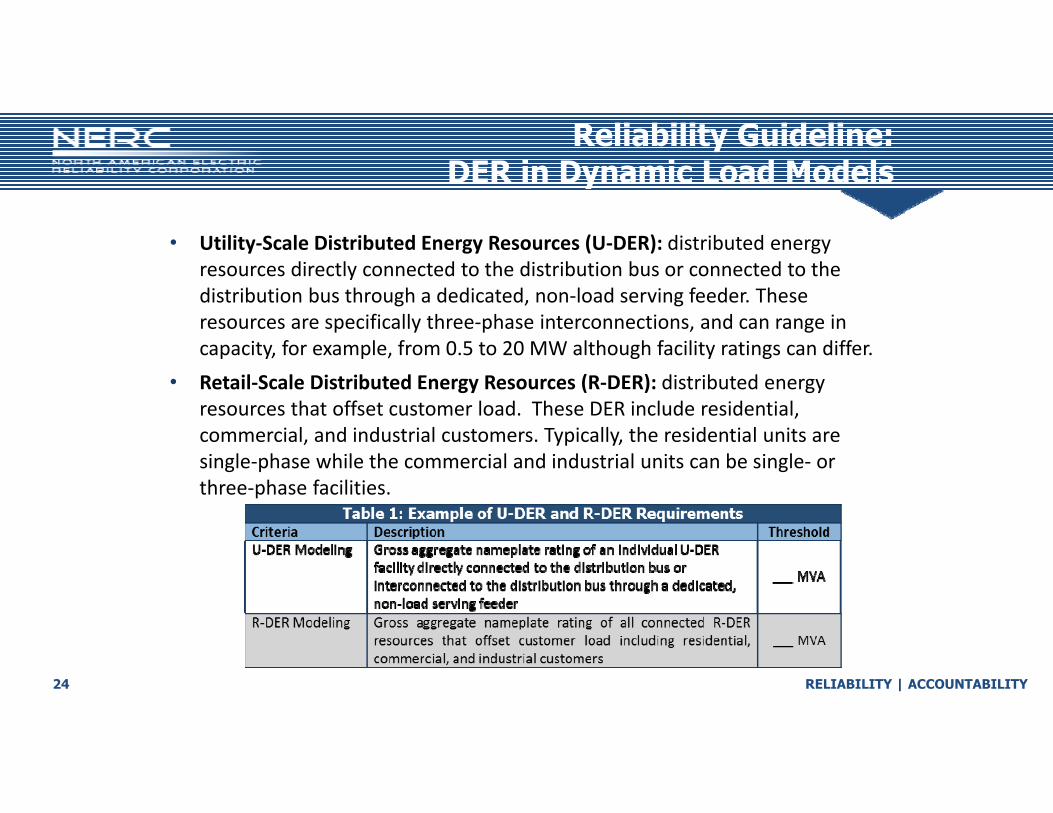
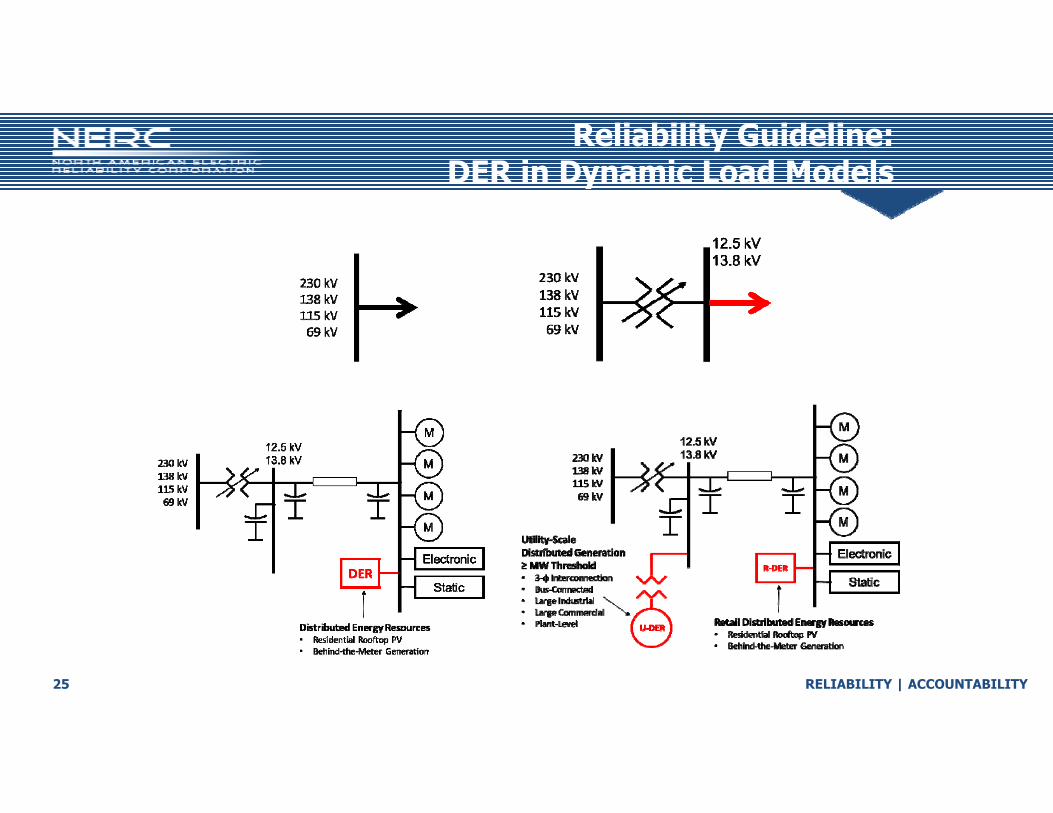
• Utility‐Scale Distributed Energy Resources (U‐DER): distributed energy resources directly connected to the distribution bus or connected to the distribution bus through a dedicated, non‐load serving feeder. These resources are specifically three‐phase interconnections, and can range in capacity, for example, from 0.5 to 20 MW although facility ratings can differ.
• Retail‐Scale Distributed Energy Resources (R‐DER): distributed energy resources that offset customer load. These DER include residential, commercial, and industrial customers. Typically, the residential units are single‐phase while the commercial and industrial units can be single‐ or three‐phase facilities.
RELIABILITY | ACCOUNTABILITY25
Reliability Guideline:DER in Dynamic Load Models
RELIABILITY | ACCOUNTABILITY26
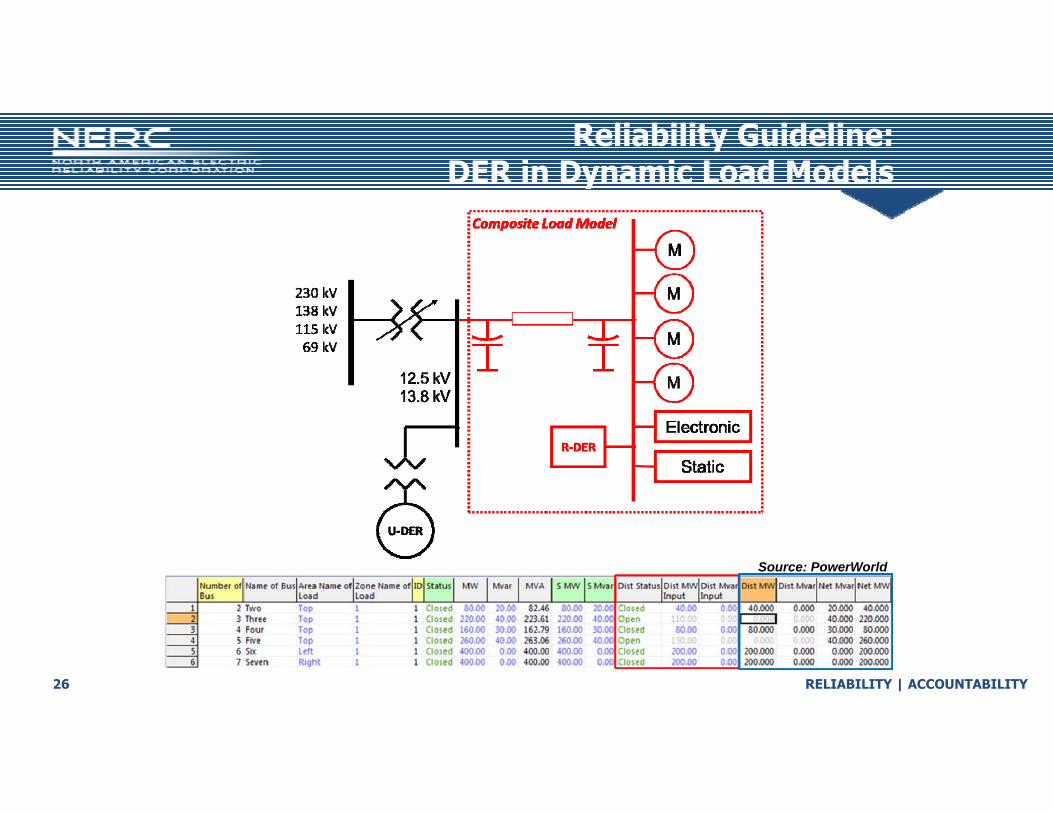
Reliability Guideline:DER in Dynamic Load Models
Source: PowerWorld
RELIABILITY | ACCOUNTABILITY27
Industry-Wide Webinar
• Broader industry engagement• Topics to cover
Fundamentals of end‐use load Composite load model Parameters and their meaning Load composition data Distributed energy resource modeling Sensitivity analysis
• December 9 – announcement to be made shortly
RELIABILITY | ACCOUNTABILITY28
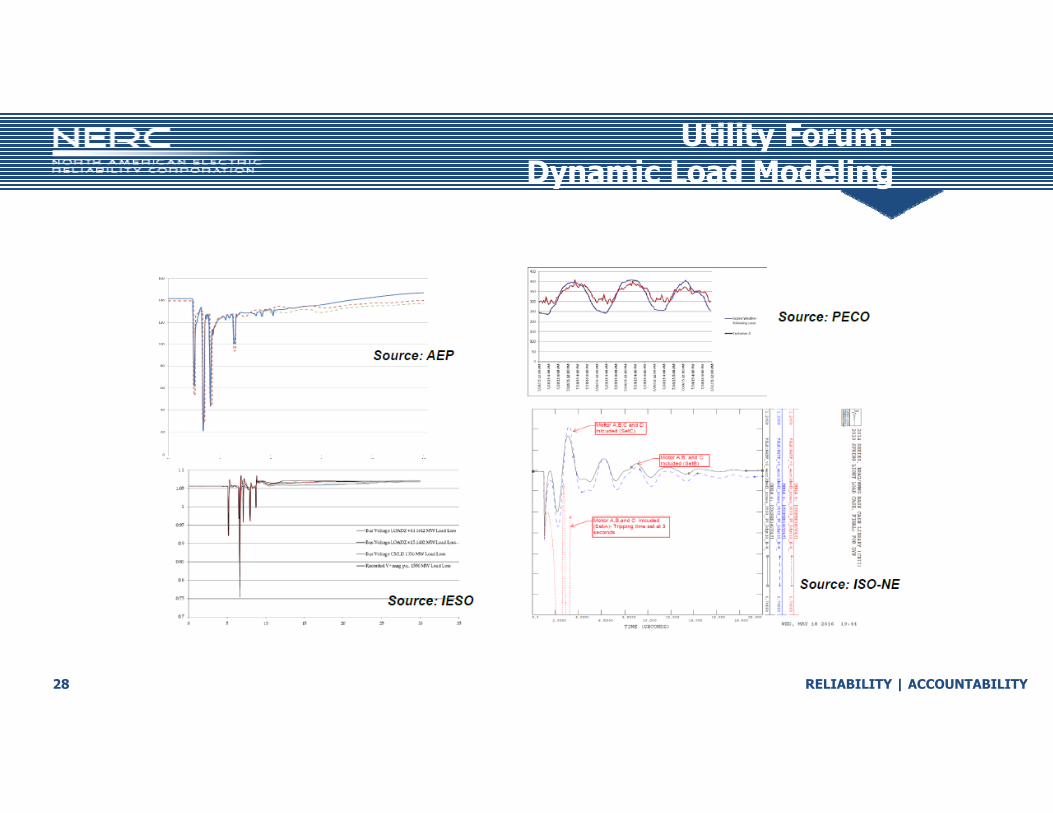
Utility Forum: Dynamic Load Modeling
RELIABILITY | ACCOUNTABILITY29
Meeting the Needs of TOMORROWfor Dynamic Load Modeling
Addressing issues and practiceswith future dynamic load models
RELIABILITY | ACCOUNTABILITY30
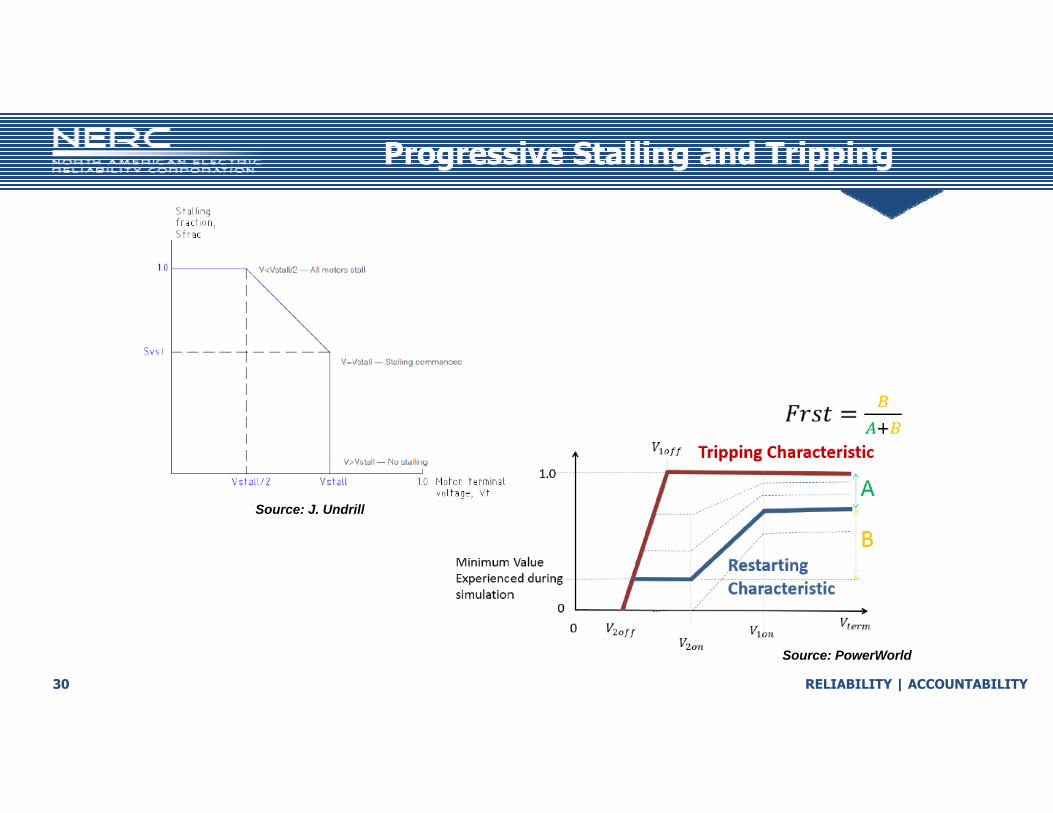
Progressive Stalling and Tripping
Source: PowerWorld
Source: J. Undrill
RELIABILITY | ACCOUNTABILITY31
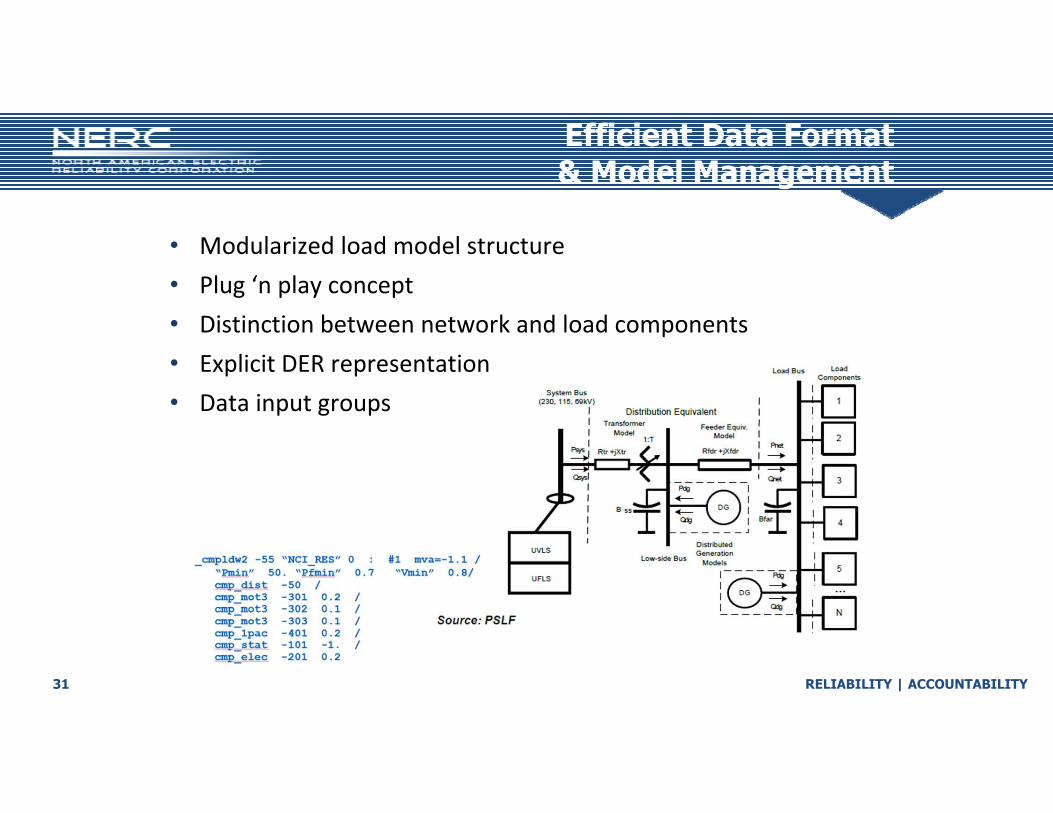
Efficient Data Format & Model Management
• Modularized load model structure• Plug ‘n play concept• Distinction between network and load components• Explicit DER representation• Data input groups
RELIABILITY | ACCOUNTABILITY32
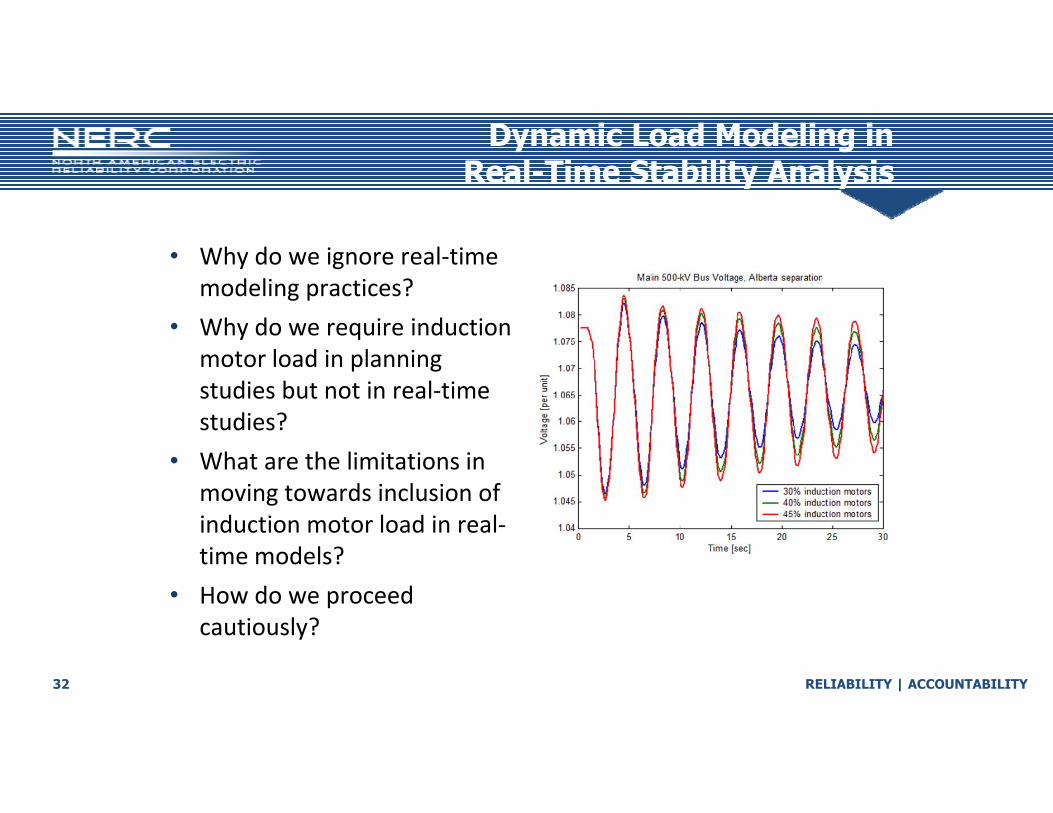
Dynamic Load Modeling in Real-Time Stability Analysis
• Why do we ignore real‐time modeling practices?
• Why do we require induction motor load in planning studies but not in real‐time studies?
• What are the limitations in moving towards inclusion of induction motor load in real‐time models?
• How do we proceed cautiously?

RELIABILITY | ACCOUNTABILITY33