1
ÿ Incorporate AMSU-B into ATOVS (integrate with AMSU-A and HIRS). ÿ Replace the search technique to compute the first guess with a statistical regression technique based on AMSU. ÿ Re-structure the product derivation and validation systems to better assure measurement and product consistency. ÿ Provide a dual set of well-behaved products which satisfy the greatest common denominator for NWP and Climate. NESDIS ADVANCED-TOVS (ATOVS) SOUNDING PRODUCTS AND A PROPOSED SATELLITE UPPER AIR NETWORK (SUAN) NESDIS ADVANCED-TOVS (ATOVS) SOUNDING PRODUCTS AND A PROPOSED SATELLITE UPPER AIR NETWORK (SUAN) Measurements and Products Tony Reale and Michael Chalfant, NOAA/NESDIS, Washington D.C. ([email protected]) Americo S. Allegrino, Frank H. Tilley, Michael P. Ferguson and Michael E. Pettey, Raytheon ITSS, Lanham, Maryland On May 13, 1998, the Advanced TIROS Operational Vertical Sounder (ATOVS) radiometer configuration onboard NOAA-15 was successfully deployed into a morning orbit, replacing TOVS. This was followed by NOAA-16 into an afternoon orbit on September 21, 2000, and NOAA-17 into a mid morning orbit half way between NOAA-16 and NOAA-17 on June 22, 2002. NOAA is currently maintaining this 3-satellite operational configuration. The ATOVS instrument configuration features: 15 - channel… Advanced Microwave Sounding Unit-A AMSU-A 5 - channel .… Advanced Microwave Sounding Unit -B AMSU-B 20 - channel… High resolution Infrared Radiation Sounder HIRS/3 6 - channel …. Advanced Very High Resolution Radiometer AVHRR/3 AMSU-A and B provide all-weather temperature and moisture data, the HIRS detects clouds and clear-sky temperature and moisture, and the AVHRR is used for cloud-detection. Examples of the ATOVS measurements (upper 6 panels) and products (bottom 4 panels) from consecutive overpasses of NOAA 16, 17 and 15 are provided below. Each panel shows a 12- hour composite of observations from 04Z to 17Z on January 23, 2003. Science and Applications Future Science … ATOVS System 2004+ Clouds: ATOVS measurements are combined to determine the global cloud-mask and whether the HIRS can be used in subsequent first guess and retrieval steps; global cloud products are also computed based on derived soundings. ______________________________________________________________________________________________________________ First Guess: The first guess is determined for each sounding using a search technique over a library of collocated radiosonde and satellite measurements which seeks to minimize the equation: D = ( R - R k ) t B -1 ( R - R k ) where the superscript t indicates the matrix transpose, -1 the inverse, and D : scalar closeness parameter, B : sounding channel radiance covariance matrix of dimension (40 x 40), R : adjusted, observed radiance temperature vector of dimension (N A,i ), and R k : adjusted, library radiance temperature vector of dimension (N A,i ). The first guess temperature, moisture and radiance temperature profiles are computed by averaging the 10 collocations with the smallest “D”; radiosondes provide temperature and moisture, and satellites the radiance. ________________________________________________________________________________________________________________ Satellite Upper Air Network (SUAN) Retrieval: The retrieval is done using a Minimum Variance Simultaneous solution which is given by equation (2): T - T g = S A t ( A S A t + N) -1 ( R - R g ) (2) where the subscript t indicates the matrix transpose, -1 the inverse, and: T : final soundings products vector, (133), T g : first guess products vector, (133) S : first guess covariance matrix, (133 x 133), A: sounder channel weighting matrix, (40 x 133), N: measurement uncertainty matrix, (40 x 40), R : observed radiance temperature vector, (M A,j ), and R : first guess radiance temperature vector, (M A,j ). The S, A and N matrices are pre-computed and updated weekly; nine separate “retrieval operators” are computed. < DIFFERENCES between NESDIS Satellite Soundings and NWP Pinpoint the Location of the JET STREAM < (EMC 400mb Wind) Provide Information in Addition to SATELLITE MEASUREMENTS < (AMSU-A Ch 5) The two upper left-side panels illustrate differences between NOAA-16 (SAT) and Environmental Modeling Center (EMC) numerical weather prediction (NWP) layer temperature in the middle troposphere for observations within +/- 1.5 hours. Blue indicates relatively cold SAT temperatures, Red are relatively warm, and White within +/- 1 deg K. The left panel is a snapshot on March 23, 2002, and the right panel is 48-hours later on March 25th; the region is the remote Indian Ocean. The two middle panels show corresponding EMC analyzed wind (Red is high), and the bottom panels the satellite measurements for AMSU channel 5 (Red is warm) sensitive in the middle troposphere. There is high correlation among the SAT-NWP difference, the 400 mb wind, and the satellite thermal patterns over the two day period, each denoting the location of the jet-stream and advancing frontal zone, and together the additional information available from derived soundings in the context of NWP (which assimilate radiance). The right side panels show typical global fields of (SAT - NWP) differences as routinely analyzed by NESDIS during operational monitoring. The high correlation of the patterns evident among the four independently operated derived product systems is an important diagnostic tool. Further studies of these “signature” patterns are needed. 04018 1 1 1 1 11 61 VRS80G 04202 1 1 3 61 VRS80 04220 1 1 3 71 RS90-AG 04270 1 1 1 7 71 RS90-AG 04320 1 1 71 VRS90L RS90-AL RS80-AG 04339 1 1 3 71 RS90-AL RS80-L (+ Ozone) 04360 1 1 1 7 71 VRS90L 06011 1 1 3 61 RS90-AL 06060 0 9 VIZ II 06181 0 71 RS90-AL RS90-AG 06260 1 1 3 71 RS90-AL RS90-AG 06447 1 1 61 VRS80L 06476 1 1 3 61 VRS80L 06496 0 9 06610 1 1 3 26 ML-SRS 07110 1 1 3 74 VRS90L 07145 1 1 3 74 VRS90L 07180 1 1 74 VRS90L 07481 1 1 74 VRS90L 07510 1 1 3 61 VRS90L 07645 1 1 3 74 VRS90L WMO id GUAN Lanzante et al. (LKS) 477 used in HadAT1 277 remaining climatologies Score Inst. No. Radiosonde Alternate 4 4 2 1 * Polar Satellite Radiometers, Derived Products and Associated Science Lack Scientific CALVAL * Global Radiosondes “Can” provide the necessary ground truth data * Currently Compiled Collocations of Radiosonde and Satellite Observations are Not Adequate Network of Reference Radiosondes Coincident with Satellite Overpass Solution: SUAN ... Changing launch schedules and/or Adding launches is Prohibitive Problem: The Problem: Solution: Determine viable SUAN candidates through “Scoring System” ... P Thorne, UKMO SUAN Candidates Green: Score 1 or 0 and Acceptable Raob Yellow: Score 2 or 3 and Acceptable Raob Red: Score 4 or more or Unacceptable Raob Acceptable Instrument Types Perspective Question of tradeoffs: What is potential impact of these sites in current Synoptic versus proposed SUAN platform? In current Synoptic platform Raobs provide independent single point impacts for NWP In proposed SUAN platform Raobs provide integrated global impact on all Satellite Data, Science, and the Radiosondes … Past, Present, and Future Conclusions: Since satellite data are a primary input for NWP (and Climate) the benefits of SUAN are across the board … a transfer standard! It seems that a proposed SUAN platform makes sense … adds (much) more than it subtracts! +/- 3 hours - 1 hour PROBLEM: How To Implement SUAN (ITSC, … WMO …) ? SHIPS needed! (RHB) Mesei RS2-91 VIZ-MARK II VIZ-B2 Vaisala RS80 … RS90 23 - Sea 20 - Land NMC

NESDIS ADVANCED-TOVS (ATOVS) SOUNDING PRODUCTS AND A PROPOSED

  • Upload
    others

  • View
    3

  • Download
    0

Embed Size (px)

Citation preview

ÿ Incorporate AMSU-B into ATOVS (integrate with AMSU-A and HIRS).ÿ Replace the search technique to compute the first guess with a statistical regression technique based on AMSU.ÿ Re-structure the product derivation and validation systems to better assure measurement and product consistency.ÿ Provide a dual set of well-behaved products which satisfy the greatest common denominator for NWP and Climate.

NESDIS ADVANCED-TOVS (ATOVS) SOUNDING PRODUCTS AND A PROPOSED SATELLITE UPPER AIR NETWORK (SUAN)NESDIS ADVANCED-TOVS (ATOVS) SOUNDING PRODUCTS AND A PROPOSED SATELLITE UPPER AIR NETWORK (SUAN)

Measurements and Products

Tony Reale and Michael Chalfant, NOAA/NESDIS, Washington D.C. ([email protected])Americo S. Allegrino, Frank H. Tilley, Michael P. Ferguson and Michael E. Pettey, Raytheon ITSS, Lanham, Maryland

On May 13, 1998, the Advanced TIROS Operational Vertical Sounder (ATOVS) radiometerconfiguration onboard NOAA-15 was successfully deployed into a morning orbit, replacingTOVS. This was followed by NOAA-16 into an afternoon orbit on September 21, 2000, andNOAA-17 into a mid morning orbit half way between NOAA-16 and NOAA-17 on June 22,2002. NOAA is currently maintaining this 3-satellite operational configuration.

The ATOVS instrument configuration features: 15 - channel… Advanced Microwave Sounding Unit-A AMSU-A

5 - channel .… Advanced Microwave Sounding Unit -B AMSU-B 20 - channel… High resolution Infrared Radiation Sounder HIRS/3 6 - channel …. Advanced Very High Resolution Radiometer AVHRR/3

AMSU-A and B provide all-weather temperature and moisture data, the HIRS detects clouds andclear-sky temperature and moisture, and the AVHRR is used for cloud-detection.

Examples of the ATOVS measurements (upper 6 panels) and products (bottom 4 panels) fromconsecutive overpasses of NOAA 16, 17 and 15 are provided below. Each panel shows a 12-hour composite of observations from 04Z to 17Z on January 23, 2003.

Science and Applications

Future Science … ATOVS System 2004+

Clouds: ATOVS measurements are combined to determine the global cloud-mask and whether the HIRS can be usedin subsequent first guess and retrieval steps; global cloud products are also computed based on derived soundings.______________________________________________________________________________________________________________

First Guess: The first guess is determined for each sounding using a search technique over a library of collocatedradiosonde and satellite measurements which seeks to minimize the equation:

D = ( R - Rk )t B-1 ( R - Rk )where the superscript t indicates the matrix transpose, -1 the inverse, and

D : scalar closeness parameter,B : sounding channel radiance covariance matrix of dimension (40 x 40),R : adjusted, observed radiance temperature vector of dimension (NA,i), andRk : adjusted, library radiance temperature vector of dimension (NA,i).

The first guess temperature, moisture and radiance temperature profiles are computed by averaging the 10collocations with the smallest “D”; radiosondes provide temperature and moisture, and satellites the radiance.________________________________________________________________________________________________________________

Satellite Upper Air Network (SUAN)

Retrieval: The retrieval is done using a Minimum Variance Simultaneous solution which is given by equation (2):

T - Tg = S A t ( A S At + N)-1 ( R - Rg ) (2)

where the subscript t indicates the matrix transpose, -1 the inverse, and:

T : final soundings products vector, (133), Tg : first guess products vector, (133) S : first guess covariance matrix, (133 x 133), A : sounder channel weighting matrix, (40 x 133), N : measurement uncertainty matrix, (40 x 40), R : observed radiance temperature vector, (MA,j), and R : first guess radiance temperature vector, (MA,j).

The S, A and N matrices are pre-computed and updated weekly; nine separate “retrieval operators” are computed.

< DIFFERENCES between NESDISSatellite Soundings

and NWP

Pinpoint the Locationof the

JET STREAM< (EMC 400mb Wind)

Provide Informationin Addition toSATELLITE

MEASUREMENTS< (AMSU-A Ch 5)

The two upper left-side panels illustrate differences between NOAA-16 (SAT) and Environmental Modeling Center(EMC) numerical weather prediction (NWP) layer temperature in the middle troposphere for observations within +/-1.5 hours. Blue indicates relatively cold SAT temperatures, Red are relatively warm, and White within +/- 1 deg K.The left panel is a snapshot on March 23, 2002, and the right panel is 48-hours later on March 25th; the region is theremote Indian Ocean. The two middle panels show corresponding EMC analyzed wind (Red is high), and the bottompanels the satellite measurements for AMSU channel 5 (Red is warm) sensitive in the middle troposphere.

There is high correlation among the SAT-NWP difference, the 400 mb wind, and the satellite thermal patterns overthe two day period, each denoting the location of the jet-stream and advancing frontal zone, and together theadditional information available from derived soundings in the context of NWP (which assimilate radiance).

The right side panels show typical global fields of (SAT - NWP) differences as routinely analyzed by NESDISduring operational monitoring. The high correlation of the patterns evident among the four independently operatedderived product systems is an important diagnostic tool. Further studies of these “signature” patterns are needed.

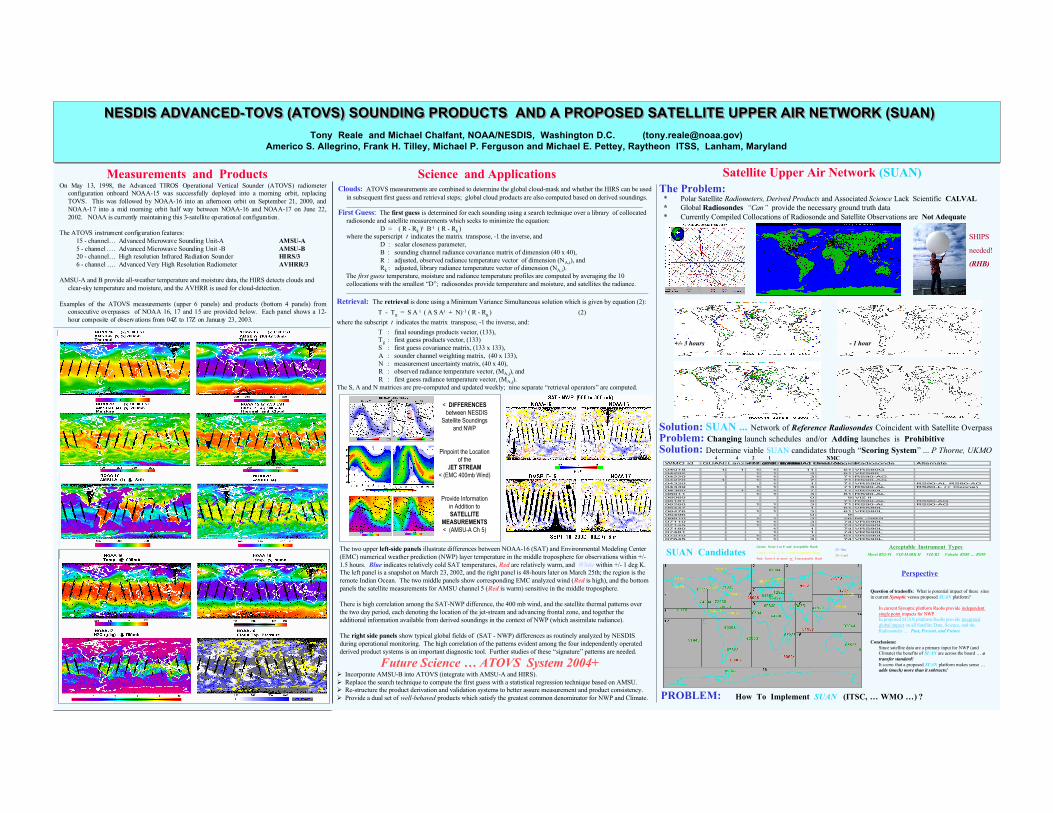
04018 1 1 1 1 11 61 VRS80G04202 1 1 3 61 VRS8004220 1 1 3 71 RS90-AG04270 1 1 1 7 71 RS90-AG04320 1 1 71 VRS90L RS90-AL RS80-AG04339 1 1 3 71 RS90-AL RS80-L (+ Ozone)04360 1 1 1 7 71 VRS90L06011 1 1 3 61 RS90-AL06060 0 9 VIZ II06181 0 71 RS90-AL RS90-AG06260 1 1 3 71 RS90-AL RS90-AG06447 1 1 61 VRS80L06476 1 1 3 61 VRS80L06496 0 906610 1 1 3 26 ML-SRS07110 1 1 3 74 VRS90L07145 1 1 3 74 VRS90L07180 1 1 74 VRS90L07481 1 1 74 VRS90L07510 1 1 3 61 VRS90L07645 1 1 3 74 VRS90L

WMO id GUAN Lanzante et al. (LKS)477 used in HadAT1277 remaining climatologiesScore Inst. No. Radiosonde Alternate

4 4 2 1

* Polar Satellite Radiometers, Derived Products and Associated Science Lack Scientific CALVAL* Global Radiosondes “Can” provide the necessary ground truth data* Currently Compiled Collocations of Radiosonde and Satellite Observations are Not Adequate

Network of Reference Radiosondes Coincident with Satellite OverpassSolution: SUAN ...Changing launch schedules and/or Adding launches is ProhibitiveProblem:

The Problem:

Solution: Determine viable SUAN candidates through “Scoring System” ... P Thorne, UKMO

SUAN CandidatesGreen: Score 1 or 0 and Acceptable Raob

Yellow: Score 2 or 3 and Acceptable Raob

Red: Score 4 or more or Unacceptable Raob

Acceptable Instrument Types

Perspective

Question of tradeoffs: What is potential impact of these sitesin current Synoptic versus proposed SUAN platform?

In current Synoptic platform Raobs provide independentsingle point impacts for NWPIn proposed SUAN platform Raobs provide integratedglobal impact on all Satellite Data, Science, and theRadiosondes … Past, Present, and Future

Conclusions:Since satellite data are a primary input for NWP (andClimate) the benefits of SUAN are across the board … atransfer standard!It seems that a proposed SUAN platform makes sense …adds (much) more than it subtracts!

+/- 3 hours - 1 hour

PROBLEM: How To Implement SUAN (ITSC, … WMO …) ?

SHIPS

needed!

(RHB)

Mesei RS2-91 VIZ-MARK II VIZ-B2 Vaisala RS80 … RS9023 - Sea

20 - Land

NMC