Embed Size (px)
Citation preview
Network Approaches to the Study of Corruption
Johannes Wachs
Supervisor: Janos Kertesz
A Dissertation Submitted in Partial Fulfillment of the Requirementsfor the Degree of Doctor of Philosophy in Network Science
Central European UniversityBudapest, Hungary
2019
CE
UeT
DC
olle
ctio
n

Johannes Wachs: Network Approaches to the Study of Corruption, c�2019All rights reserved.
CE
UeT
DC
olle
ctio
n
RESEARCHER DECLARATION
I Johannes Wachs certify that I am the author of the work Network Approachesto the Study of Corruption. I certify that this is solely my own original work,other than where I have clearly indicated, in this declaration and in the thesis,the contributions of others. The thesis contains no materials accepted for anyother degrees in any other institutions. The copyright of this work rests with itsauthor. Quotation from it is permitted, provided that full acknowledgement ismade. This work may not be reproduced without my prior written consent.
Statement of inclusion of joint work
I confirm that Chapter 3 is based on a paper which was written in collaborationwith Taha Yasseri, Balazs Lengyel, and Janos Kertesz. I conceived of the ideato relate social capital with local corruption risk outcomes by comparing datafrom procurement contracts and the online social network. Dr. Kertesz and Iconceived the details of the implementation. Dr. Lengyel and I collected dataon municipalities. Dr. Yasseri and I developed the methods used. I carried outthe analyses of the data. All authors contributed to the writing of the paper onwhich the chapter is based and gave final approval for publication. Dr. Kerteszendorses this statement with his signature below.
I confirm that Chapter 4 reuses a plot from a working paper written in collab-oration with Mihaly Fazekas on the impact of corruption on public procurementmarket structure. The plot, which I drafted, serves as a prototypical example ofthe representation of procurement markets as networks. The remaining con-tents of the paper are independent of the contents of Chapter 4. Dr. Fazekasendorses this statement with his signature below.
I confirm that Chapter 5 is based on a working paper which was written incollaboration with Janos Kertesz. I conceived of the idea to use a co-biddingnetwork framework to study collusion. Dr. Kertesz and I collaborated on de-veloping and improving the methods used in the paper. I collected the datasetsused and implemented the methods. Dr. Kertesz and I and both contributed to
3
CE
UeT
DC
olle
ctio
n

CE
UeT
DC
olle
ctio
n
ABSTRACT
Though corruption is a broad notion encompassing many kinds of behavior, italways has a relational aspect. Consider how a driver bribes a policeman, howa minister steers a contract to build a hospital to his son-in-law’s constructioncompany, how two managers from different firms agree to avoid competition ina region, or how a regulator goes easy on a potential future employer during anaudit. The observation that interactions between people, firms, and institutionsare where corruption happens is not a new one, but certainly merits furtherinvestigation. A better understanding of the relationship between the networksthat these connections form and corruption can explain why corruption is sodifficult to defeat.
This thesis applies the methods of network science to the study of corruptionand its relationship with markets and society. I argue that corruption emergesfrom specific patterns of interactions that can productively be described usingnetworks. The dyads of actors engaging in a corrupt behavior, the driver andpoliceman, minister and son-in-law, etc., are embedded in networks of socialrelations that facilitate corruption. Within this framework, the thesis addressesseveral questions about corruption. Why does corruption persist in certain com-munities? How does corruption relate to the organization of markets? Howdoes corruption emerge when it depends on cooperation in highly adverse cir-cumstances? I address these questions empirically using newly available micro-level data on corruption risks in public procurement.
Starting with a study of Hungarian towns, I relate corruption risk in lo-cal government contracts to the structure of their social networks. I find thatfragmented towns have higher corruption risk, while towns with residents thathave diverse connections have less. This suggests that corruption is embeddedin the social networks of places. Next I zoom out to the national level, com-paring the procurement markets, conceptualized as networks of issuers andwinners, of different EU countries. I find a strong relationship between cen-tralization and corruption risk. On the other hand, heterogeneity in marketresponses to changes in government across the EU suggests that corruption canbe organized in many different ways. Finally, I investigate cartels, or groups of
5
CE
UeT
DC
olle
ctio
n

firms that illegally agree to avoid competition. By drawing networks of firmsthat bid for the same contracts I highlight niches in markets where cartels aremore likely to thrive.
CE
UeT
DC
olle
ctio
n
ACKNOWLEDGEMENTS
I would like to acknowledge several individuals who have, whether they real-ize it or not, significantly influenced this work. First I must thank my advisorJanos Kertesz for his continued support and confidence. His guidance has beeninvaluable and his patience is much appreciated.
I thank my most immediate colleagues David Deritei, Orsi Vasarhelyi, andTamer Khraisha for their commiseration and support throughout the PhD. Theyand the rest of the Department of Network and Data Science at CEU, includingOlga Peredi, the other PhD students, and the various postdocs and memorablevisitors, provided a wonderful environment to learn and work through turbu-lent social and political times.
I am also grateful to my colleagues at the Government Transparency Insti-tute, Misi Fazekas and Agi Czibik, my host at the Oxford Internet Institute,Taha Yasseri, and friends and collaborators including Balint Daroczy, AgnesHorvat, Dorottya Szalay, Anna May, Casey Tompkins, Theresa Gessler, GergoToth, and Balazs Lengyel. I thank Ancsa Hannak for suggesting that a PhD canbe a worthwhile thing to do, and then encouraging me during its most difficultmoments.
I am lucky to have two families supporting me. I thank both the Czemanand Wachs clans for their unconditional love and support. My mother Kristinand father Karl know that they have given me endless encouragement and Ihope they know how thankful I am for it. What they may not know is howimportant the example they set has been to me. I hope this work reflects thatfact.
Most importantly I want to thank Zsofi. She alone knows what went intothis thesis, and her tireless encouragement always kept me on the tracks. She ismy inspiration and partner in all things. I dedicate this thesis to her.
CE
UeT
DC
olle
ctio
n

CE
UeT
DC
olle
ctio
n
CONTENTS
Contents i
List of Tables iii
List of Figures vi
1 Introduction 1
2 Related Work 7
2.1 Experiments . . . . . . . . . . . . . . . . . . . . . . . . . . . . . . . 92.2 Models . . . . . . . . . . . . . . . . . . . . . . . . . . . . . . . . . . 122.3 Measuring Corruption . . . . . . . . . . . . . . . . . . . . . . . . . 12
2.3.1 Survey and Perception-based Measures . . . . . . . . . . . 132.3.2 Administrative Data-based Measures . . . . . . . . . . . . 142.3.3 Comparison of procurement-based indicators with
perception-based indicators . . . . . . . . . . . . . . . . . . 172.4 Corruption as Networked Phenomenon . . . . . . . . . . . . . . . 17
3 Social Networks and Corruption 21
3.1 Prelude . . . . . . . . . . . . . . . . . . . . . . . . . . . . . . . . . . 213.2 Empirical Setting and Methods . . . . . . . . . . . . . . . . . . . . 25
3.2.1 Public contracting . . . . . . . . . . . . . . . . . . . . . . . 253.2.2 Measuring social capital . . . . . . . . . . . . . . . . . . . . 313.2.3 Models . . . . . . . . . . . . . . . . . . . . . . . . . . . . . . 35
3.3 Results . . . . . . . . . . . . . . . . . . . . . . . . . . . . . . . . . . 373.4 Discussion . . . . . . . . . . . . . . . . . . . . . . . . . . . . . . . . 37
4 Corruption and Procurement Markets 41
4.1 Prelude . . . . . . . . . . . . . . . . . . . . . . . . . . . . . . . . . . 414.2 Data . . . . . . . . . . . . . . . . . . . . . . . . . . . . . . . . . . . . 434.3 Markets as Bipartite Networks . . . . . . . . . . . . . . . . . . . . 45
i
CE
UeT
DC
olle
ctio
n
ii CONTENTS
4.3.1 The Core of Procurement Markets . . . . . . . . . . . . . . 494.3.2 The Clustering of Corruption Risk in Markets . . . . . . . 584.3.3 Market Turnover and Change in Government . . . . . . . 65
4.4 Discussion . . . . . . . . . . . . . . . . . . . . . . . . . . . . . . . . 69
5 Cartels 71
5.1 Prelude . . . . . . . . . . . . . . . . . . . . . . . . . . . . . . . . . . 725.2 Results . . . . . . . . . . . . . . . . . . . . . . . . . . . . . . . . . . 74
5.2.1 The 1980s Ohio School Milk Market . . . . . . . . . . . . . 755.2.2 Georgian Public Procurement Markets . . . . . . . . . . . . 765.2.3 Simulation Model . . . . . . . . . . . . . . . . . . . . . . . . 79
5.3 Discussion . . . . . . . . . . . . . . . . . . . . . . . . . . . . . . . . 805.4 Methods and Data . . . . . . . . . . . . . . . . . . . . . . . . . . . 82
5.4.1 Co-bidding networks, group detection, and group features 825.4.2 Null models . . . . . . . . . . . . . . . . . . . . . . . . . . . 845.4.3 Agent Based Model . . . . . . . . . . . . . . . . . . . . . . . 845.4.4 Datasets . . . . . . . . . . . . . . . . . . . . . . . . . . . . . 86
6 Conclusion 87
7 Appendices 111
7.1 Social Networks and Corruption . . . . . . . . . . . . . . . . . . . 1117.1.1 Description of iWiW data . . . . . . . . . . . . . . . . . . . 1117.1.2 Relationship between fragmentation and diversity . . . . . 1127.1.3 Model covariates and controls . . . . . . . . . . . . . . . . 1127.1.4 Model results, diagnostics, and feature importances . . . . 113
7.2 Cartels . . . . . . . . . . . . . . . . . . . . . . . . . . . . . . . . . . 1187.2.1 Ohio School Milk Data . . . . . . . . . . . . . . . . . . . . . 1187.2.2 Georgian Contracting Data . . . . . . . . . . . . . . . . . . 119
CE
UeT
DC
olle
ctio
n
LIST OF TABLES
3.1 Elementary indicators of corruption risk on public contracts . . . 273.2 Municipality corruption risk regressed on social capital variables. 38
4.1 Procurement Market Network Summary Statistics . . . . . . . . . 484.2 Summary statistics of market cores. . . . . . . . . . . . . . . . . . . 564.3 Average National Procurement Market Edge-Clustered Modularity 604.4 Clustering of Single Bidding by Country . . . . . . . . . . . . . . . 644.5 Changes of Government, EU countries . . . . . . . . . . . . . . . . 66
5.1 Cartel screen comparisons. . . . . . . . . . . . . . . . . . . . . . . . 79
7.1 Descriptive statistics of key settlement-level variables and controls.1147.2 Stepwise regressions predicting municipality corruption risk. . . 1157.3 VIF scores for model predictors. . . . . . . . . . . . . . . . . . . . . 1167.4 Lower inclusion threshold regression robustness test. . . . . . . . 1177.5 Summary statistics of the Ohio school milk market by year. . . . . 1187.6 Georgian market summary statistics . . . . . . . . . . . . . . . . . 1197.7 Georgian cartel screen size inclusion robustness tests. . . . . . . . 120
iii
CE
UeT
DC
olle
ctio
n

iv LIST OF TABLES
CE
UeT
DC
olle
ctio
n
LIST OF FIGURES
2.1 Single bidding rates of EU countries. . . . . . . . . . . . . . . . . . 182.2 Correlates of national single bidding . . . . . . . . . . . . . . . . . 19
3.1 Distributions of average contract corruption risk indicatorsacross Hungarian settlements. . . . . . . . . . . . . . . . . . . . . . 30
3.2 Distributions of corruption risk in scandal towns. . . . . . . . . . 313.3 High and low fragmentation towns. . . . . . . . . . . . . . . . . . 343.4 High and low diversity ego networks. . . . . . . . . . . . . . . . . 363.5 Marginal effects of social capital on corruption risk. . . . . . . . . 39
4.1 Toy bipartite network. . . . . . . . . . . . . . . . . . . . . . . . . . 464.2 Contract distributions of issuers and winners, EU-wide. . . . . . . 504.3 Contract distributions of issuers and winners, Country-level. . . . 514.4 Hungarian Market Cores . . . . . . . . . . . . . . . . . . . . . . . . 544.5 Market Centralization and Corruption . . . . . . . . . . . . . . . . 574.6 Prevalence of single bidding in cores. . . . . . . . . . . . . . . . . . 574.7 2014 Hungarian Procurement Market with Edge Communities . . 624.8 The scaled clustering of single bidding in a market, compared
with its overall single-bidding rate and centralization. . . . . . . . 634.9 Hungarian procurement market turnover . . . . . . . . . . . . . . 674.10 Political turnover and corrupt winner turnover . . . . . . . . . . . 68
5.1 Ohio school milk cartel . . . . . . . . . . . . . . . . . . . . . . . . . 765.2 Coherence and Exclusivity of Georgian groups. . . . . . . . . . . . 775.3 Simulation model coherence and exclusivity distributions. . . . . 81
7.1 Sensitivity of social capital network measures to thresholds. . . . 1217.2 iWiW usage distributions. . . . . . . . . . . . . . . . . . . . . . . . 1217.3 Analysis of Variance F-test feature importances of OLS regression
predicting average settlement CRI. We only include significantfeatures, and highlight the network-based social capital measures. 122
7.4 Ohio school milk co-bidding networks by year. . . . . . . . . . . . 122
v
CE
UeT
DC
olle
ctio
n

vi LIST OF FIGURES
7.5 Distributions of detected group sizes from the Ohio school milkcontracting data, by year. . . . . . . . . . . . . . . . . . . . . . . . . 123
7.6 Distributions of detected group sizes from the Georgian contract-ing data, by year. . . . . . . . . . . . . . . . . . . . . . . . . . . . . 123
CE
UeT
DC
olle
ctio
n
CHAPTER 1
INTRODUCTION
Corruption is a major cause of suffering around the world. It slows economicgrowth [1], stifles innovation [2], and increases inequality [3]. The social im-pacts of pervasive corruption in a society, reflected for example in distrust ofgovernment and strangers [4] and in the low quality in government services [5],suggest that corruption reinforces itself in a kind of feedback loop. Feeling thatsociety is rigged, individuals adapt to their circumstances and play by the localrules. Like many other social scientific problems, understanding the emergenceor persistence of corruption is difficult because it manifests both in individualsand societies.
This dichotomy is one reason why there are multiple definitions of corrup-tion. The World Bank and Transparency International define corruption as “theabuse of public or corporate office for private gain” and “the abuse of entrustedpower for private gain,” respectively [6, 7, 8]. This definition provides a goodbenchmark to use when deciding whether an individual’s behavior should beconsidered corrupt. Recently, scholars of government and institutions have fo-cused on a more macro-oriented definition of good governance, namely: “thedegree to which the exercise of public authority follows the principle of uni-versalism or impartiality” [9]. The presence of partiality or particularism in thedecision making of public actors is a useful definition of corruption because itdefines a norm of behavior that can be applied to various contexts [10].
These two perspectives have had some success in quantifying causes and ef-fects of corruption, building measures of the prevalence of corruption in coun-tries and regions, and proposing policy interventions to improve the control ofcorruption in society. They share several important core concepts, for exam-ple both reference corruption as a kind of behavior existing at the intersectionof the public and private domains. Both refer to the exploitation of power or
1
CE
UeT
DC
olle
ctio
n
2 CHAPTER 1. INTRODUCTION
advantage, presumably to the detriment of a wider group of people.The definition of corruption based on the lack of impartiality has become
increasingly relevant as researchers of corruption focus on grand corruption,distinct from petty corruption. Corruption is deemed petty when it is imper-sonal and transactional - for example when someone bribes a driving instructorto pass an exam or a policeman to avoid a speeding ticket. Grand corruptionrefers to coordinated, organized behavior to siphon resources to specific groupsor networks of people [11, 12]. When examples of grand corruption are discov-ered they are typically front page headlines, as for example in the case of Petro-bras, Brazil’s state-owned petroleum company, whose executives were found tohave taken nearly $10 billion of bribes and kickbacks from a group of 16 largeconstruction firms in exchange for awarding them overpriced contracts [13, 14].Over 160 people were arrested and 93 convicted, including the former Presidentof Brazil.
Such a large conspiracy with such significant payoffs to its participants isonly possible as a collective effort of many people. Despite having a larger tar-get to aim at, it is difficult for authorities to combat grand corruption. This isbecause grand corruption is often organized in a sophisticated way, with its ac-tors having specific responsibilities and roles, and connections organized in away to limit their vulnerability as a whole [15]. Organized crime groups [16]and the September 11th hijackers [17] structured themselves in a similar man-ner. Grand corruption is a difficult topic for academic research for these samereasons and also because it is unlikely that large conspiracies can be understoodin terms of a sequence of “abuses of public or corporate office for private gain”.Somehow such conspiracies are much more complex social outcomes than thesum of the individual behaviors of their members.
Throughout this thesis when we speak about corruption, we will be refer-ring to grand corruption and its organization, rather than instances of pettycorruption. Though the prevalence of bribery and its acceptance in society arelikely correlated with the prevalence of grand corruption, it is not essential toits functioning.
While framing corruption in terms of the norms and rules of society may bemore applicable to the study of grand corruption than the transactional view ofcorruption focusing on bribery, it suggests an over-socialized description of cor-ruption. In an extreme interpretation, the environment determines the actionsof individuals, who merely “internalize norms and seek [to conform] to the ex-pectations of others” [18] and so participate in corruption. Such a perspectivenot only fails to give a satisfying answer to the question of why certain placeshave developed a good control of corruption while others have not, but is alsoempirically unsupported. We will see that there is significant variation in the
CE
UeT
DC
olle
ctio
n
3
prevalence of corruption as we measure it within countries, even at the level oftowns. It also has limited ability to explain how the prevalence of corruption ina place might change over time. Indeed, the Petrobras scandal offers some hopefor Brazil: in the end powerful people were imprisoned for their corruption.
As they focus on individuals and societies, respectively, both definitionsavoid mentioning that corruption, like nearly all socioeconomic activity, hap-pens between actors. In this thesis we consider corruption as a networked phe-nomenon [19]. It is a property of the interactions between groups of actors suchas people, firms, institutions, which evolves as these interactions change. In his1985 paper on the embeddedness of economic action in social structure, MarkGranovetter suggested that “force and fraud are most efficiently pursued byteams, and the structure of these teams requires a level of internal trust–“honoramong thieves”– that usually follows preexisting lines of relationship.” In otherwords, Granovetter is suggesting that particular social structures or networksare required to scale corruption to high levels. We do not discard the productivemicro-level definitions of corruption by the World Bank or Mungiu-Pippidi, butwe do change the way they are applied.
We will demonstrate that this approach can describe in novel ways the or-ganization and roots of corruption at various scales from towns to nations. Itcomplements micro and macro-level frames of corruption by considering whathappens in between.
Theory aside, why might networks be a useful in the study of corruption,for example in its measurement, detection, or diagnosis? Grand corruption, asits name suggests, requires organization and coordination. Such organizationmay manifest explicitly as a social network of specific actors, say members ofparliament and heads of firms. It should also leave fingerprints in the inter-actions between firms and institutions doing business and exchanging money.Crucially, several recent developments make it possible to examine empiricallythe relationship between corruption and the networks of actors. The growthof the internet and its use by governments has created a wealth of fine-grainedadministrative data on interactions between the public and private sectors.
One distinguished example of such data is information on public contract-ing or procurement markets, which accounts for upwards of 20% of GDP inOECD countries [20]. Recently, researchers have developed ways to measurecorruption risk in the award of such contracts [21, 22]. This data and measure-ment approach provides us with the micro-level data to undertake a network-based analysis of the phenomenon of corruption. We argue that this data, atpresent, offers the best possible approach to an evidence-based, data-drivenanti-corruption research program as proposed by Mungiu-Pippidi in 2017 [23].
Nearly in parallel, researchers studying biological [24], ecological [25], so-
CE
UeT
DC
olle
ctio
n
4 CHAPTER 1. INTRODUCTION
cial [26], economic [27, 28], and spatial [29] phenomena have made fun-damental advances in their fields by using a network perspective. A by-product of these minor revolutions in different physical and social sciences isthe emergence of set of tried and tested methods for studying networks withindata. These efforts extend the pioneering work of sociologists and anthropolo-gists [30, 31, 32], who have been working on social networks since the 1940s, tonew contexts and larger scales1. This recent work on networks forms an emerg-ing field of research called network science, which has created a rich tool set forthe study of complex systems.
This thesis proposes to leverage these developments to extend the state ofthe art in corruption research. Specifically, we claim that corruption risk can ef-fectively be measured at the micro-level using administrative public contractingdata, and that by using network science methods we can describe the organiza-tion or structure of corruption. We do this in three contexts: relating social net-works and corruption outcomes of towns, describing the relationship betweencorruption risk and market structures at the scale of countries, and analyzingthe emergence of illegal cartel behavior among firms. In all three chapters weprovide both a theoretical contribution to the understanding of corruption andpolicy implications.
First we describe how the structure of social networks are related with theprevalence of corruption in local government contracting using data from Hun-garian settlements. By linking social structure with corruption we strengthenour claim that corruption is in general a networked phenomenon.
Next we zoom out to the level European countries, mapping their procure-ment markets as bipartite networks of public institutions and the firms theycontract with. These networks have rich structure related to their level of cor-ruption risk. By observing how corruption risk is distributed in these networksand how actors with high risk scores respond to political shocks, we highlightnovel distinctions between the organization of corruption in different countries.Among EU countries we find significant heterogeneities, for example that insome countries corruption risk is concentrated in the core of the procurementmarkets, while in others it is more common in the periphery.
Finally, we shift focus to cartels in procurement markets, transferring theperspective we have developed to study corruption to a different but relatedeconomic problem. Cartels are groups of firms which illegally avoid compe-tition to maximize their profits. We propose a framework to map markets ofcompeting firms using contracting data, to identify groups of frequently inter-
1For an excellent history of research on social networks we refer the reader to the review ofFreeman [33]. For an overview of the current relationships between the different traditions ofnetwork analysis, we refer the reader to Hidalgo’s review [34].
CE
UeT
DC
olle
ctio
n
5
acting firms, and to measure their potential for forming cartels.The remainder of the thesis is structured as follows:
• Chapter 2: Here we review past work on the conceptualization and mea-surement of corruption, introducing measures based on both perceptionsand administrative data and comparing them. We also review the litera-ture on network aspects of corruption.
• Chapter 3: In this chapter we relate the social networks of Hungariantowns using data from an online social media portal with the amount ofcorruption risk in their local governments.
• Chapter 4: In this chapter we quantify corruption at the national levelusing data on public contracts awarded by member states of the EuropeanUnion. By mapping procurement markets as networks, we can examinethe distribution of corruption risk in different countries, and observe howthey react to political shocks.
• Chapter 5: In this chapter we apply network methods to the problem ofcartels, transferring the principles developed in earlier chapters to a do-main adjacent to corruption. We consider the emergence of illegal cooper-ation among firms in procurement markets using records of their biddingbehavior. We observe a “hot spots” in the network topology where collu-sion appears much more sustainable.
We conclude by tying our findings together, presenting some of their diag-nostic interpretations, and suggesting future avenues of research.
CE
UeT
DC
olle
ctio
n

6 CHAPTER 1. INTRODUCTION
CE
UeT
DC
olle
ctio
n
CHAPTER 2
RELATED WORK
In this chapter we discuss relevant previous work on corruption, including itsmeasurement and its relational aspects, in order to orient the thesis. Follow-ing a brief survey of classical studies of corruption, we review how corruptionis studied using experiments and models. These results give us insights intohow corruption functions at smaller scales and suggests potential mechanismsto investigate. Next comes a review of how corruption is measured, consider-ing surveys, and indicators derived from administrative data. We then surveyfindings on the causes and consequences of corruption, noting how corruptionis measured in each result. With these results in mind, we argue that measur-ing corruption using indicators derived from administrative data is the mostpromising way to study the organization and structure of corruption becauseof its granularity. Correlations between such indicators and other measures ofcorruption demonstrate the validity of our chosen approach. Finally, we reviewapplications of network methods to the study of corruption and crime moregenerally.
As suggested in the introduction of this thesis, corruption is a long-studiedtopic of interest to many branches of the social sciences. The result is that cor-ruption has been studied from a variety of viewpoints, reflecting broad trends inhow different fields have productively conceptualized human behavior at var-ious times [35]. Before reviewing the most recent theoretical and empirical ap-proaches to the study of corruption, we briefly highlight two such viewpoints,framing them as micro- and macro- oriented perspectives.
A major micro-oriented perspective on the study of corruption is theprincipal-agent framework [36]. In this framework, the principal represents anactor in charge of monitoring agents, seeking to block or limit corruption, re-ferring sometimes to a high-level policymaker or to the public as a whole. The
7
CE
UeT
DC
olle
ctio
n
8 CHAPTER 2. RELATED WORK
agents are individual bureaucrats, citizens, or politicians who weigh incentivesto engage in corruption or to follow the rules. In a seminal work on this frame-work Klitgaard [?] describes corruption with a formula at the agent level: ”cor-ruption equals monopoly plus discretion minus accountability”. Schleifer andVishny [37] model the decision of bureaucrats to take bribes as a cost-benefitanalysis of rational agents.
The results of such models offer immediate policy recommendations, for in-stance to increase accountability when an agent occupies a monopoly position.More generally speaking, this approach to corruption emphasizes necessaryconditions for the control of corruption, for instance the existence of constraintsin policy-making. It falls short in describing sufficient conditions for effec-tive control of corruption. The principal-agent framework suffers from severalflaws, such as the assumption that a clean principal exists or can be created (forexample by establishing an anti-corruption agency), or that marginal changes toincentives can change a thoroughly corrupt equilibrium [38]. Mungiu-Pippidiand Dadasov suggest that a principal-agent framework is only useful when“corruption is an exception and the broader norm is ethical universalism.” [39]In other words, the principal-agent framework is an under-socialized approachto corruption, neglecting the norms and context that corrupt actions are embed-ded in.
Researchers adopting a macro-orientation to the study of corruption oftenseek to compare and explain the differences in outcomes of countries usingstructural or institutional factors. Structural factors include the level of de-velopment or education, or the legacy of a country’s history (for instance asa colony) [40]. Work by Treisman, for instance, shows a significant positiverelationship between how long as place has been democratic and its controlof corruption [41]. In general wealthier countries with an education citizenryhave less corruption [42]. Institutional factors refer rather to the current legalorganization of a place, for instance its constitution, and its politics. There isfor example some evidence that political competition is an important ingredi-ent to effective control of corruption [43]. Given, however, the heterogeneity ofcorruption outcomes at sub-national levels [44], there is a kind of natural reso-lution limit to entirely macro-based approaches to the study of corruption. Weargue that such an approach suffers from an over-socialized perspective whichstruggles to explain how countries actually overcome corruption.
In the rest of this chapter we present previous experiments, models, andempirical studies that further demonstrate the potentially networked nature ofcorruption in a variety of contexts and at different scales. Again we emphasizethat we do not discard the perspectives we describe above, but rather highlighthow they can be enhanced by an alternative perspective.
CE
UeT
DC
olle
ctio
n
2.1. Experiments 9
2.1 Experiments
A major limitation of the social sciences has been the inherent difficulty of car-rying out experiments to test hypotheses about the social world. In the naturalsciences, experiments are a crucial ingredient of many research projects. Often,social scientists can only use observational data to test their ideas in the con-text of the social world. An alternative to using observational data is to testhypotheses about the social world in artificial or specific contexts. The formerrefers to laboratory experiments, in which participants are put into situationsemulating the real world and their reactions to stimuli are observed [45]. Usingcomputers and remote participation, the potential scale of such experimentshas vastly increased, sometimes involving hundreds of simultaneous partici-pants [46]. The latter notion refers to randomized control trials, in which asample of a population (of individuals, towns, regions) is split into treatmentand control groups, an intervention is applied to the treatment group, and out-comes are tracked [47]. Such methods offer convincing evidence of the effect ofintervention, at great cost. Randomized control trials are expensive to imple-ment and carry on over time. Both kinds of experiments have been applied tothe study of corruption [48].
Lab experiments have been used to test the hypothesis that corruption is acultural phenomenon by having participants from different cultures play gamesin which there is economic incentive to cheat or behave in a corrupt manner.Cameron et al. [49] find high cross-cultural variation (comparing subjects fromAustralia, India, Indonesia, and Singapore) in the propensity to punish corrup-tion, and less variation in actually engaging in corruption. This finding suggestsone reason why social networks may have an important role to play in corrup-tion: actors across cultures may not be more or less willing to engage in cor-ruption, but rather face different consequences depending on their alters. Otherexperiments show that when individuals are given opportunities to take cor-rupt actions without consequences in one round of a game, they are more likelyto be dishonest when they are unsure about the consequences. This suggeststhat experience with corruption increases willingness to engage in corruption,again suggesting a role for networks in the spread of corruption [50, 51].
A third example of the study of corruption in a laboratory environment dra-matically underscores the collaborative nature of corruption [52]. Weisel andShalvi have pairs of subjects play a six-sided dice rolling game. The first playerrolls a die, observes its outcome privately, and reports it to his partner. Thepartner then rolls his die, also observing the outcome in private. The playersare paid proportionally to the value of their roll if and only if both players reporthaving rolled the same number. In the results, both the frequency of matches
CE
UeT
DC
olle
ctio
n
10 CHAPTER 2. RELATED WORK
and the frequency of high numbers (fives and sixes) reported by the players ismany times greater than what would be expected if both players were honest.The amount of dishonest reporting is also significantly higher in this two playergame than in a similar one player game. These results suggest that collaborationcan facilitate dishonest behavior, perhaps via the diffusion of responsibility. Onthe other hand, the classic study of Kahneman, Knetsch and Thaler [53] suggeststhat individuals will reject unfair distributions at cost to themselves, so corruptcollaborations likely require a careful distribution of resources to be effective.
Despite their artificial nature, these experiments provide insights into po-tential underlying mechanisms of corruption. The studies we have highlightedsuggest the importance of other people in an actor’s choice to be corrupt. Oth-ers can be tolerant of corruption, they can provide examples, and they can evenbe accomplices.
There are several notable large-scale field experiments relevant to our work.Most prominent is the work of Olken in Indonesian villages [54]. Olken de-signed a series of interventions applied in a randomized way to over 600 vil-lages that were about to start building roads using funds from a nationwide in-frastructure project. A random sample of villages were informed that their im-plementation of the project would be audited by the central government, andthat the results would be read publicly in an open forum in the village. Thisrandom intervention tests the effectiveness of top-down checks on corruption.Olken was also interested in the potential for bottom-up methods to combatcorruption, so in another subset of the villages, he organized public account-ability meetings with the project officials. Within this subset Olken ran anotherexperiment: allowing residents of some villages to relay anonymous informa-tion about the project which would be read aloud at the meetings. These twointerventions test the ability of grassroots organization to fight corruption.
In order to measure corruption in the delivery of the road constructionprojects, Olken hired a team of engineers and surveyors who generated inde-pendent estimates of the costs of projects. Comparing these estimates on a line-item basis with the observed outcomes, Olken found that the roads built cost27% more on average than what the engineers estimated. Top-down auditingdecreases the discrepancy between between cost and the independent estimatesby nearly a third to 19%. The bottom-up grassroots organizing had no signifi-cant effect on corruption. Following up with a household survey, Olken foundthat family members of local government officials were significantly more likelyto have been employed on the road project in audited towns. This suggests thatthe guarantee of a top-down audit of expenditures had a substitution effect -instead of reporting higher prices and pocketing the difference, corrupt leadershired their family members. Contrasted with the insignificance of the grassroots
CE
UeT
DC
olle
ctio
n
2.1. Experiments 11
intervention, this final observation highlights the importance of distinguishingbetween different kinds of social connections when studying corruption.
Bertrand et al. provide a second example of the use of randomized controltrials [55] to study corruption. Participants in the study, run in India, are taskedwith obtaining a driver’s license. A third of the participants are offered a bonusif they obtain the license quickly, the second third are given free driving lessons,and a remaining third serve as a control. While members of both treated groupsare more likely to obtain a license than members of the control group, membersof the so-called bonus group accomplish this by paying bribes to third-partyagents. These agents are a constant presence in Indian bureaucracy - nominallythey are hired to stand in line on behalf of clients.
Many of members of the bonus group obtain a license without taking anexam, and are found to have significantly worse driving skills in a surpriseexam - a good example of an externality of corruption. The agents arrangingthe corrupt transfer play an interesting role: they insure that license seekers donot interact directly with bureaucrats in the extra-legal process. They are bydefinition brokers - the crucial network connections that facilitate corruption inthis environment.
In some rare cases, governments carry out randomized audits of publicworks and records. The most notorious example comes from Brazil, where a2003 federal government program introduced lottery-based audits of munic-ipalities [56, 57]. Researchers have used this data to quantify corruption atthe municipal level in Brazil and to measure how corruption impacts incum-bent electoral performance, and what impact local media have. A recent studyshows that the electoral effects of revealed corruption spill over into neighbor-ing towns [58]. Voters in towns neighboring a corruption scandal will punishpoliticians of the same party as the neighboring mayor in their own election.
Well-designed randomized control experiments can measure interestingcausal relationships between variables relevant to corruption. However theydo have some significant limitations. They are expensive and are difficult toscale. By definition they cannot compare effects in different contexts or envi-ronments unless the treatment itself is the difference. Randomized audits ofpublic works seem to be cost-effective, as demonstrated by Olken’s work inIndonesian villages and in the case of Brazilian municipalities, but we do notknow an example of a central government body instituting random audits of itsown actions at a large scale (consider for instance that corruption in Petrobraswas going on at the same time as the introduction of the randomize audits ofmunicipalities in Brazil).
CE
UeT
DC
olle
ctio
n
12 CHAPTER 2. RELATED WORK
2.2 Models
Purely abstract models of social systems can provide useful ideas to researchersof social phenomena [59]. In this section we describe some previous workon corruption which applies abstract models or agent-based simulations. Eco-nomic Nobel Laureate Jean Tirole created a model of the persistence of collec-tive reputation to suggest that once bad behavior becomes a structural phe-nomenon, it is difficult to get rid of [60], echoing the experimental work citedabove. Lambsdorff [61] points out that the informal mechanisms used to en-force corrupt agreements and notion of mutually-assured-destruction lock part-ners in corrupt deals together. Ferrali [15] models the spread of corruption asa game played on a network, finding that modular networks are eventuallymore corrupt than more mixed ones. These models and others suggest that it isvaluable to consider the durability of corrupt partnerships and the importanceof social connections in the evolution or spread of corruption. In other words,these models suggest that corrupt actors stick together.
Agent-based models are also useful tools to understand the emergence ofmacro-patterns from micro-behavior [62]. One under-explored aspect of cor-ruption is how a corrupt society in which corruption is the rule might transitionto one where it is rather the exception. Indeed, this has happened several timesin history. It seems unlikely that the level of corruption in a society simply de-creases in a linear manner. An agent-based model of citizens and bureaucratsby Hammond [63] demonstrates how phase-transitions between highly corruptand very clean states might occur. In Hammond’s model, randomly interactingcitizens and bureaucrats play games in which mutually corrupt behavior is re-warded, while asymmetric corrupt behavior risks punishment and loss. Likelysuch models can be enriched by incorporating a more realistic network-basedstructure of interactions. In any case, Hammond’s findings again suggest thatit is worth thinking about corruption as a complex phenomenon.
2.3 Measuring Corruption
The most widely known measures of corruption are taken at the national level.They are used in the evaluation and comparisons of countries, and are impor-tant for several reasons. Within countries they can drive politics by shaminggovernments who fall in the global rankings. Internationally they spur com-petition between governments, not only for reasons of pride but also becauseinvestors use these rankings to decide where to put their capital. They also playan important role in driving awareness of corruption as a problem in society.Most national measures of corruption are based on survey data and rely on per-
CE
UeT
DC
olle
ctio
n
2.3. Measuring Corruption 13
ceptions of corruption. In this section we first present several such measureswhich are commonly used both in research and policy to study corruption. Wehighlight some of the research findings on the causes and effects of corruptionbased on these measures. We then highlight some of their shortcomings andsuggest an alternative based on administrative data which has become morepopular in recent years. We then compare the indicators using European data,previewing our analysis in Chapter 4.
2.3.1 Survey and Perception-based Measures
The two measures of corruption perception that have been around the longestare Transparency International’s (TI) Corruption Perceptions Index (CPI) [64,65], available since 1995, and the World Bank’s (WB) Worldwide Governance In-dicators (WGI), specifically its Control of Corruption component (CoC) [66, 67],available since 1996. Both are composite indicators, drawing on a variety ofsources. Both mix surveys of representative samples of the population in acountry with targeted surveys of expats, firm managers, and NGOs. Both useexpert testimony measure to assess different dimensions of corruption. Whilethe CPI the average of indicators, the WGI applies a method known as an “un-observed component model” which decreases the weighting of outlier scores.The two measures are highly correlated (above .9).
As not all data sources are available for every country, and because datasources can change year to year, there are substantial problems with comparingthe results of the CPI and WGI from year to year (though this is more of a con-cern for the CPI) [68]. Ironically, Heywood and Rose note that there is a distinctlack of variance in countries scores over time for both the CPI and WGI. For bothmeasures, an ordinary-least-squares model predicting 2011 scores using only2000 scores explains over 89% of the variance in the 2011 CPI and 86% of thevariance in the 2011 WGI. Given the innate measurement errors of perception-based indicators, the fit is almost too good. Indeed Hawken and Munck, inves-tigating the CPI between 1995 to 2009 find that a significant amount of varia-tion within country scores over time comes from choice of experts and evalu-ators who decide about the inclusion or exclusion of sources [69]. Adjustmentmade since may have improved the situation at the margin, but aggregatedperception-based indicators still have to contend with problems of samplingbias, the difficulty of measuring errors, and the issue that aggregation increasesthe distance between measurement and solutions [70].
One recent innovation addressing some of issues with both the WGI and CPIis the Bayesian Corruption Index (BCI) [71]. The BCI begins with the WGI anduses Bayesian methods to quantify how the error at the level of individual com-ponents aggregates into the composite measure. It also considers, unlike the
CE
UeT
DC
olle
ctio
n
14 CHAPTER 2. RELATED WORK
WGI, that individual components have correlation between the years. By esti-mating these correlations, the BCI can describe shifts of corruption perceptionfrom year to year more precisely than the original WGI. The BCI is highly corre-lated with the WGI (.95), but offers a way to quantify error, and is significantlyless correlated over time within countries (.35). Though the BCI does not solvethe issues of correlations in the errors of components of the WGI, it offers aninteresting alternative measure, especially for describing changes in corruptionover time.
As alternatives to these methods we also consider the Varieties of Democ-racy (V-DEM) indicator of political corruption, which is a composite index builtentirely from indicators coded by country experts [72], and the Quality of Gov-ernment Institute’s (QoG) European Quality of Government Index (EQI), basedentirely on surveys conducted in the subnational regions of Europe [73].
Despite these attempts to address specific issues with perception-based mea-sures of corruption, there is evidence that such measures will always suffer fromcertain innate flaws. Olken followed up his study of corruption in Indonesianvillages discussed above with surveys of the villagers [74]. He found that vil-lagers could perceive significantly higher levels of corruption when the roadproject in their village had higher missing expenditures. However, the strengthof this relationship was weak: a 10% increase in missing expenditures increasesthe probability a villager believes that the project was corrupt by only 0.8%.More importantly, Olken finds significant biases in perceptions. In villages withhigher ethnic heterogeneity (often suggested as an important correlate of cor-ruption [1]), perceptions of corruption were significantly higher while actualmissing expenditures were lower. Social cohesion, measured using participa-tion in social activities, is related to lower perceptions of corruption but highermissing expenditures. We will revisit this latter relationship in depth in Chap-ter 3. These biases highlight significant issues with using local perceptions tomeasure corruption [75]. We next present some alternatives.
2.3.2 Administrative Data-based Measures
We now highlight several approaches to measuring corruption that can com-plement the use of perception-based indicators. Generally speaking, the ap-proaches we describe are based on the observations of outcomes, for instancethe construction of public roads, and their comparison to a benchmark. Unex-plained shortfalls in outcomes or deviations from the ideal benchmark are con-sidered to be the residue of corruption. This general framework is increasinglyrelevant and applicable given the explosion of data available on the activitiesof public institutions and the widespread adoption of information and com-munications technologies (ICT) in the public sector [76]. Bureaucracies around
CE
UeT
DC
olle
ctio
n
2.3. Measuring Corruption 15
the world are incorporating transparency and opening their procedures to thepublic [77].
One strand of research uses data on legal proceedings to measure corrup-tion. For example, Glaeser and Saks [78] compare US states using data on fed-eral corruption convictions, finding that increases in levels of education are re-lated to decreases in corruption. This approach, like the Brazilian audit studiesdescribed above, relies on the presence of an independent source of data oncorruption, in this case the federal government prosecuting corruptions in thedifferent US states.
Golden and Picci measure corruption by tracking the difference between ex-isting public infrastructure and money spent on that infrastructure at the levelof Italian regions using accounting principles [79]. They find, to take just oneexample, that large cities in southern Italy have significantly higher construc-tion costs for public works than their counterparts in northern Italy. In theprivate sector they observe the opposite effect. This is some sense a macroversion of Olken’s approach to measuring corruption by tracking missing ex-penditures [54].
One recent approach by Mungiu-Pippidi and Dadasov [39] quantifies con-trol of corruption at the national level by measuring the quality of formal andinformal institutions which govern the mechanisms by which corruption worksin practice. For instance, high administrative burdens, measured by indica-tors of red tape in domestic bureaucratic regulations, create opportunities forcorruption via selective enforcement. Another indicator of this Index of PublicIntegrity is the independence of the judiciary - which, in theory, constrains cor-ruption by the threat of legal intervention. Though supported by theory, suchmeasures cannot explain the significant variation in corruption within polities,where rules are the same and outcomes are significantly diffferent.
Another approach to detect corruption or fraud in large-scale administrativedata is to compare the observed distribution of digits in public documents (forinstance prices) against benchmarks of “natural” distributions of digits such asBenford’s law [80]. Benford’s law is based on the simple observation that thefirst digit of numbers found in administrative tables usually do not follow auniform distribution. The digit 1 is significantly more likely to occur as the firstdigit of a number than the digit 9, for instance. Researchers use deviations fromsuch statistical laws as evidence phenomena such as voting fraud [80] and themanipulation of national statistics [81].
These methods to measure corruption demonstrate significant improve-ments over the perception-based indicators in terms of bias and detail. Theyall however, depend on specific data which limits their potential for use in com-parative studies, and tend to have limited granularity. One recently developed
CE
UeT
DC
olle
ctio
n
16 CHAPTER 2. RELATED WORK
set of methods to measure corruption using data from public procurement con-tracts addresses many of these concerns. We now present this method, compareit with perception-based indicators, and use it in the rest of the thesis.
Public procurement is the process by which public institutions buy goodsand services from the private sector. Such transactions represent a significantshare of GDP in both developed and developing countries. The OECD estimatesthat between 10 and 20% of GDP is spent annually on procurement among itsmembers [20]. Procurement is a significant locus of corruption according tomany qualitative measures [82]. Indeed, by virtue of the fact that procurementaccounts for a significant amount of the money moving from the public coffersto private bank accounts, it stands to reason that it is one of the major playingfields for actors engaging in grand corruption.
How does corruption in public procurement work? Best practices recom-mended by the EU [83] and international organizations such as the WorldBank [84] suggest that free and fair competition for public contracts to providegoods or services offers the public the best value for money. In this contextcorruption manifests as the favoring of certain private firms to the detrimentof the public good. In practice, corrupt officials adopt a variety of corruptionstrategies to restrict competition [85]. A favored firm, confident that rivals havebeen excluded can charge monopoly prices. It is often the case that administra-tive data on public contracts, which in many jurisdictions must be published,contain markers that such corruption strategies may have been employed. Theautomated detection of these markers or red-flags in the administrative dataof contracts, pioneered by Fazekas [85, 22, 86], offers an objective, micro-levelproxy of corruption risk in the behavior of government bodies.
We will provide a more thorough overview of corruption strategies and theircorresponding risk indicators in Chapter 3. For now we highlight one such in-dicator: whether the contract awarded attracted only a single bidder. Singlebidding is an outcome of the contract process without any competition. Ofcourse this may happen for a variety of reasons: there may only have beenone interested firm, for example. But we will see that aggregated over timeand space, perhaps with adjustments made for the kind of good or service be-ing procured, the tendency of contracts to be awarded to single bidders by aninstitution, town, region, or country has significantly related to other conceptu-alizations of corruption.
We emphasize that such risk indicators are not proof of corrupt behavior.However, they provide a suggestive indicator that can be used by the author-ities and policymakers. The European Court of Auditors has indicated thatprocurement-based risk indicators of corruption are useful measures of “un-detected fraud” [87], signaling to authorities that they are a valid approach to
CE
UeT
DC
olle
ctio
n
2.4. Corruption as Networked Phenomenon 17
finding candidates for investigation. These indicators are also increasingly pop-ular among academics researching the causes and consequences of corruption.They have been used to study the impact of meritocracy on the quality of gov-ernment [88], the effect of political competition on the prevalence of corruptionin municipalities [43], and the impact of discretion on the quality of bureaucraticoutcomes [89].
Beyond the “objectivity” of such indicators, they have several advantages.They are micro-level, quantifying risk at the transactional level. This enablescomparisons between regions and institutions at a far more granular level thanis feasible with surveys. We exploit this advantage in Chapter 3, in which wemeasure the corruption risk of Hungarian settlements using such an approach.Data on procurement is also consistently improving time, with good data avail-able in some jurisdictions going back as much as fifteen years.
2.3.3 Comparison of procurement-based indicators with
perception-based indicators
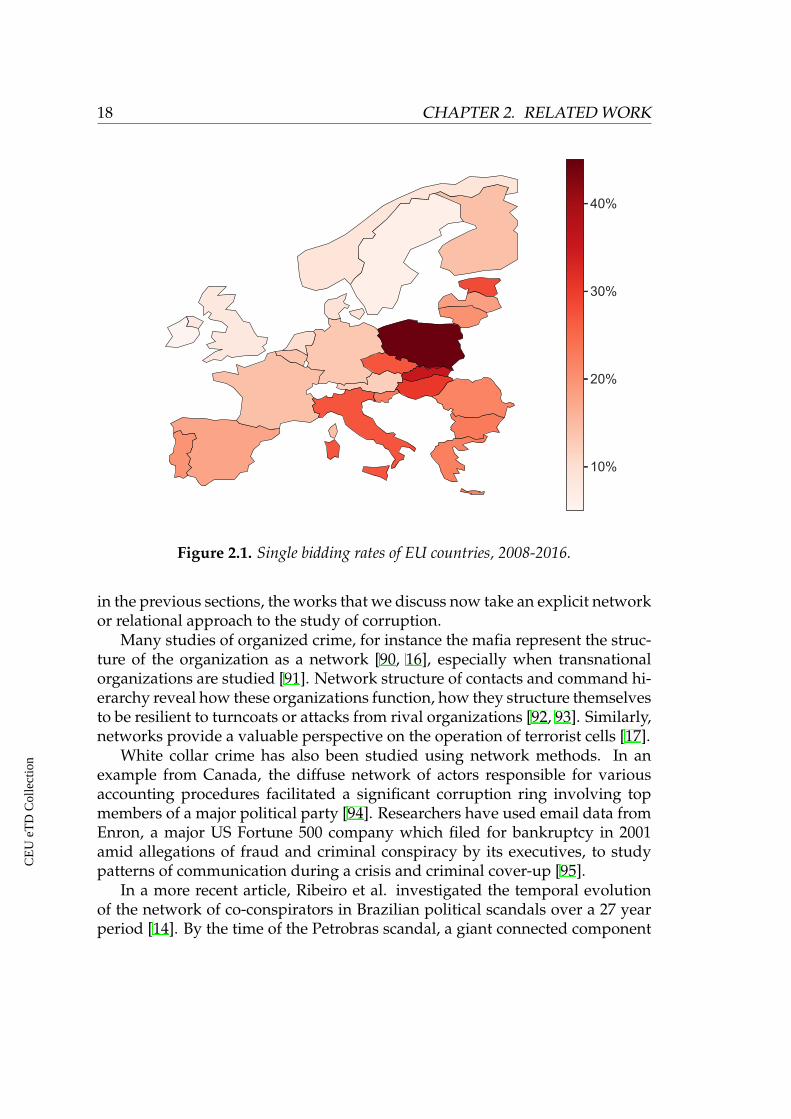
We now compare a simple public-procurement indicator-based measure of cor-ruption risk with various alternative measures of corruption risk based on sur-veys. We use data from Tenders Electronic Daily (TED), the European Union’sportal for public procurement notices and awards. This dataset will be the fo-cus of the analysis in Chapter 4. All tenders estimated above a certain threshold(roughly 5 million Euros for public works contracts and 200 thousand Euros forservices) issued by government bodies in the European Union must be postedin this database. As a simple indicator of corruption risk, we calculate the sin-gle bidding rate of contracts awarded from 2008 to 2016 by each EU country,visualized in Figure 2.1.
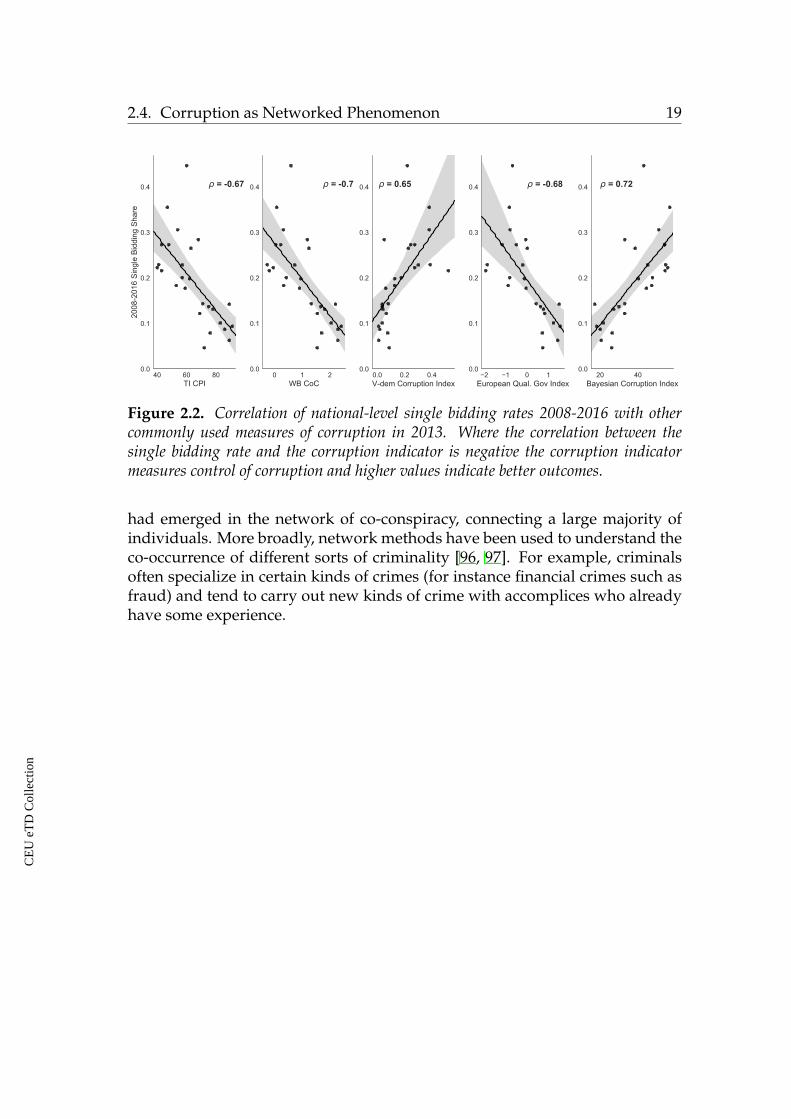
How does this measure correlate with the previously discussed survey-based measures of corruption risk? We find that national single bidding ratescorrelate significantly with a variety of corruption indicators discussed above,ranging in absolute value from .65 to .72.
We will return to the national-level data in Chapter 4, in which we apply net-work science methods to describe the distribution of corruption risk in publicprocurement markets.
2.4 Corruption as Networked Phenomenon
We now turn our attention to past work on corruption, or criminal behaviormore general, which employs network methods or perspective. Though wehave mentioned network-based interpretations of the findings of related work
CE
UeT
DC
olle
ctio
n
18 CHAPTER 2. RELATED WORK
Figure 2.1. Single bidding rates of EU countries, 2008-2016.
in the previous sections, the works that we discuss now take an explicit networkor relational approach to the study of corruption.
Many studies of organized crime, for instance the mafia represent the struc-ture of the organization as a network [90, 16], especially when transnationalorganizations are studied [91]. Network structure of contacts and command hi-erarchy reveal how these organizations function, how they structure themselvesto be resilient to turncoats or attacks from rival organizations [92, 93]. Similarly,networks provide a valuable perspective on the operation of terrorist cells [17].
White collar crime has also been studied using network methods. In anexample from Canada, the diffuse network of actors responsible for variousaccounting procedures facilitated a significant corruption ring involving topmembers of a major political party [94]. Researchers have used email data fromEnron, a major US Fortune 500 company which filed for bankruptcy in 2001amid allegations of fraud and criminal conspiracy by its executives, to studypatterns of communication during a crisis and criminal cover-up [95].
In a more recent article, Ribeiro et al. investigated the temporal evolutionof the network of co-conspirators in Brazilian political scandals over a 27 yearperiod [14]. By the time of the Petrobras scandal, a giant connected component
CE
UeT
DC
olle
ctio
n
2.4. Corruption as Networked Phenomenon 19
Figure 2.2. Correlation of national-level single bidding rates 2008-2016 with othercommonly used measures of corruption in 2013. Where the correlation between thesingle bidding rate and the corruption indicator is negative the corruption indicatormeasures control of corruption and higher values indicate better outcomes.
had emerged in the network of co-conspiracy, connecting a large majority ofindividuals. More broadly, network methods have been used to understand theco-occurrence of different sorts of criminality [96, 97]. For example, criminalsoften specialize in certain kinds of crimes (for instance financial crimes such asfraud) and tend to carry out new kinds of crime with accomplices who alreadyhave some experience.
CE
UeT
DC
olle
ctio
n

20 CHAPTER 2. RELATED WORK
CE
UeT
DC
olle
ctio
n
CHAPTER 3
SOCIAL NETWORKS ANDCORRUPTION
Corruption is a social plague: gains accrue to small groups, while its costs areborne by everyone. Significant variation in its level between and within coun-tries suggests a relationship between social structure and the prevalence of cor-ruption, yet, large scale empirical studies thereof have been missing due to lackof data. In this chapter we relate the structural characteristics of social capi-tal of settlements with corruption in their local governments. Using datasetsfrom Hungary, we quantify corruption risk by suppressed competition and lackof transparency in the settlement’s awarded public contracts. We characterizesocial capital using social network data from a popular online platform. Con-trolling for social, economic, and political factors, we find that settlements withfragmented social networks, indicating an excess of bonding social capital havehigher corruption risk and settlements with more diverse external connectivity,suggesting a surplus of bridging social capital are less exposed to corruption. Weinterpret fragmentation as fostering in-group favoritism and conformity, whichincrease corruption, while diversity facilitates impartiality in public life and sti-fles corruption1.
3.1 Prelude
Corruption is widely recognized to affect adversely social and economic out-comes of societies [99], yet it is difficult to fight [10]. Though education and in-
1A stand-alone version of this chapter is due to be published in Royal Society Open Sci-ence [98]. A preprint is available at https://arxiv.org/abs/1810.05485.
21
CE
UeT
DC
olle
ctio
n
22 CHAPTER 3. SOCIAL NETWORKS AND CORRUPTION
come seem to decrease corruption [78], it persists even under highly developed,democratic conditions, however, showing significant regional differences [44].Researchers often relate corruption to social aspects of society such as segre-gation [100], interpersonal trust [101], civic-mindedness [102], and communityengagement [103]. These approaches build on the insight that corruption is acollective outcome of a community shaped by the interactions among individ-uals [38], suggesting that differences in social capital, especially in the networkstructure, may help explain the persistence of corruption and the observed dif-ferences in its levels.
The concept of social capital or the “connections among individuals – so-cial networks and the norms of reciprocity and trustworthiness that arise fromthem” [103] is usually applied to understand behavior of individuals [104]. Yetcity or country-level aggregations have also proven useful [103], for example instudying economic development and prosperity [105]. As a communal quan-tity, social capital is a sort of public good embedded in a social network [106]of a settlement. Given the aforementioned relationship between corruption andsocial capital, it is therefore, as suggested above, natural to expect that the struc-ture of social capital at the settlement level has considerable impact on the scaleof corruption in that community. Despite significant interest in the network as-pects of corruption [90] and recent experimental evidence that corruption hascollaborative roots [52], less is known about how the patterns of connectivity ofa whole society influences the general level of corruption in its government.
Previous studies of relating social capital and corruption [107, 108] havebeen constrained by two empirical challenges: the difficulty of measuring cor-ruption and the lack of data on network structure at the settlement level. Cor-ruption is one of the most hidden type of crimes therefore it is difficult to es-timate its extent in general, even with significant local information. For exam-ple, an audit study of corruption in rural Indonesia road construction finds thatvillager perceptions of corruption are significantly distorted by factors such asethnic diversity compared to objective measures of corruption [74].
As outlined in Chapter 2, many studies measure corruption using nationalor regional surveys [10] and suffer from the subjectivity of corruption percep-tions [75]. Other studies use data on the frequency of investigations and convic-tions of politicians [78], in which a source of bias may be that in places wherecorruption is prevalent the judiciary is more likely to be corrupt itself [8]. Recentefforts to clean and standardize large datasets on public procurement [22] havebeen very helpful in this context as their study can lead to new, more objectiveindicators of corruption risk.
In the absence of direct network data, researchers often quantify socialcapital using proxies such as rates of voting, donating blood, and volunteer-
CE
UeT
DC
olle
ctio
n
3.1. Prelude 23
ing [102]. As these rates are themselves related to the underlying social net-works, they indicate the relevance of social capital and trust instead of explain-ing the causes of corruption in terms of network structure. Mapping out thesocial capital at the level of settlements using traditional tools is a formidabletask. Fortunately, recent developments in information-communication tech-nologies and their increasing popularity present large data sets containing rel-evant information. For example, data from online social networks and cell-phone records have been used to relate connectivity and socio-economic out-comes [109, 110, 111, 112, 113].
In this Chapter we propose to characterize the level of corruption risk in set-tlements in terms of their social capital using two sources of micro-level datafrom Hungary. We quantify the structural characteristics of settlements’ socialcapital using complete data from “iWiW”, a now defunct online social networkonce used by approximately 40% of the adult Hungarian population [114]. Wemeasure corruption risk using administrative data on public procurement con-tracts over a period of eight years [85].
Public procurement contracts constitute a major channel of public funds toprivate hands and are highly vulnerable to corruption [22]. Recently, a set ofcorruption risk indicators have been derived from public contract data, for ex-ample, counting how often contracts attract only a single bidder. Averaged tothe regional or national levels, these contract-based corruption risk measureshave been shown to correlate with corruption perception surveys [22], qual-ity of government indicators [88], and higher cost outcomes for internationallycomparable goods such as CAT machines [115]. In the Hungarian case, we findthat settlements involved in a recent corruption scandal [116] have significantlyhigher corruption risk in their contracts.
Putnam distinguishes between two structural categories of social capital:bonding and bridging social capital [103], and we expect that these have differentimpacts on corruption risk. Bonding social capital is based on the phenomenonof closure in a social network, describing the extent to which people form dense,homogeneous communities. Such communities have benefits: members sharehigh levels of trust and can count on each other in times of crisis. They canalso be confident that members who defy the norms of the community will becensured [117]. The homogeneity of such tight-knit communities is often basedon ethnicity, religion, or class [118], indicating possible drawbacks to bondingsocial capital: homogeneity facilitates conformity and implies exclusion of out-siders [119]. Solidarity can reach the extent that insiders will protect each othereven if norms from a wider context are broken, in some cases even if crimesare committed. Sophisticated criminal organizations like the Mafia, membersof which may regularly be faced with great incentives to “flip”, rely on bonding
CE
UeT
DC
olle
ctio
n
24 CHAPTER 3. SOCIAL NETWORKS AND CORRUPTION
rituals, ethnic homogeneity, and family ties to enforce solidarity and in-grouptrust [120, 90]. The negative effects of excessive bonding social capital on soci-ety are not limited to crime and corruption. Entrepreneurs embedded in densenetworks are disadvantaged because of pressure to employ under-qualified rel-atives [121], while ethnically homogeneous groups of traders are more likely tooverprice financial assets held by their co-ethnics, causing financial bubbles toform [122].
Bridging social capital, on the other hand, refers to the connections betweenpeople from different social groups. Such ties are valuable for their ability toconvey novel information [123] and exposure to diverse perspectives, thoughthey do not serve as reliable sources of support in hard times. Previous workshows, for instance, that immigrants in the Netherlands with bridging connec-tions outside their ethnic group have significantly higher incomes and employ-ment rates [124]. But bridging social capital is not only thought to be usefulfor the resources it allocates. Using an agent-based model, Macy and Skvoretzshowed how trust emerged among densely connected neighbors and diffusedin a social network via weak ties [62], implying that low bridging social cap-ital restricted trust to within-group interactions. Indeed, empirical evidenceshowed that ethnic groups in diverse communities with more bridging socialcapital evaluate each other more positively [125].
The two concepts of bonding and bridging social capital exist in tensionwith each other. They reflect, to quote Portes, “Durkheim’s distinction be-tween mechanical solidarity, based on social homogeneity and tight personalbonds, and organic solidarity, based on role differentiation, impersonal norms,and an extensive division of labor.” [126]. A settlement in which mutual co-operation relies excessively on mechanical solidarity will tend towards normsof in-group favoritism or particularism [10]. Individuals in such a society willtend to make choices, for example in the allocation of public resources, distin-guishing between insiders and outsiders based on a feeling of security ratherthan trust [127]. In contrast, when cooperation is built on impersonality generaltrust facilitates impartial outcomes.
We therefore pose two hypotheses relating bonding and bridging social cap-ital to local corruption risk. The first (H1) is that excess bonding social capital,indicating the potential presence of norms of in-group favoritism in a settlementis correlated with higher corruption risk in its government. The second (H2) isthat a high level of bridging capital, including connections to other settlements,is correlated with lower levels of corruption risk because it fosters impersonaland universalistic norms. Where mechanical solidarity or bonding social capitaldominate organic solidarity or bridging social capital, universalistic norms un-der which public markets are thought to function best are unsustainable. These
CE
UeT
DC
olle
ctio
n
3.2. Empirical Setting and Methods 25
hypotheses suggest why corruption is so difficult to fight: it is embedded in thesocial network of a place.
Previous work using survey data is in accord with our hypotheses. Harrisfinds a significant positive relationship between excess bonding social capital,measured using surveys, and corruption across over 200 countries [107]. In acomparative study of the 50 US states, Knack finds that residents in states withhigher census response and volunteering rate their governments’ performancesmore highly [128]. He finds no such effect for rates of membership in socialclubs, a more exclusive form of socialization than volunteering. Paccagnella andSestito find that in regions with high electoral turnout and blood donation rates,Italian schoolchildren cheat less frequently on standardized tests. In schoolswith greater ethnic homogeneity and with hometown teachers, cheating is morefrequent [129]. These case studies and indirect evidences give some support theabove hypotheses, however, there is need for studies based on more direct dataat multiple levels.
We find significant evidence for our hypotheses using multivariate regres-sion models to relate corruption risk and structural aspects of social capital.Hungarian settlements with fragmented social networks, which we interpret asevidence of excess bonding social capital, have higher corruption risk in theirpublic procurement contracts. On the other hand, if the typical resident of a set-tlement has more diverse connections, especially over the boundaries of theirown settlements, then local corruption risk is lower. These results hold con-trolling for several potential confounders including economic prosperity, edu-cation, demographics, and political competitiveness.
3.2 Empirical Setting and Methods
3.2.1 Public contracting
Recall that in OECD economies procurement typically accounts for between 10to 20% of GDP [20] covering everything from school lunches to hospital bedsand highway construction. The complexity of the contracts and the relativeinelasticity of the government’s demand for goods make them a prime targetfor corruption [130].
Our framing of corruption in this context, described in Chapter 2, relies ona benchmark of non-corrupt behavior. Contracts are supposed to be awardedusing impartial market mechanisms [131]: open and fair competition for a con-tract is considered the best way to ensure that the government makes purchasesof good quality at the lowest cost. Usually, an issuer of a contract publishes acall for bids from the private sector, setting a deadline for submissions leaving
CE
UeT
DC
olle
ctio
n
26 CHAPTER 3. SOCIAL NETWORKS AND CORRUPTION
enough time for broad participation. Companies submit sealed offers, includ-ing a price. The company offering to provide the good or service for the lowestprice, meeting the standards set in the call for bids, wins the contract.
Measuring settlement corruption risk in contracting
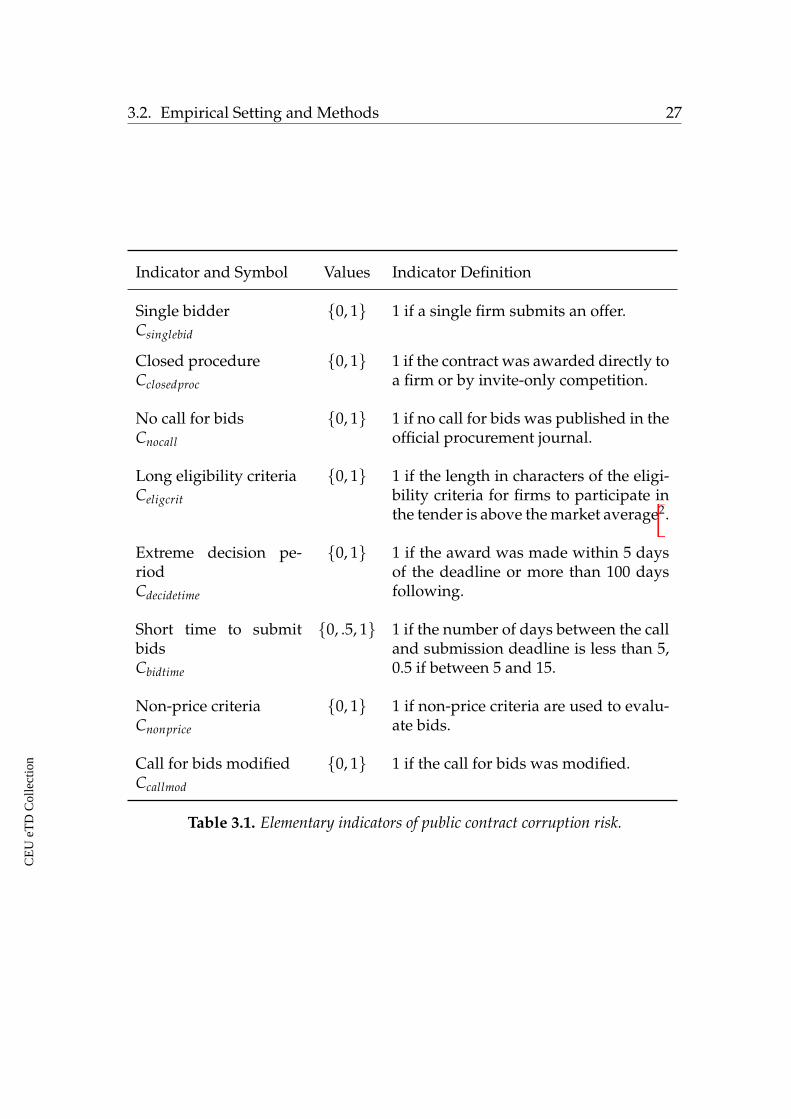
Corruption in public contracting typically involves the restriction of competi-tion. If corrupt bureaucrats wish to award a contract to a favored firm, theymust somehow exclude other firms from participating in the competition forthe contract. We quantify this phenomenon at the contract level by trackingthe presence of elementary corruption indicators, signals we can extract frommetadata suggesting that competition may have been curbed [22]. These quan-titative indicators [85], deduced from qualitative work on corruption in publiccontracting, are the fingerprints of techniques used to steer contracts towardspreferred firms. We consider eight such elementary indicators, defined in Ta-ble 3.1.
From these eight elementary indicators we define two measures of contractcorruption risk. Closed procedure or single bidding (Ccsb): Did the contract at-tract only a single bid or was the contract awarded by some procedure besidesan open call for bids, for example by direct negotiation with a firm or by aninvitation-only auction? In terms of the indicators defined above:
Ccsb = max(Csinglebid, Cclosedproc)
Corruption Risk Index (CRI): Following [85], we average all eight elementaryindicators defined in Table 3.1 for each contract.
CRI =18(Csinglebid + Cclosedproc + Cnocall + Celigcrit + Cbidtime
+Cnonprice + Ccallmod + Cdecidetime)
These indicator-based measures of corruption risk have been related to tra-ditional measures of corruption at the regional and national levels. AmongEU countries, similar indicators are correlated (r ⇡ .5) with both the WorldBank’s Control of Corruption rankings and Transparency International’s Cor-ruption Perceptions Index [22]. We propose that our indicators supplementthese perception-based measures with more objective data at a micro-scale.
Our indicators also predict cost overruns and price inflation in Europeaninfrastructure projects [115]. At the micro-level, public bodies issuing high cor-ruption risk contracts are significantly more likely to award contracts to new
CE
UeT
DC
olle
ctio
n
3.2. Empirical Setting and Methods 27
Indicator and Symbol Values Indicator Definition
Single bidderCsinglebid
{0, 1} 1 if a single firm submits an offer.
Closed procedureCclosedproc
{0, 1} 1 if the contract was awarded directly toa firm or by invite-only competition.
No call for bidsCnocall
{0, 1} 1 if no call for bids was published in theofficial procurement journal.
Long eligibility criteriaCeligcrit
{0, 1} 1 if the length in characters of the eligi-bility criteria for firms to participate inthe tender is above the market average2.
Extreme decision pe-riodCdecidetime
{0, 1} 1 if the award was made within 5 daysof the deadline or more than 100 daysfollowing.
Short time to submitbidsCbidtime
{0, .5, 1} 1 if the number of days between the calland submission deadline is less than 5,0.5 if between 5 and 15.
Non-price criteriaCnonprice
{0, 1} 1 if non-price criteria are used to evalu-ate bids.
Call for bids modifiedCcallmod
{0, 1} 1 if the call for bids was modified.
Table 3.1. Elementary indicators of public contract corruption risk.
CE
UeT
DC
olle
ctio
n
28 CHAPTER 3. SOCIAL NETWORKS AND CORRUPTION
companies after a change in government [133]. Finally, evidence from the USsuggests that firms making campaign contributions are awarded contracts withhigher corruption risk [134].
Each indicator quantifies different ways bureaucrats have excluded com-petitors in qualitative work on ground truth corruption cases from around theEU [85]. We stress that while no individual indicator or composite measure cancredibly suggest that an individual contract was awarded by a corrupt process,aggregated over many contracts issued by the same institution these indicatorsmap highly suggestive patterns. This point is an important motivation for fil-tering out towns awarding less than five contracts a year. We now describe thecorruption techniques behind each indicator in greater detail.
• Single bidder (Csinglebid) is an outcome: was the contract awarded in acompetition attracting only a single offer. At once this captures the suc-cess of the other corruption techniques used to restrict competition, andcovers those cases in which some other unobserved strategy was usedsuccessfully.
• Closed procedure (Cclosedproc indicates when the contracting authority hasdecided to award a contract by direct negotiation with a firm or via aninvitation-only bidding process. This decision can be used to completelysubvert competition. A sophisticated bureaucrat may invite uninterestedfirms or other firms controlled by friendly actors besides the target firm inorder to present a pretense of competition.
• No call for bids (Cnocall) indicates when, in the case that the contract wasawarded via an open competition, no contract announcement or call forbids was published in the official procurement journal. A corrupt officialcan greatly decrease the chance of non-favored firms participating by lim-iting access to information.
• Long eligibility criteria (Celigcrit) captures how bureaucrats can box outspecific firms by adding requirements to participation criteria. By in-cluding many such restrictions (regarding previous experience, companysize, qualifications), a corrupt bureaucrat can systematically exclude non-favored firms.
• Extreme decision period (Cdecidetime highlights suspicious activity betweenthe end of a competition and the decision to award a contract. If the deci-sion period is extremely short, this suggests that the decision to awarda specific firm was premeditated, and that the bids were not carefullychecked. If the decision period is very long, it may indicate that legalchallenges about the contract may be delaying the award decision.
CE
UeT
DC
olle
ctio
n
3.2. Empirical Setting and Methods 29
• Short time to submit bids (Cbidtime) indicates that favored firms may havebeen tipped off about a competition for tenders ahead of the public an-nouncement. By leaving only a short time between the announcementand the award for non-favored firms, the corrupt official makes it verydifficult to submit a bid. It is important to remember that bids are com-plex legal documents, including at times cost estimates, schematics, andreferences.
• Non-price criteria (Cnonprice) tracks the share of non-price related or sub-jective criteria in the evaluation of bids. For instance, a corrupt bureaucratmay reject a lower cost bid if, according to a subjective criteria of the qual-ity of a bid, it is less favorably evaluated than that of a higher cost bid of afavored firm.
• Call for bids modified (Ccallmod) checks to see if a call for bids was mod-ified between the initial announcment and the deadline. This potentialcorruption strategy closely emulates Cbidtime in that a corrupt official cansuddenly change the specifications or rules of a tender shortly before thedeadline.
Local Government Contracting Data
We examine 20,524 municipal government contracts from the period of 2006-2014 issued by Hungarian settlements awarding at least five contracts a year onaverage. We exclude towns issuing fewer contracts because we are interestedin systematic patterns of corruption over a sustained period of time. Our indi-cators applied to individual contracts are only noisy measures of corruption -it is rather the consistent observation of red flags in contracting over time thatsuggests that a town has a significant problem with persistent corruption risk.Our results are robust to including towns issuing at least one contract per yearon average, reported in the SI Table 7.4.
Our goal is to quantify the overall level of corruption risk in a settlementover the full period for which we have data. We create two such scores byaveraging the risk indicators defined above over all contracts issued by the set-tlement. We arrive at two measures of settlement corruption risk: the rate atwhich a settlement issued closed-procedure or single bid contracts (Ccsb), andthe average Corruption Risk Index (CRI) score of its contracts.
There are 169 settlements in Hungary meeting the minimum contracting cri-terion, excluding Budapest. We exclude Budapest for two reasons: it is a severeoutlier in size and economic importance and because of its unique governancestructure. Budapest is split into 23 districts, each with its own local governmentand mayor. It also has a city-wide government and mayor. As iWiW does not
CE
UeT
DC
olle
ctio
n
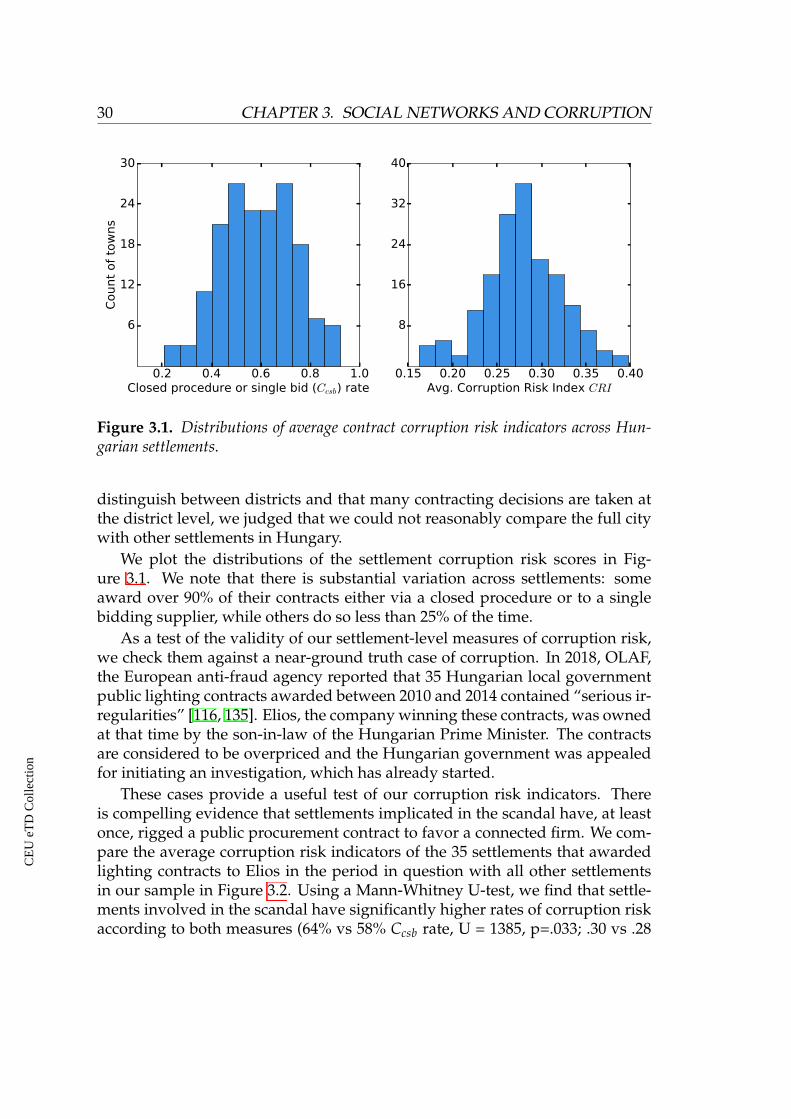
30 CHAPTER 3. SOCIAL NETWORKS AND CORRUPTION
Figure 3.1. Distributions of average contract corruption risk indicators across Hun-garian settlements.
distinguish between districts and that many contracting decisions are taken atthe district level, we judged that we could not reasonably compare the full citywith other settlements in Hungary.
We plot the distributions of the settlement corruption risk scores in Fig-ure 3.1. We note that there is substantial variation across settlements: someaward over 90% of their contracts either via a closed procedure or to a singlebidding supplier, while others do so less than 25% of the time.
As a test of the validity of our settlement-level measures of corruption risk,we check them against a near-ground truth case of corruption. In 2018, OLAF,the European anti-fraud agency reported that 35 Hungarian local governmentpublic lighting contracts awarded between 2010 and 2014 contained “serious ir-regularities” [116, 135]. Elios, the company winning these contracts, was ownedat that time by the son-in-law of the Hungarian Prime Minister. The contractsare considered to be overpriced and the Hungarian government was appealedfor initiating an investigation, which has already started.
These cases provide a useful test of our corruption risk indicators. Thereis compelling evidence that settlements implicated in the scandal have, at leastonce, rigged a public procurement contract to favor a connected firm. We com-pare the average corruption risk indicators of the 35 settlements that awardedlighting contracts to Elios in the period in question with all other settlementsin our sample in Figure 3.2. Using a Mann-Whitney U-test, we find that settle-ments involved in the scandal have significantly higher rates of corruption riskaccording to both measures (64% vs 58% Ccsb rate, U = 1385, p=.033; .30 vs .28
CE
UeT
DC
olle
ctio
n
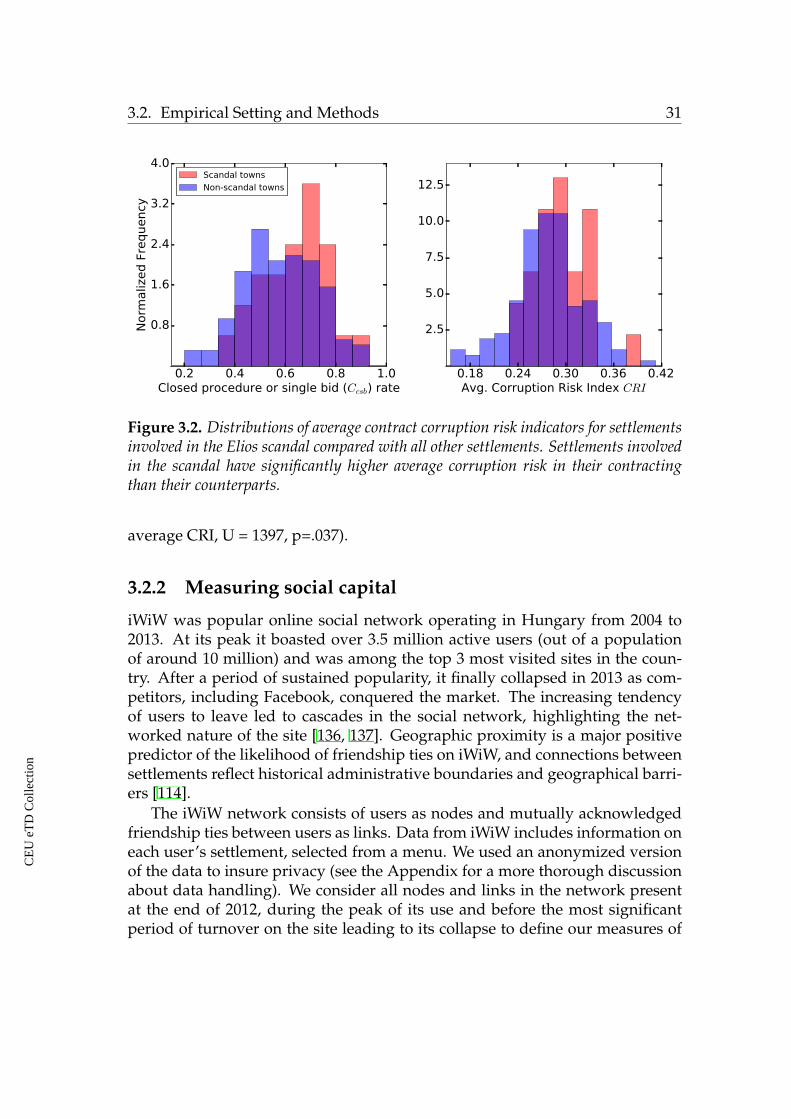
3.2. Empirical Setting and Methods 31
Figure 3.2. Distributions of average contract corruption risk indicators for settlementsinvolved in the Elios scandal compared with all other settlements. Settlements involvedin the scandal have significantly higher average corruption risk in their contractingthan their counterparts.
average CRI, U = 1397, p=.037).
3.2.2 Measuring social capital
iWiW was popular online social network operating in Hungary from 2004 to2013. At its peak it boasted over 3.5 million active users (out of a populationof around 10 million) and was among the top 3 most visited sites in the coun-try. After a period of sustained popularity, it finally collapsed in 2013 as com-petitors, including Facebook, conquered the market. The increasing tendencyof users to leave led to cascades in the social network, highlighting the net-worked nature of the site [136, 137]. Geographic proximity is a major positivepredictor of the likelihood of friendship ties on iWiW, and connections betweensettlements reflect historical administrative boundaries and geographical barri-ers [114].
The iWiW network consists of users as nodes and mutually acknowledgedfriendship ties between users as links. Data from iWiW includes information oneach user’s settlement, selected from a menu. We used an anonymized versionof the data to insure privacy (see the Appendix for a more thorough discussionabout data handling). We consider all nodes and links in the network presentat the end of 2012, during the peak of its use and before the most significantperiod of turnover on the site leading to its collapse to define our measures of
CE
UeT
DC
olle
ctio
n
32 CHAPTER 3. SOCIAL NETWORKS AND CORRUPTION
bonding and bridging social capital. We consider this aggregate network ratherthan an evolving network from year to year because we do not have in our data(in contrast with the repeated links that can be observed in cellular phone calldata) and because we are interested in a long-run characterization of the socialnetwork structure of settlements. We describe steps we took to clean the dataand the distribution of use rates at the settlement level in the SI.
Despite valid concerns about the representativity of data taken from onlinesocial networks [138], studies indicate data from online social networks offera useful picture of the social capital of their users [139, 140]. As adoption ofonline social networks increases, they become increasingly useful for the studyof the social structures [141]. In any case, we control for possible confoundingfactors including settlement average income, rate of iWiW use, and share of thepopulation over 60 in our models.
Fragmentation
Our first settlement-level network measure, fragmentation, quantifies the extentto which people in the settlement form densely connected and well separatedcommunities. We do not consider the links residents of a settlement have withother settlements. Fragmentation measures a settlement’s bonding social cap-ital. Before we proceed, we note that settlement will always be used to referto a municipality, while community refers to a group of nodes detected in theiWiW social network of a settlement using a network science algorithm, in otherwords a subset of the nodes of the town which are densely connected.
We measure fragmentation of the settlement’s internal social network usinga community detection method to identify communities of highly connectednodes. We use the Louvain algorithm [142], a popular and efficient methodleading to a partition of the network. We measure the quality of the partition,the tendency of edges to be within rather than between the detected commu-nities, using modularity [143]. Given a social network of users in a settlementS and a partition of the network’s nodes into K communities, the modularityQ(S) of the partition of the network can be written as:
Q(S) =K
Âk=1
hLwk
L�⇣Lk
L
⌘2i,
where L is the total number of edges in the considered network, Lk is the num-ber of edges adjacent to members of community k, and Lw
k is the number ofedges within community k.
As modularity is highly dependent on the size and density of the net-work [144], we scale each settlement’s modularity score in order to make valid
CE
UeT
DC
olle
ctio
n
3.2. Empirical Setting and Methods 33
comparisons between the settlements. Following Sah et al. [145], we divide eachsettlement’s modularity score by the theoretical maximum modularity Qmax(S)that the given partition could achieve, namely if all edges were within commu-nities.
Qmax(S) =K
Âk=1
hLkL
�⇣Lk
L
⌘2i.
We then define the fragmentation FS of a settlement S as the quotient
FS = Q(S)/Qmax(S). (3.1)
Fragmentation measures the tendency of individuals to belong to distinct com-munities within a settlement. A fragmented settlement consists of tightly-knitcommunities that are weakly connected. Both the excess of connections withinand the rarity of connections between communities in fragmented networks arerelevant to our theoretical framing of the origins of corruption as they indicateexcess bonding social capital. The high density of connections within a com-munity facilitates the enforcement of reciprocity, while having few connectionsbetween communities fosters particularism.
To better understand the concept of fragmentation, we compare two settle-ments, one at the 90th percentile of fragmentation (settlement A) and the otherat the 10th percentile (settlement B). The two settlements have populations ofroughly 10,000 and have iWiW user rates between 30 and 35%. We randomlysample 300 users from both social networks for the sake of visualization andplot their connections in Figure 3.3. Settlement A is clearly more fragmentedthan settlement B. We also show the full adjacency matrices of the networksof these settlements, grouping nodes by their detected communities into blockson the diagonal shaded in red. We label each community by the share of itsedges staying within the community. The fragmented settlement has a clearover-representation of within-community edges.
Diversity
Past research on online social networks noted that users connect with peoplefrom a variety of focal experiences in their life-course [140]. For example a usermay connect with her schoolmates, university classmates, coworkers, family,and friends from environments including social clubs, sports teams, or religiouscommunities. We measure the diversity of an individual user’s network by the(lack of) overlap between these foci. In this case, we do not restrict our attentionto edges between users from the same settlement.
CE
UeT
DC
olle
ctio
n
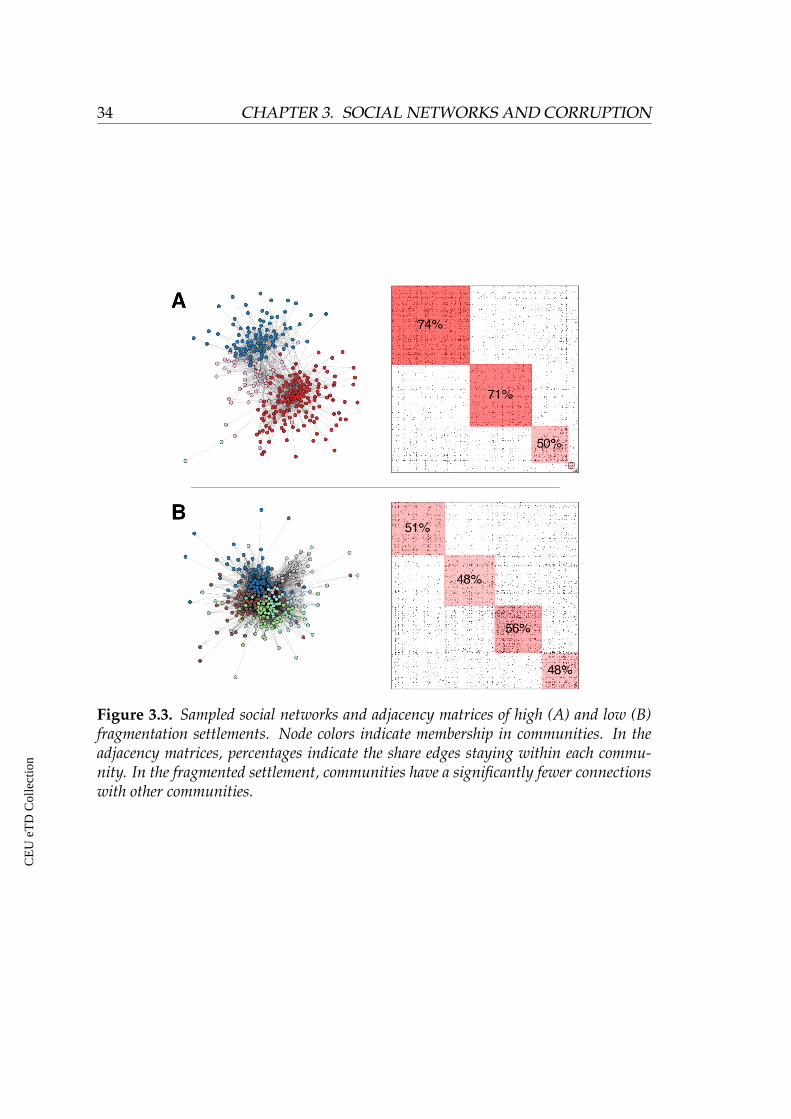
34 CHAPTER 3. SOCIAL NETWORKS AND CORRUPTION
Figure 3.3. Sampled social networks and adjacency matrices of high (A) and low (B)fragmentation settlements. Node colors indicate membership in communities. In theadjacency matrices, percentages indicate the share edges staying within each commu-nity. In the fragmented settlement, communities have a significantly fewer connectionswith other communities.
CE
UeT
DC
olle
ctio
n
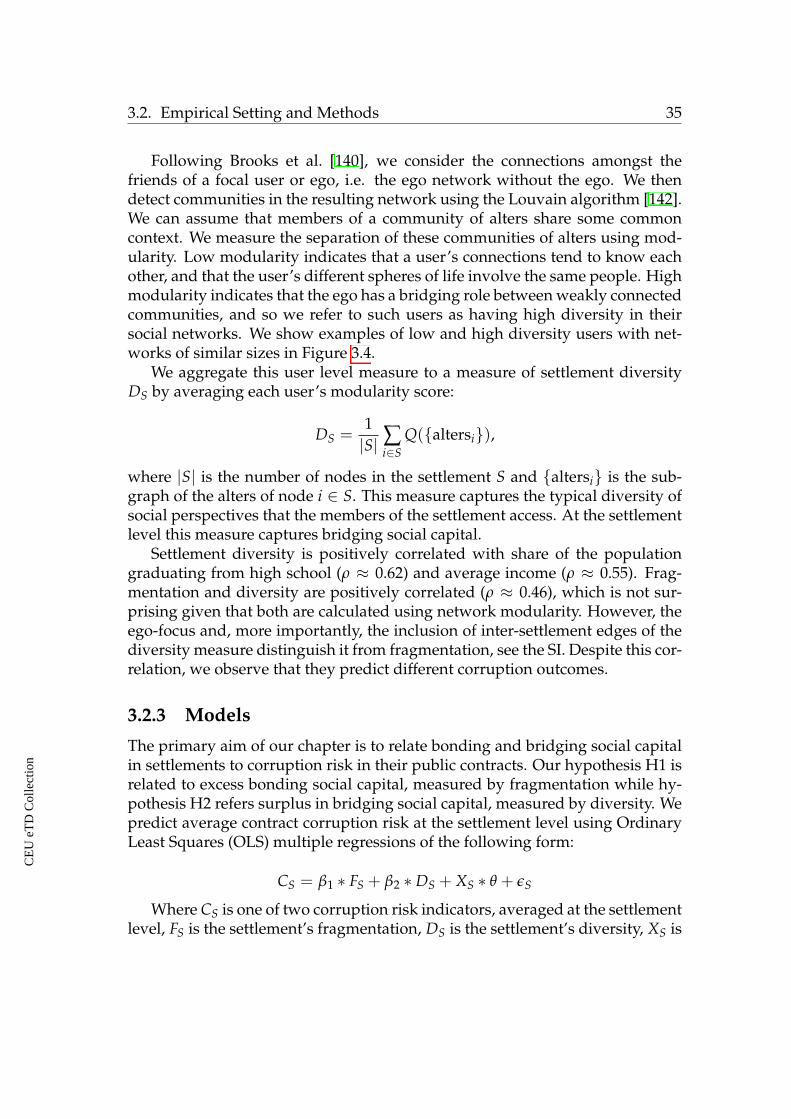
3.2. Empirical Setting and Methods 35
Following Brooks et al. [140], we consider the connections amongst thefriends of a focal user or ego, i.e. the ego network without the ego. We thendetect communities in the resulting network using the Louvain algorithm [142].We can assume that members of a community of alters share some commoncontext. We measure the separation of these communities of alters using mod-ularity. Low modularity indicates that a user’s connections tend to know eachother, and that the user’s different spheres of life involve the same people. Highmodularity indicates that the ego has a bridging role between weakly connectedcommunities, and so we refer to such users as having high diversity in theirsocial networks. We show examples of low and high diversity users with net-works of similar sizes in Figure 3.4.
We aggregate this user level measure to a measure of settlement diversityDS by averaging each user’s modularity score:
DS =1|S| Â
i2SQ({altersi}),
where |S| is the number of nodes in the settlement S and {altersi} is the sub-graph of the alters of node i 2 S. This measure captures the typical diversity ofsocial perspectives that the members of the settlement access. At the settlementlevel this measure captures bridging social capital.
Settlement diversity is positively correlated with share of the populationgraduating from high school (r ⇡ 0.62) and average income (r ⇡ 0.55). Frag-mentation and diversity are positively correlated (r ⇡ 0.46), which is not sur-prising given that both are calculated using network modularity. However, theego-focus and, more importantly, the inclusion of inter-settlement edges of thediversity measure distinguish it from fragmentation, see the SI. Despite this cor-relation, we observe that they predict different corruption outcomes.
3.2.3 Models
The primary aim of our chapter is to relate bonding and bridging social capitalin settlements to corruption risk in their public contracts. Our hypothesis H1 isrelated to excess bonding social capital, measured by fragmentation while hy-pothesis H2 refers surplus in bridging social capital, measured by diversity. Wepredict average contract corruption risk at the settlement level using OrdinaryLeast Squares (OLS) multiple regressions of the following form:
CS = b1 ⇤ FS + b2 ⇤ DS + XS ⇤ q + eS
Where CS is one of two corruption risk indicators, averaged at the settlementlevel, FS is the settlement’s fragmentation, DS is the settlement’s diversity, XS is
CE
UeT
DC
olle
ctio
n
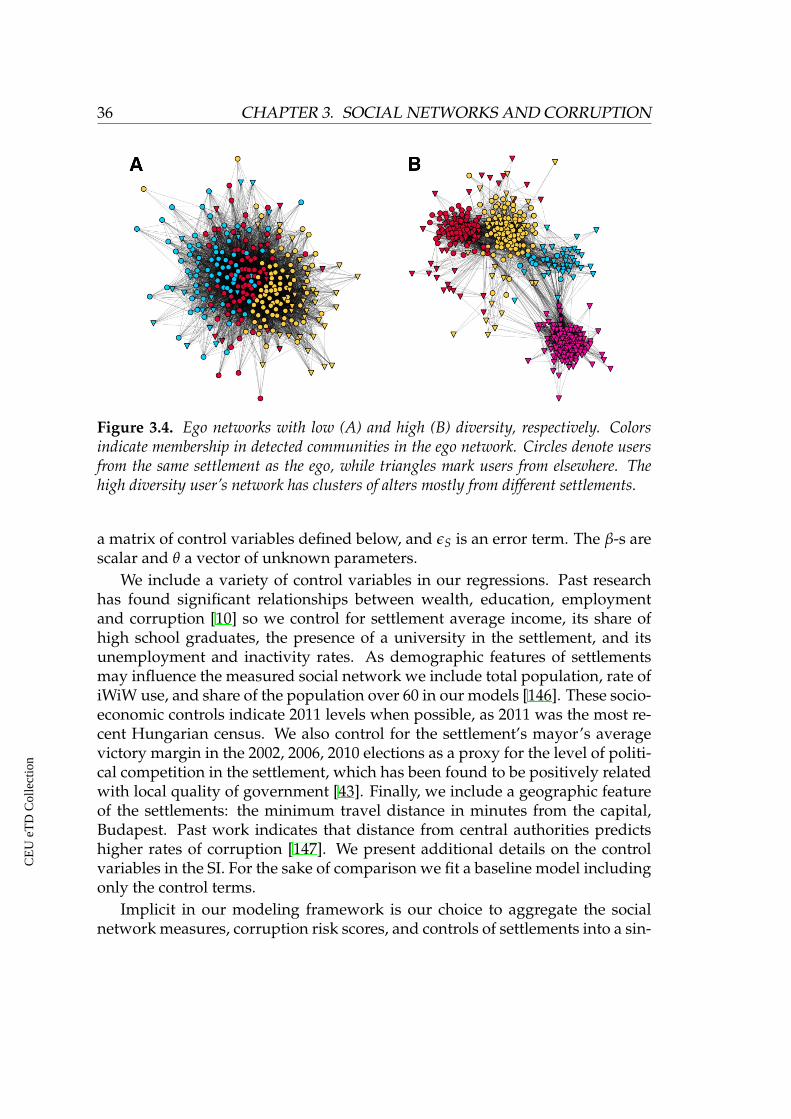
36 CHAPTER 3. SOCIAL NETWORKS AND CORRUPTION
Figure 3.4. Ego networks with low (A) and high (B) diversity, respectively. Colorsindicate membership in detected communities in the ego network. Circles denote usersfrom the same settlement as the ego, while triangles mark users from elsewhere. Thehigh diversity user’s network has clusters of alters mostly from different settlements.
a matrix of control variables defined below, and eS is an error term. The b-s arescalar and q a vector of unknown parameters.
We include a variety of control variables in our regressions. Past researchhas found significant relationships between wealth, education, employmentand corruption [10] so we control for settlement average income, its share ofhigh school graduates, the presence of a university in the settlement, and itsunemployment and inactivity rates. As demographic features of settlementsmay influence the measured social network we include total population, rate ofiWiW use, and share of the population over 60 in our models [146]. These socio-economic controls indicate 2011 levels when possible, as 2011 was the most re-cent Hungarian census. We also control for the settlement’s mayor’s averagevictory margin in the 2002, 2006, 2010 elections as a proxy for the level of politi-cal competition in the settlement, which has been found to be positively relatedwith local quality of government [43]. Finally, we include a geographic featureof the settlements: the minimum travel distance in minutes from the capital,Budapest. Past work indicates that distance from central authorities predictshigher rates of corruption [147]. We present additional details on the controlvariables in the SI. For the sake of comparison we fit a baseline model includingonly the control terms.
Implicit in our modeling framework is our choice to aggregate the socialnetwork measures, corruption risk scores, and controls of settlements into a sin-
CE
UeT
DC
olle
ctio
n
3.3. Results 37
gle snapshot. Contracts range from 2006 to 2014, iWiW friendships from 2002to 2012, and controls are set at 2011 levels (corresponding to the last Hungar-ian census). As we are studying the relationship between social structure andcorruption, both long-run phenomena, we claim that this represents sufficienttemporal overlap.
3.3 Results
We summarize our findings in Table 3.2. We see that there is a significant rela-tionship between social network structure and both dependent variables mea-suring corruption. More fragmentation consistently predicts more corruption,while more diversity consistently predicts less corruption. In both cases addingthe network features significantly improves the adjusted R2 of the model. More-over, comparing the coefficients, we see that the social network features haveeffect sizes comparable to that of any social, political, or economic control. Wepresent the full models in the SI, including the intermediate models containingonly one network feature. All models pass a variance inflation factor (VIF) testfor feature collinearity, see the SI.
We visualize the effects of our network variables in Figure 3.5. We plotmodel predicted rate of closed procedure or single bid contract awards (Ccsb)including 90% confidence intervals for varying levels of fragmentation and av-erage ego diversity. As the variables are standardized, the units can be inter-preted as standard deviations from the mean (at 0). We observe that, all elseequal, our model predicts that going from one standard deviation below aver-age fragmentation to one standard deviation above average, increases Ccsb byabout one half of a standard deviation. Diversity has a stronger effect in theother direction: the same change (from one standard deviation below averageto one above average) induces a full standard deviation decrease in the corrup-tion indicator. The effect of the network features on CCRI is similar. In the SI,we present an ANOVA feature importance test that indicates the significance ofboth network-based features.
3.4 Discussion
In this chapter we used data from an online social network and a collectionof public procurement contracts to relate the social capital of Hungarian settle-ments to the corruption in its local government. To our knowledge, this studyis the first to study social aspects of corruption using large-scale social networkdata.
CE
UeT
DC
olle
ctio
n
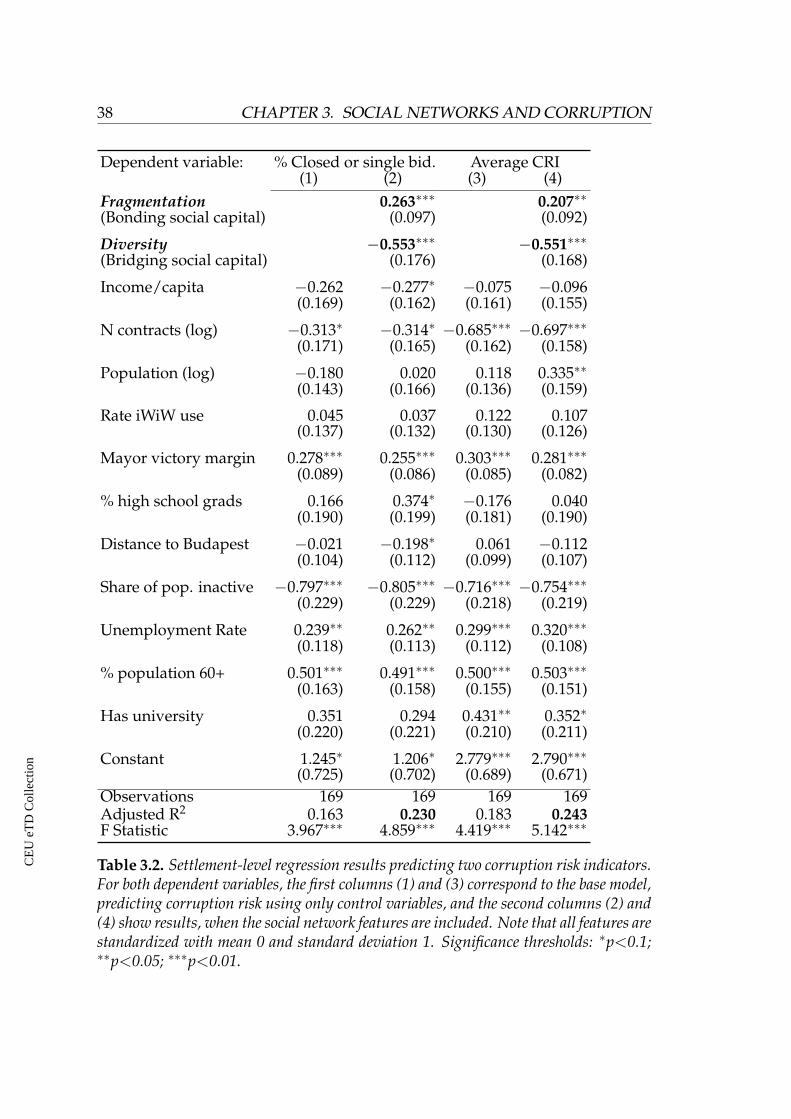
38 CHAPTER 3. SOCIAL NETWORKS AND CORRUPTION
Dependent variable: % Closed or single bid. Average CRI(1) (2) (3) (4)
Fragmentation 0.263⇤⇤⇤
0.207⇤⇤
(Bonding social capital) (0.097) (0.092)
Diversity �0.553⇤⇤⇤ �0.551
⇤⇤⇤
(Bridging social capital) (0.176) (0.168)
Income/capita �0.262 �0.277⇤ �0.075 �0.096(0.169) (0.162) (0.161) (0.155)
N contracts (log) �0.313⇤ �0.314⇤ �0.685⇤⇤⇤ �0.697⇤⇤⇤(0.171) (0.165) (0.162) (0.158)
Population (log) �0.180 0.020 0.118 0.335⇤⇤(0.143) (0.166) (0.136) (0.159)
Rate iWiW use 0.045 0.037 0.122 0.107(0.137) (0.132) (0.130) (0.126)
Mayor victory margin 0.278⇤⇤⇤ 0.255⇤⇤⇤ 0.303⇤⇤⇤ 0.281⇤⇤⇤(0.089) (0.086) (0.085) (0.082)
% high school grads 0.166 0.374⇤ �0.176 0.040(0.190) (0.199) (0.181) (0.190)
Distance to Budapest �0.021 �0.198⇤ 0.061 �0.112(0.104) (0.112) (0.099) (0.107)
Share of pop. inactive �0.797⇤⇤⇤ �0.805⇤⇤⇤ �0.716⇤⇤⇤ �0.754⇤⇤⇤(0.229) (0.229) (0.218) (0.219)
Unemployment Rate 0.239⇤⇤ 0.262⇤⇤ 0.299⇤⇤⇤ 0.320⇤⇤⇤(0.118) (0.113) (0.112) (0.108)
% population 60+ 0.501⇤⇤⇤ 0.491⇤⇤⇤ 0.500⇤⇤⇤ 0.503⇤⇤⇤(0.163) (0.158) (0.155) (0.151)
Has university 0.351 0.294 0.431⇤⇤ 0.352⇤(0.220) (0.221) (0.210) (0.211)
Constant 1.245⇤ 1.206⇤ 2.779⇤⇤⇤ 2.790⇤⇤⇤(0.725) (0.702) (0.689) (0.671)
Observations 169 169 169 169Adjusted R2 0.163 0.230 0.183 0.243
F Statistic 3.967⇤⇤⇤ 4.859⇤⇤⇤ 4.419⇤⇤⇤ 5.142⇤⇤⇤
Table 3.2. Settlement-level regression results predicting two corruption risk indicators.For both dependent variables, the first columns (1) and (3) correspond to the base model,predicting corruption risk using only control variables, and the second columns (2) and(4) show results, when the social network features are included. Note that all features arestandardized with mean 0 and standard deviation 1. Significance thresholds: ⇤p<0.1;⇤⇤p<0.05; ⇤⇤⇤p<0.01.
CE
UeT
DC
olle
ctio
n
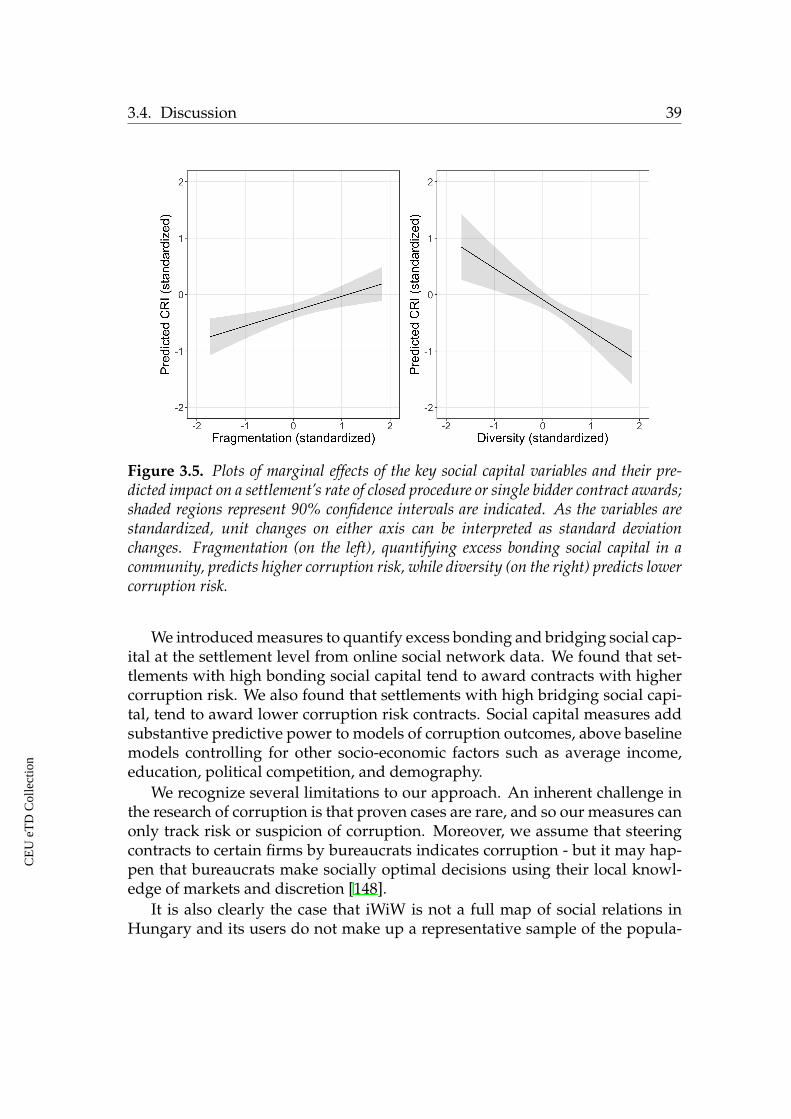
3.4. Discussion 39
Figure 3.5. Plots of marginal effects of the key social capital variables and their pre-dicted impact on a settlement’s rate of closed procedure or single bidder contract awards;shaded regions represent 90% confidence intervals are indicated. As the variables arestandardized, unit changes on either axis can be interpreted as standard deviationchanges. Fragmentation (on the left), quantifying excess bonding social capital in acommunity, predicts higher corruption risk, while diversity (on the right) predicts lowercorruption risk.
We introduced measures to quantify excess bonding and bridging social cap-ital at the settlement level from online social network data. We found that set-tlements with high bonding social capital tend to award contracts with highercorruption risk. We also found that settlements with high bridging social capi-tal, tend to award lower corruption risk contracts. Social capital measures addsubstantive predictive power to models of corruption outcomes, above baselinemodels controlling for other socio-economic factors such as average income,education, political competition, and demography.
We recognize several limitations to our approach. An inherent challenge inthe research of corruption is that proven cases are rare, and so our measures canonly track risk or suspicion of corruption. Moreover, we assume that steeringcontracts to certain firms by bureaucrats indicates corruption - but it may hap-pen that bureaucrats make socially optimal decisions using their local knowl-edge of markets and discretion [148].
It is also clearly the case that iWiW is not a full map of social relations inHungary and its users do not make up a representative sample of the popula-
CE
UeT
DC
olle
ctio
n
40 CHAPTER 3. SOCIAL NETWORKS AND CORRUPTION
tion. Finally, we do not claim to have found a causal link between social capitaland corruption risk. Besides the potential of omitted variable bias, it is highlylikely that corruption also influences social capital in the long run [149].
Despite these limitations we believe that our findings are valuable. Aboveall, our novel, data-based, settlement-level approach provides new evidence forthe old hypothesis that corruption is a structural phenomenon. Our finding thatsocial structure relates to corruption risk suggests, for example, why appointingan ombudsman in a corrupt place rarely improves corruption outcomes [10]and why anti-corruption laws can backfire if they conflict with prevailing socialnorms [150].
That is not to say that fighting corruption is futile. Rather we believe ourfindings suggest that top-down efforts are unlikely to work unless they impactsocial capital or other significant covariates of our model like political compe-tition. Our conclusions hint at potential mechanisms which sustain corruption.Factors such as racial segregation or economic inequality which may drive frag-mentation are ideal targets for policy interventions [101].
CE
UeT
DC
olle
ctio
n
CHAPTER 4
CORRUPTION AND PROCUREMENTMARKETS
4.1 Prelude
In this chapter we map public procurement markets as bipartite networks of is-suers (alternatively buyers, public institutions) and winners (suppliers, firms) ofcontracts. Using corruption risk indicators, we study the relationship betweencorruption risk and micro-, meso-, and macro-level structure of markets. Wefind that corruption risk is related to various structural properties of the mar-ket captured by its network structure, and that important heterogeneities existamong EU countries. We present findings using a dataset of over four millioncontracts awarded across the European Union between 2008 and 20161.
Bipartite networks have been used to study a wide variety of phenomenainvolving two distinct sets of actors, for example buyers and sellers in mar-kets [151], flowers and their pollinators [152], and cities and industries [153].As public procurement markets consist of two kinds interacting of actors (is-suers and winners), they fit into this paradigm. We create networks of buyersand suppliers at the national level and describe their structure using the toolsof network science.
As in the case of unipartite networks, empirical bipartite networks oftenexhibit certain regularities that distinguish them from random networks. Forexample the nodes in such networks tend to have heterogeneous degree distri-
1This chapter partially draws on work that is under review at a journal at the time ofsubmission of the thesis [86]. A preprint is available at http://www.govtransparency.eu/
wp-content/uploads/2017/09/Fazekas_Wachs_Skuhrovec_CorruptionNetwork_Structure_
in_CZ_HU_2017.pdf.
41
CE
UeT
DC
olle
ctio
n
42 CHAPTER 4. CORRUPTION AND PROCUREMENT MARKETS
butions, meaning that certain nodes sometimes referred to as hubs have ordersof magnitude more connections than other nodes. We show that procurementmarkets are no exception to this observed pattern, having heterogeneous degreedistributions among both winners and issuers.
Some of the most interesting empirical regularities observed in real-worldnetworks extend beyond the node level, describing structures at so-called meso-scopic scales. One example of a structure commonly found in empirical net-works is the so called core-periphery structure. By filtering a network for itsmost important connections, referred to as the core of the network, using thenetwork topology we can simultaneously highlight key actors and measure thecentralization of a network [154, 155]. Core-finding methods have been usedto analyze networks of trade [156], success in creative industries [157], and po-litical organization [158]. We apply a method to our data that considers boththe weight of connections between issuers and winners, and the bipartite na-ture of our networks. Besides distinguishing important actors in the market,the relative size of the core and the share of contracts between core members isa measure of the centralization of a market. Indeed we find that there is a sig-nificant variation in the share of contracts between core issuers and firms acrossthe EU countries.
Another example of mesoscopic network structure that occurs frequentlyin empirical networks is modularity. As we saw in the previous chapter, socialnetworks are often modular [143] because of factors such as homophily or socialsegregation [159]. Modularity in a network derived from market interactionsmerits its own interpretation. It may indicate the degree of specialization ina market - i.e. if firms tend focus on providing a narrower set of goods andservices - or the effects of geography. Using a method adapted especially forbipartite networks, we partition procurement markets into communities andfind that they have significant modularity. We then analyze the distributionof corruption risk across the different modules of a market. Corruption riskmay be concentrated in a few specific sectors, or it may be spread rather evenlythroughout the entire market.
Combined with the overall prevalence of corruption risk in a country, weare able to describe in much more detail the shape of corruption risk and itsorganization using these methods. While two countries may have the sameoverall level of corruption risk in their public contracting, its distribution canbe different. In one case the corruption risk may be highly clustered in certaincommunities and more common in the periphery of the market. In another, cor-ruption may be evenly spread around the market, with no specific hot-spots ofcorruption, and on average more common in its core. Such an perspective of-fers a powerful diagnostic tool to researchers of corruption. Certainly effective
CE
UeT
DC
olle
ctio
n
4.2. Data 43
prescriptions to combat corruption would be different in these two cases.To emphasize the dynamics of corruption risk, we also analyze how changes
in government effect high corruption risk winners in the core of the network.We test the survival of winning firms across two years intervals, finding that insome countries winners are more stable across changes of government, whilein others they are less likely to survive. More abstractly speaking, this analysisquantifies the political organization of corruption in the different EU countries.
We proceed by introducing the data, describing how it can be representedas a bipartite network, defining measures of the resulting networks, and com-paring network structure with corruption risk indicators. We find significantdifferences between countries, beyond what can be explained by differences inthe overall prevalence of corruption risk. We conclude with a discussion ofthese findings.
4.2 Data
Our data is collected from Tenders Electronic Daily2 (TED) - the official journal ofpublic procurement contracts of the European Union. TED includes both callsfor tenders and award announcements of contracts from all member states inthe European Union. TED estimates the total value of tenders published in ayear is worth approximately 420 billion Euro - a significant share of EU GDP(2.8% in 2016). EU law requires, with some rare exceptions, that all public pro-curement contracts estimated in value above a certain threshold issued by mem-ber states be reported on the website. In 2016 these thresholds were 135, 000Euro for service and supply contracts, and 5.2 million Euro for works contracts.Though a significant amount of procurement takes place below this threshold(and in most cases is recorded in national or regional level data portals), we useonly TED data above the threshold in order to maximize cross-national compa-rability. One drawback to our use of TED is that corrupt actors have significantincentives to issue contracts just under the reporting threshold [160], leading toan underestimation of corruption risk in certain countries or markets.
Our dataset consists of 4,098,711 contracts awarded between 2008 and 2016from 26 member states of the EU3. We exclude contracts awarded by the Euro-pean Institutions, for example the European Commission and European Parlia-ment, as we are interested in a comparison between countries. As issuers andwinners of public contracts are named by raw text string at the contract level,and not by unique identifiers (i.e. by EU VAT ID or other national tax ids), we
2https://ted.europa.eu/
3We exclude Luxembourg because it issues relatively very few contracts, and Croatia be-cause it joined the EU only in 2013.
CE
UeT
DC
olle
ctio
n
44 CHAPTER 4. CORRUPTION AND PROCUREMENT MARKETS
first created an algorithm to identify and merge aliases referring to the same is-suers and winners, country by country. In the computer science literature, sucha task is known as deduplication or record-linkage. Deduplication in general isa difficult problem because comparing all pairs of N potentially distinct entitieswill require in general on the order of N2 comparison. Our method follows theoverall approach outlined by Christen [161], consisting of five steps:
• Preprocessing: we process at the contract level each issuer and winner’sname, street address, postal code, and country fields by lower-casing allcharacters and removing punctuation and superfluous white space.
• Choosing a measure of similarity: we quantify the similarity of two en-tities using an active learning approach [162] implemented in the DedupePython programming library [163]. For each field in a record, the methoddefines several measures of similarity. For instance, the text names of twowinners can be compared using a measure of string edit distance (count-ing for instance the number of insertions and deletions required to trans-form one string into another), the overlap of shared words, or the sim-ilarity of the first characters in each word. The algorithm selects a smallsample of pairs of records and calculates a large number of similarity mea-sures. It presents the user with those examples of pairs of records whichit is most unsure about. The algorithm learns both which similarity mea-sures are productive in the classification of pairs of records and how andin what proportion they should be combined to achieve the best accuracy.By labeling 100 such examples, the user can greatly increase the accuracyof the deduplication procedure. We ran this algorithm and manually clas-sified 100 examples for both winners and issuers for each country in ourdataset.
• Choosing records to compare: As mentioned, there are many possiblerecords to compare. Comparing all pairs of 1,000 records for examplewould require making roughly 500,000 comparisons. France alone has364,125 unique winner names. Moreover, since the method of comparingrecords learned in the previous step requires the calculation of multiplemeasures of similarity, it is important to reduce the space of searches ina clever way. This is accomplished via a technique called blocking: therecords are split into groups based on simple features such as sharing thesame first three characters in their name (i.e. Microsoft and Microsystemswould be placed in the same block) or sharing the same first character inthe first two tokens of their names (i.e. Air France and Air Finland wouldbe placed in the same block). Blocking is not a strict partition: records canbe placed in multiple blocks. Using the same sample of manually labeled
CE
UeT
DC
olle
ctio
n
4.3. Markets as Bipartite Networks 45
candidate matches, the computer program learns which blocks are mosteffective for maximizing the trade-off between accuracy and the numberof comparisons that need to be calculated.
• Grouping similar records: Once the similarity of records for all pairs ofissuers or winners in all blocks have been calculated, we use a hierarchi-cal clustering method to determine which records should be identified asduplicates.
• Selecting a threshold in the clustering: Again, relying on the manuallychecked sample of records we select a threshold that weighs false pos-itives (i.e. two records which do not refer to the same entity in reality,but are merged) and false negatives (i.e. two records which refer to thesame entity in reality but are not merged) equally. The overall accuracyof our approach, while varying for issuers and winners and country bycountry, exceeds 90% on the sample of difficult to classify cases identifiedby the software. The number of unique winners in France, for example,decreases from 364,125 to 200,584 after the procedure.
Equipped with this deduplicated set of issuers and winners, we can, withsignificantly greater confidence, represent the interactions between actors as anetwork. We are also interested, of course, in quantify corruption risk at the con-tract level, as we did in the previous chapter. Unfortunately, data inconsistencyacross both time and countries in the TED data limit us in this regard. After anevaluation of the various potential corruption risk indicators, their stability overtime within countries, and the rate at which data was missing, we concludedthat a single indicator - single bidding - was the most appropriate measure ofcorruption risk. We have already presented the correlations between this mea-sure, aggregated over time, and other perception-based measures of corruptionrisk in Chapter 2, finding a national level correlation between the rate of singlebidding and measures such as Transparency International’s Corruption Percep-tions Index and the World Bank’s Control of Corruption measure of between .6and .7.
4.3 Markets as Bipartite Networks
Given a collection of contracts awarded by issuers to winners from a givencountry in a year, we construct a network as follows. The nodes consist ofissuers and winners of public contracts. An issuer and winner are connectedby an edge if they are in a contracting relationship that year. The edge has aweight, initialized at 1, that increases in the count of contracts entered between
CE
UeT
DC
olle
ctio
n
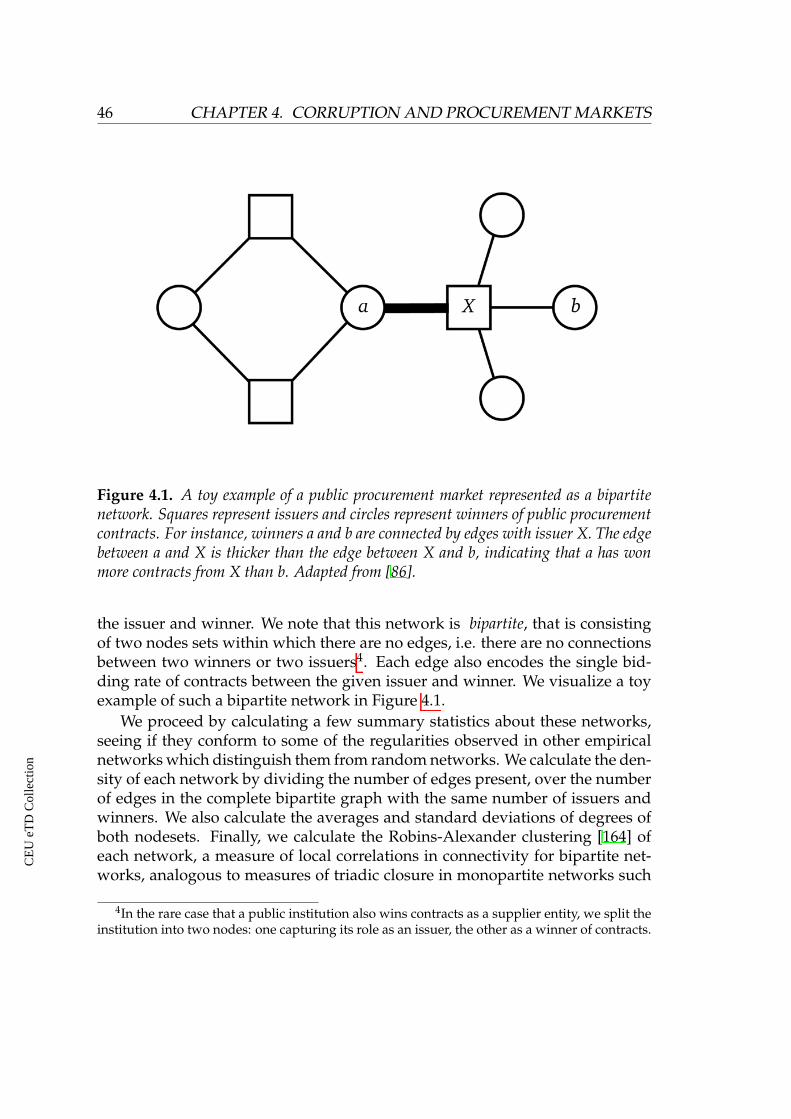
46 CHAPTER 4. CORRUPTION AND PROCUREMENT MARKETS
Figure 4.1. A toy example of a public procurement market represented as a bipartitenetwork. Squares represent issuers and circles represent winners of public procurementcontracts. For instance, winners a and b are connected by edges with issuer X. The edgebetween a and X is thicker than the edge between X and b, indicating that a has wonmore contracts from X than b. Adapted from [86].
the issuer and winner. We note that this network is bipartite, that is consistingof two nodes sets within which there are no edges, i.e. there are no connectionsbetween two winners or two issuers4. Each edge also encodes the single bid-ding rate of contracts between the given issuer and winner. We visualize a toyexample of such a bipartite network in Figure 4.1.
We proceed by calculating a few summary statistics about these networks,seeing if they conform to some of the regularities observed in other empiricalnetworks which distinguish them from random networks. We calculate the den-sity of each network by dividing the number of edges present, over the numberof edges in the complete bipartite graph with the same number of issuers andwinners. We also calculate the averages and standard deviations of degrees ofboth nodesets. Finally, we calculate the Robins-Alexander clustering [164] ofeach network, a measure of local correlations in connectivity for bipartite net-works, analogous to measures of triadic closure in monopartite networks such
4In the rare case that a public institution also wins contracts as a supplier entity, we split theinstitution into two nodes: one capturing its role as an issuer, the other as a winner of contracts.
CE
UeT
DC
olle
ctio
n
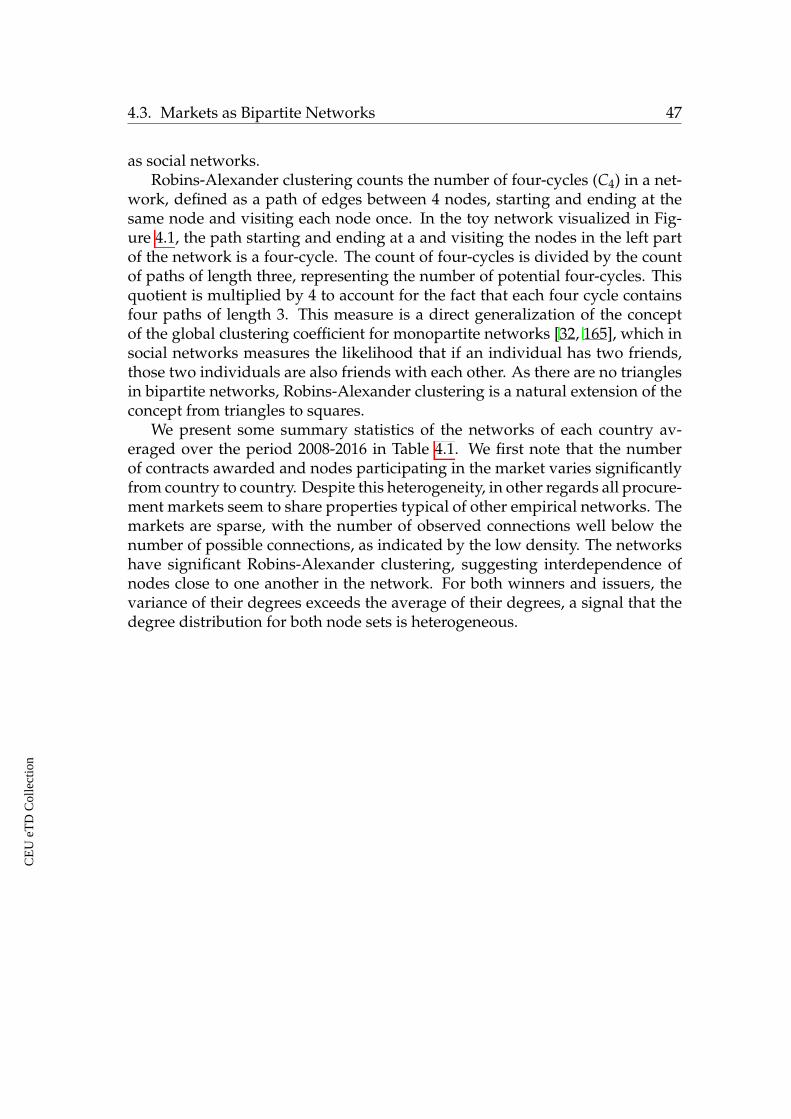
4.3. Markets as Bipartite Networks 47
as social networks.Robins-Alexander clustering counts the number of four-cycles (C4) in a net-
work, defined as a path of edges between 4 nodes, starting and ending at thesame node and visiting each node once. In the toy network visualized in Fig-ure 4.1, the path starting and ending at a and visiting the nodes in the left partof the network is a four-cycle. The count of four-cycles is divided by the countof paths of length three, representing the number of potential four-cycles. Thisquotient is multiplied by 4 to account for the fact that each four cycle containsfour paths of length 3. This measure is a direct generalization of the conceptof the global clustering coefficient for monopartite networks [32, 165], which insocial networks measures the likelihood that if an individual has two friends,those two individuals are also friends with each other. As there are no trianglesin bipartite networks, Robins-Alexander clustering is a natural extension of theconcept from triangles to squares.
We present some summary statistics of the networks of each country av-eraged over the period 2008-2016 in Table 4.1. We first note that the numberof contracts awarded and nodes participating in the market varies significantlyfrom country to country. Despite this heterogeneity, in other regards all procure-ment markets seem to share properties typical of other empirical networks. Themarkets are sparse, with the number of observed connections well below thenumber of possible connections, as indicated by the low density. The networkshave significant Robins-Alexander clustering, suggesting interdependence ofnodes close to one another in the network. For both winners and issuers, thevariance of their degrees exceeds the average of their degrees, a signal that thedegree distribution for both node sets is heterogeneous.
CE
UeT
DC
olle
ctio
n
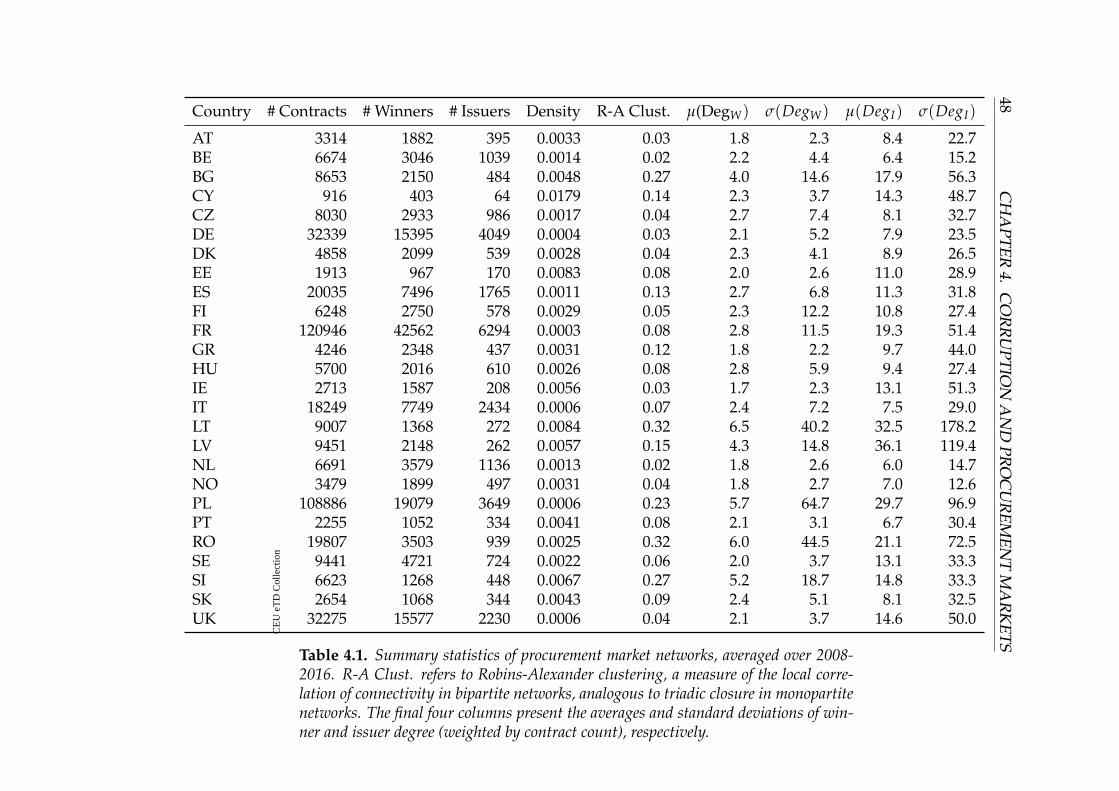
48C
HA
PTER4.
CO
RR
UPTIO
NA
ND
PRO
CU
REM
ENT
MA
RK
ETSCountry # Contracts # Winners # Issuers Density R-A Clust. µ(DegW) s(DegW) µ(DegI) s(DegI)
AT 3314 1882 395 0.0033 0.03 1.8 2.3 8.4 22.7BE 6674 3046 1039 0.0014 0.02 2.2 4.4 6.4 15.2BG 8653 2150 484 0.0048 0.27 4.0 14.6 17.9 56.3CY 916 403 64 0.0179 0.14 2.3 3.7 14.3 48.7CZ 8030 2933 986 0.0017 0.04 2.7 7.4 8.1 32.7DE 32339 15395 4049 0.0004 0.03 2.1 5.2 7.9 23.5DK 4858 2099 539 0.0028 0.04 2.3 4.1 8.9 26.5EE 1913 967 170 0.0083 0.08 2.0 2.6 11.0 28.9ES 20035 7496 1765 0.0011 0.13 2.7 6.8 11.3 31.8FI 6248 2750 578 0.0029 0.05 2.3 12.2 10.8 27.4FR 120946 42562 6294 0.0003 0.08 2.8 11.5 19.3 51.4GR 4246 2348 437 0.0031 0.12 1.8 2.2 9.7 44.0HU 5700 2016 610 0.0026 0.08 2.8 5.9 9.4 27.4IE 2713 1587 208 0.0056 0.03 1.7 2.3 13.1 51.3IT 18249 7749 2434 0.0006 0.07 2.4 7.2 7.5 29.0LT 9007 1368 272 0.0084 0.32 6.5 40.2 32.5 178.2LV 9451 2148 262 0.0057 0.15 4.3 14.8 36.1 119.4NL 6691 3579 1136 0.0013 0.02 1.8 2.6 6.0 14.7NO 3479 1899 497 0.0031 0.04 1.8 2.7 7.0 12.6PL 108886 19079 3649 0.0006 0.23 5.7 64.7 29.7 96.9PT 2255 1052 334 0.0041 0.08 2.1 3.1 6.7 30.4RO 19807 3503 939 0.0025 0.32 6.0 44.5 21.1 72.5SE 9441 4721 724 0.0022 0.06 2.0 3.7 13.1 33.3SI 6623 1268 448 0.0067 0.27 5.2 18.7 14.8 33.3SK 2654 1068 344 0.0043 0.09 2.4 5.1 8.1 32.5UK 32275 15577 2230 0.0006 0.04 2.1 3.7 14.6 50.0
Table 4.1. Summary statistics of procurement market networks, averaged over 2008-2016. R-A Clust. refers to Robins-Alexander clustering, a measure of the local corre-lation of connectivity in bipartite networks, analogous to triadic closure in monopartitenetworks. The final four columns present the averages and standard deviations of win-ner and issuer degree (weighted by contract count), respectively.
CE
UeT
DC
olle
ctio
n
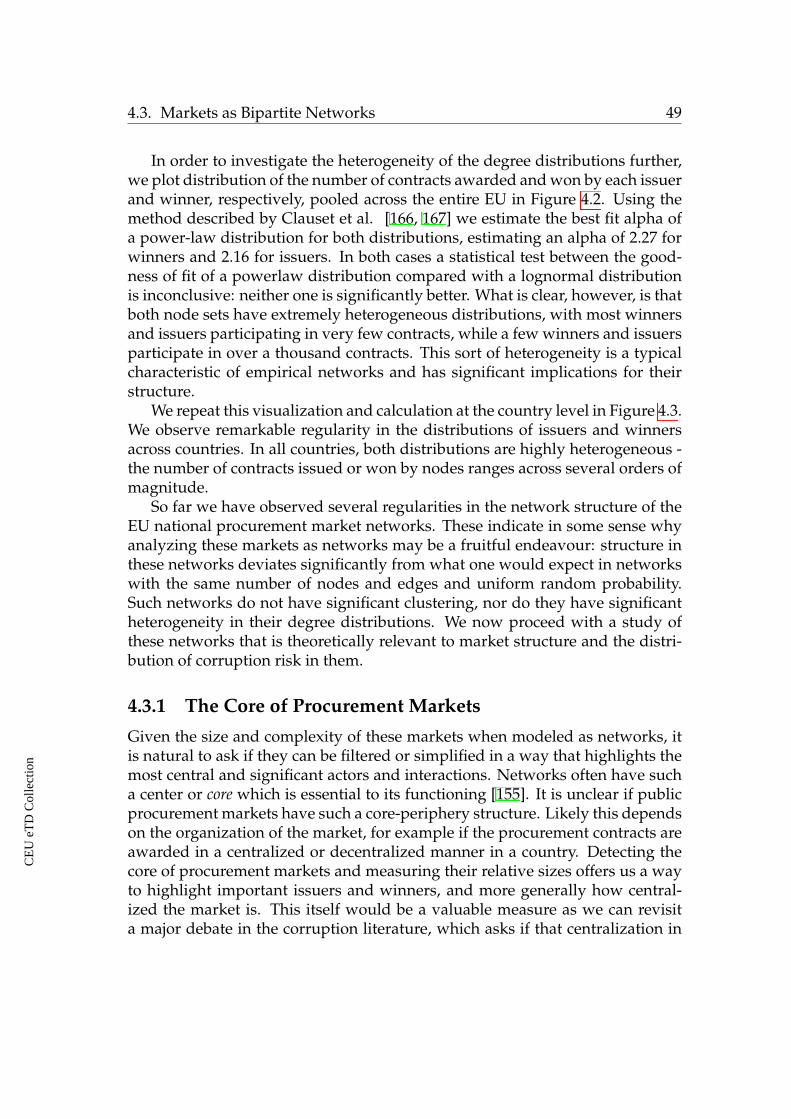
4.3. Markets as Bipartite Networks 49
In order to investigate the heterogeneity of the degree distributions further,we plot distribution of the number of contracts awarded and won by each issuerand winner, respectively, pooled across the entire EU in Figure 4.2. Using themethod described by Clauset et al. [166, 167] we estimate the best fit alpha ofa power-law distribution for both distributions, estimating an alpha of 2.27 forwinners and 2.16 for issuers. In both cases a statistical test between the good-ness of fit of a powerlaw distribution compared with a lognormal distributionis inconclusive: neither one is significantly better. What is clear, however, is thatboth node sets have extremely heterogeneous distributions, with most winnersand issuers participating in very few contracts, while a few winners and issuersparticipate in over a thousand contracts. This sort of heterogeneity is a typicalcharacteristic of empirical networks and has significant implications for theirstructure.
We repeat this visualization and calculation at the country level in Figure 4.3.We observe remarkable regularity in the distributions of issuers and winnersacross countries. In all countries, both distributions are highly heterogeneous -the number of contracts issued or won by nodes ranges across several orders ofmagnitude.
So far we have observed several regularities in the network structure of theEU national procurement market networks. These indicate in some sense whyanalyzing these markets as networks may be a fruitful endeavour: structure inthese networks deviates significantly from what one would expect in networkswith the same number of nodes and edges and uniform random probability.Such networks do not have significant clustering, nor do they have significantheterogeneity in their degree distributions. We now proceed with a study ofthese networks that is theoretically relevant to market structure and the distri-bution of corruption risk in them.
4.3.1 The Core of Procurement Markets
Given the size and complexity of these markets when modeled as networks, itis natural to ask if they can be filtered or simplified in a way that highlights themost central and significant actors and interactions. Networks often have sucha center or core which is essential to its functioning [155]. It is unclear if publicprocurement markets have such a core-periphery structure. Likely this dependson the organization of the market, for example if the procurement contracts areawarded in a centralized or decentralized manner in a country. Detecting thecore of procurement markets and measuring their relative sizes offers us a wayto highlight important issuers and winners, and more generally how central-ized the market is. This itself would be a valuable measure as we can revisita major debate in the corruption literature, which asks if that centralization in
CE
UeT
DC
olle
ctio
n
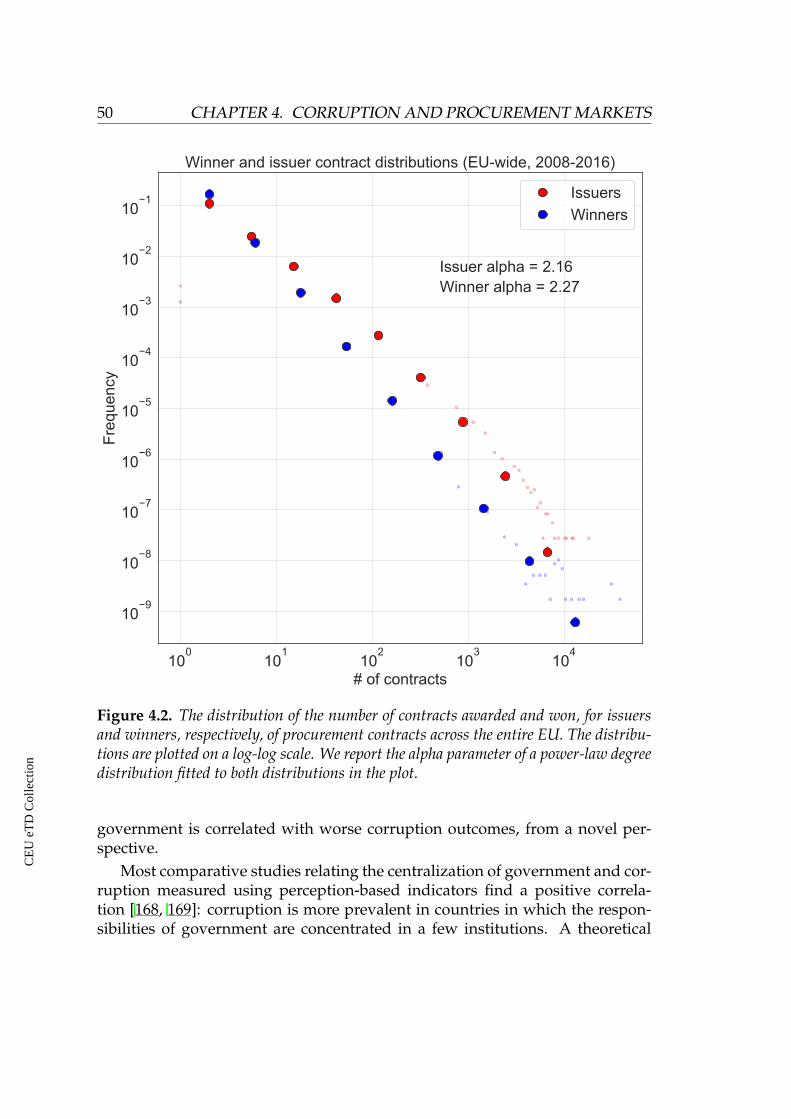
50 CHAPTER 4. CORRUPTION AND PROCUREMENT MARKETS
Figure 4.2. The distribution of the number of contracts awarded and won, for issuersand winners, respectively, of procurement contracts across the entire EU. The distribu-tions are plotted on a log-log scale. We report the alpha parameter of a power-law degreedistribution fitted to both distributions in the plot.
government is correlated with worse corruption outcomes, from a novel per-spective.
Most comparative studies relating the centralization of government and cor-ruption measured using perception-based indicators find a positive correla-tion [168, 169]: corruption is more prevalent in countries in which the respon-sibilities of government are concentrated in a few institutions. A theoretical
CE
UeT
DC
olle
ctio
n
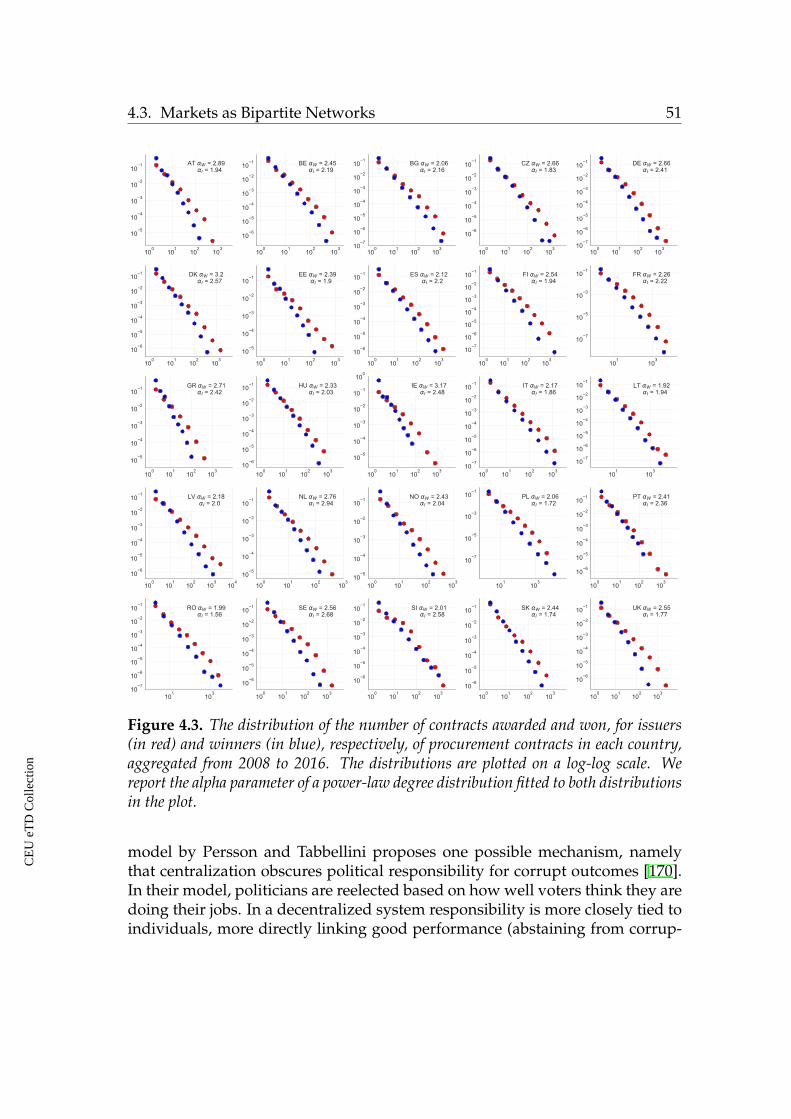
4.3. Markets as Bipartite Networks 51
Figure 4.3. The distribution of the number of contracts awarded and won, for issuers(in red) and winners (in blue), respectively, of procurement contracts in each country,aggregated from 2008 to 2016. The distributions are plotted on a log-log scale. Wereport the alpha parameter of a power-law degree distribution fitted to both distributionsin the plot.
model by Persson and Tabbellini proposes one possible mechanism, namelythat centralization obscures political responsibility for corrupt outcomes [170].In their model, politicians are reelected based on how well voters think they aredoing their jobs. In a decentralized system responsibility is more closely tied toindividuals, more directly linking good performance (abstaining from corrup-
CE
UeT
DC
olle
ctio
n
52 CHAPTER 4. CORRUPTION AND PROCUREMENT MARKETS
tion) with rewards (reelection). In a centralized system it is harder for voters toobserve which politicians are responsible for which outcomes. Yet Charron etal. find that within country variance of the EQI quality of governance indicatoris not correlated with government centralization [44].
Going beyond the overall level of corruption risk in a country’s procurementmarket, a decomposition of its participants into core and periphery allows us totest if corruption risk itself is centralized or decentralized in a given country. Inthe former case, the central government itself may be captured by corrupt in-terests [133], while in the latter case corruption may simply be an opportunisticaction taken by less important actors. This is an important distinction which hasbeen applied to the organization of corruption in organization [171] and amongcrooked police officers [172].
There are many methods to extract key nodes in a network. A popular ap-proach which considers not only a node’s individual importance, but that of itsneighbors as well, is known as core decomposition [173, 155]. The general ideaof core decomposition is to organize nodes of a given network into a hierarchi-cal ranking according to their connectivity in an iterative way. Such methodshave been used in biology [174], economics [175], and sociology [176]. We firstintroduce the concept of the and k-core of a monopartite, unweighted network.We then explain how to extend this concept to the particular case of weighted,bipartite networks, of which our mapping of public procurement markets areexamples.
The core number of a node in a network is defined iteratively [173]. First wecalculate the degree of each node. All nodes of degree 1 are assigned core num-ber 1. We then remove all such nodes and recalculate the degree of all remainingnodes. In this new graph we assign core number 2 to any nodes with degree 1,and again remove them and repeat the procedure. The procedure ends whenall nodes have been assigned a core number. The core number is a hierarchicalranking of the nodes which can be used to define the k-cores of a network. A k-core is the collection of nodes with core number at least k. Researchers are ofteninterested in the maximal k-core of a network, defined as the highest value k forwhich any nodes have core number k [177].
One reason the k-core decomposition method is so popular is that there isan efficient algorithm to calculate the core number of all nodes in a network(O(log(m)) - where m is the number of edges in a network [178]. For a broadsurvey of network core decomposition methods and applications we refer tothe survey paper by Malliaros et al. [179].
Applying a core decomposition method to public procurement markets re-quire us to modify the definition of the original k-core algorithm in two ways:to consider the weights on the edges (encoding the frequency of the contracting
CE
UeT
DC
olle
ctio
n
4.3. Markets as Bipartite Networks 53
relationship between an issuer and a winner) and the bipartite nature of the net-work. The latter factor is important because, as we saw in the previous section,the two node sets typically have distinct distributions.
In order to incorporate edge weights into our approach to finding the coreof procurement market networks, we follow a similar approach Garas et al. intheir extension of the k-core method to weighted networks [175]. Rather thaniteratively pruning the network based on the degree of the nodes, we do thesame using node strength, defined as the sum of weights on edges adjacent to anode. As all of the edge weights in our networks are integers (as they are countsof contract awards), we are able to repeat the same pruning process describeabove for unweighted networks: remove all nodes with strength equal to 1,recalculate the strengths, and repeat - assigning the corresponding weightedcore-numbers to each node as they are pruned.
This leaves a question: at what weighted k-core number do we consider anode to be a member of the periphery? By introducing node strengths basedon heterogeneous weights, it is very likely that the maximal weighted k-corewill be very small [175]. We also want to apply the same method to networksof different sizes and compare the results, suggesting that we need to considera cutoff that is a function of the distribution of the strength of the nodes, forexample its average. A final concern is that the distribution of node strengths isdifferent for issuers and winners in a given network.
We address these concerns by using separate weighted core number cut-offs for the two node sets, namely their averages. In other words, a winner(respectively issuer) is considered to be in the core if its weighted-core num-ber is greater than the average weighted degree of all winners (issuers) in thenetwork. Instead of applying the same cutoff across all countries (and acrossnode sets), this cutoff adapts to the size of the network and the distributions ofconnectivity observed in them. We visualize the core of the Hungarian procure-ment market over time in Figure 4.4, highlight connections with above averagesingle bidding rates (relative to the whole market) in red.
It is worth noting several things from this visualization. The first is thatour adaptation of the general idea of k-cores to bipartite, weighted procure-ment market networks returns relatively dense networks. In other applicationsof k-core methods the density of connections among the core nodes is oftenhighlighted to indicate that these nodes are distinguished in the network notonly because they have many connections, but because they interact with othersuch nodes [179]. Second, the size of the core seems stable, indicating that themethod itself is not overly sensitive to perturbations in the networks from yearto year. On the other hand the mesoscopic structure of the network does seemto undergo interesting changes over time - compare the modularity of the core
CE
UeT
DC
olle
ctio
n
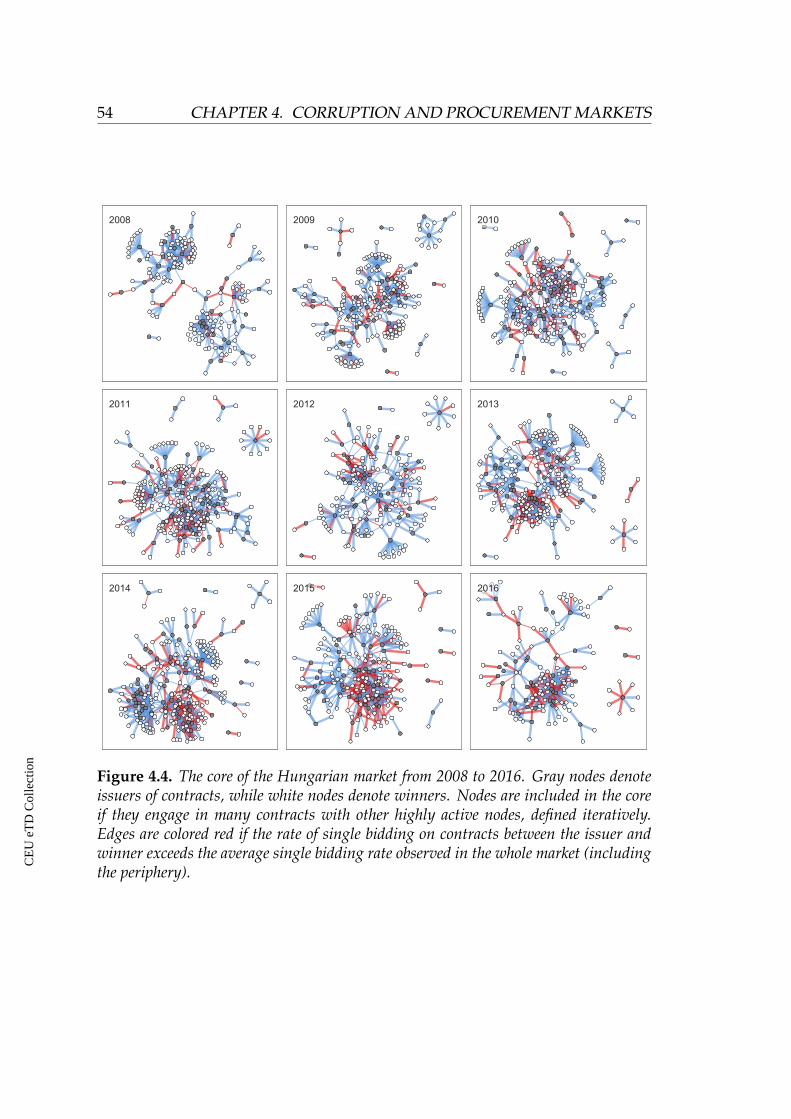
54 CHAPTER 4. CORRUPTION AND PROCUREMENT MARKETS
Figure 4.4. The core of the Hungarian market from 2008 to 2016. Gray nodes denoteissuers of contracts, while white nodes denote winners. Nodes are included in the coreif they engage in many contracts with other highly active nodes, defined iteratively.Edges are colored red if the rate of single bidding on contracts between the issuer andwinner exceeds the average single bidding rate observed in the whole market (includingthe periphery).
CE
UeT
DC
olle
ctio
n
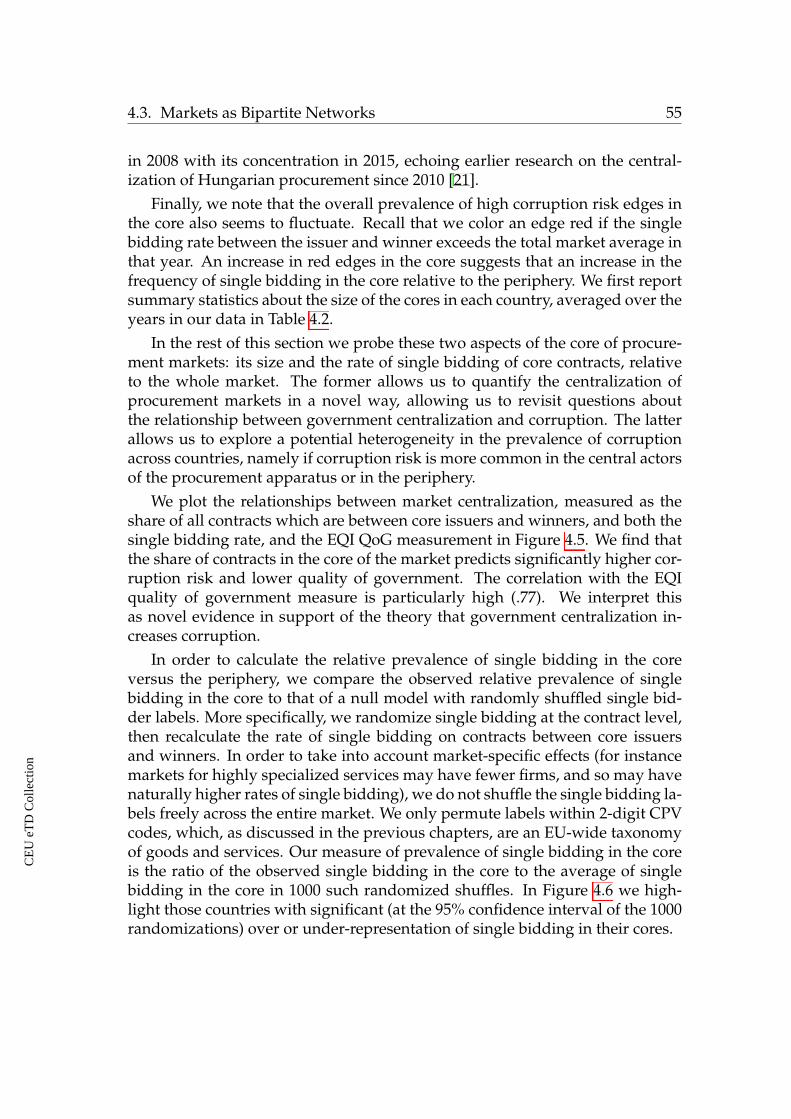
4.3. Markets as Bipartite Networks 55
in 2008 with its concentration in 2015, echoing earlier research on the central-ization of Hungarian procurement since 2010 [21].
Finally, we note that the overall prevalence of high corruption risk edges inthe core also seems to fluctuate. Recall that we color an edge red if the singlebidding rate between the issuer and winner exceeds the total market average inthat year. An increase in red edges in the core suggests that an increase in thefrequency of single bidding in the core relative to the periphery. We first reportsummary statistics about the size of the cores in each country, averaged over theyears in our data in Table 4.2.
In the rest of this section we probe these two aspects of the core of procure-ment markets: its size and the rate of single bidding of core contracts, relativeto the whole market. The former allows us to quantify the centralization ofprocurement markets in a novel way, allowing us to revisit questions aboutthe relationship between government centralization and corruption. The latterallows us to explore a potential heterogeneity in the prevalence of corruptionacross countries, namely if corruption risk is more common in the central actorsof the procurement apparatus or in the periphery.
We plot the relationships between market centralization, measured as theshare of all contracts which are between core issuers and winners, and both thesingle bidding rate, and the EQI QoG measurement in Figure 4.5. We find thatthe share of contracts in the core of the market predicts significantly higher cor-ruption risk and lower quality of government. The correlation with the EQIquality of government measure is particularly high (.77). We interpret thisas novel evidence in support of the theory that government centralization in-creases corruption.
In order to calculate the relative prevalence of single bidding in the coreversus the periphery, we compare the observed relative prevalence of singlebidding in the core to that of a null model with randomly shuffled single bid-der labels. More specifically, we randomize single bidding at the contract level,then recalculate the rate of single bidding on contracts between core issuersand winners. In order to take into account market-specific effects (for instancemarkets for highly specialized services may have fewer firms, and so may havenaturally higher rates of single bidding), we do not shuffle the single bidding la-bels freely across the entire market. We only permute labels within 2-digit CPVcodes, which, as discussed in the previous chapters, are an EU-wide taxonomyof goods and services. Our measure of prevalence of single bidding in the coreis the ratio of the observed single bidding in the core to the average of singlebidding in the core in 1000 such randomized shuffles. In Figure 4.6 we high-light those countries with significant (at the 95% confidence interval of the 1000randomizations) over or under-representation of single bidding in their cores.
CE
UeT
DC
olle
ctio
n
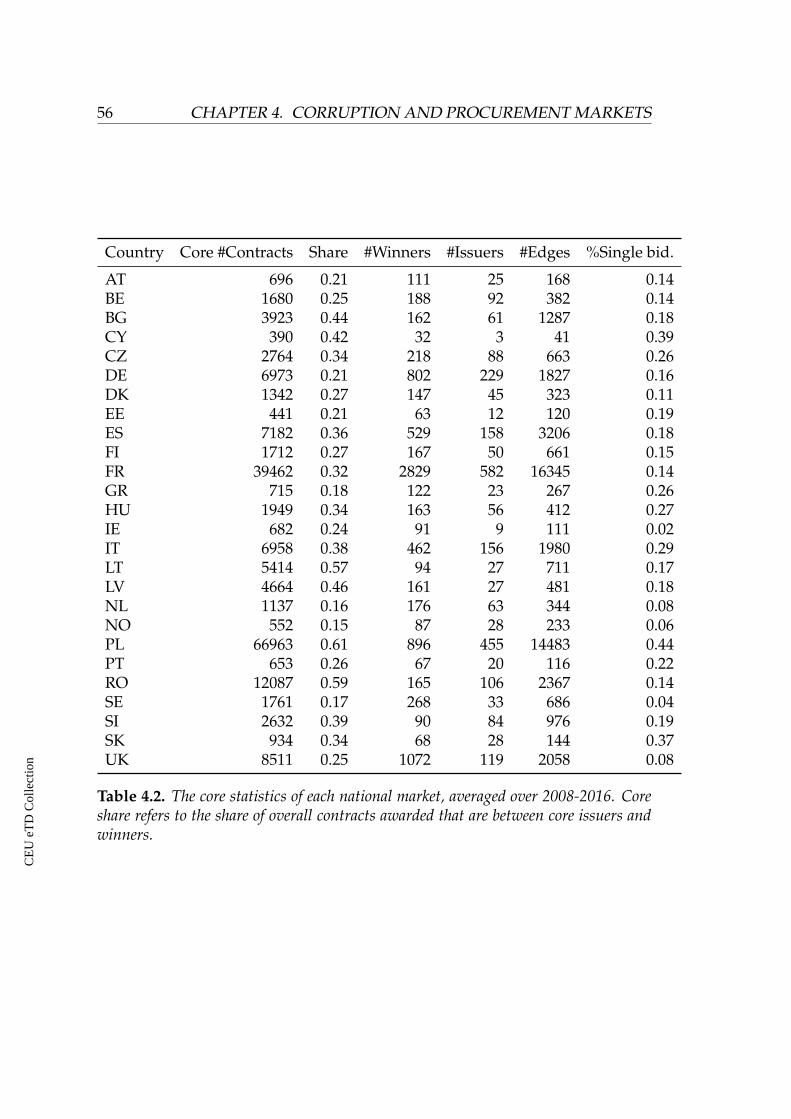
56 CHAPTER 4. CORRUPTION AND PROCUREMENT MARKETS
Country Core #Contracts Share #Winners #Issuers #Edges %Single bid.
AT 696 0.21 111 25 168 0.14BE 1680 0.25 188 92 382 0.14BG 3923 0.44 162 61 1287 0.18CY 390 0.42 32 3 41 0.39CZ 2764 0.34 218 88 663 0.26DE 6973 0.21 802 229 1827 0.16DK 1342 0.27 147 45 323 0.11EE 441 0.21 63 12 120 0.19ES 7182 0.36 529 158 3206 0.18FI 1712 0.27 167 50 661 0.15FR 39462 0.32 2829 582 16345 0.14GR 715 0.18 122 23 267 0.26HU 1949 0.34 163 56 412 0.27IE 682 0.24 91 9 111 0.02IT 6958 0.38 462 156 1980 0.29LT 5414 0.57 94 27 711 0.17LV 4664 0.46 161 27 481 0.18NL 1137 0.16 176 63 344 0.08NO 552 0.15 87 28 233 0.06PL 66963 0.61 896 455 14483 0.44PT 653 0.26 67 20 116 0.22RO 12087 0.59 165 106 2367 0.14SE 1761 0.17 268 33 686 0.04SI 2632 0.39 90 84 976 0.19SK 934 0.34 68 28 144 0.37UK 8511 0.25 1072 119 2058 0.08
Table 4.2. The core statistics of each national market, averaged over 2008-2016. Coreshare refers to the share of overall contracts awarded that are between core issuers andwinners.
CE
UeT
DC
olle
ctio
n
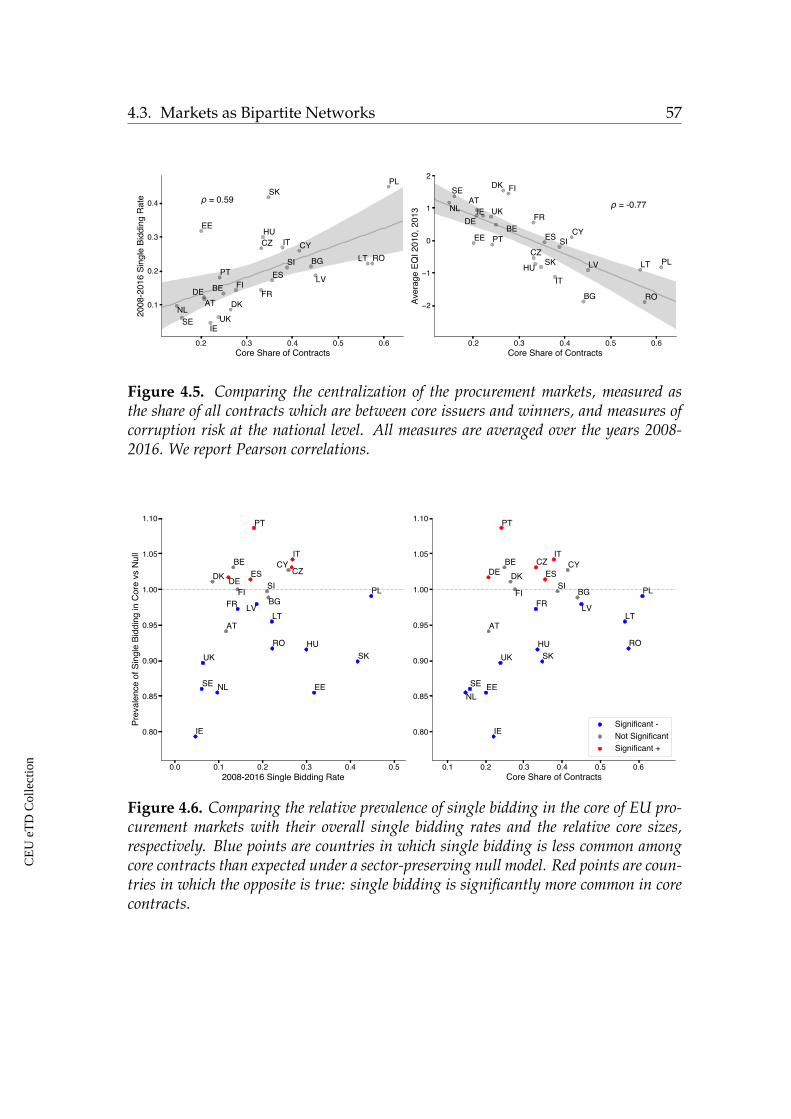
4.3. Markets as Bipartite Networks 57
Figure 4.5. Comparing the centralization of the procurement markets, measured asthe share of all contracts which are between core issuers and winners, and measures ofcorruption risk at the national level. All measures are averaged over the years 2008-2016. We report Pearson correlations.
Figure 4.6. Comparing the relative prevalence of single bidding in the core of EU pro-curement markets with their overall single bidding rates and the relative core sizes,respectively. Blue points are countries in which single bidding is less common amongcore contracts than expected under a sector-preserving null model. Red points are coun-tries in which the opposite is true: single bidding is significantly more common in corecontracts.
CE
UeT
DC
olle
ctio
n
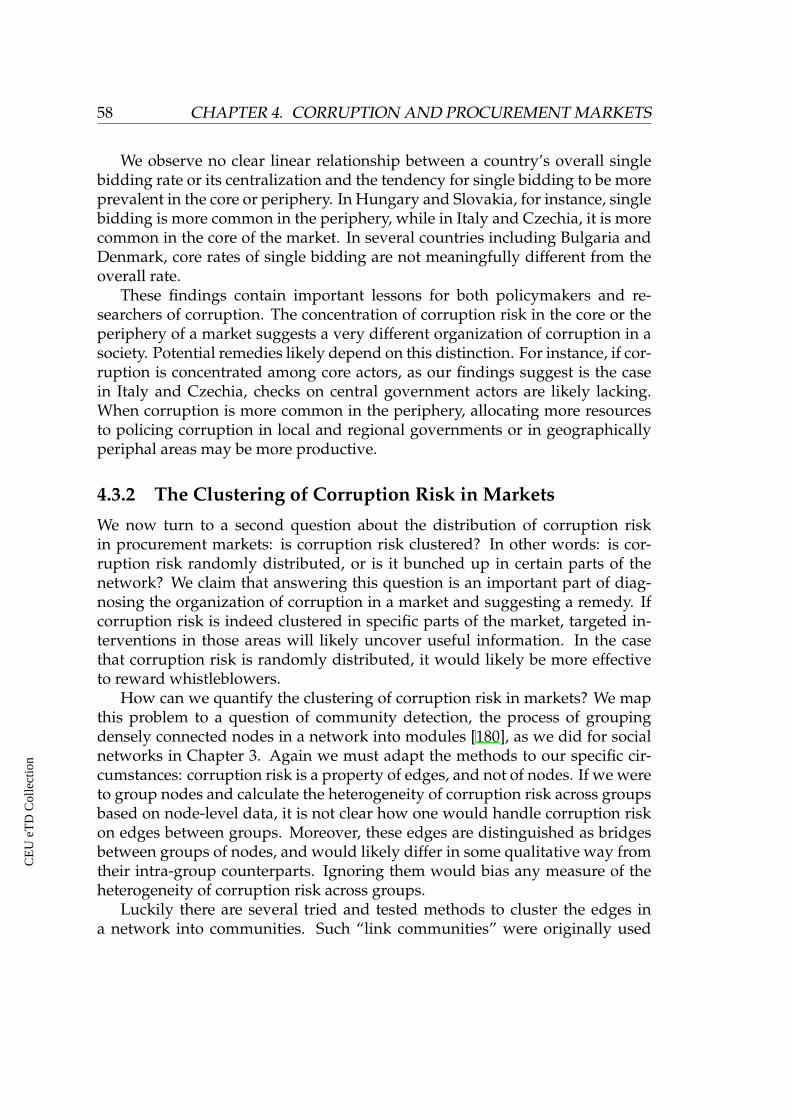
58 CHAPTER 4. CORRUPTION AND PROCUREMENT MARKETS
We observe no clear linear relationship between a country’s overall singlebidding rate or its centralization and the tendency for single bidding to be moreprevalent in the core or periphery. In Hungary and Slovakia, for instance, singlebidding is more common in the periphery, while in Italy and Czechia, it is morecommon in the core of the market. In several countries including Bulgaria andDenmark, core rates of single bidding are not meaningfully different from theoverall rate.
These findings contain important lessons for both policymakers and re-searchers of corruption. The concentration of corruption risk in the core or theperiphery of a market suggests a very different organization of corruption in asociety. Potential remedies likely depend on this distinction. For instance, if cor-ruption is concentrated among core actors, as our findings suggest is the casein Italy and Czechia, checks on central government actors are likely lacking.When corruption is more common in the periphery, allocating more resourcesto policing corruption in local and regional governments or in geographicallyperiphal areas may be more productive.
4.3.2 The Clustering of Corruption Risk in Markets
We now turn to a second question about the distribution of corruption riskin procurement markets: is corruption risk clustered? In other words: is cor-ruption risk randomly distributed, or is it bunched up in certain parts of thenetwork? We claim that answering this question is an important part of diag-nosing the organization of corruption in a market and suggesting a remedy. Ifcorruption risk is indeed clustered in specific parts of the market, targeted in-terventions in those areas will likely uncover useful information. In the casethat corruption risk is randomly distributed, it would likely be more effectiveto reward whistleblowers.
How can we quantify the clustering of corruption risk in markets? We mapthis problem to a question of community detection, the process of groupingdensely connected nodes in a network into modules [180], as we did for socialnetworks in Chapter 3. Again we must adapt the methods to our specific cir-cumstances: corruption risk is a property of edges, and not of nodes. If we wereto group nodes and calculate the heterogeneity of corruption risk across groupsbased on node-level data, it is not clear how one would handle corruption riskon edges between groups. Moreover, these edges are distinguished as bridgesbetween groups of nodes, and would likely differ in some qualitative way fromtheir intra-group counterparts. Ignoring them would bias any measure of theheterogeneity of corruption risk across groups.
Luckily there are several tried and tested methods to cluster the edges ina network into communities. Such “link communities” were originally used
CE
UeT
DC
olle
ctio
n
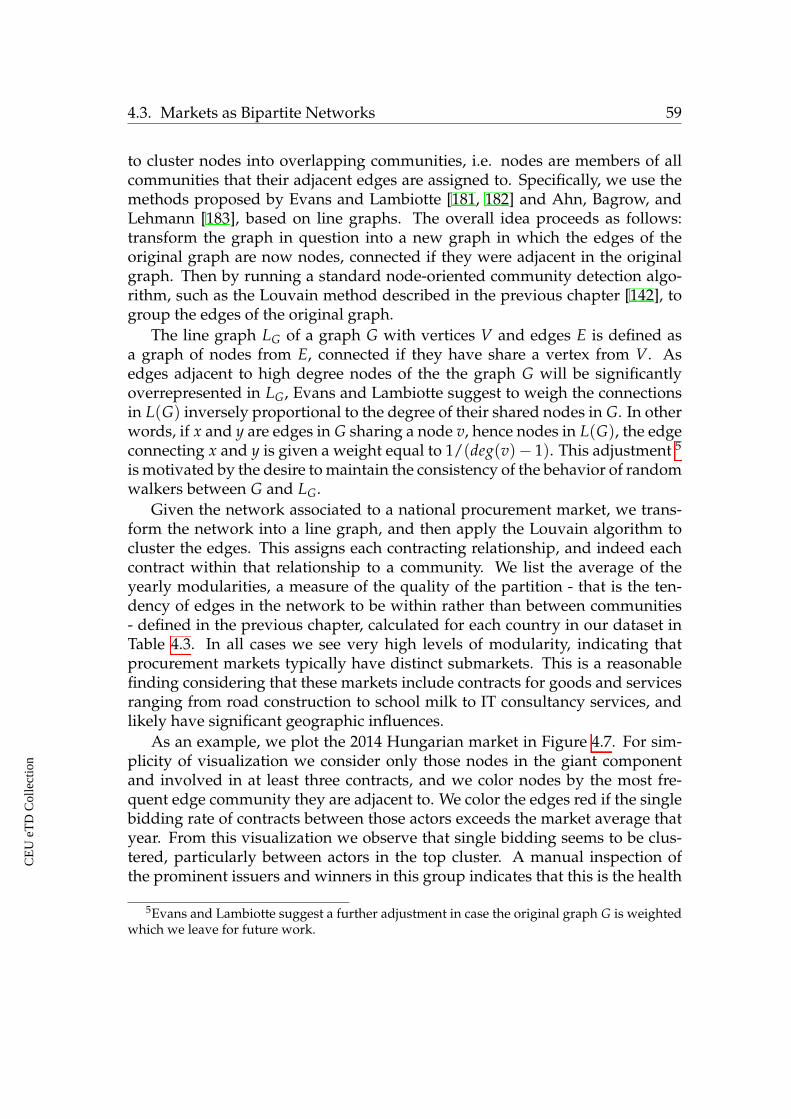
4.3. Markets as Bipartite Networks 59
to cluster nodes into overlapping communities, i.e. nodes are members of allcommunities that their adjacent edges are assigned to. Specifically, we use themethods proposed by Evans and Lambiotte [181, 182] and Ahn, Bagrow, andLehmann [183], based on line graphs. The overall idea proceeds as follows:transform the graph in question into a new graph in which the edges of theoriginal graph are now nodes, connected if they were adjacent in the originalgraph. Then by running a standard node-oriented community detection algo-rithm, such as the Louvain method described in the previous chapter [142], togroup the edges of the original graph.
The line graph LG of a graph G with vertices V and edges E is defined asa graph of nodes from E, connected if they have share a vertex from V. Asedges adjacent to high degree nodes of the the graph G will be significantlyoverrepresented in LG, Evans and Lambiotte suggest to weigh the connectionsin L(G) inversely proportional to the degree of their shared nodes in G. In otherwords, if x and y are edges in G sharing a node v, hence nodes in L(G), the edgeconnecting x and y is given a weight equal to 1/(deg(v)� 1). This adjustment 5
is motivated by the desire to maintain the consistency of the behavior of randomwalkers between G and LG.
Given the network associated to a national procurement market, we trans-form the network into a line graph, and then apply the Louvain algorithm tocluster the edges. This assigns each contracting relationship, and indeed eachcontract within that relationship to a community. We list the average of theyearly modularities, a measure of the quality of the partition - that is the ten-dency of edges in the network to be within rather than between communities- defined in the previous chapter, calculated for each country in our dataset inTable 4.3. In all cases we see very high levels of modularity, indicating thatprocurement markets typically have distinct submarkets. This is a reasonablefinding considering that these markets include contracts for goods and servicesranging from road construction to school milk to IT consultancy services, andlikely have significant geographic influences.
As an example, we plot the 2014 Hungarian market in Figure 4.7. For sim-plicity of visualization we consider only those nodes in the giant componentand involved in at least three contracts, and we color nodes by the most fre-quent edge community they are adjacent to. We color the edges red if the singlebidding rate of contracts between those actors exceeds the market average thatyear. From this visualization we observe that single bidding seems to be clus-tered, particularly between actors in the top cluster. A manual inspection ofthe prominent issuers and winners in this group indicates that this is the health
5Evans and Lambiotte suggest a further adjustment in case the original graph G is weightedwhich we leave for future work.
CE
UeT
DC
olle
ctio
n
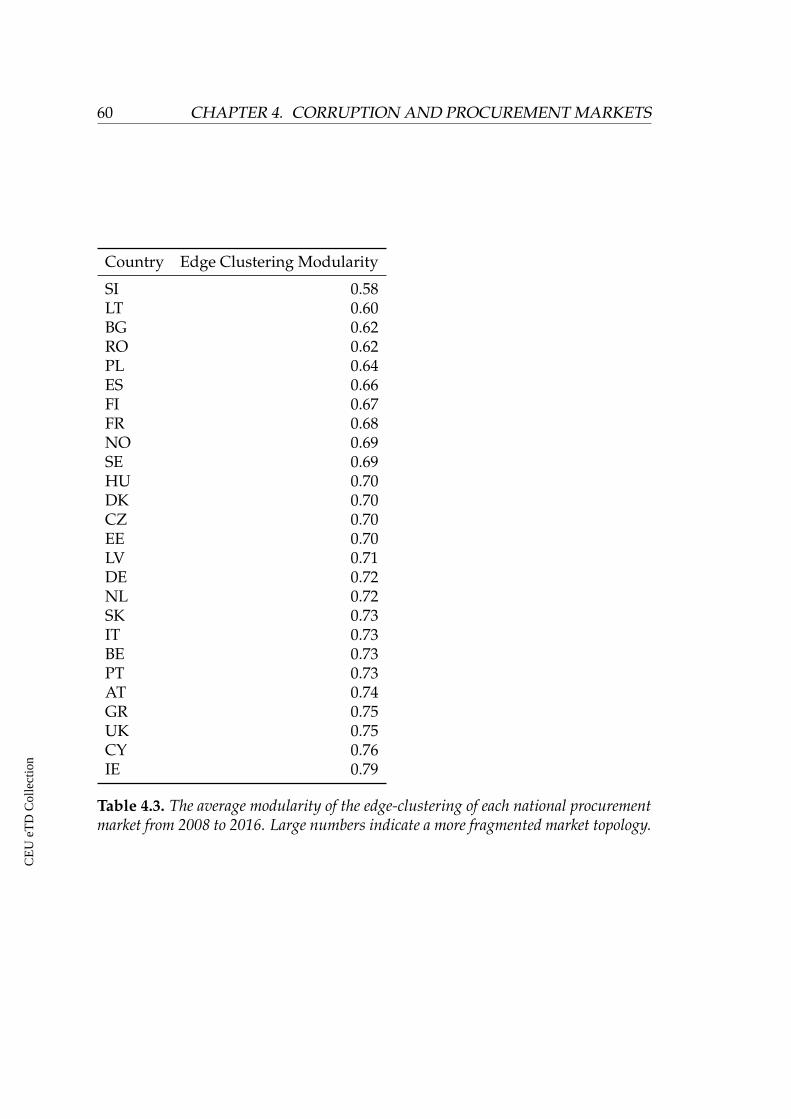
60 CHAPTER 4. CORRUPTION AND PROCUREMENT MARKETS
Country Edge Clustering Modularity
SI 0.58LT 0.60BG 0.62RO 0.62PL 0.64ES 0.66FI 0.67FR 0.68NO 0.69SE 0.69HU 0.70DK 0.70CZ 0.70EE 0.70LV 0.71DE 0.72NL 0.72SK 0.73IT 0.73BE 0.73PT 0.73AT 0.74GR 0.75UK 0.75CY 0.76IE 0.79
Table 4.3. The average modularity of the edge-clustering of each national procurementmarket from 2008 to 2016. Large numbers indicate a more fragmented market topology.
CE
UeT
DC
olle
ctio
n
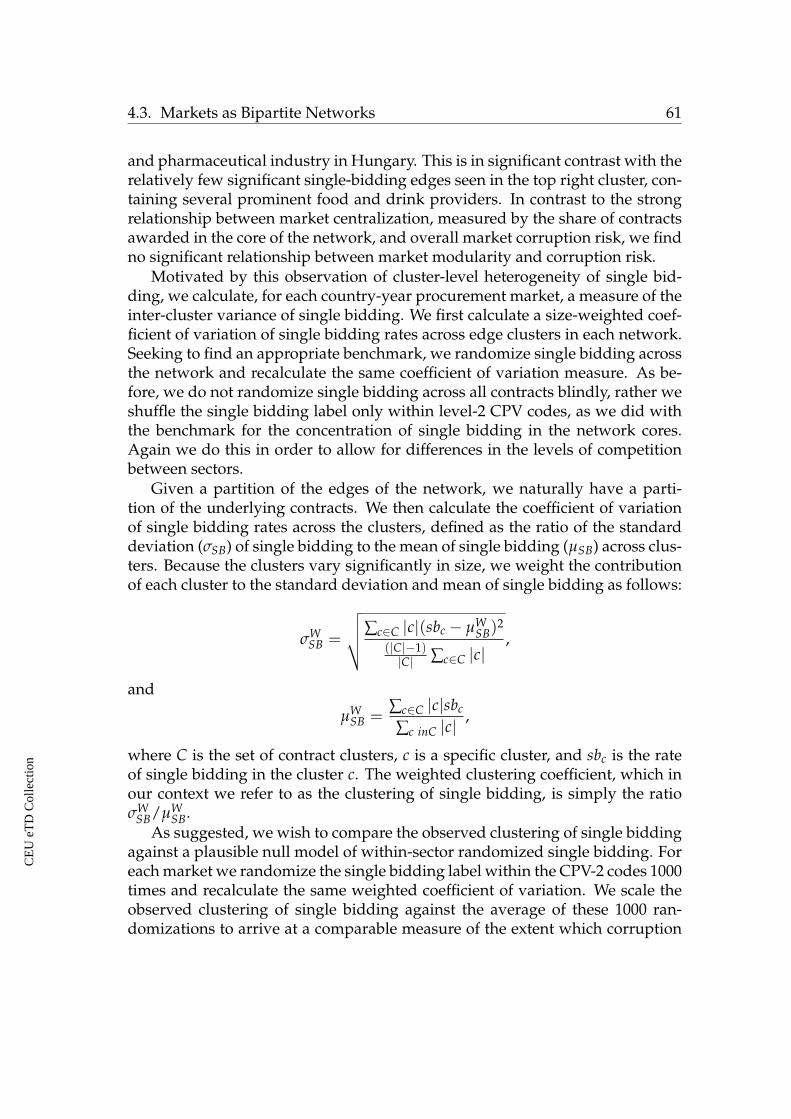
4.3. Markets as Bipartite Networks 61
and pharmaceutical industry in Hungary. This is in significant contrast with therelatively few significant single-bidding edges seen in the top right cluster, con-taining several prominent food and drink providers. In contrast to the strongrelationship between market centralization, measured by the share of contractsawarded in the core of the network, and overall market corruption risk, we findno significant relationship between market modularity and corruption risk.
Motivated by this observation of cluster-level heterogeneity of single bid-ding, we calculate, for each country-year procurement market, a measure of theinter-cluster variance of single bidding. We first calculate a size-weighted coef-ficient of variation of single bidding rates across edge clusters in each network.Seeking to find an appropriate benchmark, we randomize single bidding acrossthe network and recalculate the same coefficient of variation measure. As be-fore, we do not randomize single bidding across all contracts blindly, rather weshuffle the single bidding label only within level-2 CPV codes, as we did withthe benchmark for the concentration of single bidding in the network cores.Again we do this in order to allow for differences in the levels of competitionbetween sectors.
Given a partition of the edges of the network, we naturally have a parti-tion of the underlying contracts. We then calculate the coefficient of variationof single bidding rates across the clusters, defined as the ratio of the standarddeviation (sSB) of single bidding to the mean of single bidding (µSB) across clus-ters. Because the clusters vary significantly in size, we weight the contributionof each cluster to the standard deviation and mean of single bidding as follows:
sWSB =
vuutÂc2C |c|(sbc � µWSB)
2
(|C|�1)|C| Âc2C |c|
,
and
µWSB =
Âc2C |c|sbc
Âc inC |c| ,
where C is the set of contract clusters, c is a specific cluster, and sbc is the rateof single bidding in the cluster c. The weighted clustering coefficient, which inour context we refer to as the clustering of single bidding, is simply the ratiosW
SB/µWSB.
As suggested, we wish to compare the observed clustering of single biddingagainst a plausible null model of within-sector randomized single bidding. Foreach market we randomize the single bidding label within the CPV-2 codes 1000times and recalculate the same weighted coefficient of variation. We scale theobserved clustering of single bidding against the average of these 1000 ran-domizations to arrive at a comparable measure of the extent which corruption
CE
UeT
DC
olle
ctio
n
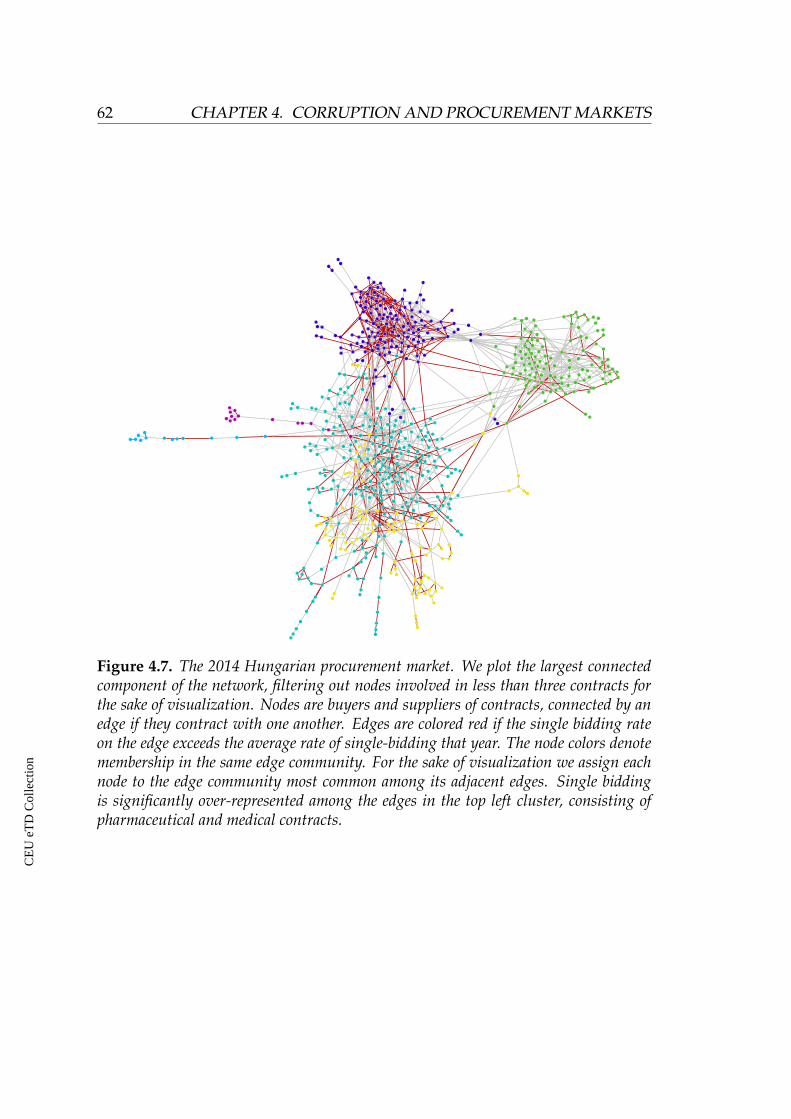
62 CHAPTER 4. CORRUPTION AND PROCUREMENT MARKETS
Figure 4.7. The 2014 Hungarian procurement market. We plot the largest connectedcomponent of the network, filtering out nodes involved in less than three contracts forthe sake of visualization. Nodes are buyers and suppliers of contracts, connected by anedge if they contract with one another. Edges are colored red if the single bidding rateon the edge exceeds the average rate of single-bidding that year. The node colors denotemembership in the same edge community. For the sake of visualization we assign eachnode to the edge community most common among its adjacent edges. Single biddingis significantly over-represented among the edges in the top left cluster, consisting ofpharmaceutical and medical contracts.
CE
UeT
DC
olle
ctio
n
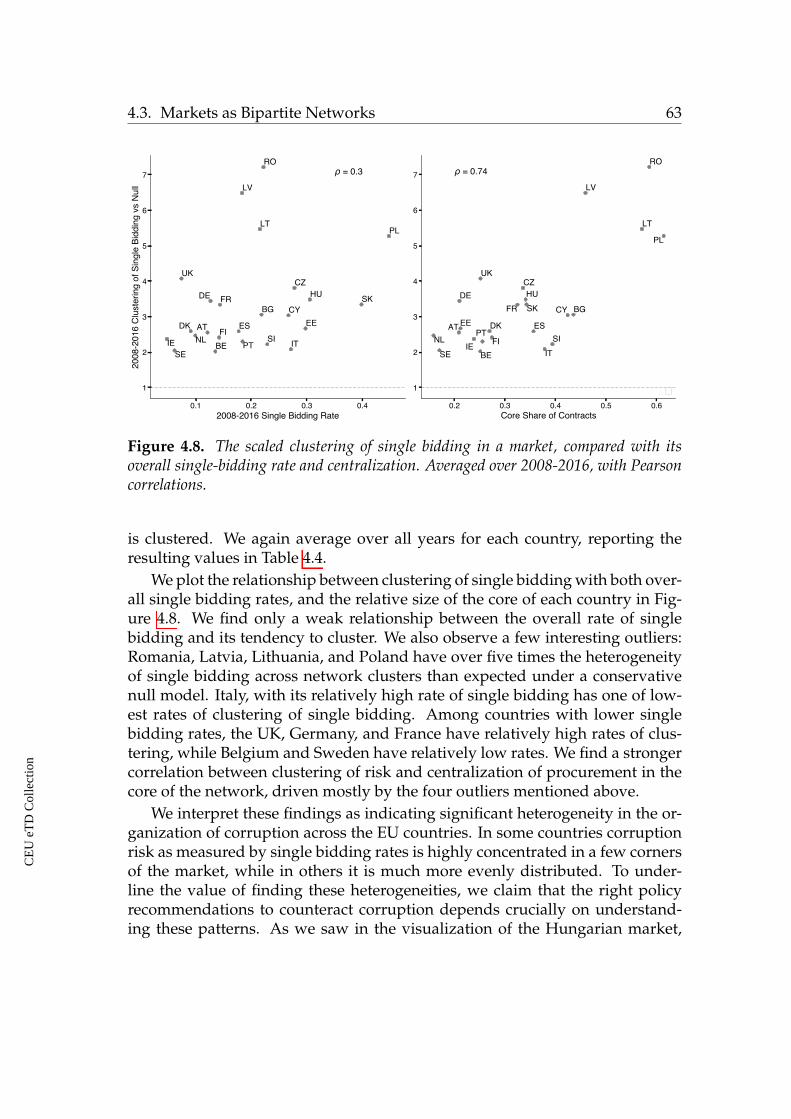
4.3. Markets as Bipartite Networks 63
Figure 4.8. The scaled clustering of single bidding in a market, compared with itsoverall single-bidding rate and centralization. Averaged over 2008-2016, with Pearsoncorrelations.
is clustered. We again average over all years for each country, reporting theresulting values in Table 4.4.
We plot the relationship between clustering of single bidding with both over-all single bidding rates, and the relative size of the core of each country in Fig-ure 4.8. We find only a weak relationship between the overall rate of singlebidding and its tendency to cluster. We also observe a few interesting outliers:Romania, Latvia, Lithuania, and Poland have over five times the heterogeneityof single bidding across network clusters than expected under a conservativenull model. Italy, with its relatively high rate of single bidding has one of low-est rates of clustering of single bidding. Among countries with lower singlebidding rates, the UK, Germany, and France have relatively high rates of clus-tering, while Belgium and Sweden have relatively low rates. We find a strongercorrelation between clustering of risk and centralization of procurement in thecore of the network, driven mostly by the four outliers mentioned above.
We interpret these findings as indicating significant heterogeneity in the or-ganization of corruption across the EU countries. In some countries corruptionrisk as measured by single bidding rates is highly concentrated in a few cornersof the market, while in others it is much more evenly distributed. To under-line the value of finding these heterogeneities, we claim that the right policyrecommendations to counteract corruption depends crucially on understand-ing these patterns. As we saw in the visualization of the Hungarian market,
CE
UeT
DC
olle
ctio
n
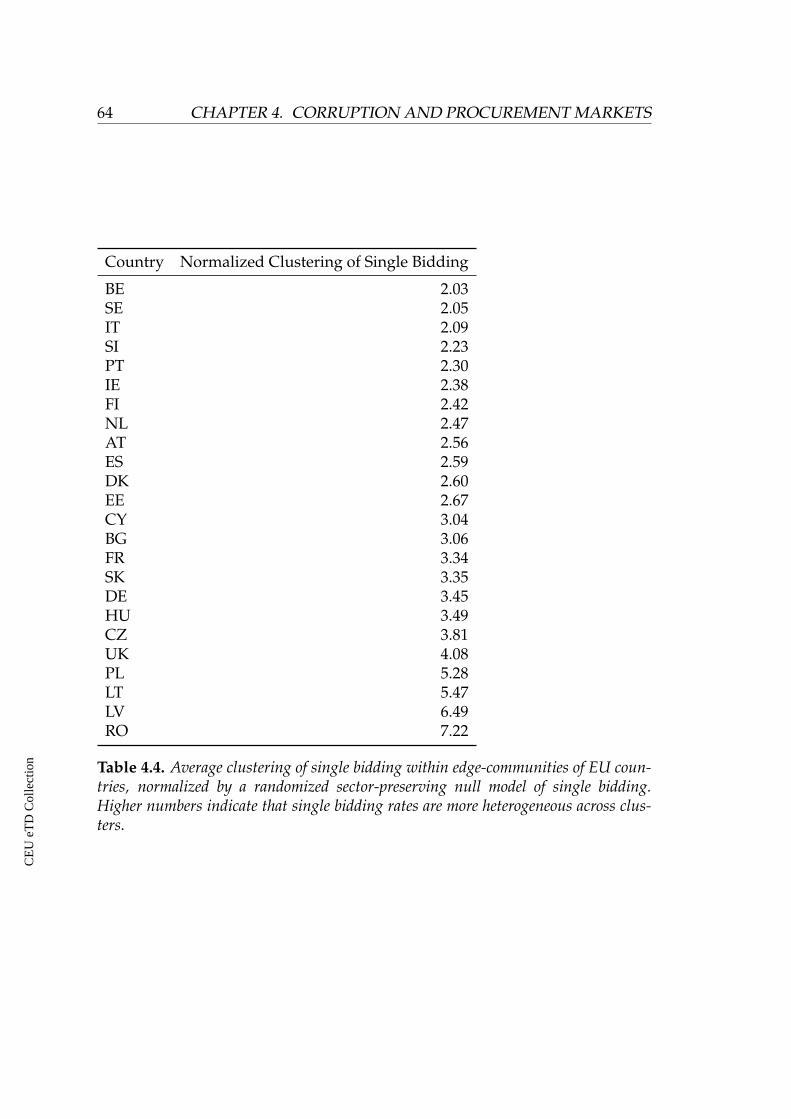
64 CHAPTER 4. CORRUPTION AND PROCUREMENT MARKETS
Country Normalized Clustering of Single Bidding
BE 2.03SE 2.05IT 2.09SI 2.23PT 2.30IE 2.38FI 2.42NL 2.47AT 2.56ES 2.59DK 2.60EE 2.67CY 3.04BG 3.06FR 3.34SK 3.35DE 3.45HU 3.49CZ 3.81UK 4.08PL 5.28LT 5.47LV 6.49RO 7.22
Table 4.4. Average clustering of single bidding within edge-communities of EU coun-tries, normalized by a randomized sector-preserving null model of single bidding.Higher numbers indicate that single bidding rates are more heterogeneous across clus-ters.
CE
UeT
DC
olle
ctio
n
4.3. Markets as Bipartite Networks 65
one cluster clearly has higher rates of single bidding than do the others. Inves-tigators, public or private, can immediately hone in on specific clusters in sucha situation. In Italy, on the other hand, where the heterogeneity of single bid-ding across clusters is relatively low, a similar approach would have less value.There policymakers may be more interested in taking a decentralized approachto anti-corruption activities, for example by supporting whistleblowers and in-centivizing the exposure of corruption by insiders.
4.3.3 Market Turnover and Change in Government
In the final section of this chapter, we analyze the effect of changes in govern-ment on procurement markets. This is another potential source of heterogene-ity in the organization of corruption in different contexts. Past work has foundsignificant evidence of political cycles in procurement in countries such as Rus-sia [184]. Using the survival rate of procurement winners in the core, we cancompare the turnover of frequent high single bid contract winners with othercore firms across politically volatile and tranquil years. We find differences thatagain offer interesting theoretical insights and suggest different kinds of policyinterventions.
We define change in government using data from the ParlGov database oncabinets [185], reported in Table 4.5. We say that a country experienced a changein government in a specific year, if the head of the government (for example theprime minister or chancellor) and all parties participating in the governmentchanged. This is a rather conservative definition of change in government. Forexample, if a junior coalition party leaves the government or if a prime ministeris replaced by a technocratic government with support by the same parties, wedo not consider this a change in government. One drawback to this approachis that some countries, for example Germany and Austria, did not have, by ourdefinition, a change of government in the span of our dataset. Despite our re-strictive definition, some countries with more volatile political cycles (Italy orCzechia for example) had multiple changes of government. In any case, polit-ical turbulence is itself an important indicator of political health of a country,with past work indicating that political stability is correlated with lower levelsof corruption [186]. On the other hand, extreme stability may indicate a lackof political competition and we observed in Chapter 3 that Hungarian settle-ments with weaker political competition had higher rates of corruption risk intheir contracts. Though researchers have developed increasingly granular, so-cial media-based measures of political volatility or “turbulence” [187], we stickwith our top down approach.
Another limitation of our method of analysis is that we only consider cen-tral government changes. Many countries in Europe have significant federal
CE
UeT
DC
olle
ctio
n
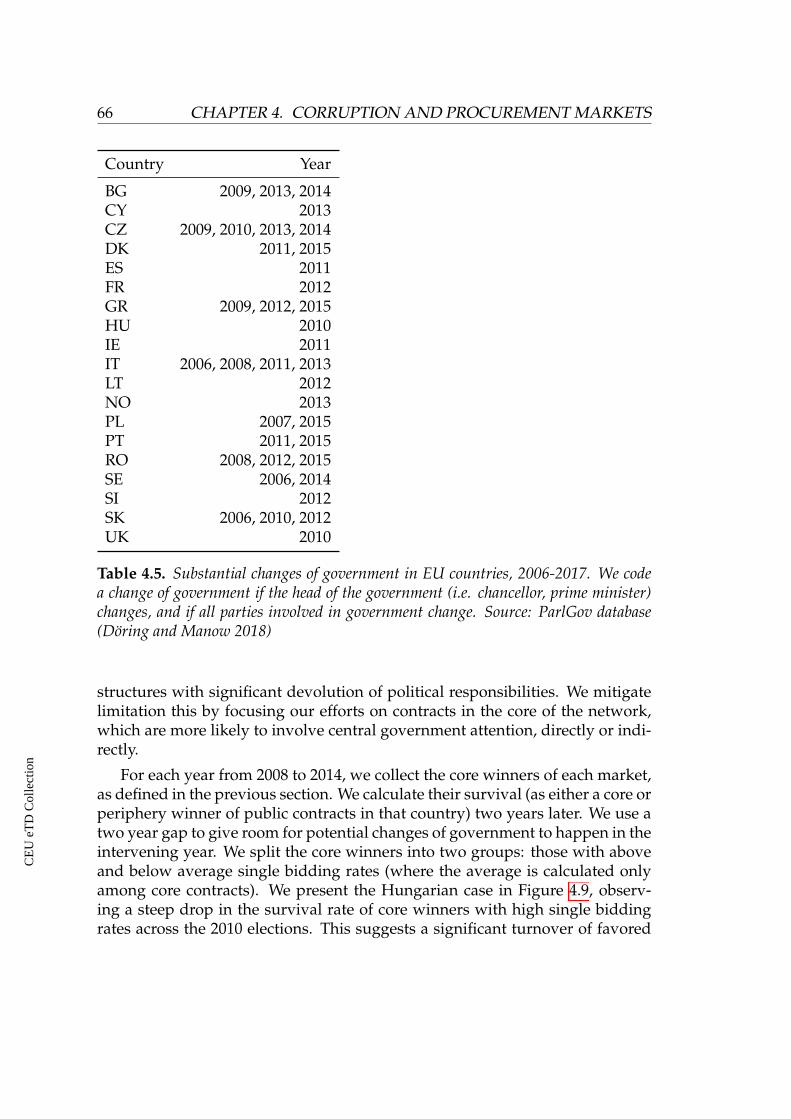
66 CHAPTER 4. CORRUPTION AND PROCUREMENT MARKETS
Country Year
BG 2009, 2013, 2014CY 2013CZ 2009, 2010, 2013, 2014DK 2011, 2015ES 2011FR 2012GR 2009, 2012, 2015HU 2010IE 2011IT 2006, 2008, 2011, 2013LT 2012NO 2013PL 2007, 2015PT 2011, 2015RO 2008, 2012, 2015SE 2006, 2014SI 2012SK 2006, 2010, 2012UK 2010
Table 4.5. Substantial changes of government in EU countries, 2006-2017. We codea change of government if the head of the government (i.e. chancellor, prime minister)changes, and if all parties involved in government change. Source: ParlGov database(Doring and Manow 2018)
structures with significant devolution of political responsibilities. We mitigatelimitation this by focusing our efforts on contracts in the core of the network,which are more likely to involve central government attention, directly or indi-rectly.
For each year from 2008 to 2014, we collect the core winners of each market,as defined in the previous section. We calculate their survival (as either a core orperiphery winner of public contracts in that country) two years later. We use atwo year gap to give room for potential changes of government to happen in theintervening year. We split the core winners into two groups: those with aboveand below average single bidding rates (where the average is calculated onlyamong core contracts). We present the Hungarian case in Figure 4.9, observ-ing a steep drop in the survival rate of core winners with high single biddingrates across the 2010 elections. This suggests a significant turnover of favored
CE
UeT
DC
olle
ctio
n
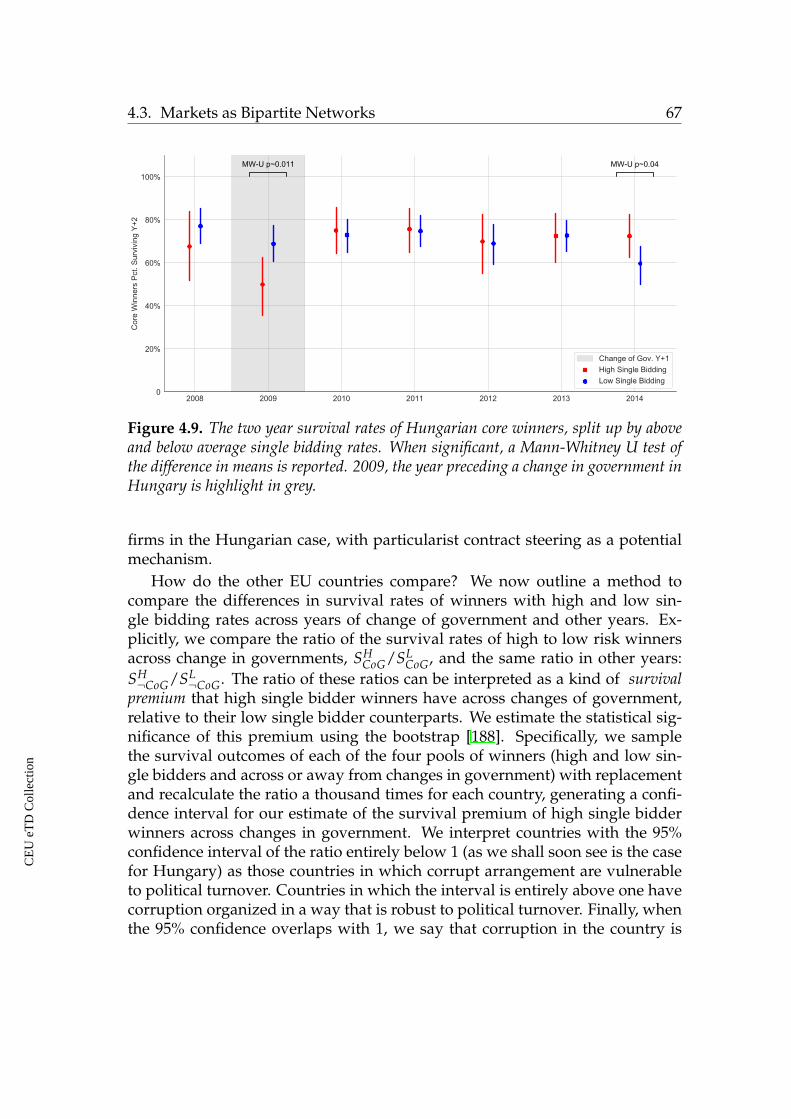
4.3. Markets as Bipartite Networks 67
Figure 4.9. The two year survival rates of Hungarian core winners, split up by aboveand below average single bidding rates. When significant, a Mann-Whitney U test ofthe difference in means is reported. 2009, the year preceding a change in government inHungary is highlight in grey.
firms in the Hungarian case, with particularist contract steering as a potentialmechanism.
How do the other EU countries compare? We now outline a method tocompare the differences in survival rates of winners with high and low sin-gle bidding rates across years of change of government and other years. Ex-plicitly, we compare the ratio of the survival rates of high to low risk winnersacross change in governments, SH
CoG/SLCoG, and the same ratio in other years:
SH¬CoG/SL
¬CoG. The ratio of these ratios can be interpreted as a kind of survivalpremium that high single bidder winners have across changes of government,relative to their low single bidder counterparts. We estimate the statistical sig-nificance of this premium using the bootstrap [188]. Specifically, we samplethe survival outcomes of each of the four pools of winners (high and low sin-gle bidders and across or away from changes in government) with replacementand recalculate the ratio a thousand times for each country, generating a confi-dence interval for our estimate of the survival premium of high single bidderwinners across changes in government. We interpret countries with the 95%confidence interval of the ratio entirely below 1 (as we shall soon see is the casefor Hungary) as those countries in which corrupt arrangement are vulnerableto political turnover. Countries in which the interval is entirely above one havecorruption organized in a way that is robust to political turnover. Finally, whenthe 95% confidence overlaps with 1, we say that corruption in the country is
CE
UeT
DC
olle
ctio
n
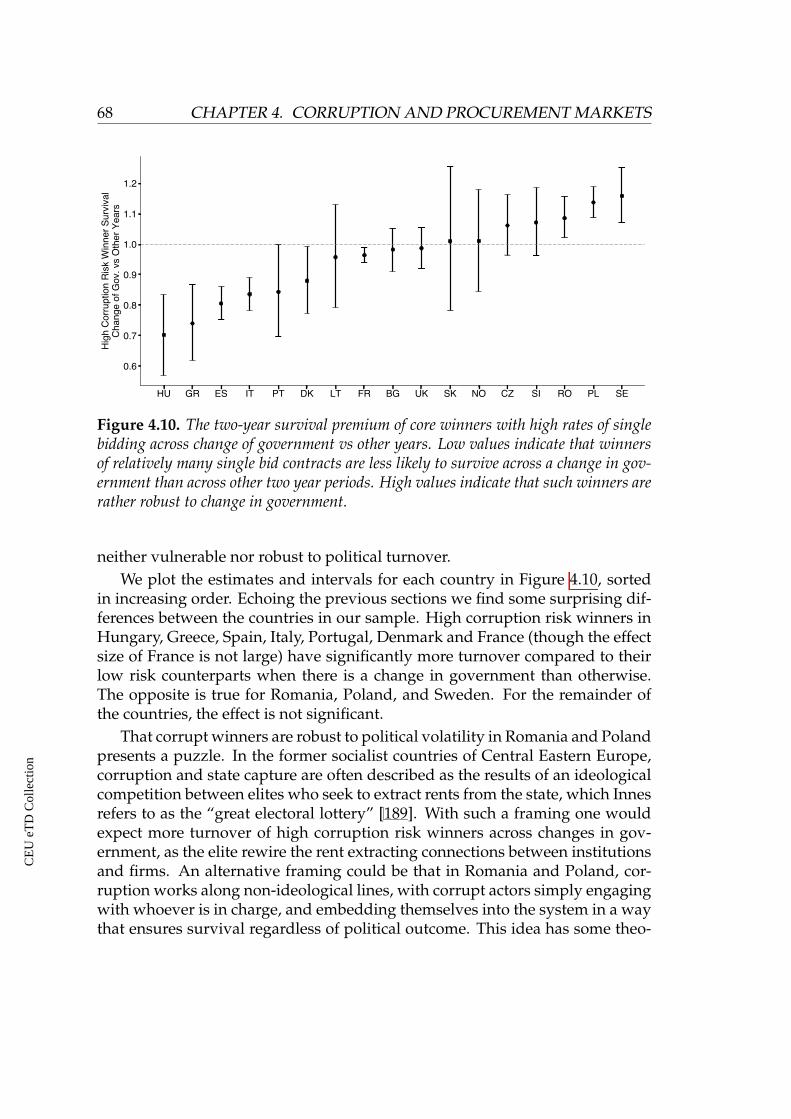
68 CHAPTER 4. CORRUPTION AND PROCUREMENT MARKETS
Figure 4.10. The two-year survival premium of core winners with high rates of singlebidding across change of government vs other years. Low values indicate that winnersof relatively many single bid contracts are less likely to survive across a change in gov-ernment than across other two year periods. High values indicate that such winners arerather robust to change in government.
neither vulnerable nor robust to political turnover.We plot the estimates and intervals for each country in Figure 4.10, sorted
in increasing order. Echoing the previous sections we find some surprising dif-ferences between the countries in our sample. High corruption risk winners inHungary, Greece, Spain, Italy, Portugal, Denmark and France (though the effectsize of France is not large) have significantly more turnover compared to theirlow risk counterparts when there is a change in government than otherwise.The opposite is true for Romania, Poland, and Sweden. For the remainder ofthe countries, the effect is not significant.
That corrupt winners are robust to political volatility in Romania and Polandpresents a puzzle. In the former socialist countries of Central Eastern Europe,corruption and state capture are often described as the results of an ideologicalcompetition between elites who seek to extract rents from the state, which Innesrefers to as the “great electoral lottery” [189]. With such a framing one wouldexpect more turnover of high corruption risk winners across changes in gov-ernment, as the elite rewire the rent extracting connections between institutionsand firms. An alternative framing could be that in Romania and Poland, cor-ruption works along non-ideological lines, with corrupt actors simply engagingwith whoever is in charge, and embedding themselves into the system in a waythat ensures survival regardless of political outcome. This idea has some theo-
CE
UeT
DC
olle
ctio
n
4.4. Discussion 69
retical support in Romania, where MPs frequently and opportunistically switchparties [190]. Poland, however, is usually presented as a polarized society inwhich political competition is highly ideological [191]. Polish voters are espe-cially likely to mobilize because of corruption perceptions [192]. This findingcertainly merits further study.
On the other hand it is quite interesting that corruption risk implies in-creased volatility consistently among Hungary and the Mediterranean coun-tries, in contrast with both the rest of Eastern Europe and Northern Europe.We briefly consider implications for policymakers given these heterogeneities.In countries in which corrupt firms are vulnerable to political turnover, it islikely that staggering local and regional elections may have a virtuous effecton the overall level of corruption, as suggested by previous work comparingthe Czech Republic (where elections are entirely asynchronous) and Hungary(where elections are highly synchronized) [133]. By increasing volatility acrosslevels of government, it makes it harder to organize corruption, for example be-cause it is more likely that an important election is imminent at any given timeand that voters can punish misbehaving political parties more quickly and con-sistently. In Romania and Poland, where we found the opposite tendency, it israther likely that personal ties and brokers between firms and political partiesare enabling the survival of high corruption risk winners across elections.
4.4 Discussion
In this chapter we studied the relationship between corruption risk and pro-curement market structure in EU countries. By observing centralization, clus-tering, and turnover of the market using network methods, we describe theorganization of corruption in novel ways. Our approach highlights the multi-faceted nature of corruption. With the exception of a strong correlation betweencentralization in a market and its rate of single bidding, we do not generally findclear relationships between the overall prevalence of corruption risk in a coun-try and the structure of its procurement market. For example, in some countriescorruption risk is more prominent in the core of the procurement market, whilein others it is rather over-represented in the periphery. In all countries we foundthat corruption risk is distributed across sub-markets in a non-random way, butthe extent to which this is true varies greatly. Finally, we found that winners ofcorruption contracts react very differently to changes in government in differentcountries around the EU.
Not only are these distinctions theoretically important, but they suggestpractical implications for anti-corruption actors from activist to prosecutor. Thenetwork approach builds up from micro-level interactions to describe emergent
CE
UeT
DC
olle
ctio
n
70 CHAPTER 4. CORRUPTION AND PROCUREMENT MARKETS
structure - in this case highlighting significant national-level differences in pro-curement markets. They also suggest several avenues for further research. Onecould for instance focus on specific countries, just as this chapter has tended touse Hungary as an example. The hypotheses of country-level experts on thenature of corruption in specific societies could be tested using our framework.It could also be extended to compare non-EU countries, depending on the com-parability of the data. Finally, we note that in future work a greater emphasison the temporal evolution of these markets and their actors is merited. Forinstance, an analysis of market structure can give a much more real-time mea-sure of change in corruption risk than can survey-based perception measures,which are often a lagging indicator of such effects. Such a perspective is crucialto discovering the causal mechanisms and directions behind the relationshipswe have discovered in this chapter, for if procurement market decentralizationcauses a decrease in corruption.
CE
UeT
DC
olle
ctio
n
CHAPTER 5
CARTELS
Competing firms can increase profits by setting prices collectively, imposingsignificant costs on consumers. Such groups of firms are known as cartels andbecause this behavior is illegal, their operations are secretive and difficult todetect. Cartels do face a significant internal obstacle: members face short-runincentives to cheat. Here we present a network-based framework to detect po-tential cartels in bidding markets based on the idea that the likelihood that agroup of firms can overcome this obstacle and sustain cooperation depends onthe patterns of its interactions.
We create a network of firms based on their co-bidding behavior, detect in-teracting groups, and measure their cohesion and exclusivity, two group-levelfeatures of their collective behavior. Applied to a market for school milk, ourmethod detects a known cartel and calculates that it has high cohesion and ex-clusivity. In a comprehensive set of nearly 150,000 public contracts awarded bythe Republic of Georgia from 2011 to 2016, detected groups in the high cohesionand exclusivity region are significantly more likely to display traditional mark-ers of cartel behavior. We replicate this relationship between group topologyand the emergence of cooperation in a simulation model. Our method presentsa scalable, unsupervised method to find groups of firms in bidding marketsideally positioned to form lasting cartels.1.
This investigation contrasts with the previous chapters on corruption in thatcollusion is not a crime bridging the public and private sectors. In this sense thechapter and its findings represent a transfer of the network-based approach tothe study of corruption to a related, parallel domain.
We do note several important similarities between “classic” corruption in
1This chapter partially draws on work that is under review at a journal at the time of sub-mission of the thesis. No preprint is yet available.
71
CE
UeT
DC
olle
ctio
n
72 CHAPTER 5. CARTELS
procurement and collusion. The first is that both require coordination in se-cret. The second similarity is that both activities are illegal, so participants facesimilar dilemmas. Third, the two often coincide as cartel may develop insiderconnections with bureaucrats [193] - recall that the Petrobras scandal involveda cartel of firms on the private sector side. Finally, both activities impose costson the public. Therefore, though collusion is not usually considered to be thesame as corruption, a better understanding of the emergence and sustenance ofillegal collusion can inform us about corruption as well2.
5.1 Prelude
Cartels have been studied by economists since Adam Smith, who wrote that“people of the same trade seldom meet together, even for merriment and diver-sion, but the conversation ends in a conspiracy against the public, or in somecontrivance to raise prices.” [194] Competition between firms decreases profits,and so they have incentive to collude by setting prices or production collec-tively [195]. Three significant forces make running such a cartel difficult. First,they are generally illegal and are aggressively policed by competition authori-ties, presenting a significant obstacle to coordination. The second challenge isthat cartels face a classic collective action problem: individual cartel membershave short-term incentive to deviate from the collusive agreement. In the lan-guage of game theory, defection is a dominant strategy in the one-shot game.Finally, effective collusion requires unanimity, meaning that a single defectorcan significantly diminish the profits of the other cooperating firms.
Even though cartels face these internal and external threats to their stabil-ity there are many examples of cartels in a variety of industries from financialproducts [196] to vitamins [197] operating successfully for long periods of time.Past research estimates that on average cartels increase prices by 20-30% [198]and that in a given year a functioning cartel has a roughly 10% chance of beingdiscovered [199], indicating that cartels are costly and that deterrence can beimproved. In this chapter we propose a novel approach to the issue of detect-ing cartels using network methods, built on the idea that the network of firm-firm interactions can reveal hot-spots in which cooperation is easier to sustain.Groups of firms in these distinguished positions interact repeatedly and exclu-sively amongst themselves, creating ideal conditions to overcome their internalcollective action problem.
Economists have long studied the market conditions under which cartelsthrive, namely how they enable a cartel to overcome the problems of “coor-
2A stand-alone version of this chapter is under review at a journal at the time of submissionof the thesis.
CE
UeT
DC
olle
ctio
n
5.1. Prelude 73
dination, cheating, and entry.” [200] For example coordination is easier in asmaller group with homogeneous firm sizes [201], while frequency of interac-tion facilitates punishment of defectors, and high costs to entry insulate thecartel from outsiders [202]. Another perspective on collusion is to consider thatfirms are playing a repeated prisoner’s dilemma (PD) game [203]. When choos-ing to compete (equivalently defecting from the cartel in the language of thePD) firms charge low prices, while when they collude (equivalently cooperate),they charge high prices. Collective profit is maximized if everyone colludes,but when colluding firms are undersold by even a single competing firm theyfare badly [204]. When players play multiple rounds of the PD, Axelrod demon-strated that cooperation can emerge as a winning strategy through learning andimitation [205], a finding which replicates in the context of firms setting prices inoligopoly [206]. In the PD and many other games in which collectively optimalactions are personally costly to players, altruistic cooperation emerges under avariety of conditions through mechanisms such as reciprocity and the altruisticpunishment of defectors or cheaters [207].
Just as certain market conditions are known to favor cartels, researchers haveobserved that when players of the PD are arranged in some space or networkwhich restricts their potential interactions, the potential for the emergence sta-ble cooperation crucially depends on the structure of the space [208, 209, 210,211]. For example, correlations in the spatial distribution of agents have beenshown to facilitate cooperation [212]. To the best of our knowledge, this ob-servation that local correlation of interactions have significant influence on theemergence of cooperation has not been applied to the problem of detecting car-tels.
We propose to apply network science methods to identify groups of in-tensely interacting firms in a market and to screen them for collusive potential,based on their network topology and how it may facilitate collusion. We focuson the case of collusion in public contracting markets, in which public bodiesbuy goods and services from private firms. These markets are vulnerable tocollusion because of the inelasticity and regularity of government’s demand forcertain goods [213, 214]. They are also large, accounting for between 10-20%of GDP in the OECD [20]. Contracts are commonly awarded via auction to thelowest bidder. In these markets cartels often engage in bid-rigging, coordinat-ing their bids to mask their agreement to avoid competition [215].
Specifically, we use data on firms bidding for contracts to map in public con-tracting markets as networks of competing firms. We argue that such a networkrepresents an embedding of the firms into a space which describes the competi-tive landscape of their industry or location, including its geography, technology,and scale. Within such co-bidding networks, we detect groups of firms whose
CE
UeT
DC
olle
ctio
n
74 CHAPTER 5. CARTELS
local network topology are naturally conducive to sustaining collusion. Previ-ous work on cartels has considered co-bidding networks of firms [216, 217, 218],though none have used the network topology to detect groups of firms withinmarkets. In recent work on cartel screening, Imhof et al. have used patternsof bidding interactions between firms to study cartels [219]. More broadly, net-work methods have been fruitfully applied to problems in criminology includ-ing corruption [86, 14], the mafia [92], and the evolution of crime [97].
We first map the co-bidding market of the suppliers of public school milk in1980s Ohio containing a known cartel case [220]. We note that the cartel firmsoccupy a distinguished position in the network: they frequently interact withone another, forming coherent links, and are relatively isolated from outsidefirms, forming an exclusive group. We then turn to a dataset of bids on nearly150,000 contracts awarded in the Republic of Georgia from 2011 to 2016 worthroughly 5 billion US dollars. Using a greedy, bottom-up algorithm to detectoverlapping groups of interacting nodes, we find that groups with cohesive andexclusive interactions have higher prices, are less likely to sue each other, andare more likely to have low variance in their bids and prices - classic screens forcartel behavior used by competition authorities around the world [221]. Finally,we simulate a market in which firms compete for randomly placed contractswhen they are close in proximity, introducing spatial correlations to interac-tions. Firms see their competitors for the contract, and decide to compete orcollude based on the previous actions of their partners and the frequency withwhich they meet them. In the resulting co-bidding network, detected groupswith coherent and exclusive links successfully collude with much higher fre-quency.
5.2 Results
Our framework to find groups of firms that may be engaging in collusion con-sists of several steps. First we extract the co-bidding network of firms in a mar-ket, connecting two firms by an edge with a weight that increases as they morefrequently bid for the same contract. We then identify groups of firms whichfrequently bid for the same contracts using a modified version of a popularoverlapping community detection algorithm [222]. The method is greedy, andthe function to merge nodes into groups has a penalty term for the numberof nodes included, insuring that the groups detected remain small relative tothe size of the market. Finally, we calculate topological features of the groups:their coherence and exclusivity. We suggest sustained collusion is more likely toemerge among high coherence and exclusivity groups because they offer theideal conditions for firms to learn to cooperate and trust one another. We find
CE
UeT
DC
olle
ctio
n
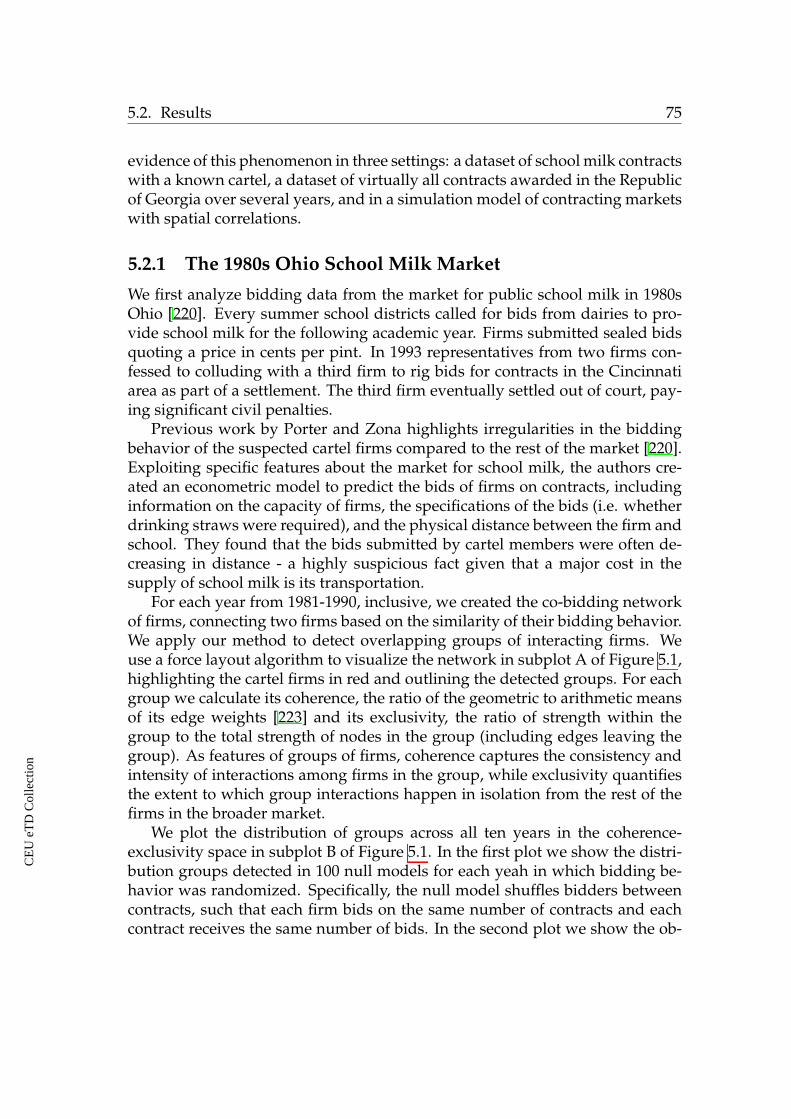
5.2. Results 75
evidence of this phenomenon in three settings: a dataset of school milk contractswith a known cartel, a dataset of virtually all contracts awarded in the Republicof Georgia over several years, and in a simulation model of contracting marketswith spatial correlations.
5.2.1 The 1980s Ohio School Milk Market
We first analyze bidding data from the market for public school milk in 1980sOhio [220]. Every summer school districts called for bids from dairies to pro-vide school milk for the following academic year. Firms submitted sealed bidsquoting a price in cents per pint. In 1993 representatives from two firms con-fessed to colluding with a third firm to rig bids for contracts in the Cincinnatiarea as part of a settlement. The third firm eventually settled out of court, pay-ing significant civil penalties.
Previous work by Porter and Zona highlights irregularities in the biddingbehavior of the suspected cartel firms compared to the rest of the market [220].Exploiting specific features about the market for school milk, the authors cre-ated an econometric model to predict the bids of firms on contracts, includinginformation on the capacity of firms, the specifications of the bids (i.e. whetherdrinking straws were required), and the physical distance between the firm andschool. They found that the bids submitted by cartel members were often de-creasing in distance - a highly suspicious fact given that a major cost in thesupply of school milk is its transportation.
For each year from 1981-1990, inclusive, we created the co-bidding networkof firms, connecting two firms based on the similarity of their bidding behavior.We apply our method to detect overlapping groups of interacting firms. Weuse a force layout algorithm to visualize the network in subplot A of Figure 5.1,highlighting the cartel firms in red and outlining the detected groups. For eachgroup we calculate its coherence, the ratio of the geometric to arithmetic meansof its edge weights [223] and its exclusivity, the ratio of strength within thegroup to the total strength of nodes in the group (including edges leaving thegroup). As features of groups of firms, coherence captures the consistency andintensity of interactions among firms in the group, while exclusivity quantifiesthe extent to which group interactions happen in isolation from the rest of thefirms in the broader market.
We plot the distribution of groups across all ten years in the coherence-exclusivity space in subplot B of Figure 5.1. In the first plot we show the distri-bution groups detected in 100 null models for each yeah in which bidding be-havior was randomized. Specifically, the null model shuffles bidders betweencontracts, such that each firm bids on the same number of contracts and eachcontract receives the same number of bids. In the second plot we show the ob-
CE
UeT
DC
olle
ctio
n
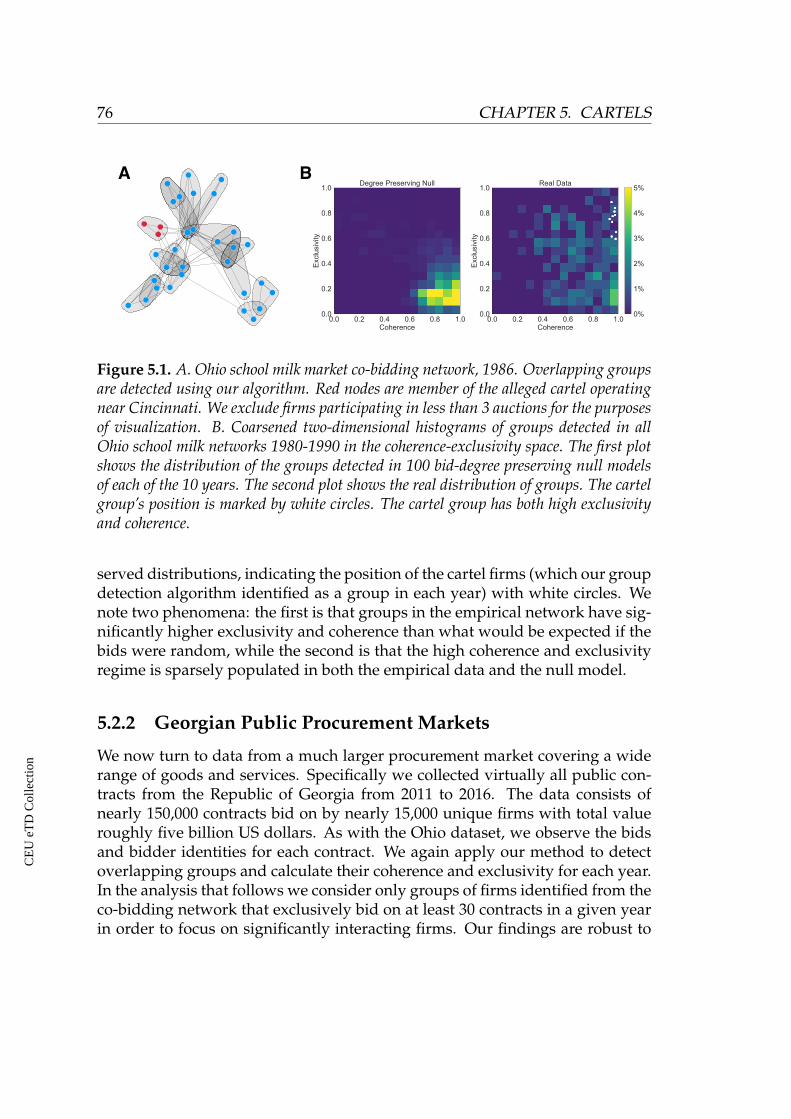
76 CHAPTER 5. CARTELS
A B
Figure 5.1. A. Ohio school milk market co-bidding network, 1986. Overlapping groupsare detected using our algorithm. Red nodes are member of the alleged cartel operatingnear Cincinnati. We exclude firms participating in less than 3 auctions for the purposesof visualization. B. Coarsened two-dimensional histograms of groups detected in allOhio school milk networks 1980-1990 in the coherence-exclusivity space. The first plotshows the distribution of the groups detected in 100 bid-degree preserving null modelsof each of the 10 years. The second plot shows the real distribution of groups. The cartelgroup’s position is marked by white circles. The cartel group has both high exclusivityand coherence.
served distributions, indicating the position of the cartel firms (which our groupdetection algorithm identified as a group in each year) with white circles. Wenote two phenomena: the first is that groups in the empirical network have sig-nificantly higher exclusivity and coherence than what would be expected if thebids were random, while the second is that the high coherence and exclusivityregime is sparsely populated in both the empirical data and the null model.
5.2.2 Georgian Public Procurement Markets
We now turn to data from a much larger procurement market covering a widerange of goods and services. Specifically we collected virtually all public con-tracts from the Republic of Georgia from 2011 to 2016. The data consists ofnearly 150,000 contracts bid on by nearly 15,000 unique firms with total valueroughly five billion US dollars. As with the Ohio dataset, we observe the bidsand bidder identities for each contract. We again apply our method to detectoverlapping groups and calculate their coherence and exclusivity for each year.In the analysis that follows we consider only groups of firms identified from theco-bidding network that exclusively bid on at least 30 contracts in a given yearin order to focus on significantly interacting firms. Our findings are robust to
CE
UeT
DC
olle
ctio
n
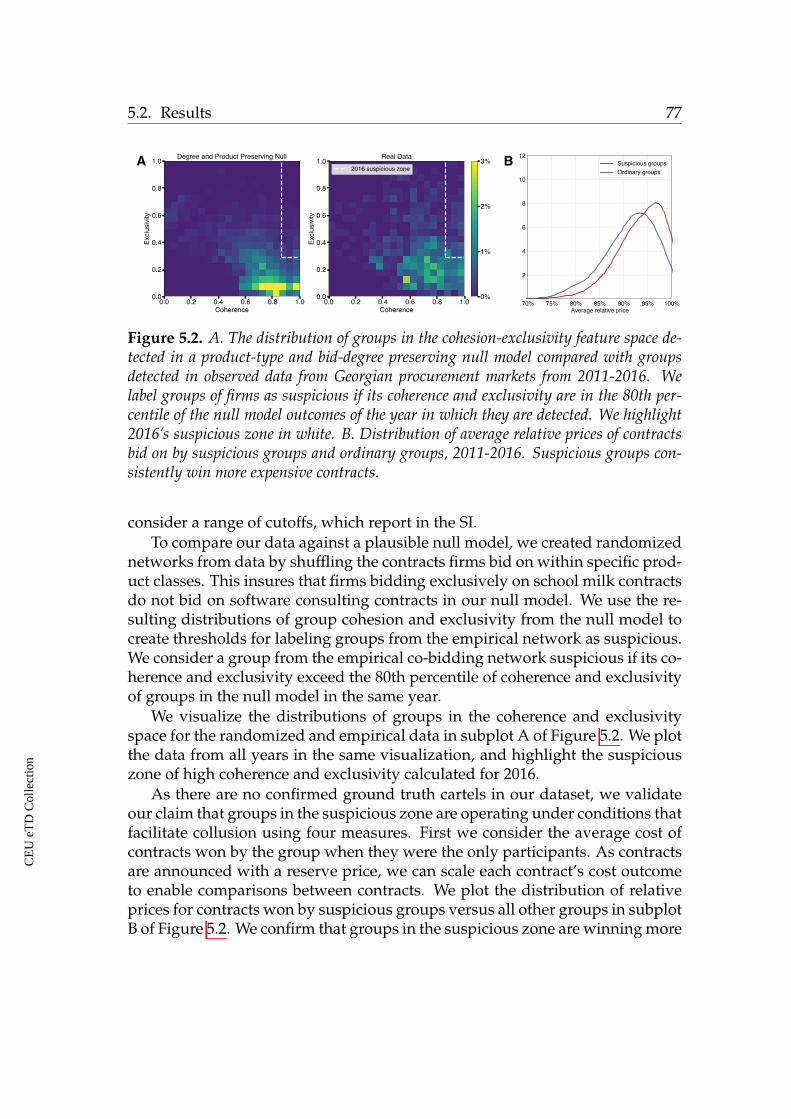
5.2. Results 77
A B
Figure 5.2. A. The distribution of groups in the cohesion-exclusivity feature space de-tected in a product-type and bid-degree preserving null model compared with groupsdetected in observed data from Georgian procurement markets from 2011-2016. Welabel groups of firms as suspicious if its coherence and exclusivity are in the 80th per-centile of the null model outcomes of the year in which they are detected. We highlight2016’s suspicious zone in white. B. Distribution of average relative prices of contractsbid on by suspicious groups and ordinary groups, 2011-2016. Suspicious groups con-sistently win more expensive contracts.
consider a range of cutoffs, which report in the SI.To compare our data against a plausible null model, we created randomized
networks from data by shuffling the contracts firms bid on within specific prod-uct classes. This insures that firms bidding exclusively on school milk contractsdo not bid on software consulting contracts in our null model. We use the re-sulting distributions of group cohesion and exclusivity from the null model tocreate thresholds for labeling groups from the empirical network as suspicious.We consider a group from the empirical co-bidding network suspicious if its co-herence and exclusivity exceed the 80th percentile of coherence and exclusivityof groups in the null model in the same year.
We visualize the distributions of groups in the coherence and exclusivityspace for the randomized and empirical data in subplot A of Figure 5.2. We plotthe data from all years in the same visualization, and highlight the suspiciouszone of high coherence and exclusivity calculated for 2016.
As there are no confirmed ground truth cartels in our dataset, we validateour claim that groups in the suspicious zone are operating under conditions thatfacilitate collusion using four measures. First we consider the average cost ofcontracts won by the group when they were the only participants. As contractsare announced with a reserve price, we can scale each contract’s cost outcometo enable comparisons between contracts. We plot the distribution of relativeprices for contracts won by suspicious groups versus all other groups in subplotB of Figure 5.2. We confirm that groups in the suspicious zone are winning more
CE
UeT
DC
olle
ctio
n
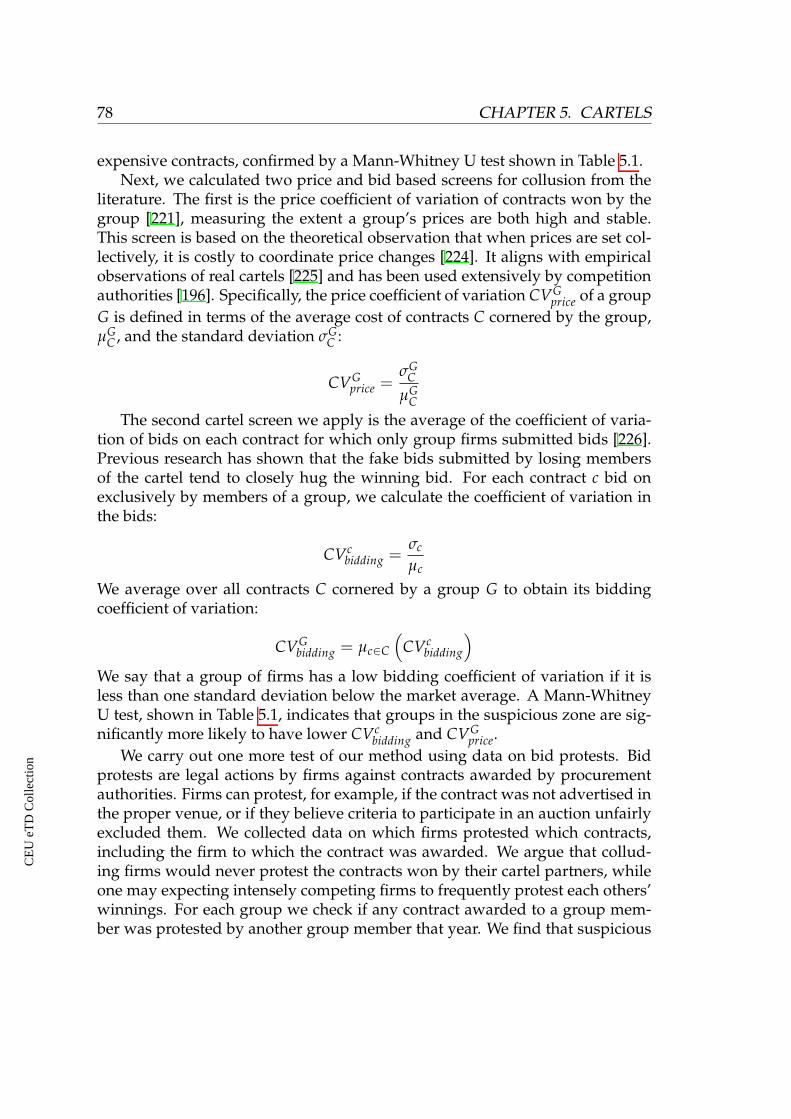
78 CHAPTER 5. CARTELS
expensive contracts, confirmed by a Mann-Whitney U test shown in Table 5.1.Next, we calculated two price and bid based screens for collusion from the
literature. The first is the price coefficient of variation of contracts won by thegroup [221], measuring the extent a group’s prices are both high and stable.This screen is based on the theoretical observation that when prices are set col-lectively, it is costly to coordinate price changes [224]. It aligns with empiricalobservations of real cartels [225] and has been used extensively by competitionauthorities [196]. Specifically, the price coefficient of variation CVG
price of a groupG is defined in terms of the average cost of contracts C cornered by the group,µG
C , and the standard deviation sGC :
CVGprice =
sGC
µGC
The second cartel screen we apply is the average of the coefficient of varia-tion of bids on each contract for which only group firms submitted bids [226].Previous research has shown that the fake bids submitted by losing membersof the cartel tend to closely hug the winning bid. For each contract c bid onexclusively by members of a group, we calculate the coefficient of variation inthe bids:
CVcbidding =
scµc
We average over all contracts C cornered by a group G to obtain its biddingcoefficient of variation:
CVGbidding = µc2C
⇣CVc
bidding
⌘
We say that a group of firms has a low bidding coefficient of variation if it isless than one standard deviation below the market average. A Mann-WhitneyU test, shown in Table 5.1, indicates that groups in the suspicious zone are sig-nificantly more likely to have lower CVc
bidding and CVGprice.
We carry out one more test of our method using data on bid protests. Bidprotests are legal actions by firms against contracts awarded by procurementauthorities. Firms can protest, for example, if the contract was not advertised inthe proper venue, or if they believe criteria to participate in an auction unfairlyexcluded them. We collected data on which firms protested which contracts,including the firm to which the contract was awarded. We argue that collud-ing firms would never protest the contracts won by their cartel partners, whileone may expecting intensely competing firms to frequently protest each others’winnings. For each group we check if any contract awarded to a group mem-ber was protested by another group member that year. We find that suspicious
CE
UeT
DC
olle
ctio
n
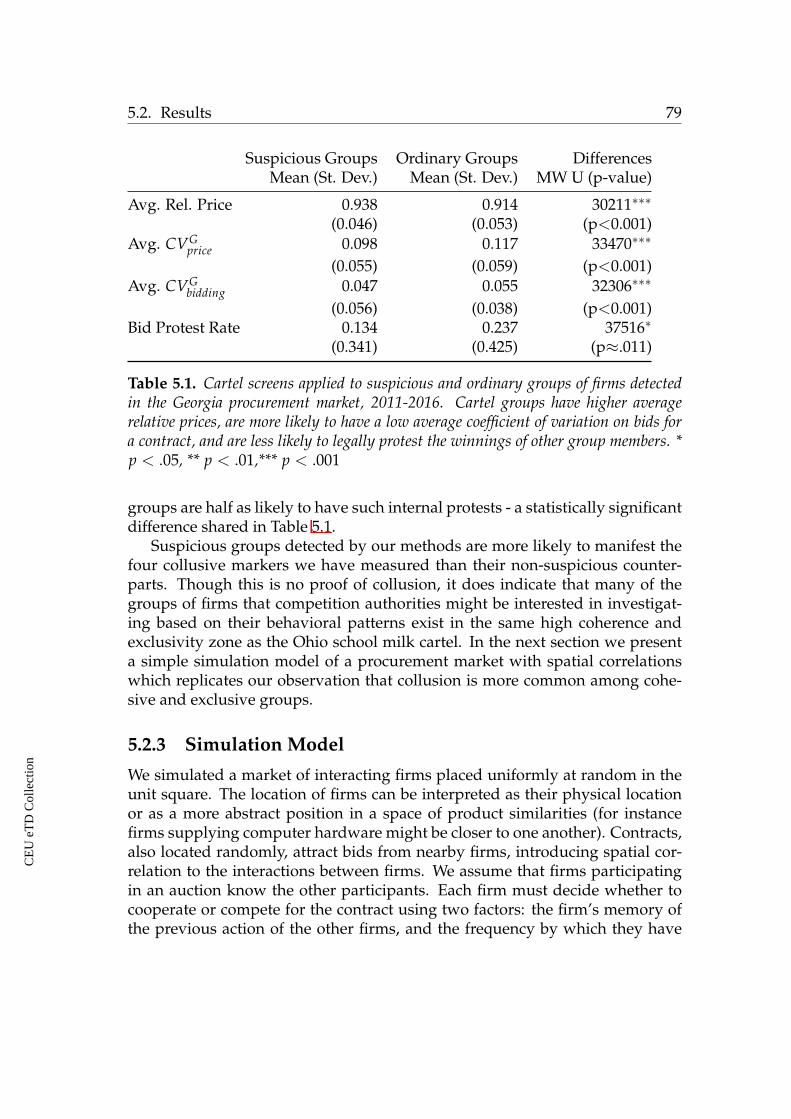
5.2. Results 79
Suspicious Groups Ordinary Groups DifferencesMean (St. Dev.) Mean (St. Dev.) MW U (p-value)
Avg. Rel. Price 0.938 0.914 30211⇤⇤⇤(0.046) (0.053) (p<0.001)
Avg. CVGprice 0.098 0.117 33470⇤⇤⇤
(0.055) (0.059) (p<0.001)Avg. CVG
bidding 0.047 0.055 32306⇤⇤⇤
(0.056) (0.038) (p<0.001)Bid Protest Rate 0.134 0.237 37516⇤
(0.341) (0.425) (p⇡.011)
Table 5.1. Cartel screens applied to suspicious and ordinary groups of firms detectedin the Georgia procurement market, 2011-2016. Cartel groups have higher averagerelative prices, are more likely to have a low average coefficient of variation on bids fora contract, and are less likely to legally protest the winnings of other group members. *p < .05, ** p < .01,*** p < .001
groups are half as likely to have such internal protests - a statistically significantdifference shared in Table 5.1.
Suspicious groups detected by our methods are more likely to manifest thefour collusive markers we have measured than their non-suspicious counter-parts. Though this is no proof of collusion, it does indicate that many of thegroups of firms that competition authorities might be interested in investigat-ing based on their behavioral patterns exist in the same high coherence andexclusivity zone as the Ohio school milk cartel. In the next section we presenta simple simulation model of a procurement market with spatial correlationswhich replicates our observation that collusion is more common among cohe-sive and exclusive groups.
5.2.3 Simulation Model
We simulated a market of interacting firms placed uniformly at random in theunit square. The location of firms can be interpreted as their physical locationor as a more abstract position in a space of product similarities (for instancefirms supplying computer hardware might be closer to one another). Contracts,also located randomly, attract bids from nearby firms, introducing spatial cor-relation to the interactions between firms. We assume that firms participatingin an auction know the other participants. Each firm must decide whether tocooperate or compete for the contract using two factors: the firm’s memory ofthe previous action of the other firms, and the frequency by which they have
CE
UeT
DC
olle
ctio
n
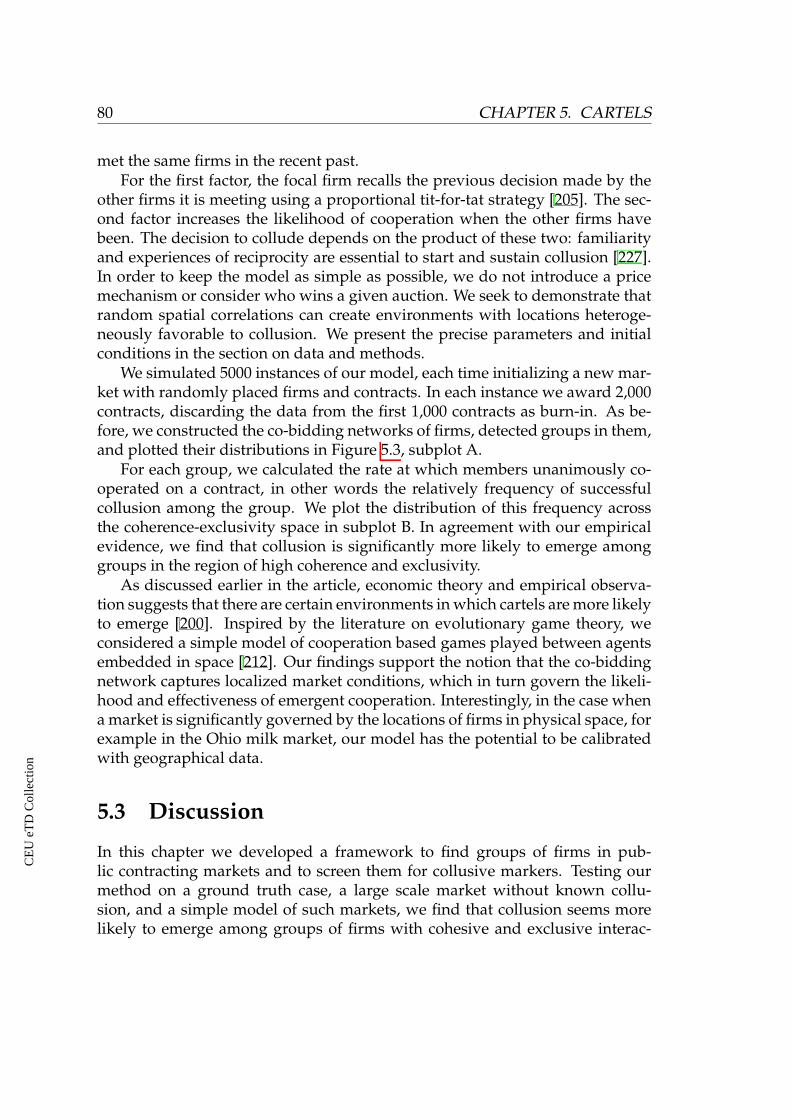
80 CHAPTER 5. CARTELS
met the same firms in the recent past.For the first factor, the focal firm recalls the previous decision made by the
other firms it is meeting using a proportional tit-for-tat strategy [205]. The sec-ond factor increases the likelihood of cooperation when the other firms havebeen. The decision to collude depends on the product of these two: familiarityand experiences of reciprocity are essential to start and sustain collusion [227].In order to keep the model as simple as possible, we do not introduce a pricemechanism or consider who wins a given auction. We seek to demonstrate thatrandom spatial correlations can create environments with locations heteroge-neously favorable to collusion. We present the precise parameters and initialconditions in the section on data and methods.
We simulated 5000 instances of our model, each time initializing a new mar-ket with randomly placed firms and contracts. In each instance we award 2,000contracts, discarding the data from the first 1,000 contracts as burn-in. As be-fore, we constructed the co-bidding networks of firms, detected groups in them,and plotted their distributions in Figure 5.3, subplot A.
For each group, we calculated the rate at which members unanimously co-operated on a contract, in other words the relatively frequency of successfulcollusion among the group. We plot the distribution of this frequency acrossthe coherence-exclusivity space in subplot B. In agreement with our empiricalevidence, we find that collusion is significantly more likely to emerge amonggroups in the region of high coherence and exclusivity.
As discussed earlier in the article, economic theory and empirical observa-tion suggests that there are certain environments in which cartels are more likelyto emerge [200]. Inspired by the literature on evolutionary game theory, weconsidered a simple model of cooperation based games played between agentsembedded in space [212]. Our findings support the notion that the co-biddingnetwork captures localized market conditions, which in turn govern the likeli-hood and effectiveness of emergent cooperation. Interestingly, in the case whena market is significantly governed by the locations of firms in physical space, forexample in the Ohio milk market, our model has the potential to be calibratedwith geographical data.
5.3 Discussion
In this chapter we developed a framework to find groups of firms in pub-lic contracting markets and to screen them for collusive markers. Testing ourmethod on a ground truth case, a large scale market without known collu-sion, and a simple model of such markets, we find that collusion seems morelikely to emerge among groups of firms with cohesive and exclusive interac-
CE
UeT
DC
olle
ctio
n
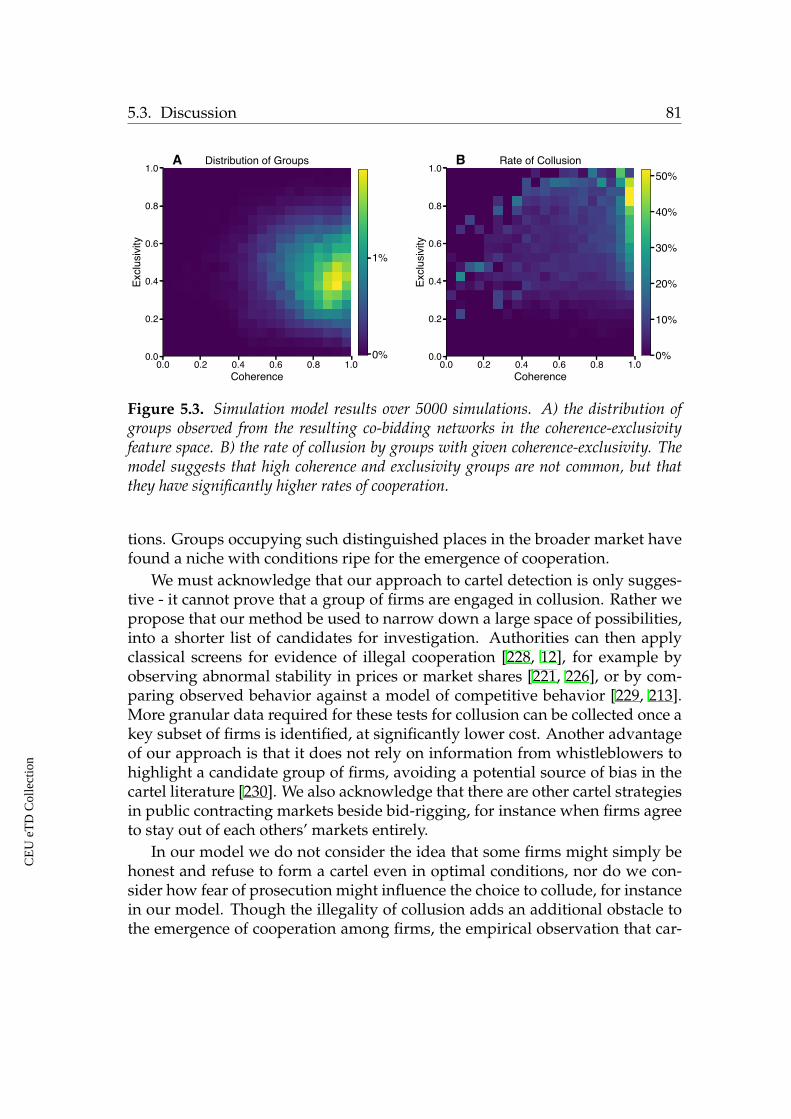
5.3. Discussion 81
Figure 5.3. Simulation model results over 5000 simulations. A) the distribution ofgroups observed from the resulting co-bidding networks in the coherence-exclusivityfeature space. B) the rate of collusion by groups with given coherence-exclusivity. Themodel suggests that high coherence and exclusivity groups are not common, but thatthey have significantly higher rates of cooperation.
tions. Groups occupying such distinguished places in the broader market havefound a niche with conditions ripe for the emergence of cooperation.
We must acknowledge that our approach to cartel detection is only sugges-tive - it cannot prove that a group of firms are engaged in collusion. Rather wepropose that our method be used to narrow down a large space of possibilities,into a shorter list of candidates for investigation. Authorities can then applyclassical screens for evidence of illegal cooperation [228, 12], for example byobserving abnormal stability in prices or market shares [221, 226], or by com-paring observed behavior against a model of competitive behavior [229, 213].More granular data required for these tests for collusion can be collected once akey subset of firms is identified, at significantly lower cost. Another advantageof our approach is that it does not rely on information from whistleblowers tohighlight a candidate group of firms, avoiding a potential source of bias in thecartel literature [230]. We also acknowledge that there are other cartel strategiesin public contracting markets beside bid-rigging, for instance when firms agreeto stay out of each others’ markets entirely.
In our model we do not consider the idea that some firms might simply behonest and refuse to form a cartel even in optimal conditions, nor do we con-sider how fear of prosecution might influence the choice to collude, for instancein our model. Though the illegality of collusion adds an additional obstacle tothe emergence of cooperation among firms, the empirical observation that car-
CE
UeT
DC
olle
ctio
n
82 CHAPTER 5. CARTELS
tel life spans are heterogeneous suggests that many firms are willing to collude,but that only certain environments are conducive to cartels [200].
In spite of the limitations, we note that our method can be applied to otherquestions about cartels. For example, what does the co-bidding network looklike near a cartel when it is born compared to when it dies? The inner-workingsof potential cartels would surely be reflected in network structure of the market.Observed cartels have operated by methods such as rotating the winner [231],by side payments to losing firms [213], and some even run internal auctionsto optimize their profits [232]. Observing the relationship between the pro-cedure by which contracts are awarded, for example to the trimmed-averagebidder in Italian road contracts [233] or by randomly chosen open or sealedbid procedures in timber auctions [234], and network structure may also revealwhether firms are competing or colluding. The specifics of a market and man-ner by which contracts are awarded matters a great deal to how collusion mightevolve [235]. Certain rules make it easier for firms to collude or easier to detectcollusion [233, 234].
We are confident that our approach can be applied to these cases in whichwe have extra information about the rules of a market. It is likely still the casethat certain patterns of interaction are effective markers of collusion and thatnetworks provide a useful map of such interactions.
5.4 Methods and Data
5.4.1 Co-bidding networks, group detection, and group fea-
tures
We define a public contracting market’s co-bidding network as a projection of abipartite network onto the set of firms active in the market. Specifically, weform a bipartite network of contracts and firms bidding on them, then create anetwork of firms which bid for the same contract. We weight the connectionsbased on the similarity of co-bidding behavior between firms using Jaccard sim-ilarity. Specifically, firm A and firm B are connected by a link with weight equalto the overlap of the contracts they bid on:
wA,B =|cA \ cB||cA [ cB|
,
where cA (cB) is the set of contracts of A (B) with at least one other bidder and| · | is the cardinality of a set.
Given a co-bidding network our aim is to extract groups of nodes whichmay be analyzed for cartel activity. Groups should be communities in the net-
CE
UeT
DC
olle
ctio
n
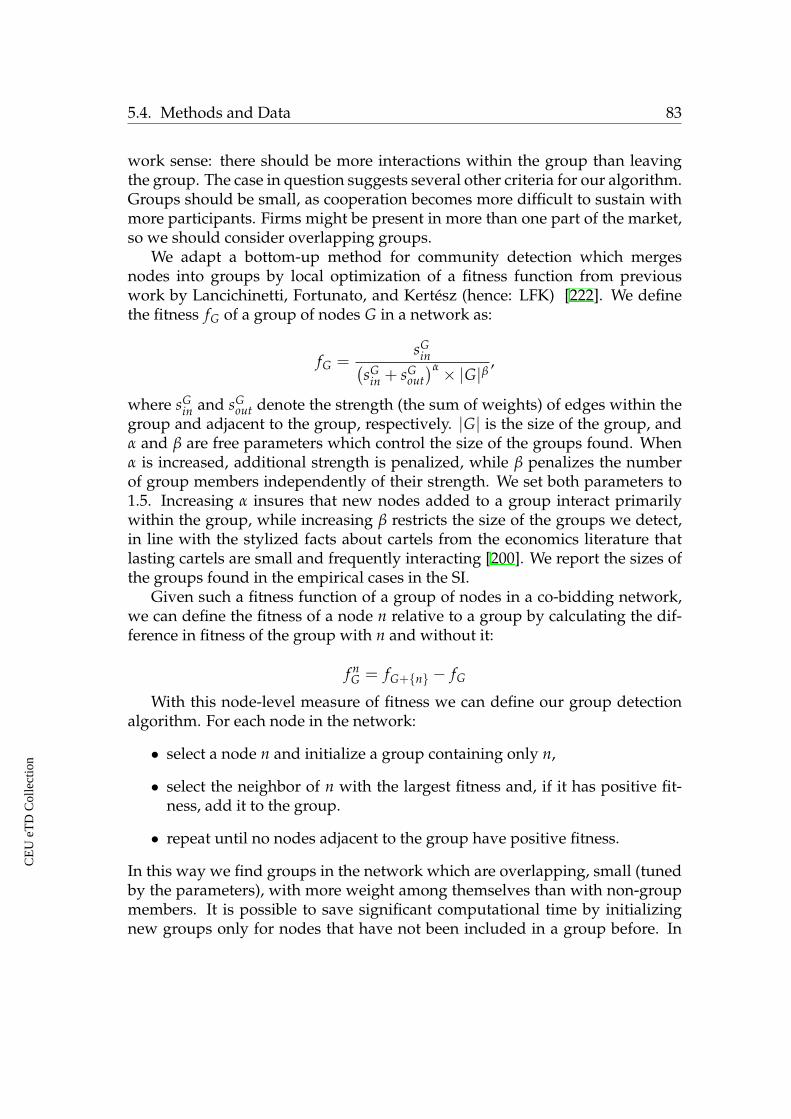
5.4. Methods and Data 83
work sense: there should be more interactions within the group than leavingthe group. The case in question suggests several other criteria for our algorithm.Groups should be small, as cooperation becomes more difficult to sustain withmore participants. Firms might be present in more than one part of the market,so we should consider overlapping groups.
We adapt a bottom-up method for community detection which mergesnodes into groups by local optimization of a fitness function from previouswork by Lancichinetti, Fortunato, and Kertesz (hence: LFK) [222]. We definethe fitness fG of a group of nodes G in a network as:
fG =sG
in�sG
in + sGout�a ⇥ |G|b
,
where sGin and sG
out denote the strength (the sum of weights) of edges within thegroup and adjacent to the group, respectively. |G| is the size of the group, anda and b are free parameters which control the size of the groups found. Whena is increased, additional strength is penalized, while b penalizes the numberof group members independently of their strength. We set both parameters to1.5. Increasing a insures that new nodes added to a group interact primarilywithin the group, while increasing b restricts the size of the groups we detect,in line with the stylized facts about cartels from the economics literature thatlasting cartels are small and frequently interacting [200]. We report the sizes ofthe groups found in the empirical cases in the SI.
Given such a fitness function of a group of nodes in a co-bidding network,we can define the fitness of a node n relative to a group by calculating the dif-ference in fitness of the group with n and without it:
f nG = fG+{n} � fG
With this node-level measure of fitness we can define our group detectionalgorithm. For each node in the network:
• select a node n and initialize a group containing only n,
• select the neighbor of n with the largest fitness and, if it has positive fit-ness, add it to the group.
• repeat until no nodes adjacent to the group have positive fitness.
In this way we find groups in the network which are overlapping, small (tunedby the parameters), with more weight among themselves than with non-groupmembers. It is possible to save significant computational time by initializingnew groups only for nodes that have not been included in a group before. In
CE
UeT
DC
olle
ctio
n
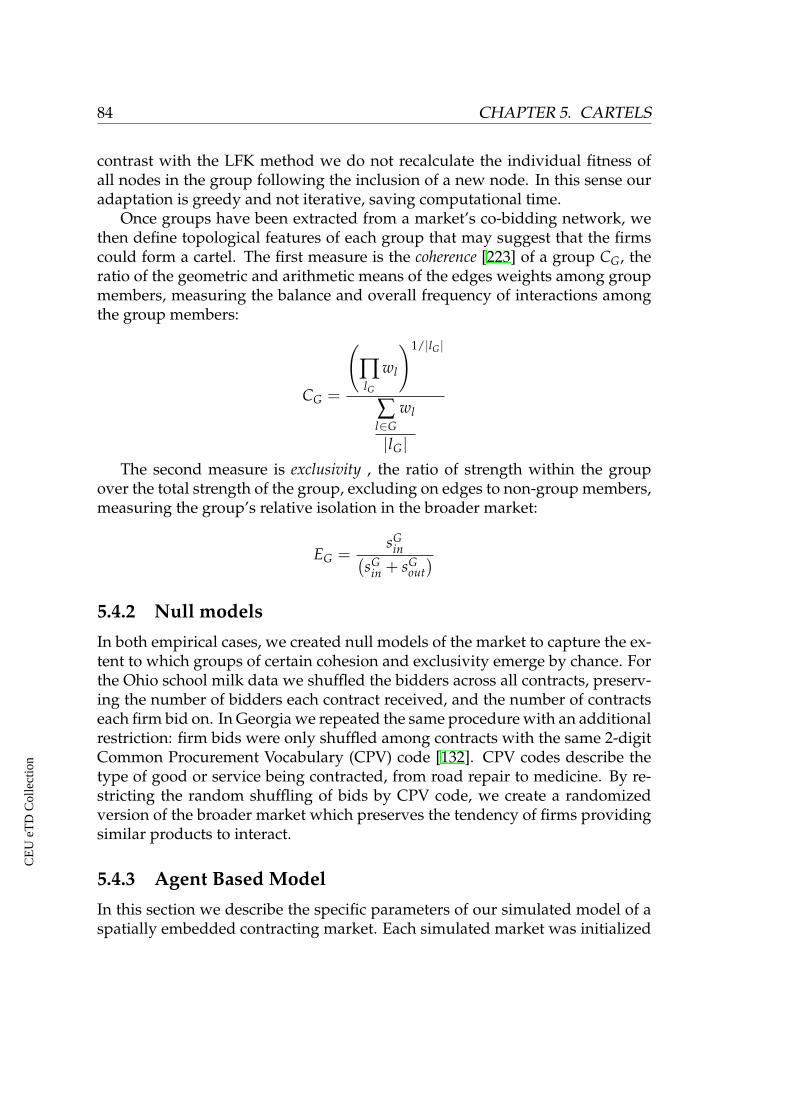
84 CHAPTER 5. CARTELS
contrast with the LFK method we do not recalculate the individual fitness ofall nodes in the group following the inclusion of a new node. In this sense ouradaptation is greedy and not iterative, saving computational time.
Once groups have been extracted from a market’s co-bidding network, wethen define topological features of each group that may suggest that the firmscould form a cartel. The first measure is the coherence [223] of a group CG, theratio of the geometric and arithmetic means of the edges weights among groupmembers, measuring the balance and overall frequency of interactions amongthe group members:
CG =
’lG
wl
!1/|lG|
Âl2G
wl
|lG|The second measure is exclusivity , the ratio of strength within the group
over the total strength of the group, excluding on edges to non-group members,measuring the group’s relative isolation in the broader market:
EG =sG
in�sG
in + sGout�
5.4.2 Null models
In both empirical cases, we created null models of the market to capture the ex-tent to which groups of certain cohesion and exclusivity emerge by chance. Forthe Ohio school milk data we shuffled the bidders across all contracts, preserv-ing the number of bidders each contract received, and the number of contractseach firm bid on. In Georgia we repeated the same procedure with an additionalrestriction: firm bids were only shuffled among contracts with the same 2-digitCommon Procurement Vocabulary (CPV) code [132]. CPV codes describe thetype of good or service being contracted, from road repair to medicine. By re-stricting the random shuffling of bids by CPV code, we create a randomizedversion of the broader market which preserves the tendency of firms providingsimilar products to interact.
5.4.3 Agent Based Model
In this section we describe the specific parameters of our simulated model of aspatially embedded contracting market. Each simulated market was initialized
CE
UeT
DC
olle
ctio
n
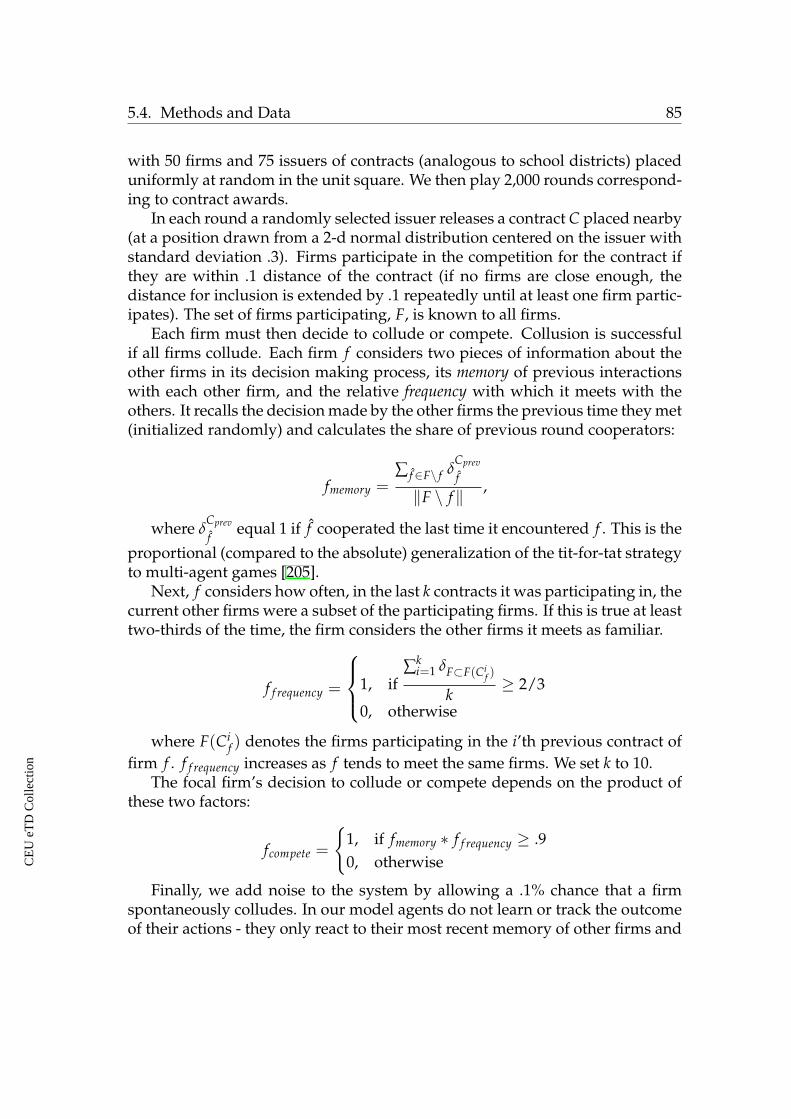
5.4. Methods and Data 85
with 50 firms and 75 issuers of contracts (analogous to school districts) placeduniformly at random in the unit square. We then play 2,000 rounds correspond-ing to contract awards.
In each round a randomly selected issuer releases a contract C placed nearby(at a position drawn from a 2-d normal distribution centered on the issuer withstandard deviation .3). Firms participate in the competition for the contract ifthey are within .1 distance of the contract (if no firms are close enough, thedistance for inclusion is extended by .1 repeatedly until at least one firm partic-ipates). The set of firms participating, F, is known to all firms.
Each firm must then decide to collude or compete. Collusion is successfulif all firms collude. Each firm f considers two pieces of information about theother firms in its decision making process, its memory of previous interactionswith each other firm, and the relative frequency with which it meets with theothers. It recalls the decision made by the other firms the previous time they met(initialized randomly) and calculates the share of previous round cooperators:
fmemory =Â f2F\ f d
Cprev
f
kF \ f k ,
where dCprev
fequal 1 if f cooperated the last time it encountered f . This is the
proportional (compared to the absolute) generalization of the tit-for-tat strategyto multi-agent games [205].
Next, f considers how often, in the last k contracts it was participating in, thecurrent other firms were a subset of the participating firms. If this is true at leasttwo-thirds of the time, the firm considers the other firms it meets as familiar.
f f requency =
8><
>:1, if
Âki=1 dF⇢F(Ci
f )
k� 2/3
0, otherwise
where F(Cif ) denotes the firms participating in the i’th previous contract of
firm f . f f requency increases as f tends to meet the same firms. We set k to 10.The focal firm’s decision to collude or compete depends on the product of
these two factors:
fcompete =
(1, if fmemory ⇤ f f requency � .90, otherwise
Finally, we add noise to the system by allowing a .1% chance that a firmspontaneously colludes. In our model agents do not learn or track the outcomeof their actions - they only react to their most recent memory of other firms and
CE
UeT
DC
olle
ctio
n
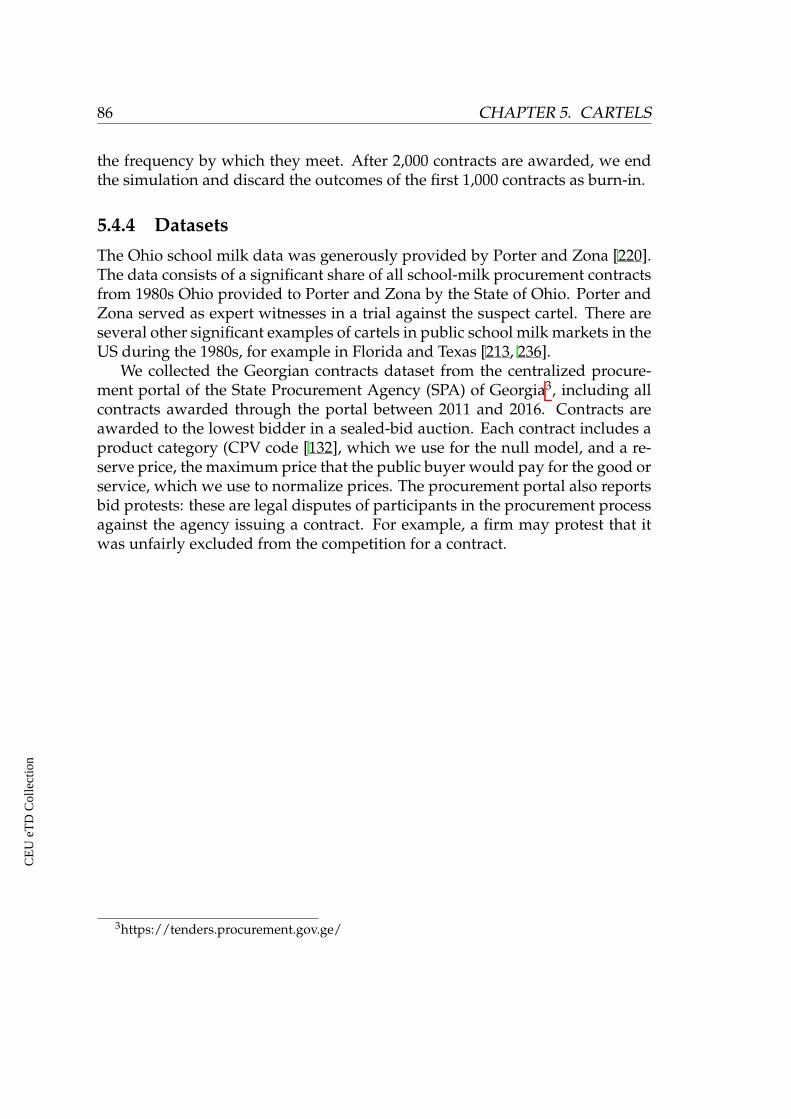
86 CHAPTER 5. CARTELS
the frequency by which they meet. After 2,000 contracts are awarded, we endthe simulation and discard the outcomes of the first 1,000 contracts as burn-in.
5.4.4 Datasets
The Ohio school milk data was generously provided by Porter and Zona [220].The data consists of a significant share of all school-milk procurement contractsfrom 1980s Ohio provided to Porter and Zona by the State of Ohio. Porter andZona served as expert witnesses in a trial against the suspect cartel. There areseveral other significant examples of cartels in public school milk markets in theUS during the 1980s, for example in Florida and Texas [213, 236].
We collected the Georgian contracts dataset from the centralized procure-ment portal of the State Procurement Agency (SPA) of Georgia3, including allcontracts awarded through the portal between 2011 and 2016. Contracts areawarded to the lowest bidder in a sealed-bid auction. Each contract includes aproduct category (CPV code [132], which we use for the null model, and a re-serve price, the maximum price that the public buyer would pay for the good orservice, which we use to normalize prices. The procurement portal also reportsbid protests: these are legal disputes of participants in the procurement processagainst the agency issuing a contract. For example, a firm may protest that itwas unfairly excluded from the competition for a contract.
3https://tenders.procurement.gov.ge/
CE
UeT
DC
olle
ctio
n
CHAPTER 6
CONCLUSION
This thesis set out to demonstrate the utility of a network perspective on corrup-tion. Noting that previous approaches to the study of corruption are either oftenoverly atomic or overly structural, we framed corruption as an emergent phe-nomenon occurring between actors within the networks of their interactions.We leveraged the recent proliferation of data on public procurement to createtransaction-level measures of corruption risk, which we embed in social andeconomic contexts. Our approach is validated by the observation that bad be-havior at the dyadic level (i.e. between a corruption issuer and winner or amongcolluding firms) is related to and to some extent predicted by the network thedyad is embedded in [19].
We have seen that social networks in a place relate to the prevalence of cor-ruption in its local government. The findings of Chapter 3 suggest that certainmodes of social organization facilitate corrupt behavior. These modes are in-creasingly observable and measurable at the level of societies because of thevast amount of data created by the use of modern telecommunication services.This suggests why corruption is a stubborn phenomenon, and why most inter-ventions don’t work.
At the national level, we saw in Chapter 4 that corruption risk is distributedin very different ways across EU countries, nearly independent of the overalllevel of corruption risk observed in a country. In some countries with highlevels of corruption risk, corruption is significantly concentrated in the relation-ships between core issuers and winners, while in other countries corruption ismore concentrated among peripheral actors. Corruption risk tends to cluster inall countries in our analysis, though the extent to which it does varies greatly.Finally, we also observe significant heterogeneity in the response of corrupt re-lationships to political shocks. These differences have significant implications
87
CE
UeT
DC
olle
ctio
n
88 CHAPTER 6. CONCLUSION
for anti-corruption strategies, casting doubt on global solutions. Indeed onecould say that while countries with little amounts of corruption are similar, eachhighly corrupt country is corrupt in its own way.
Finally, we presented a method to detect potential hot-spots for the emer-gence of illegal collusion in competitive markets using data on bidding. Usingtwo empirical cases and a simulated model we showed how groups occupyingspecific positions in the co-bidding network topology are uniquely able to sus-tain the cooperation needed to maintain a cartel. Our framework demonstratesa way to reduce the vast complexity of a market to highlight groups of firmsworth investigating.
Given previous work on the networked nature of criminal conspiracies, itis perhaps no surprise that a study of corruption and collusion in procurementmarkets found significant relationships between network structure and bad be-havior. We argue that the specific methods developed and analyses carried outoffer actionable insights into how corruption works in different contexts. Theyalso offer a kind of blueprint for future analyses, showing how procurementdata can be analyzed using network methods.
Future Work
The future for data-driven anti-corruption research looks bright. Data qualityand access are generally improving. New sources of data will go a long way toaddressing some of the shortcomings and limitations of the work in this thesis.For example, data on company owners and board members and the economicand social relations of politicians and regulators have potential to extend thescope of the work presented in this thesis. Network methods are clearly appli-cable in these contexts as well. For instance, by tracking social network con-nections of firm leaders to people in power, one could measure the extent ofpolitical corruption in a country by the effect of such connections on profitabil-ity.
A major challenge in corruption research using big data will be to carry outcausal inference. Though data collected at large scales has many advantages,for instance allowing us to observe whole markets across significant periods oftime, it seems unrealistic to carry out experimental studies at the same scale,especially without the participation of government bodies. Further research isneeded to extend methods of causal inference, for instance as often applied topanel data by economists, to the setting of networks.
In the absence of causal identification, the scientific value of the methodsdeveloped in this thesis can be tested in other ways. If network analyses ofprocurement based risk indicators can predict corruption cases that authorities,researchers, or journalists can confirm, that would lend additional credibility to
CE
UeT
DC
olle
ctio
n

89
our approach. One can also strengthen the validity of these methods by findingevidence of other kinds of white-collar crime occurring among distinguishedactors, following the classical adage that “where there is smoke, there is fire”.
The involvement of governments in anti-corruption research presents bothopportunities and dangers. Public actors willing to experiment with rules or en-forcement can help overcome problems of causal interpretation inherent in thestudy of observational data. Such collaborations also have the greatest potentialfor real-world impact, clearly. However, if researchers of corruption focus theirattention too much on such collaborations, they would introduce a significantbias to our understanding of corruption. Indeed, where corruption is endemic,it is unlikely that relevant government bodies would be willing to participate ineffective anti-corruption studies. Engagement with super-national actors withsome independent authority in certain locations, for example with the WorldBank in its procurement-based development projects or the EU and it cohesionfunds, would overcome this issue to some extent. Certainly, the first step in thisdirection would be to convince individuals in these organizations of the valueof network methods in the study of corruption. We hope that this thesis will beuseful in this regard.
CE
UeT
DC
olle
ctio
n

90 CHAPTER 6. CONCLUSION
CE
UeT
DC
olle
ctio
n
BIBLIOGRAPHY
[1] Mauro, P.: Corruption and growth. The Quarterly Journal of Economics110(3), 681–712 (1995)
[2] Rodrıguez-Pose, A., Di Cataldo, M.: Quality of government and innova-tive performance in the regions of europe. Journal of Economic Geogra-phy 15(4), 673–706 (2014)
[3] Gupta, S., Davoodi, H., Alonso-Terme, R.: Does corruption affect incomeinequality and poverty? Economics of governance 3(1), 23–45 (2002)
[4] Rothstein, B.: Corruption and social trust: Why the fish rots from the headdown. social research 80(4), 1009–1032 (2013)
[5] Lambsdorff, J.: How corruption in government affects public welfare: Areview of theory. Technical report, CeGE Discussion Paper (2001)
[6] Nye, J.S.: Corruption and political development: A cost-benefit analysis.American political science review 61(2), 417–427 (1967)
[7] Rose-Ackerman, S.: Corruption: A Study in Political Economy. AcademicPress, ??? (1978)
[8] Transparency International: Global corruption report 2007. Technical re-port (2007)
[9] Rothstein, B.O., Teorell, J.A.: What is quality of government? a theory ofimpartial government institutions. Governance 21(2), 165–190 (2008)
[10] Mungiu-Pippidi, A.: Controlling corruption through collective action.Journal of Democracy 24(1), 101–115 (2013)
[11] Mungiu-Pippidi, A.: Corruption: Diagnosis and Treatment. Democracy17(3) (2006)
91
CE
UeT
DC
olle
ctio
n
92 BIBLIOGRAPHY
[12] Fazekas, M., Bence, T.: Assessing the potential for detecting collusion inSwedish public procurement. Technical report, Swedish Competition Au-thority (2016)
[13] Watts, J.: Operation car wash: Is this the biggest corruption scandal inhistory. The Guardian 1(06), 2017 (2017)
[14] Ribeiro, H.V., Alves, L.G., Martins, A.F., Lenzi, E.K., Perc, M.: The dy-namical structure of political corruption networks. Journal of ComplexNetworks (2018)
[15] Ferrali, R.: Corruption as a criminal network. PhD thesis, Princeton Uni-versity (2018)
[16] Calderoni, F.: Strategic positioning in mafia networks. In: Third AnnualIllicit Networks Workshop, pp. 1–21 (2011). Equipe de recherche sur ladelinquance en reseau
[17] Krebs, V.E.: Mapping networks of terrorist cells. Connections 24(3), 43–52(2002)
[18] Wrong, D.H.: The oversocialized conception of man in modern sociology.American sociological review, 183–193 (1961)
[19] Granovetter, M.: Economic action and social structure: The problem ofembeddedness. American Journal of Sociology 91(3), 481–510 (1985)
[20] OECD.Stat: Government at a Glance - 2017 edition: Public procurement.https://stats.oecd.org/Index.aspx?QueryId=78413. Accessed: 2018-08-09 (2017)
[21] Fazekas, M., Toth, I.J.: From corruption to state capture: A new analyticalframework with empirical applications from hungary. Political ResearchQuarterly 69(2), 320–334 (2016)
[22] Fazekas, M., Kocsis, G.: Uncovering high-level corruption: Cross-national objective corruption risk indicators using public procurementdata. British Journal of Political Science, 1–10 (2017)
[23] Mungiu-Pippidi, A.: The time has come for evidence-based anticorrup-tion. Nature: Human Behavior (2017)
[24] Alm, E., Arkin, A.P.: Biological networks. Current opinion in structuralbiology 13(2), 193–202 (2003)
CE
UeT
DC
olle
ctio
n
Bibliography 93
[25] Ings, T.C., Montoya, J.M., Bascompte, J., Bluthgen, N., Brown, L., Dor-mann, C.F., Edwards, F., Figueroa, D., Jacob, U., Jones, J.I., et al.: Ecolog-ical networks–beyond food webs. Journal of Animal Ecology 78(1), 253–269 (2009)
[26] Borgatti, S.P., Everett, M.G., Johnson, J.C.: Analyzing Social Networks.Sage, (2018)
[27] Schweitzer, F., Fagiolo, G., Sornette, D., Vega-Redondo, F., Vespignani, A.,White, D.R.: Economic networks: The new challenges. Science 325(5939),422–425 (2009)
[28] Jackson, M.O.: Social and Economic Networks. Princeton universitypress, (2010)
[29] Barthelemy, M.: Spatial networks. Physics Reports 499(1-3), 1–101 (2011)
[30] Moreno, J.L.: Foundations of sociometry: An introduction. Sociometry,15–35 (1941)
[31] Freeman, L.C.: Centrality in social networks conceptual clarification. So-cial networks 1(3), 215–239 (1978)
[32] Wasserman, S., Faust, K.: Social Network Analysis: Methods and Appli-cations vol. 8. Cambridge university press, (1994)
[33] Freeman, L.C.: Some antecedents of social network analysis. Connections19(1), 39–42 (1996)
[34] Hidalgo, C.A.: Disconnected, fragmented, or united? a trans-disciplinaryreview of network science. Applied Network Science 1(1), 6 (2016)
[35] Elster, J.: Explaining Social Behavior: More Nuts and Bolts for the SocialSciences. Cambridge University Press, ??? (2015)
[36] Klitgaard, R.: Controlling Corruption. Univ of California Press, ??? (1988)
[37] Shleifer, A., Vishny, R.W.: Corruption. The quarterly journal of economics108(3), 599–617 (1993)
[38] Persson, A., Rothstein, B., Teorell, J.: Why anticorruption reformsfail—systemic corruption as a collective action problem. Governance26(3), 449–471 (2013)
CE
UeT
DC
olle
ctio
n
94 BIBLIOGRAPHY
[39] Mungiu-Pippidi, A., Dadasov, R.: Measuring control of corruption by anew index of public integrity. European Journal on Criminal Policy andResearch 22(3), 415–438 (2016)
[40] Acemoglu, D., Johnson, S., Robinson, J.A.: Reversal of fortune: Geogra-phy and institutions in the making of the modern world income distribu-tion. The Quarterly journal of economics 117(4), 1231–1294 (2002)
[41] Treisman, D.: The causes of corruption: a cross-national study. Journal ofpublic economics 76(3), 399–457 (2000)
[42] Treisman, D.: What have we learned about the causes of corruption fromten years of cross-national empirical research? Annu. Rev. Polit. Sci. 10,211–244 (2007)
[43] Broms, R., Dahlstrom, C., Fazekas, M.: Procurement and competition inswedish municipalities. (2017)
[44] Charron, N., Dijkstra, L., Lapuente, V.: Regional governance matters:Quality of government within european union member states. RegionalStudies 48(1), 68–90 (2014)
[45] Camerer, C.F., Loewenstein, G., Rabin, M.: Advances in Behavioral Eco-nomics. Princeton University Press, (2011)
[46] Arechar, A.A., Gachter, S., Molleman, L.: Conducting interactive experi-ments online. Experimental economics 21(1), 99–131 (2018)
[47] Duflo, E., Glennerster, R., Kremer, M.: Using randomization in devel-opment economics research: A toolkit. Handbook of development eco-nomics 4, 3895–3962 (2007)
[48] Abbink, K.: Laboratory experiments on corruption. International hand-book on the economics of corruption (2006)
[49] Propensities to engage in and punish corrupt behavior: Experimental ev-idence from Australia, India, Indonesia and Singapore. Journal of PublicEconomics 93(7-8), 843–851 (2009). doi:10.1016/j.jpubeco.2009.03.004
[50] Shalvi, S.: Corruption corrupts. Nature 531, 456–457 (2016)
[51] Gachter, S., Schulz, J.F.: Intrinsic honesy and the prevalencceof rule violations across societies. Nature 531(7595), 1–11 (2016).doi:10.1038/nature17160
CE
UeT
DC
olle
ctio
n
Bibliography 95
[52] Weisel, O., Shalvi, S.: The collaborative roots of corruption. Proceedingsof the National Academy of Sciences 112(34), 10651–10656 (2015)
[53] Kahneman, D., Knetsch, J.L., Thaler, R.H.: Fairness and the assumptionsof economics. Journal of business, 285–300 (1986)
[54] Olken, B.A.: Monitoring corruption: evidence from a field experiment inindonesia. Journal of Political Economy 115(2), 200–249 (2007)
[55] Bertrand, M., Djankov, S., Hanna, R., Mullainathan, S.: Obtaining adriver’s license in india: an experimental approach to studying corrup-tion. The Quarterly Journal of Economics 122(4), 1639–1676 (2007)
[56] Ferraz, C., Finan, F.: Exposing corrupt politicians: the effects of brazil’spublicly released audits on electoral outcomes. The Quarterly Journal ofEconomics 123(2), 703–745 (2008)
[57] Muco, A.: On Anti-Corruption Tools in Developing Countries. StockholmSchool of Economics, (2017)
[58] Muco, A.: Learn from thy neighbour: Do voters associate corruption withpolitical parties. Technical report, mimeo (2016)
[59] Miller, J.H., Page, S.E.: Complex Adaptive Systems: An Introduction toComputational Models of Social Life vol. 17. Princeton university press,(2009)
[60] Tirole, J.: A Theory of Collective Reputations. Review of Economic Stud-ies 63(1), 1–22 (1996). doi:10.2307/2298112
[61] Lambsdorff, J.G.: How Confidence Facilitates Illegal Transactions: AnEmpirical Approach. The American Journal of Economics and Sociology61(4), 829–853 (2002)
[62] Macy, M.W., Skvoretz, J.: The evolution of trust and cooperation betweenstrangers: A computational model. American Sociological Review, 638–660 (1998)
[63] Hammond, R.: Endogenous Transition Dynamics in Corruption: AnAgent-Based Computer Model. Working Paper, Center on Social and Eco-nomic Dynamics, Brookings Institute (19) (2000)
[64] Transparency International: Transparency international corruption per-ceptions index. Technical report. data retrieved from https://www.transparency.org/research/cpi/overview
CE
UeT
DC
olle
ctio
n
96 BIBLIOGRAPHY
[65] Lambsdorff, J.G.: 2002 corruption perceptions index. Global CorruptionReport, 262–322 (2003)
[66] The World Bank: World Bank Worldwide Governance Indicators. dataretrieved from https://info.worldbank.org/governance/wgi/index.aspx#home
[67] Kaufmann, D., Kraay, A., Mastruzzi, M.: Governance Matters IV: Gover-nance Indicators for 1996-2004. The World Bank, (2005)
[68] Heywood, P.M., Rose, J.: “close but no cigar”: the measurement of cor-ruption. Journal of Public Policy 34(3), 507–529 (2014)
[69] Hawken, A., Munck, G.L.: Do you know your data? measurement va-lidity in corruption research. Technical report, Working Paper - School ofPublic Policy, Pepperdine University (2009)
[70] Urra, F.-J.: Assessing corruption an analytical review of corruption mea-surement and its problems: Perception, error and utility. Technical report,Working Paper - Edmund A. Walsh School of Foreign Service (2007)
[71] Standaert, S.: Divining the level of corruption: a bayesian state-space ap-proach. Journal of Comparative Economics 43(3), 782–803 (2015)
[72] Coppedge, M., Gerring, J., Lindberg, S.I., Skaaning, S.-E., Teorell, J.,Altman, D., Andersson, F., Bernhard, M., Fish, M.S., Glynn, A., et al.:V-Dem Codebook v8. data retrieved from https://www.v-dem.net/en/reference/version-8-apr-2018/ (2017)
[73] Rothstein, B., Charron, N., Lapuente, V.: Quality of Government and Cor-ruption from a European Perspective: a Comparative Study on the Qual-ity of Government in EU Regions. Edward Elgar Publishing, (2013)
[74] Olken, B.A.: Corruption perceptions vs. corruption reality. Journal of Pub-lic economics 93(7-8), 950–964 (2009)
[75] Torsello, D., Venard, B.: The anthropology of corruption. Journal of Man-agement Inquiry 25(1), 34–54 (2016)
[76] Bertot, J.C., Jaeger, P.T., Grimes, J.M.: Using icts to create a culture oftransparency: E-government and social media as openness and anti-corruption tools for societies. Government information quarterly 27(3),264–271 (2010)
CE
UeT
DC
olle
ctio
n
Bibliography 97
[77] Kornberger, M., Meyer, R.E., Brandtner, C., Hollerer, M.A.: When bureau-cracy meets the crowd: Studying “open government” in the vienna cityadministration. Organization Studies 38(2), 179–200 (2017)
[78] Glaeser, E.L., Saks, R.E.: Corruption in America. Journal of Public Eco-nomics 90(6-7), 1053–1072 (2006)
[79] Golden, M.A., Picci, L.: Proposal for a new measure of corruption, illus-trated with italian data. Economics & Politics 17(1), 37–75 (2005)
[80] Beber, B., Scacco, A.: What the numbers say: A digit-based test for electionfraud. Political analysis 20(2), 211–234 (2012)
[81] Rauch, B., Gottsche, M., Brahler, G., Kronfeld, T.: Deficit versus socialstatistics: empirical evidence for the effectiveness of benford’s law. Ap-plied Economics Letters 21(3), 147–151 (2014)
[82] Integrity in Public Procurement: Good Practice from A to Z. Technicalreport, OECD (2007)
[83] European Commission: Public procurement - guidance for practitioners.Technical report (2018). Accessed: 2019-02-15
[84] Group, W.B.: The World Bank Group and Public Procurement : An Inde-pendent Evaluation. https://openknowledge.worldbank.org/handle/10986/21434. Accessed: 2019-01-15 (2014)
[85] Fazekas, M., Toth, I.J., King, L.P.: An objective corruption risk index us-ing public procurement data. European Journal on Criminal Policy andResearch 22(3), 369–397 (2016)
[86] Fazekas, M., Skuhrovec, J., Wachs, J.: Corruption, government turnover,and public contracting market structure–insights using network analy-sis and objective corruption proxies. Technical report, Government Trans-parency Institute Working Papers. (2017)
[87] European Court of Auditors: Fighting fraud in EU spending: actionneeded. Technical report (2019)
[88] Charron, N., Dahlstrom, C., Fazekas, M., Lapuente, V.: Careers, connec-tions, and corruption risks: Investigating the impact of bureaucratic mer-itocracy on public procurement processes. The Journal of Politics 79(1),89–104 (2017)
CE
UeT
DC
olle
ctio
n
98 BIBLIOGRAPHY
[89] Guerakar, E., Meyersson, E.: State discretion, political connections andpublic procurement: Evidence from turkey. Technical report, Working pa-per, Stockholm Institute for Transition Economics (2016)
[90] Gambetta, D.: The Sicilian Mafia: the Business of Private Protection. Har-vard University Press, (1996)
[91] Williams, P.: Transnational criminal networks. Networks and netwars:the future of terror, crime, and militancy 1382, 61 (2001)
[92] Agreste, S., Catanese, S., De Meo, P., Ferrara, E., Fiumara, G.: Networkstructure and resilience of mafia syndicates. Information Sciences 351, 30–47 (2016)
[93] DellaPosta, D.: Network closure and integration in the mid-20th centuryamerican mafia. Social Networks 51, 148–157 (2017)
[94] Neu, D., Everett, J., Rahaman, A.S., Martinez, D.: Accounting and net-works of corruption. Accounting, Organizations and Society 38(6-7), 505–524 (2013)
[95] Diesner, J., Frantz, T.L., Carley, K.M.: Communication networks fromthe enron email corpus “it’s always about the people. enron is no differ-ent”. Computational & Mathematical Organization Theory 11(3), 201–228(2005)
[96] Tumminello, M., Edling, C., Liljeros, F., Mantegna, R.N., Sarnecki, J.:The phenomenology of specialization of criminal suspects. PloS One 8(5),64703 (2013)
[97] Rostami, A., Mondani, H.: The complexity of crime network data: A casestudy of its consequences for crime control and the study of networks.PloS one 10(3), 0119309 (2015)
[98] Wachs, J., Yasseri, T., Lengyel, B., Kertesz, J.: Social capital predicts cor-ruption risk in towns. Royal Society Open Science (2019)
[99] Mauro, P.: The persistence of corruption and slow economic growth. IMFstaff papers 51(1), 1–18 (2004)
[100] Alesina, A., Zhuravskaya, E.: Segregation and the quality of governmentin a cross section of countries. American Economic Review 101(5), 1872–1911 (2011)
CE
UeT
DC
olle
ctio
n
Bibliography 99
[101] Rothstein, B., Uslaner, E.M.: All for all: Equality, corruption, and socialtrust. World Politics 58(1), 41–72 (2005)
[102] Guiso, L., Sapienza, P., Zingales, L.: Civic capital as the missing link. In:Handbook of Social Economics vol. 1, pp. 417–480. Elsevier, (2011)
[103] Putnam, R.D.: Bowling Alone: The Collapse and Revival of AmericanCommunity. Simon and Schuster, (2001)
[104] Portes, A.: Social capital: Its origins and applications in modern sociology.Annual Review of Sociology 24(1), 1–24 (1998)
[105] Westlund, H., Adam, F.: Social capital and economic performance: Ameta-analysis of 65 studies. European Planning Studie s 18(6), 893–919(2010)
[106] Lin, N.: Social Capital: A Theory of Social Structure and Action vol. 19.Cambridge University Press, (2002)
[107] Harris, D.: Bonding social capital and corruption: A cross-national em-pirical analysis. Technical report, University of Cambridge, Departmentof Land Economics (2007)
[108] Bjørnskov, C.: Corruption and social capital. Technical report, Universityof Aarhus, Aarhus School of Business, Department of Economics (2003)
[109] Eagle, N., Macy, M., Claxton, R.: Network diversity and economic devel-opment. Science 328(5981), 1029–1031 (2010)
[110] Bokanyi, E., Kondor, D., Dobos, L., Sebok, T., Steger, J., Csabai, I., Vattay,G.: Race, religion and the city: twitter word frequency patterns revealdominant demographic dimensions in the united states. Palgrave Com-munications 2, 16010 (2016)
[111] Mamei, M., Pancotto, F., De Nadai, M., Lepri, B., Vescovi, M., Zambonelli,F., Pentland, A.: Is social capital associated with synchronization in hu-man communication? an analysis of italian call records and measures ofcivic engagement. EPJ Data Science 7(1), 25 (2018)
[112] Norbutas, L., Corten, R.: Network structure and economic prosperity inmunicipalities: A large-scale test of social capital theory using social me-dia data. Social Networks 52, 120–134 (2018)
CE
UeT
DC
olle
ctio
n
100 BIBLIOGRAPHY
[113] Bailey, M., Cao, R., Kuchler, T., Stroebel, J., Wong, A., et al.: Social con-nectedness: Measurement, determinants, and effects. Journal of EconomicPerspectives 32(3), 259–80 (2018)
[114] Lengyel, B., Varga, A., Sagvari, B., Jakobi, A., Kertesz, J.: Geographies ofan online social network. PloS one 10(9), 0137248 (2015)
[115] Fazekas, M., Toth, B.: The extent and cost of corruption in transport in-frastructure. new evidence from europe. Transportation Research Part A:Policy and Practice 113, 35–54 (2018)
[116] European Commission: The OLAF Report 2017, p.15 (2018). Available at URL: https://ec.europa.eu/anti-fraud/sites/antifraud/files/olaf report 2017 en.pdf
[117] Fearon, J.D., Laitin, D.D.: Explaining interethnic cooperation. Americanpolitical science review 90(4), 715–735 (1996)
[118] Coleman, J.S.: Social capital in the creation of human capital. AmericanJournal of Sociology, 95–120 (1988)
[119] Portes, A.: The two meanings of social capital. Sociological Forum 15, 1–12 (2000)
[120] Erickson, B.H.: Secret societies and social structure. Social Forces 60(1),188–210 (1981)
[121] Geertz, C.: Peddlers and Princes: Social Development and EconomicChange in Two Indonesian Towns vol. 318. University of Chicago Press,(1963)
[122] Levine, S.S., Apfelbaum, E.P., Bernard, M., Bartelt, V.L., Zajac, E.J., Stark,D.: Ethnic diversity deflates price bubbles. Proceedings of the NationalAcademy of Sciences 111(52), 18524–18529 (2014)
[123] Granovetter, M.S.: The strength of weak ties. American Journal of Sociol-ogy 78(6), 1360–1380 (1973)
[124] Lancee, B.: The Economic Returns of Immigrants’ Bonding and BridgingSocial Capital: The Case of the Netherlands. International Migration Re-view 44(1), 202–226 (2010)
[125] Laurence, J.: The effect of ethnic diversity and community disadvantageon social cohesion: A multi-level analysis of social capital and interethnicrelations in UK communities. European Sociological Review 27(1), 70–89(2009)
CE
UeT
DC
olle
ctio
n
Bibliography 101
[126] Portes, A.: Downsides of social capital. Proceedings of the NationalAcademy of Sciences 111(52), 18407–18408 (2014)
[127] Yamagishi, T.: Trust: The Evolutionary Game of Mind and Society.Springer, (2011)
[128] Knack, S.: Social capital and the quality of government: Evidence fromthe states. American Journal of Political Science, 772–785 (2002)
[129] Paccagnella, M., Sestito, P.: School cheating and social capital. EducationEconomics 22(4), 367–388 (2014)
[130] PwC EU Services: Identifying and Reducing Corruption in Public Pro-curement in the EU. Technical report, European Commission (2013)
[131] Weber, M.: Economy and Society: An Outline of Interpretive Sociologyvol. 1. Univ of California Press, (1978)
[132] Attstrom, K., Krober, R., Junclaus, M.: Review of the Function of the CPVCodes/System. Technical report, European Commission (2012)
[133] Fazekas, M., Skuhrovec, J., Wachs, J.: Corruption, government turnover,and public contracting market structure–insights using network analysisand objective corruption proxies. GTI Working Paper Series (2) (2017)
[134] Fazekas, M., Ferrali, R., Wachs, J.: Institutional quality, campaign con-tributions, and favouritism in us federal government contracting. GTIWorking Paper Series (1) (2018)
[135] Norman, L., Komuves, A.: EU Fraud Office Finds Irregularities in ProjectsLinked to Hungarian Leader’s Son-in-Law. The Wall Street Journal (2018)
[136] Torok, J., Kertesz, J.: Cascading collapse of online social networks. Scien-tific Reports 7(1), 16743 (2017)
[137] Lorincz, L., Koltai, J., Gyor, A.F., Takacs, K., et al.: Collapse of an on-line social network: The blame on social capital. Technical report, Insti-tute of Economics, Centre for Economic and Regional Studies, HungarianAcademy of Sciences (2017)
[138] Torok, J., Murase, Y., Jo, H.-H., Kertesz, J., Kaski, K.: What big data tells:sampling the social network by communication channels. Physical Re-view E 94(5), 052319 (2016)
CE
UeT
DC
olle
ctio
n
102 BIBLIOGRAPHY
[139] Williams, D.: On and off the’net: Scales for social capital in an online era.Journal of Computer-Mediated Communication 11(2), 593–628 (2006)
[140] Brooks, B., Hogan, B., Ellison, N., Lampe, C., Vitak, J.: Assessing struc-tural correlates to social capital in facebook ego networks. Social Net-works 38, 1–15 (2014)
[141] Dunbar, R.I., Arnaboldi, V., Conti, M., Passarella, A.: The structure ofonline social networks mirrors those in the offline world. Social Networks43, 39–47 (2015)
[142] Blondel, V.D., Guillaume, J.-L., Lambiotte, R., Lefebvre, E.: Fast unfoldingof communities in large networks. Journal of statistical mechanics: theoryand experiment 2008(10), 10008 (2008)
[143] Newman, M.E.: Modularity and community structure in networks. Pro-ceedings of the National Academy of Sciences 103(23), 8577–8582 (2006)
[144] Santo, F., Marc, B.: Resolution limit in community detection. Proceedingsof the National Academy of Sciences 104, 36–41 (2007)
[145] Sah, P., Leu, S.T., Cross, P.C., Hudson, P.J., Bansal, S.: Unraveling the dis-ease consequences and mechanisms of modular structure in animal socialnetworks. Proceedings of the National Academy of Sciences, 201613616(2017)
[146] Pfeil, U., Arjan, R., Zaphiris, P.: Age differences in online socialnetworking–a study of user profiles and the social capital divide amongteenagers and older users in myspace. Computers in Human Behavior25(3), 643–654 (2009)
[147] Campante, Filipe R and Do, Quoc-Anh: Isolated capital cities, account-ability, and corruption: Evidence from US states. American Economic Re-view 104(8), 2456–81 (2014)
[148] Coviello, D., Guglielmo, A., Spagnolo, G.: The effect of discretion on pro-curement performance. Management Science 64(2), 715–738 (2017)
[149] Richey, S.: The impact of corruption on social trust. American PoliticsResearch 38(4), 676–690 (2010)
[150] Acemoglu, D., Jackson, M.O.: Social norms and the enforcement of laws.Journal of the European Economic Association 15(2), 245–295 (2017)
CE
UeT
DC
olle
ctio
n
Bibliography 103
[151] Hernandez, L., Vignes, A., Saba, S.: Trust or robustness? an ecologicalapproach to the study of auction and bilateral markets. PloS one 13(5),0196206 (2018)
[152] Jordano, P., Bascompte, J., Olesen, J.M.: Invariant properties in coevolu-tionary networks of plant–animal interactions. Ecology letters 6(1), 69–81(2003)
[153] Bustos, S., Gomez, C., Hausmann, R., Hidalgo, C.A.: The dynamics ofnestedness predicts the evolution of industrial ecosystems. PloS one 7(11),49393 (2012)
[154] Dorogovtsev, S.N., Goltsev, A.V., Mendes, J.F.F.: K-core organization ofcomplex networks. Physical review letters 96(4), 040601 (2006)
[155] Csermely, P., London, A., Wu, L.-Y., Uzzi, B.: Structure and dynamicsof core/periphery networks. Journal of Complex Networks 1(2), 93–123(2013)
[156] Mahutga, M.C.: The persistence of structural inequality? a networkanalysis of international trade, 1965–2000. Social Forces 84(4), 1863–1889(2006)
[157] Cattani, G., Ferriani, S.: A core/periphery perspective on individual cre-ative performance: Social networks and cinematic achievements in thehollywood film industry. Organization science 19(6), 824–844 (2008)
[158] Barbera, P., Wang, N., Bonneau, R., Jost, J.T., Nagler, J., Tucker, J.,Gonzalez-Bailon, S.: The critical periphery in the growth of socialprotests. PloS one 10(11), 0143611 (2015)
[159] Kossinets, G., Watts, D.J.: Origins of homophily in an evolving social net-work. American journal of sociology 115(2), 405–450 (2009)
[160] Szucs, F.: Discretion and Corruption in Public Procurement (2017)
[161] Christen, P.: Data Matching: Concepts and Techniques for Record Link-age, Entity Resolution, and Duplicate Detection. Springer, (2012)
[162] Sarawagi, S., Bhamidipaty, A.: Interactive deduplication using activelearning. In: Proceedings of the Eighth ACM SIGKDD International Con-ference on Knowledge Discovery and Data Mining, pp. 269–278 (2002).ACM
CE
UeT
DC
olle
ctio
n
104 BIBLIOGRAPHY
[163] Gregg, F., Eder, D.: Dedupe. https://github.com/datamade/dedupe(2015)
[164] Robins, G., Alexander, M.: Small worlds among interlocking directors:Network structure and distance in bipartite graphs. Computational &Mathematical Organization Theory 10(1), 69–94 (2004)
[165] Watts, D.J., Strogatz, S.H.: Collective dynamics of small-world networks.Nature 393(6684), 440 (1998)
[166] Clauset, A., Shalizi, C.R., Newman, M.E.: Power-law distributions in em-pirical data. SIAM review 51(4), 661–703 (2009)
[167] Alstott, J., Bullmore, E., Plenz, D.: powerlaw: a python package for anal-ysis of heavy-tailed distributions. PloS one 9(1), 85777 (2014)
[168] Fisman, R., Gatti, R.: Decentralization and corruption: evidence acrosscountries. Journal of Public Economics 83(3), 325–345 (2002)
[169] Gurgur, T., Shah, A.: Localization and Corruption: Panacea or Pandora’sBox? The World Bank, (2005)
[170] Persson, T., Tabellini, G.E.: Political Economics: Explaining Economic Pol-icy. MIT press, (2002)
[171] Pinto, J., Leana, C.R., Pil, F.K.: Corrupt organizations or organiza-tions of corrupt individuals? two types of organization-level corruption.Academy of Management Review 33(3), 685–709 (2008)
[172] Lauchs, M., Keast, R., Chamberlain, D.: Resilience of a corrupt police net-work: the first and second jokes in queensland. Crime, law and socialchange 57(2), 195–207 (2012)
[173] Batagelj, V., Zaversnik, M.: Generalized cores. arXiv preprint cs/0202039(2002)
[174] Wuchty, S., Almaas, E.: Peeling the yeast protein network. Proteomics5(2), 444–449 (2005)
[175] Garas, A., Schweitzer, F., Havlin, S.: A k-shell decomposition method forweighted networks. New Journal of Physics 14(8), 083030 (2012)
[176] Ugander, J., Backstrom, L., Marlow, C., Kleinberg, J.: Structural diver-sity in social contagion. Proceedings of the National Academy of Sciences,201116502 (2012)
CE
UeT
DC
olle
ctio
n
Bibliography 105
[177] Alvarez-Hamelin, J.I., Dall’Asta, L., Barrat, A., Vespignani, A.: Large scalenetworks fingerprinting and visualization using the k-core decomposi-tion. In: Advances in Neural Information Processing Systems, pp. 41–50(2006)
[178] Batagelj, V., Zaversnik, M.: An o (m) algorithm for cores decompositionof networks. arXiv preprint cs/0310049 (2003)
[179] Malliaros, F., Giatsidis, C., Papadopoulos, A., Vazirgiannis, M.: The coredecomposition of networks: Theory, algorithms and applications (2019)
[180] Fortunato, S.: Community detection in graphs. Physics reports 486(3-5),75–174 (2010)
[181] Evans, T., Lambiotte, R.: Line graphs, link partitions, and overlappingcommunities. Physical Review E 80(1), 016105 (2009)
[182] Evans, T.S., Lambiotte, R.: Line graphs of weighted networks for overlap-ping communities. The European Physical Journal B 77(2), 265–272 (2010)
[183] Ahn, Y.-Y., Bagrow, J.P., Lehmann, S.: Link communities reveal multiscalecomplexity in networks. nature 466(7307), 761 (2010)
[184] Mironov, M., Zhuravskaya, E.: Corruption in procurement and the polit-ical cycle in tunneling: Evidence from financial transactions data. Ameri-can Economic Journal: Economic Policy 8(2), 287–321 (2016)
[185] Doring, H., Manow, P.: Parliament and government compositiondatabase (parlgov). An infrastructure for empirical information on par-ties, elections and governments in modern democracies. Version 10(11), 6(2010)
[186] Lederman, D., Loayza, N.V., Soares, R.R.: Accountability and corruption:Political institutions matter. Economics & Politics 17(1), 1–35 (2005)
[187] Margetts, H., John, P., Hale, S., Yasseri, T.: Political Turbulence: HowSocial Media Shape Collective Action. Princeton University Press, (2015)
[188] Efron, B., Tibshirani, R.J.: An Introduction to the Bootstrap. CRC press,(1994)
[189] Innes, A.: Party competition in postcommunist europe: The great elec-toral lottery. Comparative politics, 85–104 (2002)
CE
UeT
DC
olle
ctio
n
106 BIBLIOGRAPHY
[190] Fierascu, S.I., Parvu, M., Topırceanu, A., Udrescu, M.: Exploring partyswitching in the post-1989 romanian politicians network from a complexnetwork perspective. Romanian Journal of Political Science 18(1), 108–136(2018)
[191] Grzymalała-Busse, A., Innes, A.: Great expectations: The eu and domesticpolitical competition in east central europe. East European Politics andSocieties 17(1), 64–73 (2003)
[192] Slomczynski, K., Shabad, G.: Perceptions of political party corruption andvoting behaviour in poland. Party Politics 18(6), 897–917 (2012)
[193] Luz, R.D., Spagnolo, G.: Leniency, collusion, corruption, and whistle-blowing. Journal of Competition Law & Economics 13(4), 729–766 (2017)
[194] Smith, A.: The Wealth of Nations. Bantam Classics, (2003)
[195] Marshall, R.C., Marx, L.M.: The Economics of Collusion: Cartels and Bid-ding Rings. Mit Press, (2012)
[196] Abrantes-Metz, R., Sokol, D.: Lessons from LIBOR for Detection and De-terrence of Cartel Wrongdoing. Antitrust Chronicle 11 (2012)
[197] Harrington, J.E., Skrzypacz, A.: Private monitoring and communicationin cartels: Explaining recent collusive practices. American Economic Re-view 101(6), 2425–49 (2011)
[198] Connor, J.M., Bolotova, Y.: Cartel overcharges: Survey and meta-analysis.International Journal of Industrial Organization 24(6), 1109–1137 (2006)
[199] Combe, E., Monnier, C., Legal, R.: Cartels: The probability of gettingcaught in the european union. Technical Report 102, Bruges EuropeanEconomic Research papers (2008)
[200] Levenstein, M.C., Suslow, V.Y.: What determines cartel success? Journalof economic literature 44(1), 43–95 (2006)
[201] Compte, O., Jenny, F., Rey, P.: Capacity constraints, mergers and collusion.European Economic Review 46(1), 1–29 (2002)
[202] Motta, M.: Competition Policy: Theory and Practice. Cambridge Univer-sity Press, (2004)
[203] Kofman, F., Lawarree, J.: A prisoner’s dilemma model of collusion deter-rence. Journal of Public Economics 59, 117–136 (1996)
CE
UeT
DC
olle
ctio
n
Bibliography 107
[204] Rapoport, A.: Prisoner’s dilemma—recollections and observations. In:Game Theory as a Theory of a Conflict Resolution, pp. 17–34. Springer,(1974)
[205] Axelrod, R., Hamilton, W.D.: The evolution of cooperation. Science211(4489), 1390–1396 (1981)
[206] Dixon, H.D., Wallis, S., Moss, S.: Axelrod meets cournot: Oligopolyand the evolutionary metaphor. Computational Economics 20(3), 139–156(2002)
[207] Bowles, S., Gintis, H.: A Cooperative Species: Human Reciprocity and ItsEvolution. Princeton University Press, (2011)
[208] Nowak, M.A., May, R.M.: The spatial dilemmas of evolution. Interna-tional Journal of bifurcation and chaos 3(01), 35–78 (1993)
[209] Santos, F.C., Santos, M.D., Pacheco, J.M.: Social diversity promotes theemergence of cooperation in public goods games. Nature 454(7201), 213(2008)
[210] Perc, M., Gomez-Gardenes, J., Szolnoki, A., Florıa, L.M., Moreno, Y.: Evo-lutionary dynamics of group interactions on structured populations: areview. Journal of the royal society interface 10(80), 20120997 (2013)
[211] Battiston, F., Perc, M., Latora, V.: Determinants of public cooperation inmultiplex networks. New Journal of Physics 19(7), 073017 (2017)
[212] Szamado, S., Szalai, F., Scheuring, I.: The effect of dispersal and neigh-bourhood in games of cooperation. Journal of Theoretical Biology 253(2),221–227 (2008)
[213] Pesendorfer, M.: A study of collusion in first-price auctions. The Reviewof Economic Studies 67(3), 381–411 (2000)
[214] Huschelrath, K., Veith, T.: Cartel detection in procurement markets. Man-agerial and Decision Economics 35(6), 404–422 (2014)
[215] Porter, R.H., Zona, J.D.: Detection of bid rigging in procurement auctions.Journal of political economy 101(3), 518–538 (1993)
[216] Toth, B., Fazekas, M., Czibik, A., Toth, I.J.: Toolkit for detecting collu-sive bidding in public procurement. Technical report, GTI Working PaperSeries,(2) (2014)
CE
UeT
DC
olle
ctio
n
108 BIBLIOGRAPHY
[217] Reeves-Latour, M., Morselli, C.: Bid-rigging networks and state-corporatecrime in the construction industry. Social Networks 51, 158–170 (2017)
[218] Morselli, C., Ouellet, M.: Network similarity and collusion. Social Net-works 55, 21–30 (2018)
[219] Imhof, D., Karagok, Y., Rutz, S.: Screening for bid rigging—does it work?Journal of Competition Law & Economics 14(2), 235–261 (2018)
[220] Porter, R.H., Zona, J.D.: Ohio school milk markets: An analysis of bid-ding. The Rand Journal of Economics, 263–288 (1999)
[221] Abrantes-Metz, R.M., Froeb, L.M., Geweke, J., Taylor, C.T.: A vari-ance screen for collusion. International Journal of Industrial Organization24(3), 467–486 (2006)
[222] Lancichinetti, A., Fortunato, S., Kertesz, J.: Detecting the overlapping andhierarchical community structure in complex networks. New Journal ofPhysics 11(3), 033015 (2009)
[223] Onnela, J.-P., Saramaki, J., Kertesz, J., Kaski, K.: Intensity and coherenceof motifs in weighted complex networks. Physical Review E 71(6), 065103(2005)
[224] LaCasse, C.: Bid rigging and the threat of government prosecution. TheRAND Journal of Economics, 398–417 (1995)
[225] Bolotova, Y., Connor, J.M., Miller, D.J.: The impact of collusion on pricebehavior: Empirical results from two recent cases. International Journalof Industrial Organization 26(6), 1290–1307 (2008)
[226] Imhof, D.: Simple statistical screens to detect bid rigging. Technical re-port, Universite de Fribourg (2017)
[227] Hilbe, C., Chatterjee, K., Nowak, M.A.: Partners and rivals in direct reci-procity. Nature Human Behaviour, 1 (2018)
[228] Harrington, J.E.: Behavioral screening and the detection of cartels. In:European Competition Law Annual 2006: Enforcement of Prohibition ofCartels, (2006)
[229] Bajari, P., Ye, L.: Deciding between competition and collusion. Review ofEconomics and statistics 85(4), 971–989 (2003)
CE
UeT
DC
olle
ctio
n
Bibliography 109
[230] Allain, M.-L., Boyer, M., Ponssard, J.P.: The determination of optimal finesin cartel cases: Theory and practice. Technical Report 34, Centre Interuni-versitatire de Recherche en Analyse des Organisations Discussion Paper(2011)
[231] Ishii, R.: Favor exchange in collusion: Empirical study of repeated pro-curement auctions in japan. International Journal of Industrial Organiza-tion 27(2), 137–144 (2009)
[232] Asker, J.: A study of the internal organization of a bidding cartel. Ameri-can Economic Review 100(3), 724–62 (2010)
[233] Conley, T.G., Decarolis, F.: Detecting bidders groups in collusive auctions.American Economic Journal: Microeconomics 8(2), 1–38 (2016)
[234] Athey, S., Levin, J., Seira, E.: Comparing open and sealed bid auc-tions: Evidence from timber auctions. The Quarterly Journal of Eco-nomics 126(1), 207–257 (2011)
[235] Hendricks, K., Porter, R.H.: Collusion in auctions. Annales d’Economie etde Statistique, 217–230 (1989)
[236] Hewitt, C., McClave, J., Sibley, D.: Incumbency and bidding behavior inthe dallas-ft. worth school milk market. Technical report, Mimeo. Austin,TX: University of Texas at Austin (1993)
[237] Cao, Q., Sirivianos, M., Yang, X., Pregueiro, T.: Aiding the detection offake accounts in large scale social online services. In: Proceedings of the9th USENIX Conference on Networked Systems Design and Implemen-tation, pp. 15–15 (2012). USENIX Association
[238] Sung, H.-E.: Democracy and political corruption: A cross-national com-parison. Crime, Law and Social Change 41(2), 179–193 (2004)
[239] Hair, J.F., Anderson, R.E., Tatham, R.L., Black, W.C., et al.: MultivariateAnalysis, (1999)
CE
UeT
DC
olle
ctio
n

110 BIBLIOGRAPHY
CE
UeT
DC
olle
ctio
n
CHAPTER 7
APPENDICES
7.1 Social Networks and Corruption
7.1.1 Description of iWiW data
In line with previous work on iWiW we filtered the data used in our analysis.We use the data from the network at its peak activity in 2012. Out of roughly4.5 million user accounts, we dropped the roughly 500,000 accounts with loca-tion outside of Hungary. We follow Lengyel et al. [114], we dropped the 193users with more than 10,000 connections, arguing that such a large number ofconnections cannot represent social ties. We argue that this cutoff balances twoconcerns: it excludes those accounts with so many connections that it bringsinto question the nature of its connections, and we avoid truncating the tail ofthe distribution of social connectivity too much, allowing for sociality to rangeover several orders of magnitude. Many approaches to detect “fake” accountsin social network use the degree of a node as an important input [237].
In Plot A of Figure 7.1 we plot the sensitivity of fragmentation and diversityto the maximum degree threshold. If we discard all users with more than 100connections (compared to the 10,000 connection cutoff we use in our paper),fragmentation would be significantly higher and diversity significantly lowerthan the versions we use in the paper. However this is not a reasonable cutoff asnearly 10% of users have more than 500 connections (see Plot B, Figure 7.1). Thesettlement fragmentation and diversity measures are within 5% of the versionswe use in the paper if the threshold is set at 500, 1000, or 2000 connections.
In Figure 7.2 we show the relationship between settlement population andthe number of iWiW users listing their location in the settlement, and the shareof the population registered to iWiW. As mentioned in the text, user privacy is a
111
CE
UeT
DC
olle
ctio
n
112 CHAPTER 7. APPENDICES
key concern. The anonymized iWiW data was made available to a consortiumof researchers in Hungary, each of whom signed a non-disclosure agreement(NDA) to use the data for research purposes only. As a result, only settlementlevel aggregated data can be shared.
7.1.2 Relationship between fragmentation and diversity
Fragmentation and diversity, our measures of bonding and bridging social cap-ital respectively, are positively and significantly correlated (r ⇡ 0.46). Thoughfragmentation considers only edges within the settlement and ego diversity in-cludes external edges, both variables measure modularity in the network. How-ever, according to our hypotheses, they are expected to capture different kindsof socialization. We found that despite their positive correlation these featureshave opposite relationships with our corruption risk measures: high fragmen-tation is positively and high diversity is negatively correlated with corruptionrisk. To test whether inter-settlement edges or the ego focus of diversity doesmore to distinguish the measure from fragmentation we recalculated the di-versity considering only edges within the settlement. This alternative “inter-nal” diversity measure is weakly correlated (r ⇡ 0.28) with fragmentation, andstrongly correlated with diversity (r ⇡ 0.72). This suggests that both the con-nections to other settlements and the ego-focus of the diversity measure distin-guish fragmented settlements from diverse ones.
7.1.3 Model covariates and controls
In this appendix section we present the settlement-level variables used as con-trols in our models. We also report their summary statistics. Note that in ourmodels, we scale all features to have mean 0 and standard deviation 1. Our con-trols mostly refer to data from 2011, when the last large scale Hungarian censustook place and the data are of highest quality.
• Average income per capita (2011): Wealthier places tend to be less cor-rupt [10] as competition for limited resources is expected to create greaterincentive to cheat. Data on median income or the income distribution atthe settlement level were, to the best our knowledge, not available in Hun-gary.
• Population (log)(2011): Larger cities may have different contracting needs,different political and social norms, and different network characteristics.
• Number of contracts awarded (log): Settlements contracting more frequently
CE
UeT
DC
olle
ctio
n
7.1. Social Networks and Corruption 113
may be more experienced and may follow better practices. As more peo-ple are involved in contracting, corruption may become more difficult.
• Rate of iWiW use (2012): The rate of iWiW use both proxies for the economicdevelopment of the settlement and controls for differences in observedsocial network structure resulting from differences in access to the web.Previous work suggests that iWiW users, especially the early adopters,skew young and wealthy [114].
• Average mayoral victory margin: Measured across three elections (2002,2006, 2010), this variable proxies for the lack of political competition inthe settlement. The absence of political competition has been shown tocorrelate with corruption [43].
• Share of population with at least a high school diploma (2011): Education istypically correlated with better control of corruption [101].
• Share of working-age population inactive and unemployment rate (2011):Counting the long-term and short-term unemployed respectively, thesevariables quantify economic stagnation. The economic hardship con-nected with high unemployment is conjectured to worsen political cor-ruption [238].
• The minimum travel distance to Budapest, the capital city: This variable cap-tures the physical isolation of the settlement from the main economic, po-litical, and social hub of the country. Past research has shown that geo-graphic isolation reduces accountability and increases corruption [147].
• Share of population over 60 years old (2011): This variable controls for theover-representation of the elderly. The elderly are underrepresented ononline social networks and tend to use these platforms differently thanyounger users [146].
• Whether the settlement has a university (2011): This variable controls for thepresence of a place of higher education in the settlement, including localbranches of universities headquartered elsewhere. this which inflates thenumber of young people, hence likely iWiW users in the settlement.
7.1.4 Model results, diagnostics, and feature importances
We also present models including only one of the two network measures inTable 7.2. The effect and significance of both features is preserved when the
CE
UeT
DC
olle
ctio
n
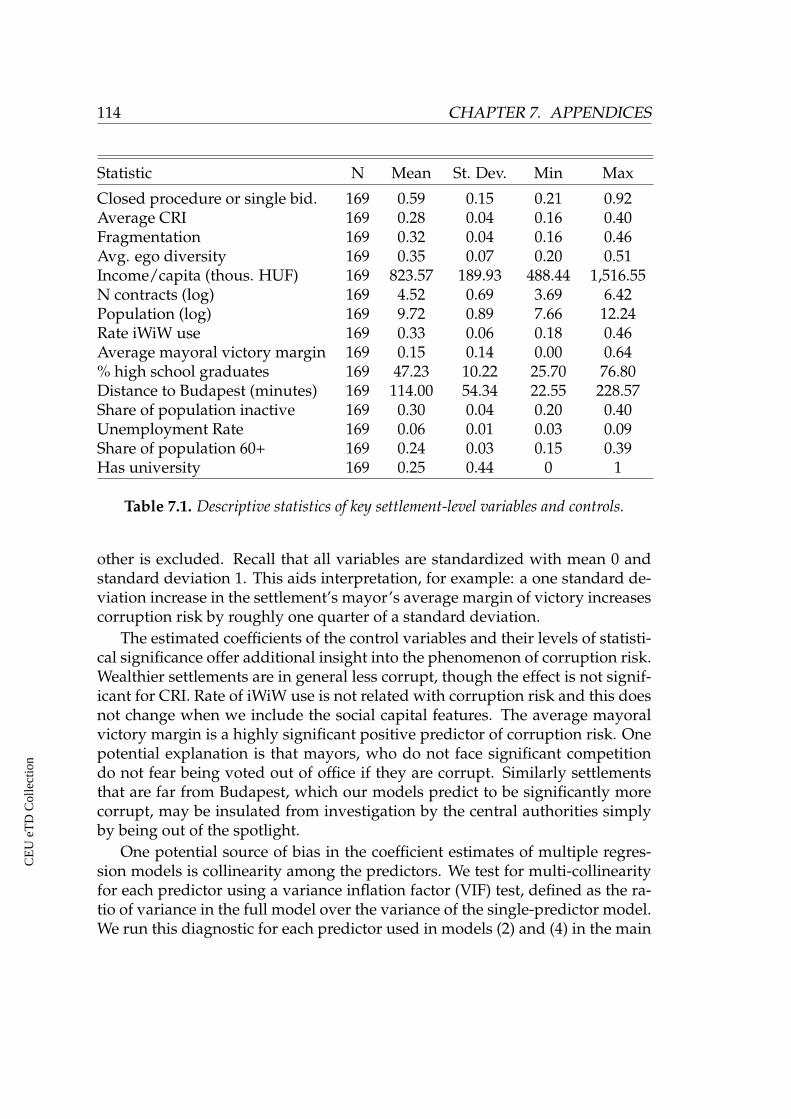
114 CHAPTER 7. APPENDICES
Statistic N Mean St. Dev. Min MaxClosed procedure or single bid. 169 0.59 0.15 0.21 0.92Average CRI 169 0.28 0.04 0.16 0.40Fragmentation 169 0.32 0.04 0.16 0.46Avg. ego diversity 169 0.35 0.07 0.20 0.51Income/capita (thous. HUF) 169 823.57 189.93 488.44 1,516.55N contracts (log) 169 4.52 0.69 3.69 6.42Population (log) 169 9.72 0.89 7.66 12.24Rate iWiW use 169 0.33 0.06 0.18 0.46Average mayoral victory margin 169 0.15 0.14 0.00 0.64% high school graduates 169 47.23 10.22 25.70 76.80Distance to Budapest (minutes) 169 114.00 54.34 22.55 228.57Share of population inactive 169 0.30 0.04 0.20 0.40Unemployment Rate 169 0.06 0.01 0.03 0.09Share of population 60+ 169 0.24 0.03 0.15 0.39Has university 169 0.25 0.44 0 1
Table 7.1. Descriptive statistics of key settlement-level variables and controls.
other is excluded. Recall that all variables are standardized with mean 0 andstandard deviation 1. This aids interpretation, for example: a one standard de-viation increase in the settlement’s mayor’s average margin of victory increasescorruption risk by roughly one quarter of a standard deviation.
The estimated coefficients of the control variables and their levels of statisti-cal significance offer additional insight into the phenomenon of corruption risk.Wealthier settlements are in general less corrupt, though the effect is not signif-icant for CRI. Rate of iWiW use is not related with corruption risk and this doesnot change when we include the social capital features. The average mayoralvictory margin is a highly significant positive predictor of corruption risk. Onepotential explanation is that mayors, who do not face significant competitiondo not fear being voted out of office if they are corrupt. Similarly settlementsthat are far from Budapest, which our models predict to be significantly morecorrupt, may be insulated from investigation by the central authorities simplyby being out of the spotlight.
One potential source of bias in the coefficient estimates of multiple regres-sion models is collinearity among the predictors. We test for multi-collinearityfor each predictor using a variance inflation factor (VIF) test, defined as the ra-tio of variance in the full model over the variance of the single-predictor model.We run this diagnostic for each predictor used in models (2) and (4) in the main
CE
UeT
DC
olle
ctio
n
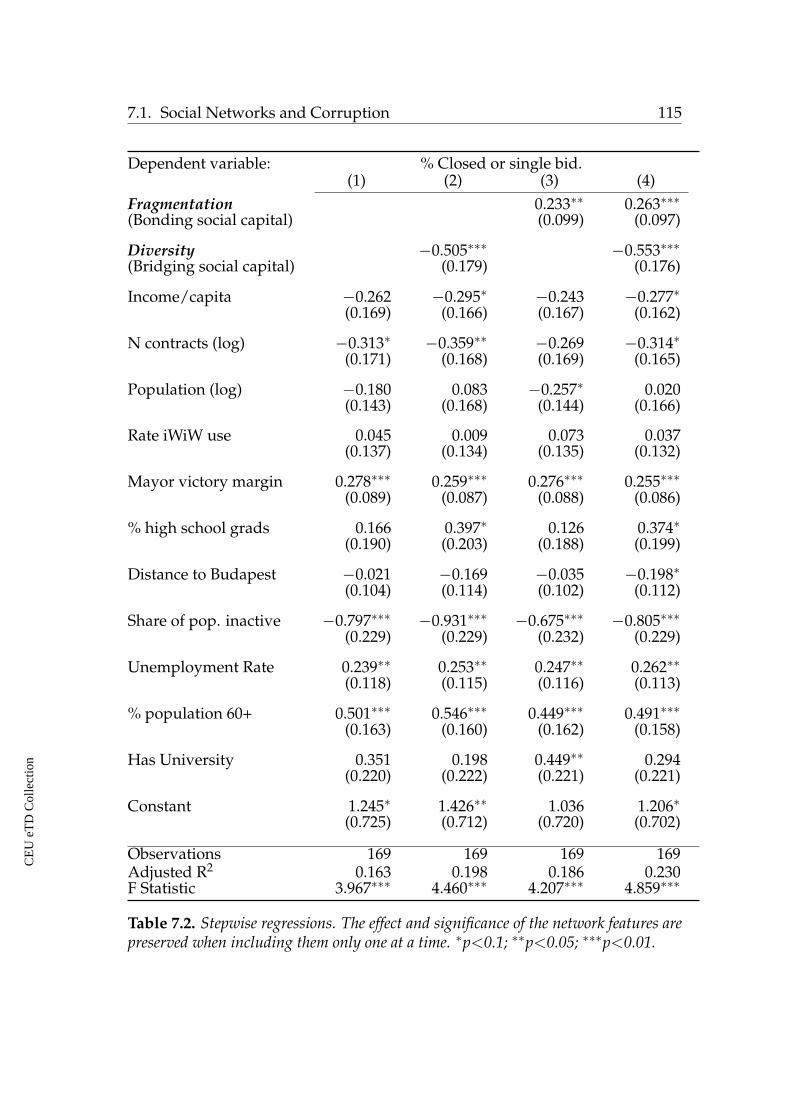
7.1. Social Networks and Corruption 115
Dependent variable: % Closed or single bid.(1) (2) (3) (4)
Fragmentation 0.233⇤⇤ 0.263⇤⇤⇤(Bonding social capital) (0.099) (0.097)
Diversity �0.505⇤⇤⇤ �0.553⇤⇤⇤(Bridging social capital) (0.179) (0.176)
Income/capita �0.262 �0.295⇤ �0.243 �0.277⇤(0.169) (0.166) (0.167) (0.162)
N contracts (log) �0.313⇤ �0.359⇤⇤ �0.269 �0.314⇤(0.171) (0.168) (0.169) (0.165)
Population (log) �0.180 0.083 �0.257⇤ 0.020(0.143) (0.168) (0.144) (0.166)
Rate iWiW use 0.045 0.009 0.073 0.037(0.137) (0.134) (0.135) (0.132)
Mayor victory margin 0.278⇤⇤⇤ 0.259⇤⇤⇤ 0.276⇤⇤⇤ 0.255⇤⇤⇤(0.089) (0.087) (0.088) (0.086)
% high school grads 0.166 0.397⇤ 0.126 0.374⇤(0.190) (0.203) (0.188) (0.199)
Distance to Budapest �0.021 �0.169 �0.035 �0.198⇤(0.104) (0.114) (0.102) (0.112)
Share of pop. inactive �0.797⇤⇤⇤ �0.931⇤⇤⇤ �0.675⇤⇤⇤ �0.805⇤⇤⇤(0.229) (0.229) (0.232) (0.229)
Unemployment Rate 0.239⇤⇤ 0.253⇤⇤ 0.247⇤⇤ 0.262⇤⇤(0.118) (0.115) (0.116) (0.113)
% population 60+ 0.501⇤⇤⇤ 0.546⇤⇤⇤ 0.449⇤⇤⇤ 0.491⇤⇤⇤(0.163) (0.160) (0.162) (0.158)
Has University 0.351 0.198 0.449⇤⇤ 0.294(0.220) (0.222) (0.221) (0.221)
Constant 1.245⇤ 1.426⇤⇤ 1.036 1.206⇤(0.725) (0.712) (0.720) (0.702)
Observations 169 169 169 169Adjusted R2 0.163 0.198 0.186 0.230F Statistic 3.967⇤⇤⇤ 4.460⇤⇤⇤ 4.207⇤⇤⇤ 4.859⇤⇤⇤
Table 7.2. Stepwise regressions. The effect and significance of the network features arepreserved when including them only one at a time. ⇤p<0.1; ⇤⇤p<0.05; ⇤⇤⇤p<0.01.
CE
UeT
DC
olle
ctio
n
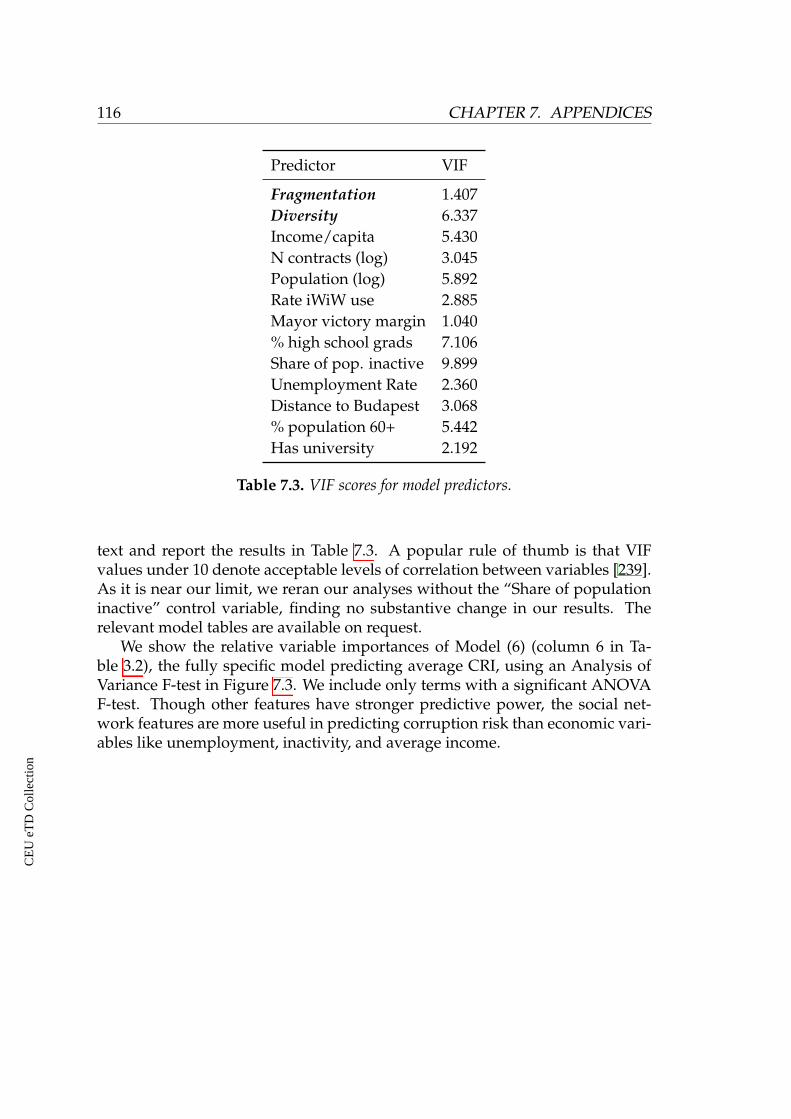
116 CHAPTER 7. APPENDICES
Predictor VIF
Fragmentation 1.407Diversity 6.337Income/capita 5.430N contracts (log) 3.045Population (log) 5.892Rate iWiW use 2.885Mayor victory margin 1.040% high school grads 7.106Share of pop. inactive 9.899Unemployment Rate 2.360Distance to Budapest 3.068% population 60+ 5.442Has university 2.192
Table 7.3. VIF scores for model predictors.
text and report the results in Table 7.3. A popular rule of thumb is that VIFvalues under 10 denote acceptable levels of correlation between variables [239].As it is near our limit, we reran our analyses without the “Share of populationinactive” control variable, finding no substantive change in our results. Therelevant model tables are available on request.
We show the relative variable importances of Model (6) (column 6 in Ta-ble 3.2), the fully specific model predicting average CRI, using an Analysis ofVariance F-test in Figure 7.3. We include only terms with a significant ANOVAF-test. Though other features have stronger predictive power, the social net-work features are more useful in predicting corruption risk than economic vari-ables like unemployment, inactivity, and average income.
CE
UeT
DC
olle
ctio
n
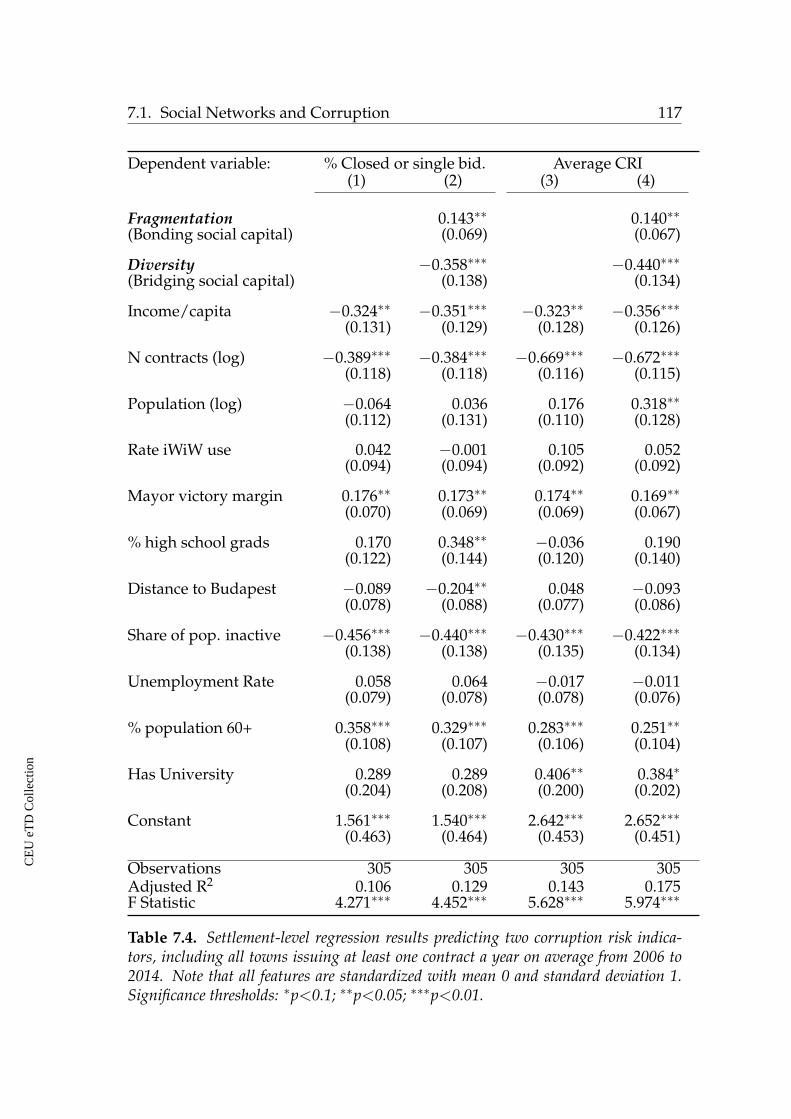
7.1. Social Networks and Corruption 117
Dependent variable: % Closed or single bid. Average CRI(1) (2) (3) (4)
Fragmentation 0.143⇤⇤ 0.140⇤⇤(Bonding social capital) (0.069) (0.067)
Diversity �0.358⇤⇤⇤ �0.440⇤⇤⇤(Bridging social capital) (0.138) (0.134)
Income/capita �0.324⇤⇤ �0.351⇤⇤⇤ �0.323⇤⇤ �0.356⇤⇤⇤(0.131) (0.129) (0.128) (0.126)
N contracts (log) �0.389⇤⇤⇤ �0.384⇤⇤⇤ �0.669⇤⇤⇤ �0.672⇤⇤⇤(0.118) (0.118) (0.116) (0.115)
Population (log) �0.064 0.036 0.176 0.318⇤⇤(0.112) (0.131) (0.110) (0.128)
Rate iWiW use 0.042 �0.001 0.105 0.052(0.094) (0.094) (0.092) (0.092)
Mayor victory margin 0.176⇤⇤ 0.173⇤⇤ 0.174⇤⇤ 0.169⇤⇤(0.070) (0.069) (0.069) (0.067)
% high school grads 0.170 0.348⇤⇤ �0.036 0.190(0.122) (0.144) (0.120) (0.140)
Distance to Budapest �0.089 �0.204⇤⇤ 0.048 �0.093(0.078) (0.088) (0.077) (0.086)
Share of pop. inactive �0.456⇤⇤⇤ �0.440⇤⇤⇤ �0.430⇤⇤⇤ �0.422⇤⇤⇤(0.138) (0.138) (0.135) (0.134)
Unemployment Rate 0.058 0.064 �0.017 �0.011(0.079) (0.078) (0.078) (0.076)
% population 60+ 0.358⇤⇤⇤ 0.329⇤⇤⇤ 0.283⇤⇤⇤ 0.251⇤⇤(0.108) (0.107) (0.106) (0.104)
Has University 0.289 0.289 0.406⇤⇤ 0.384⇤(0.204) (0.208) (0.200) (0.202)
Constant 1.561⇤⇤⇤ 1.540⇤⇤⇤ 2.642⇤⇤⇤ 2.652⇤⇤⇤(0.463) (0.464) (0.453) (0.451)
Observations 305 305 305 305Adjusted R2 0.106 0.129 0.143 0.175F Statistic 4.271⇤⇤⇤ 4.452⇤⇤⇤ 5.628⇤⇤⇤ 5.974⇤⇤⇤
Table 7.4. Settlement-level regression results predicting two corruption risk indica-tors, including all towns issuing at least one contract a year on average from 2006 to2014. Note that all features are standardized with mean 0 and standard deviation 1.Significance thresholds: ⇤p<0.1; ⇤⇤p<0.05; ⇤⇤⇤p<0.01.
CE
UeT
DC
olle
ctio
n
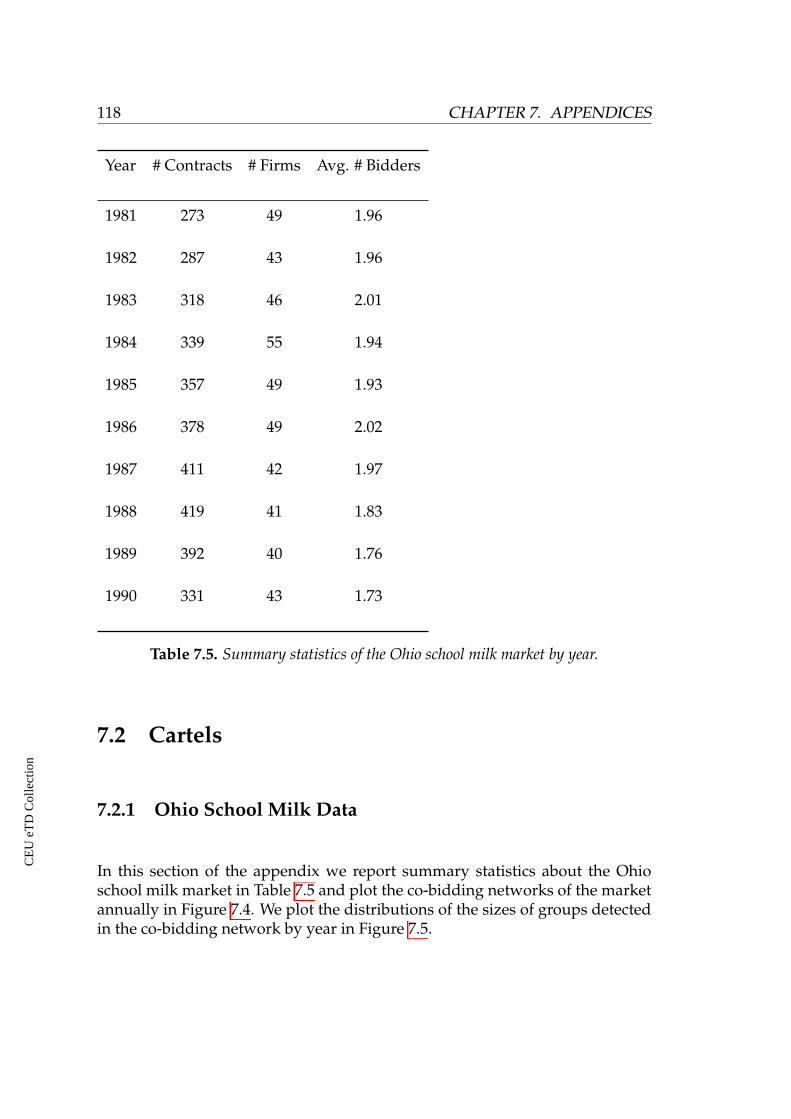
118 CHAPTER 7. APPENDICES
Year # Contracts # Firms Avg. # Bidders
1981 273 49 1.96
1982 287 43 1.96
1983 318 46 2.01
1984 339 55 1.94
1985 357 49 1.93
1986 378 49 2.02
1987 411 42 1.97
1988 419 41 1.83
1989 392 40 1.76
1990 331 43 1.73
Table 7.5. Summary statistics of the Ohio school milk market by year.
7.2 Cartels
7.2.1 Ohio School Milk Data
In this section of the appendix we report summary statistics about the Ohioschool milk market in Table 7.5 and plot the co-bidding networks of the marketannually in Figure 7.4. We plot the distributions of the sizes of groups detectedin the co-bidding network by year in Figure 7.5.
CE
UeT
DC
olle
ctio
n
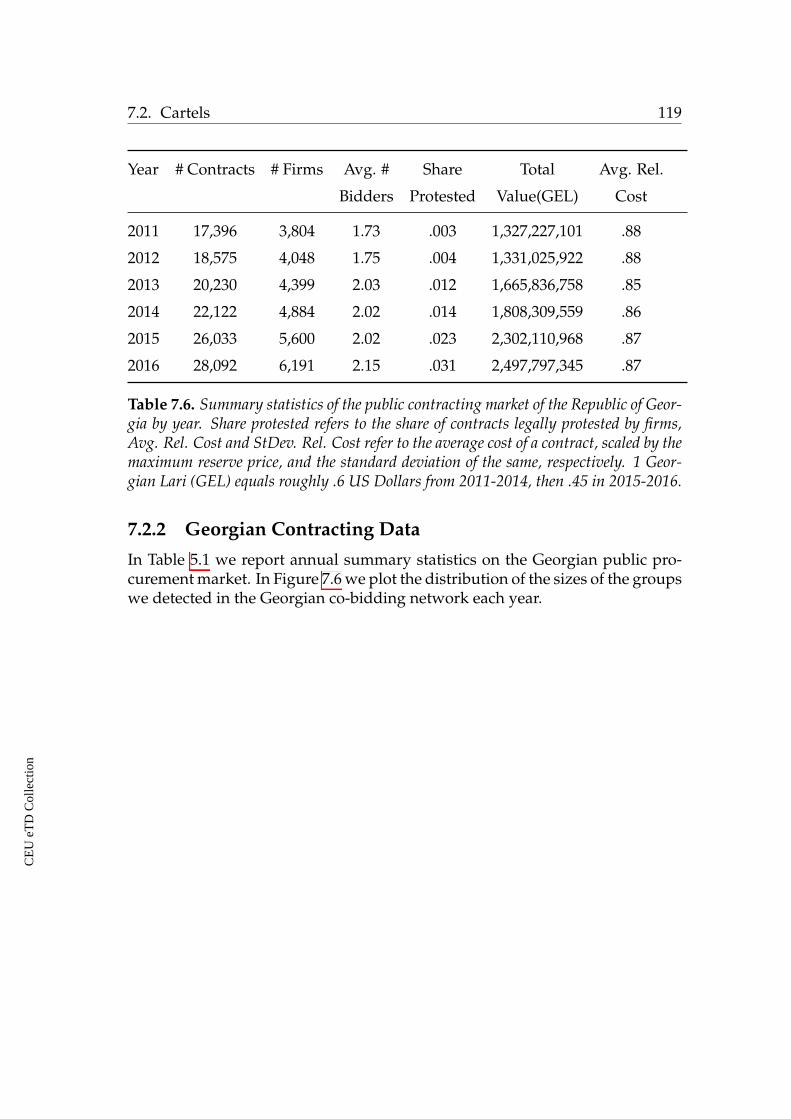
7.2. Cartels 119
Year # Contracts # Firms Avg. # Share Total Avg. Rel.
Bidders Protested Value(GEL) Cost
2011 17,396 3,804 1.73 .003 1,327,227,101 .88
2012 18,575 4,048 1.75 .004 1,331,025,922 .88
2013 20,230 4,399 2.03 .012 1,665,836,758 .85
2014 22,122 4,884 2.02 .014 1,808,309,559 .86
2015 26,033 5,600 2.02 .023 2,302,110,968 .87
2016 28,092 6,191 2.15 .031 2,497,797,345 .87
Table 7.6. Summary statistics of the public contracting market of the Republic of Geor-gia by year. Share protested refers to the share of contracts legally protested by firms,Avg. Rel. Cost and StDev. Rel. Cost refer to the average cost of a contract, scaled by themaximum reserve price, and the standard deviation of the same, respectively. 1 Geor-gian Lari (GEL) equals roughly .6 US Dollars from 2011-2014, then .45 in 2015-2016.
7.2.2 Georgian Contracting Data
In Table 5.1 we report annual summary statistics on the Georgian public pro-curement market. In Figure 7.6 we plot the distribution of the sizes of the groupswe detected in the Georgian co-bidding network each year.
CE
UeT
DC
olle
ctio
n
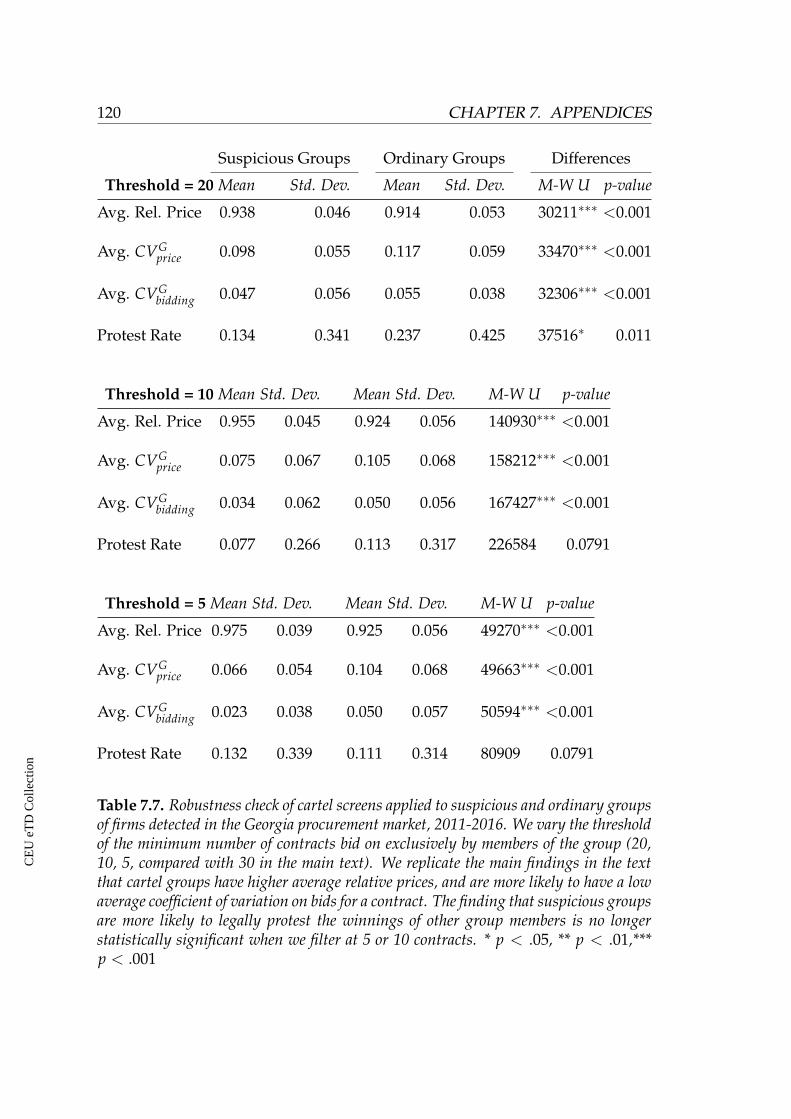
120 CHAPTER 7. APPENDICES
Suspicious Groups Ordinary Groups Differences
Threshold = 20 Mean Std. Dev. Mean Std. Dev. M-W U p-value
Avg. Rel. Price 0.938 0.046 0.914 0.053 30211⇤⇤⇤ <0.001
Avg. CVGprice 0.098 0.055 0.117 0.059 33470⇤⇤⇤ <0.001
Avg. CVGbidding 0.047 0.056 0.055 0.038 32306⇤⇤⇤ <0.001
Protest Rate 0.134 0.341 0.237 0.425 37516⇤ 0.011
Threshold = 10 Mean Std. Dev. Mean Std. Dev. M-W U p-value
Avg. Rel. Price 0.955 0.045 0.924 0.056 140930⇤⇤⇤ <0.001
Avg. CVGprice 0.075 0.067 0.105 0.068 158212⇤⇤⇤ <0.001
Avg. CVGbidding 0.034 0.062 0.050 0.056 167427⇤⇤⇤ <0.001
Protest Rate 0.077 0.266 0.113 0.317 226584 0.0791
Threshold = 5 Mean Std. Dev. Mean Std. Dev. M-W U p-value
Avg. Rel. Price 0.975 0.039 0.925 0.056 49270⇤⇤⇤ <0.001
Avg. CVGprice 0.066 0.054 0.104 0.068 49663⇤⇤⇤ <0.001
Avg. CVGbidding 0.023 0.038 0.050 0.057 50594⇤⇤⇤ <0.001
Protest Rate 0.132 0.339 0.111 0.314 80909 0.0791
Table 7.7. Robustness check of cartel screens applied to suspicious and ordinary groupsof firms detected in the Georgia procurement market, 2011-2016. We vary the thresholdof the minimum number of contracts bid on exclusively by members of the group (20,10, 5, compared with 30 in the main text). We replicate the main findings in the textthat cartel groups have higher average relative prices, and are more likely to have a lowaverage coefficient of variation on bids for a contract. The finding that suspicious groupsare more likely to legally protest the winnings of other group members is no longerstatistically significant when we filter at 5 or 10 contracts. * p < .05, ** p < .01,***p < .001
CE
UeT
DC
olle
ctio
n
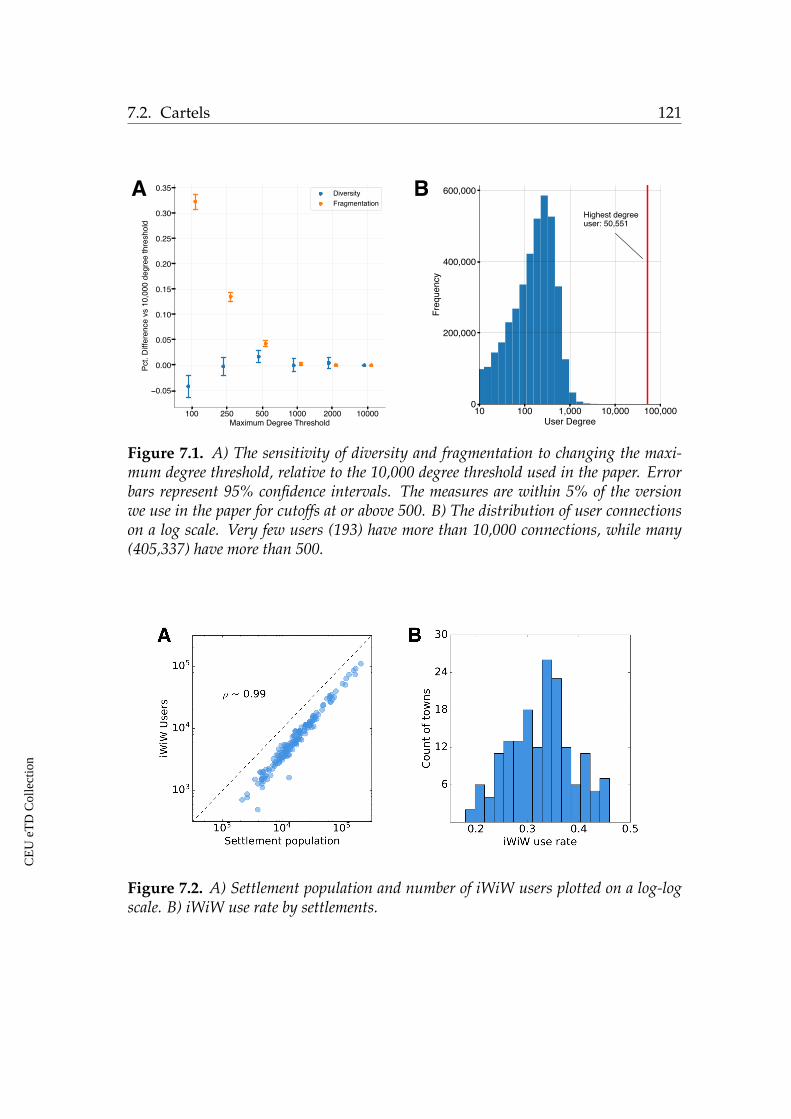
7.2. Cartels 121
A B
Figure 7.1. A) The sensitivity of diversity and fragmentation to changing the maxi-mum degree threshold, relative to the 10,000 degree threshold used in the paper. Errorbars represent 95% confidence intervals. The measures are within 5% of the versionwe use in the paper for cutoffs at or above 500. B) The distribution of user connectionson a log scale. Very few users (193) have more than 10,000 connections, while many(405,337) have more than 500.
Figure 7.2. A) Settlement population and number of iWiW users plotted on a log-logscale. B) iWiW use rate by settlements.
CE
UeT
DC
olle
ctio
n
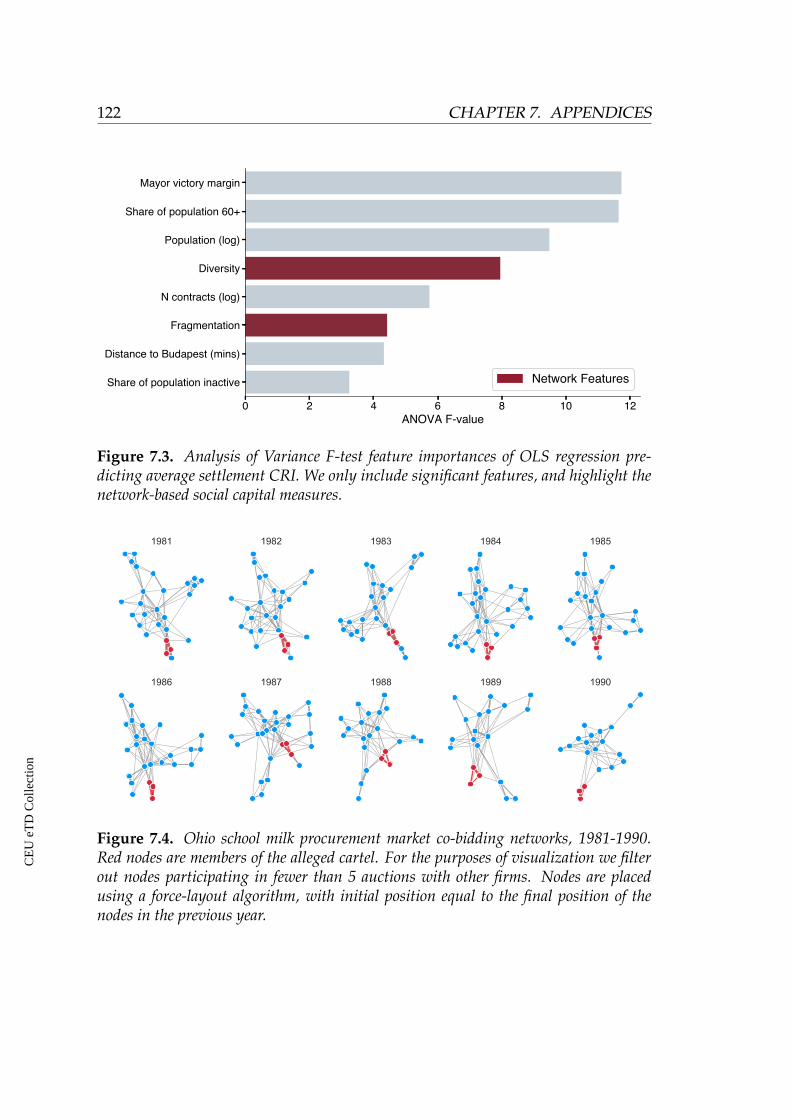
122 CHAPTER 7. APPENDICES
Figure 7.3. Analysis of Variance F-test feature importances of OLS regression pre-dicting average settlement CRI. We only include significant features, and highlight thenetwork-based social capital measures.
Figure 7.4. Ohio school milk procurement market co-bidding networks, 1981-1990.Red nodes are members of the alleged cartel. For the purposes of visualization we filterout nodes participating in fewer than 5 auctions with other firms. Nodes are placedusing a force-layout algorithm, with initial position equal to the final position of thenodes in the previous year.
CE
UeT
DC
olle
ctio
n
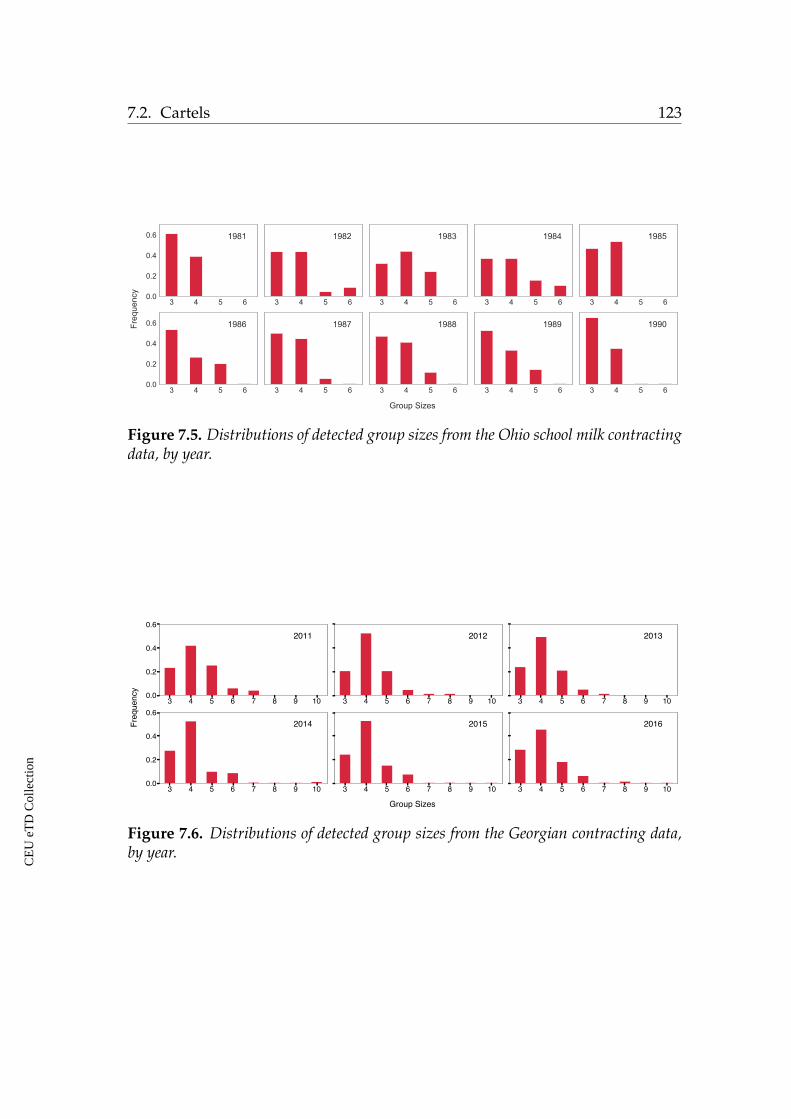
7.2. Cartels 123
Figure 7.5. Distributions of detected group sizes from the Ohio school milk contractingdata, by year.
Figure 7.6. Distributions of detected group sizes from the Georgian contracting data,by year.
CE
UeT
DC
olle
ctio
n

CE
UeT
DC
olle
ctio
n


![[Kerference] 시작! 리버싱 - 김종범(KERT)](https://img.pdfslide.net/doc/110x75/58700c321a28ab427f8b74a5/kerference-kert.jpg)


![Caperucita roja4 esz[1]](https://img.pdfslide.net/doc/110x75/58ab2ef31a28abb64d8b4c01/caperucita-roja4-esz1.jpg)