Embed Size (px)
Citation preview
Network Entropy and the Cancer Cell
Local and global cancer hallmarks and applications
Contents
1. Cancer research in the 21st century
2. Entropy in gene expression
3. Entropy in copy number
4. Conclusions
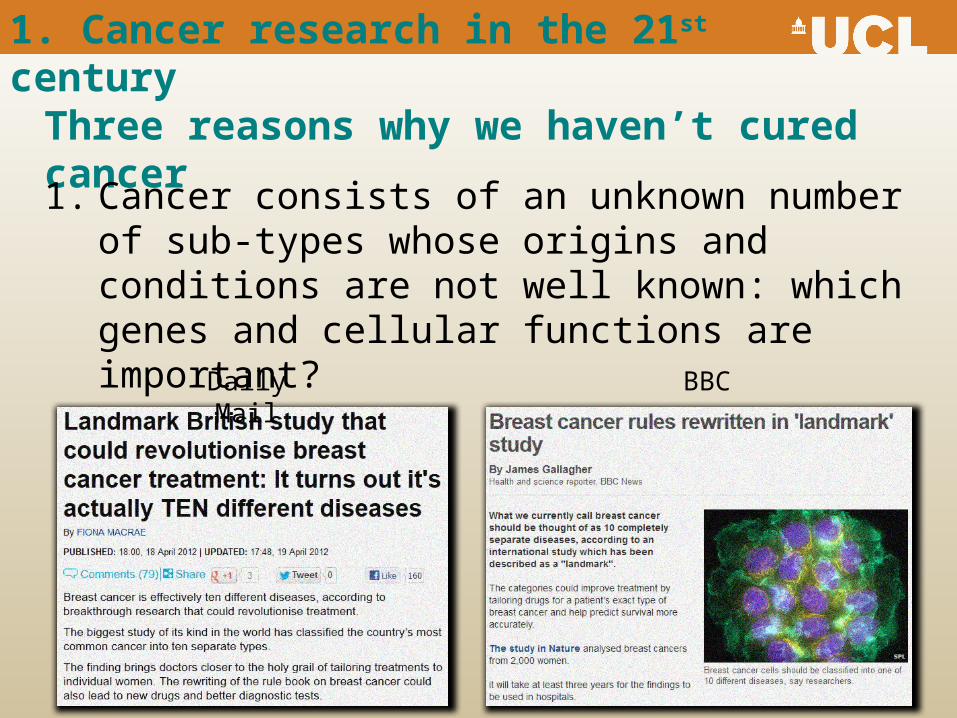
Three reasons why we haven’t cured cancer
1. Cancer consists of an unknown number of sub-types whose origins and conditions are not well known: which genes and cellular functions are important?
1. Cancer research in the 21st century
Daily Mail BBC
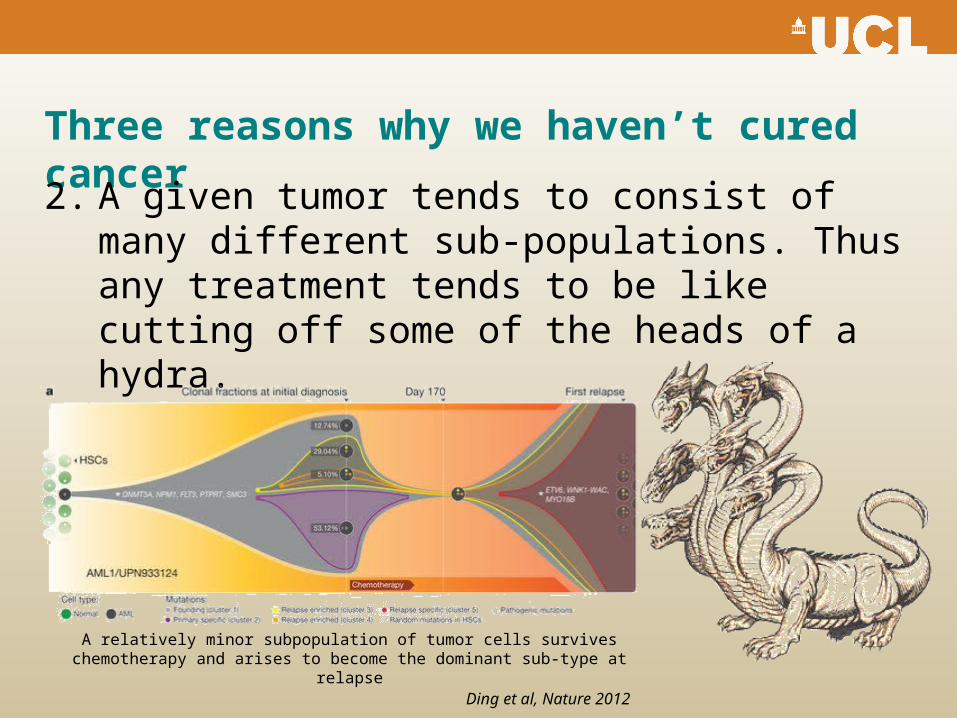
Three reasons why we haven’t cured cancer
2. A given tumor tends to consist of many different sub-populations. Thus any treatment tends to be like cutting off some of the heads of a hydra.
Ding et al, Nature 2012
A relatively minor subpopulation of tumor cells survives chemotherapy and arises to become the dominant sub-type at relapse
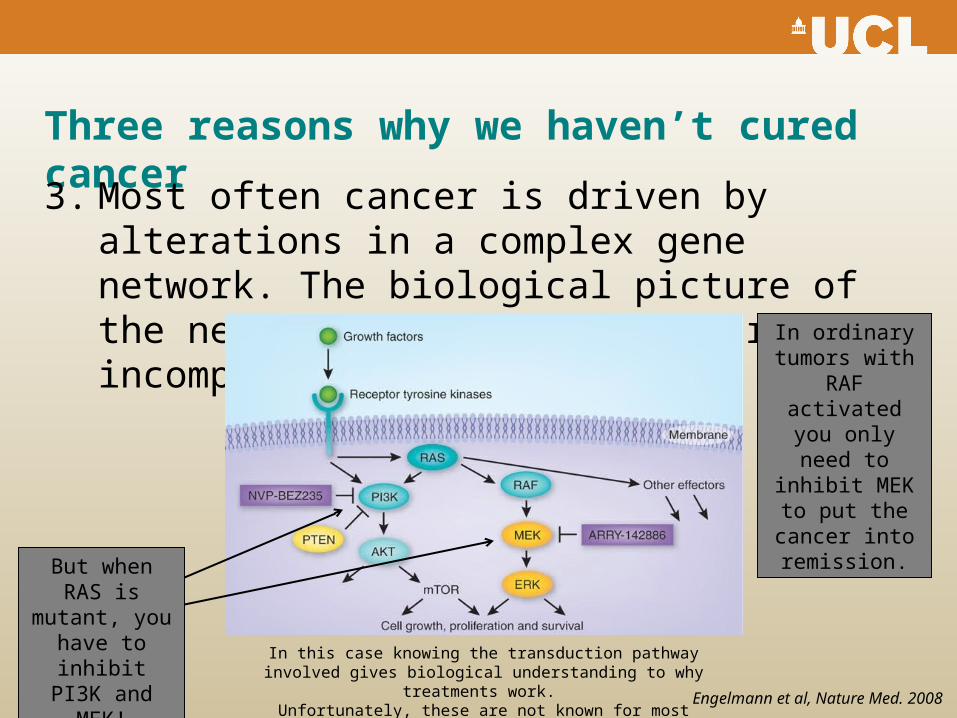
Three reasons why we haven’t cured cancer
3. Most often cancer is driven by alterations in a complex gene network. The biological picture of the network state is still largely incomplete.
In this case knowing the transduction pathway involved gives biological understanding to why treatments work.
Unfortunately, these are not known for most pathways! Engelmann et al, Nature Med. 2008
In ordinary tumors with
RAF activated you only need to inhibit MEK
to put the cancer into remission.
But when RAS is mutant, you have to inhibit
PI3K and MEK!
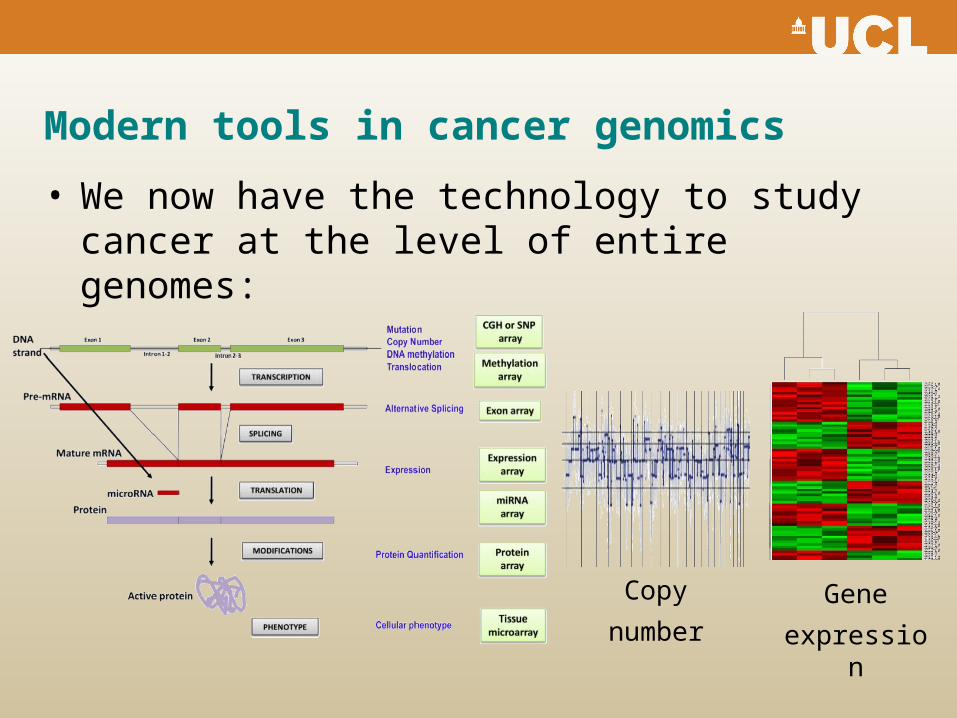
Modern tools in cancer genomics
• We now have the technology to study cancer at the level of entire genomes:
Gene
expression
Copy
number
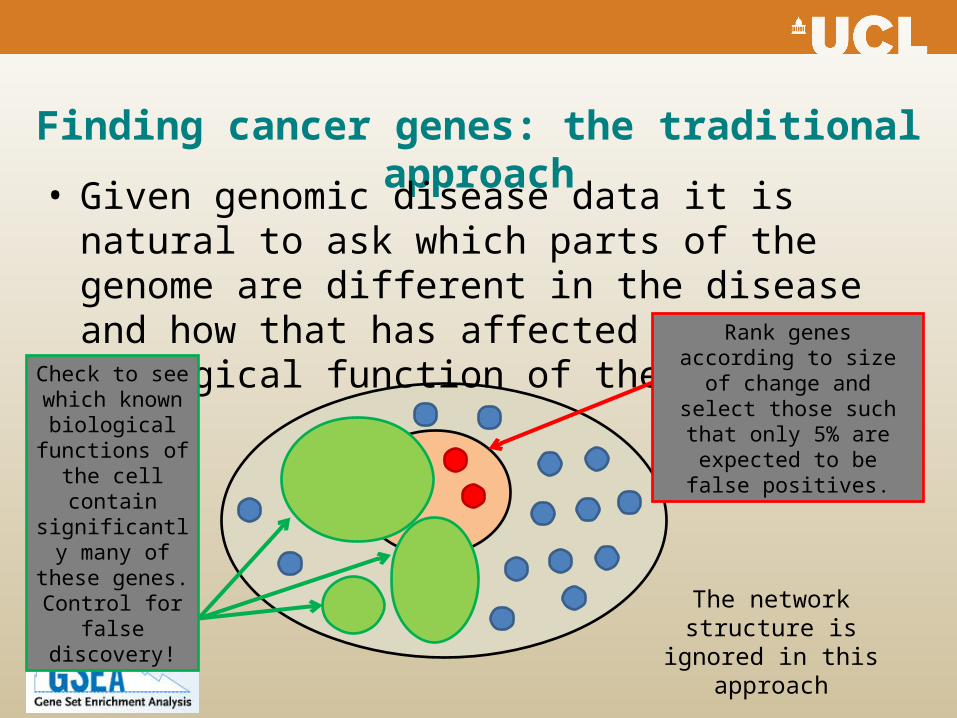
Finding cancer genes: the traditional approach
• Given genomic disease data it is natural to ask which parts of the genome are different in the disease and how that has affected the biological function of the system. Rank genes according to
size of change and select those such that only 5% are expected to be false
positives.
Check to see which known
biological functions of the
cell contain significantly
many of these genes. Control
for false discovery! The network
structure is ignored in this approach
Network approaches in cancer
• It is now known that most cancers are not caused by malfunctions in a single protein.
• In fact most tumors are characterized by hundreds of alterations (copy number, DNA methylation, …), often of different unknown levels of importance (drivers vs passengers).
• To address this challenge, biological data are often combined with interaction network models, giving rise to so-called integrated approaches.
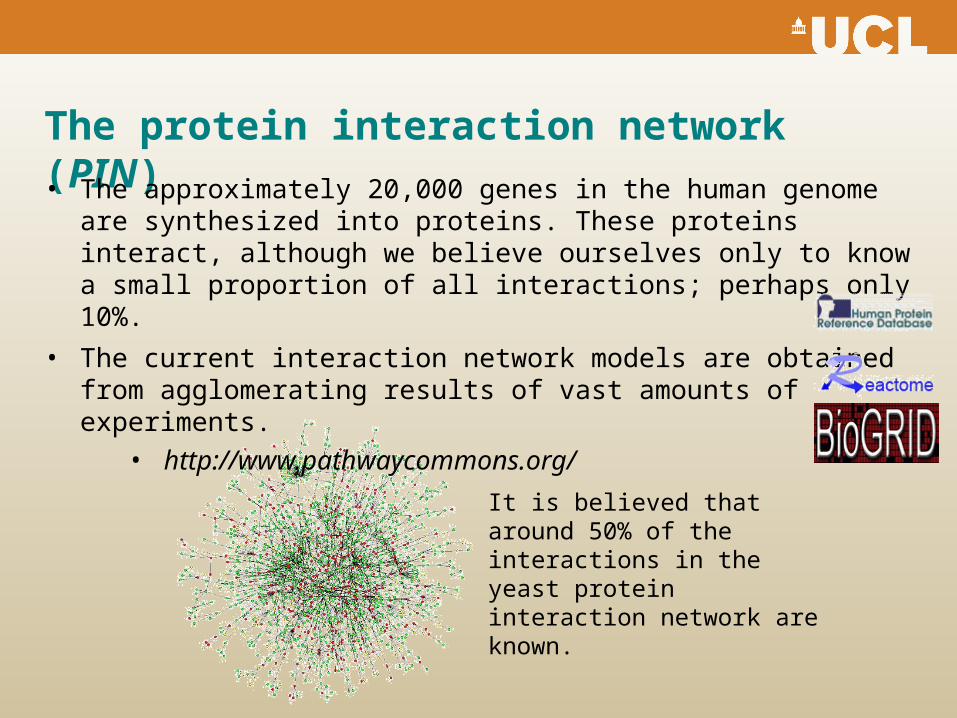
The protein interaction network (PIN)
• The approximately 20,000 genes in the human genome are synthesized into proteins. These proteins interact, although we believe ourselves only to know a small proportion of all interactions; perhaps only 10%.
• The current interaction network models are obtained from agglomerating results of vast amounts of experiments.
• http://www.pathwaycommons.org/
It is believed that around 50% of the interactions in the yeast protein interaction network are known.
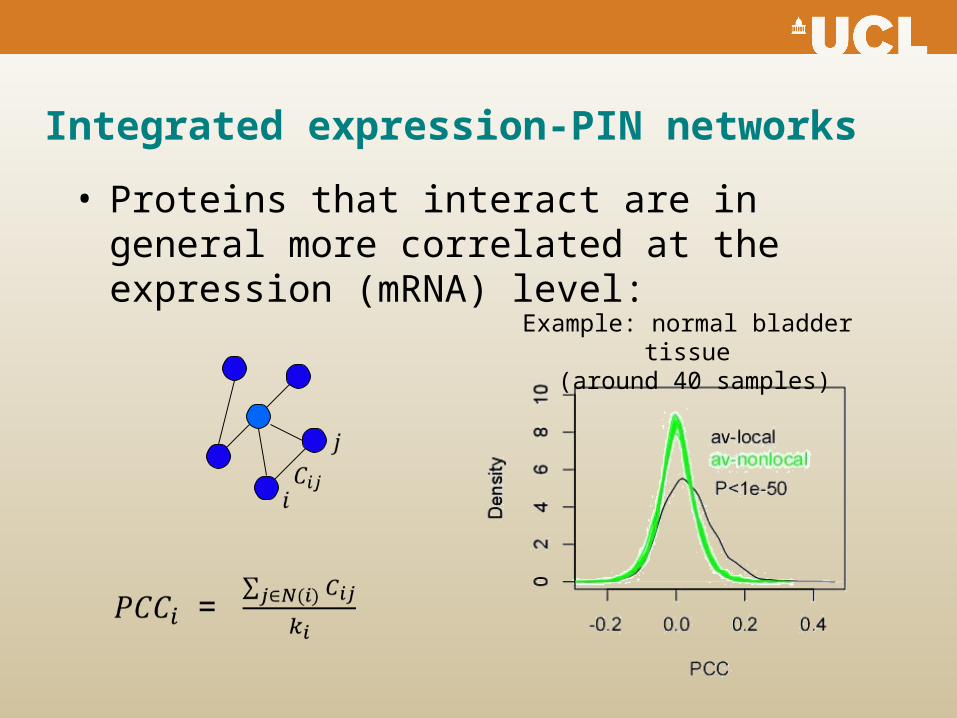
Integrated expression-PIN networks
• Proteins that interact are in general more correlated at the expression (mRNA) level:
Example: normal bladder tissue (around 40 samples)
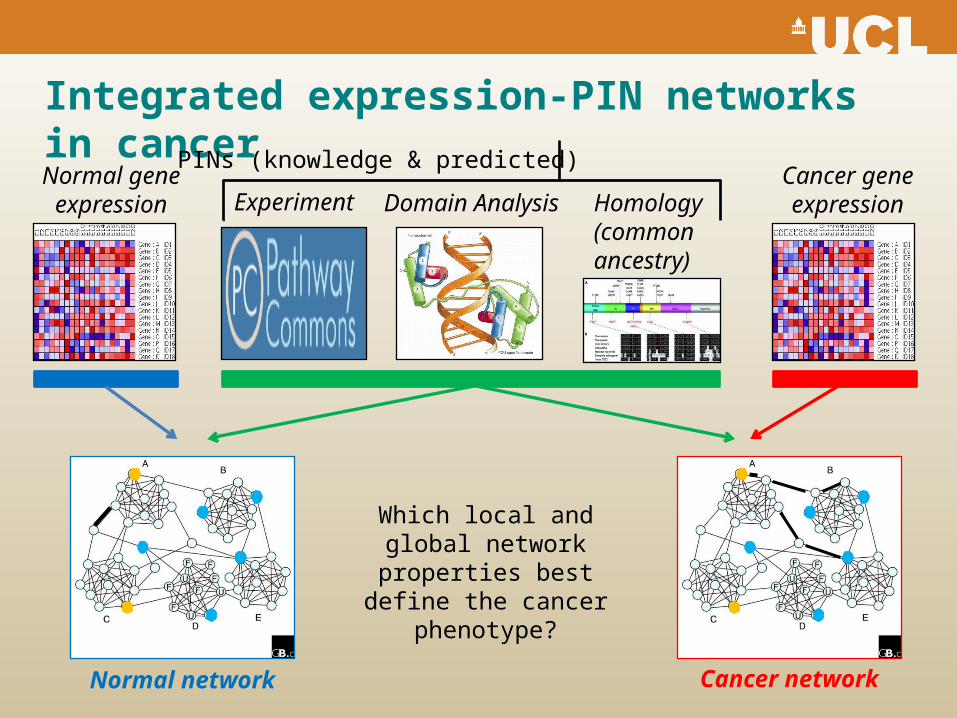
Integrated expression-PIN networks in cancer
Domain Analysis Homology (common ancestry)
ExperimentNormal gene expression
Cancer gene expression
PINs (knowledge & predicted)
Normal network
Which local and global network properties best
define the cancer phenotype?
Cancer network
Advantages of network approaches
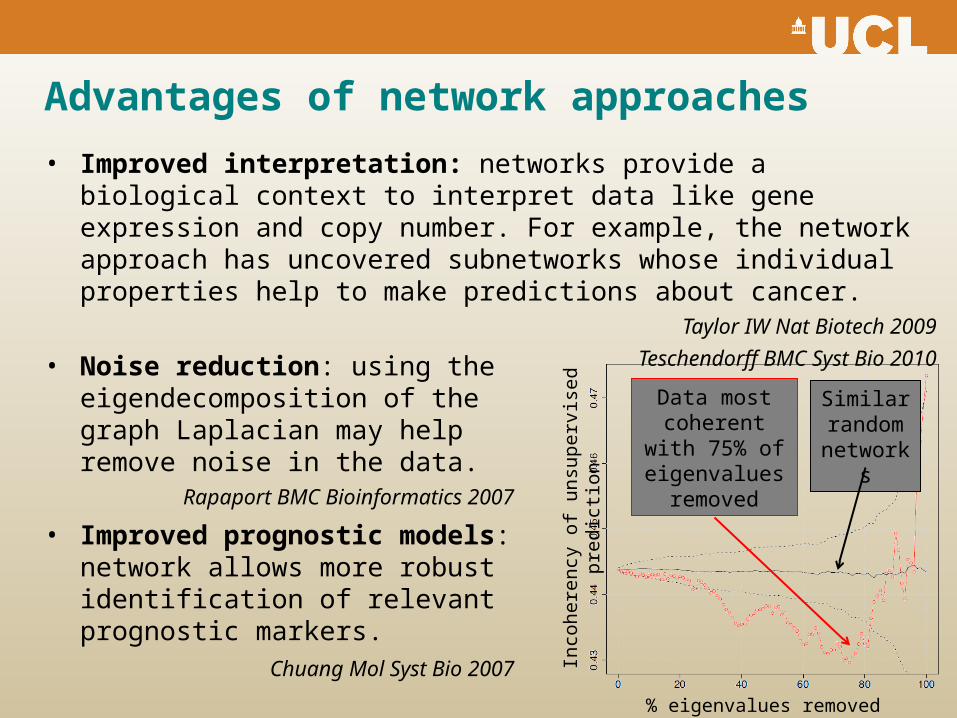
• Improved interpretation: networks provide a biological context to interpret data like gene expression and copy number. For example, the network approach has uncovered subnetworks whose individual properties help to make predictions about cancer.
Taylor IW Nat Biotech 2009
Teschendorff BMC Syst Bio 2010
• Noise reduction: using the eigendecomposition of the graph Laplacian may help remove noise in the data.
Rapaport BMC Bioinformatics 2007
• Improved prognostic models: network allows more robust identification of relevant prognostic markers.
Chuang Mol Syst Bio 2007
% eigenvalues removed
Inco
here
ncy
of
uns
upe
rvis
ed p
redi
ctio
n
Data most coherent with
75% of eigenvalues
removed
Similar random
networks
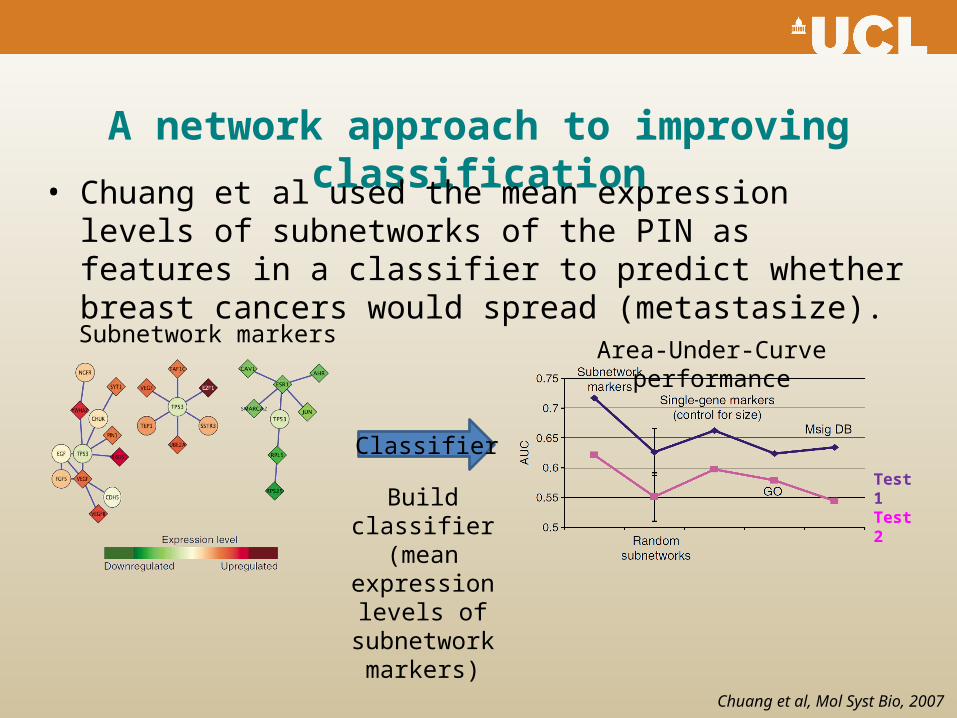
A network approach to improving classification
• Chuang et al used the mean expression levels of subnetworks of the PIN as features in a classifier to predict whether breast cancers would spread (metastasize).
Chuang et al, Mol Syst Bio, 2007
Subnetwork markers
Build classifier(mean
expression levels of subnetwork
markers)
Area-Under-Curve performance
Test 1Test 2
Classifier
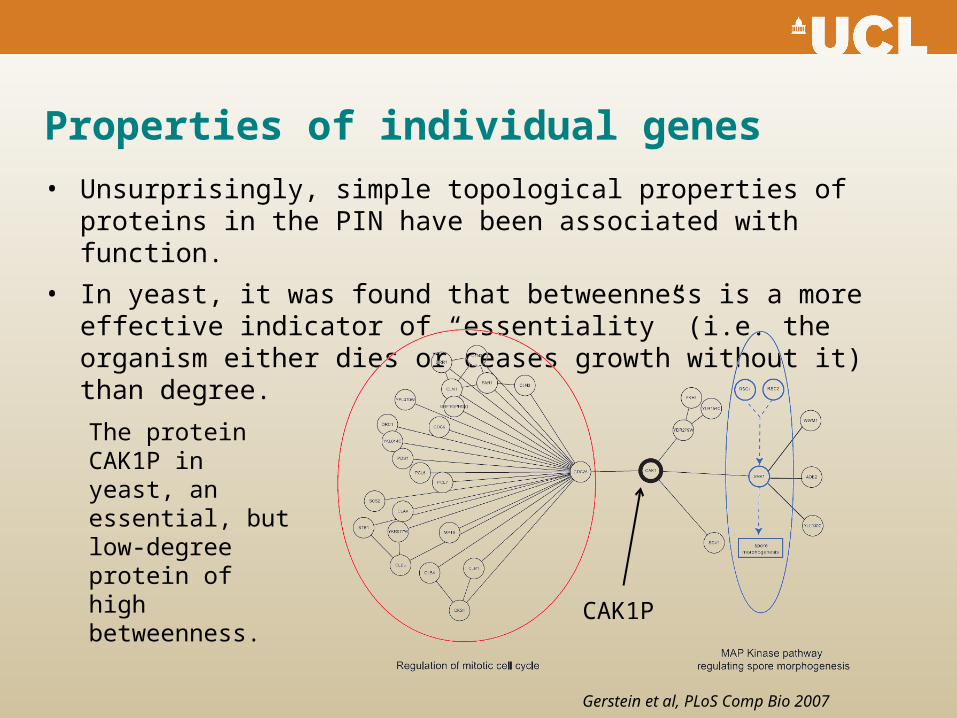
Properties of individual genes
• Unsurprisingly, simple topological properties of proteins in the PIN have been associated with function.
• In yeast, it was found that betweenness is a more effective indicator of “essentiality” (i.e. the organism either dies or ceases growth without it) than degree.
Gerstein et al, PLoS Comp Bio 2007
The protein CAK1P in yeast, an essential, but low-degree protein of high betweenness.
CAK1P
Properties of individual genes
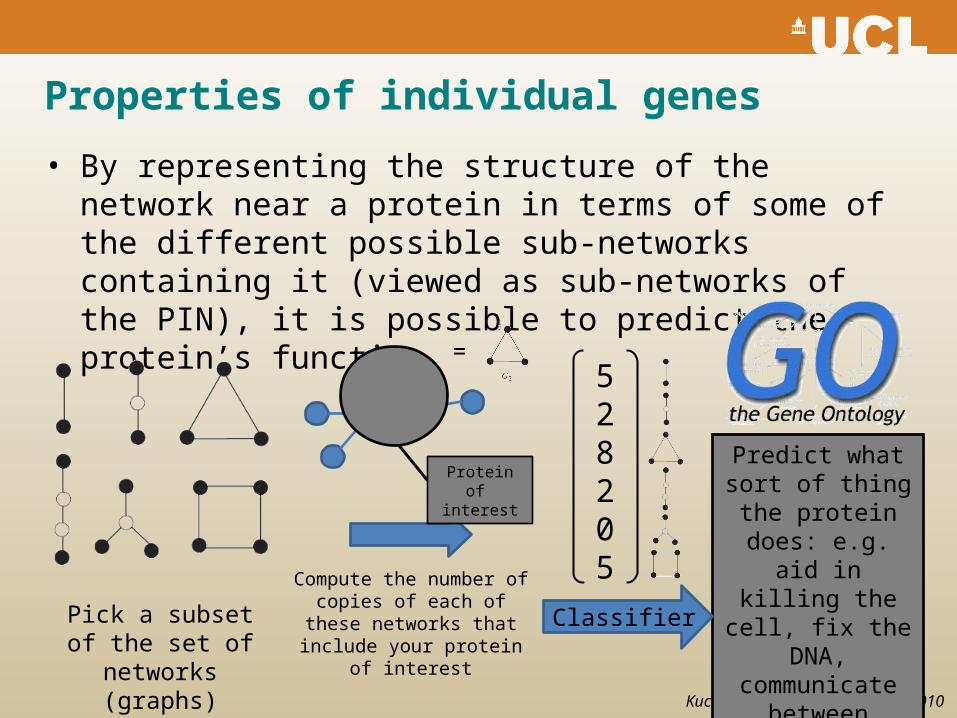
• By representing the structure of the network near a protein in terms of some of the different possible sub-networks containing it (viewed as sub-networks of the PIN), it is possible to predict the protein’s function.
Kuchalev et al, J R Soc Interface 2010
Pick a subset of the set of networks
(graphs)
Predict what sort of thing the
protein does: e.g. aid in killing the
cell, fix the DNA, communicate between cells,
etc.
Compute the number of copies of each of these
networks that include your protein of interest
Protein of interest
=528205
Classifier
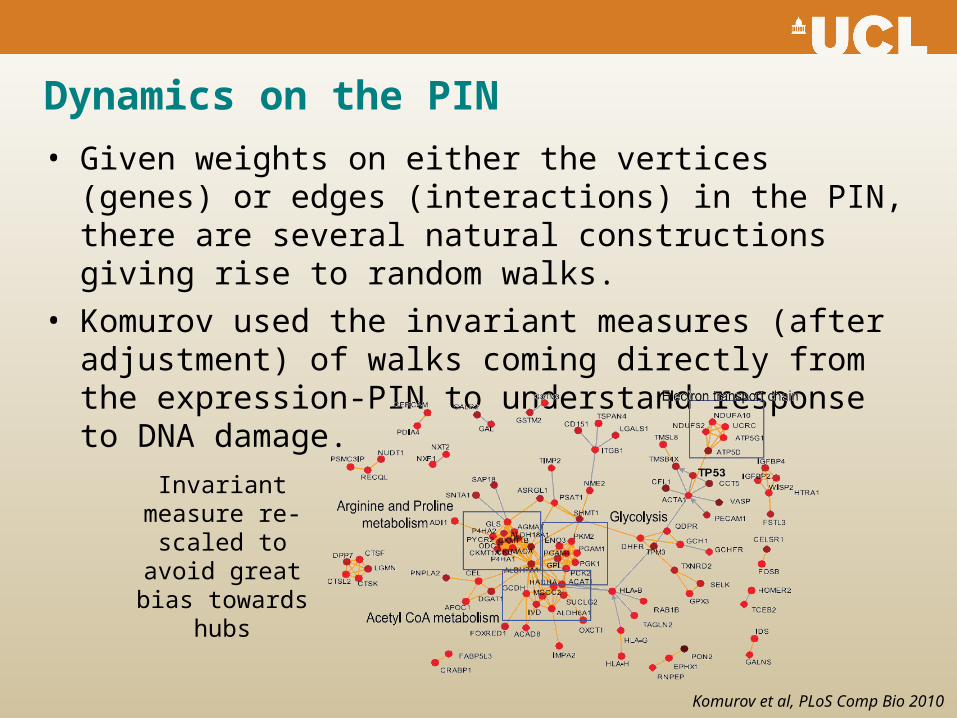
Dynamics on the PIN
• Given weights on either the vertices (genes) or edges (interactions) in the PIN, there are several natural constructions giving rise to random walks.
• Komurov used the invariant measures (after adjustment) of walks coming directly from the expression-PIN to understand response to DNA damage.
Komurov et al, PLoS Comp Bio 2010
Invariant measure re-scaled to avoid
great bias towards hubs
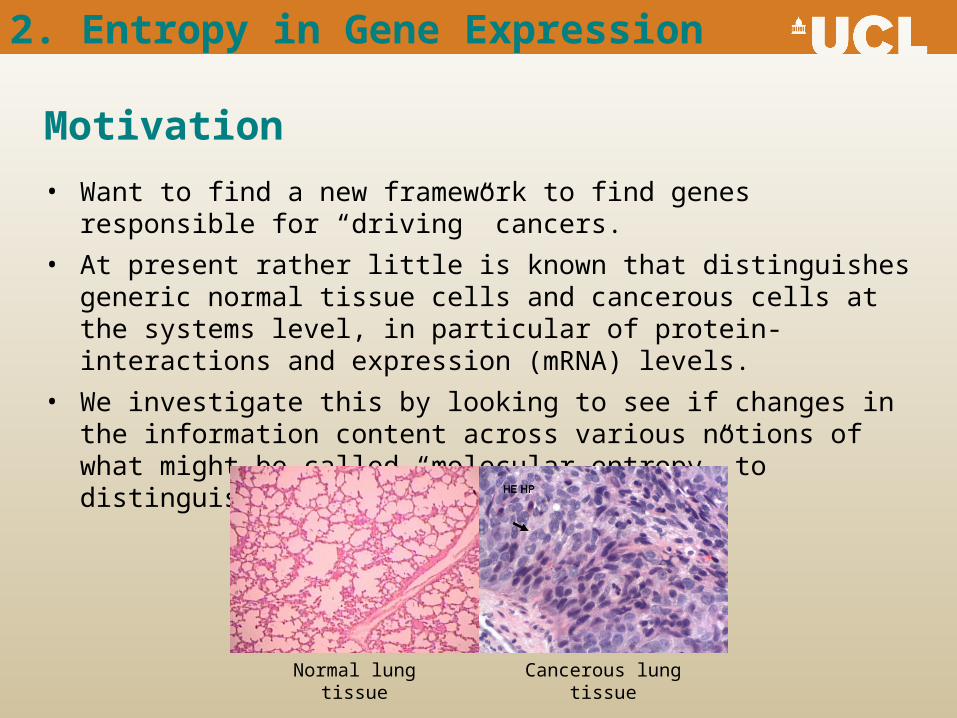
Motivation
• Want to find a new framework to find genes responsible for “driving” cancers.
• At present rather little is known that distinguishes generic normal tissue cells and cancerous cells at the systems level, in particular of protein-interactions and expression (mRNA) levels.
• We investigate this by looking to see if changes in the information content across various notions of what might be called “molecular entropy” to distinguish normal and cancer tissues.
2. Entropy in Gene Expression
Normal lung tissue Cancerous lung tissue
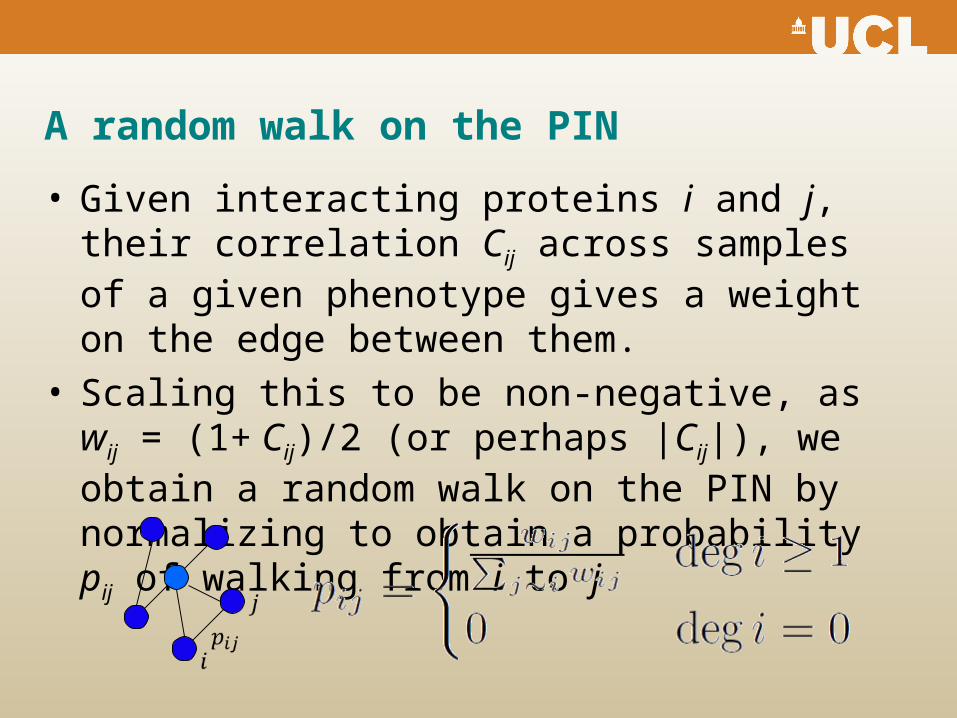
A random walk on the PIN
• Given interacting proteins i and j, their correlation Cij across samples of a given phenotype gives a weight on the edge between them.
• Scaling this to be non-negative, as wij = (1+ Cij)/2 (or perhaps |Cij|), we obtain a random walk on the PIN by normalizing to obtain a probability pij of walking from i to j
The choice of walk
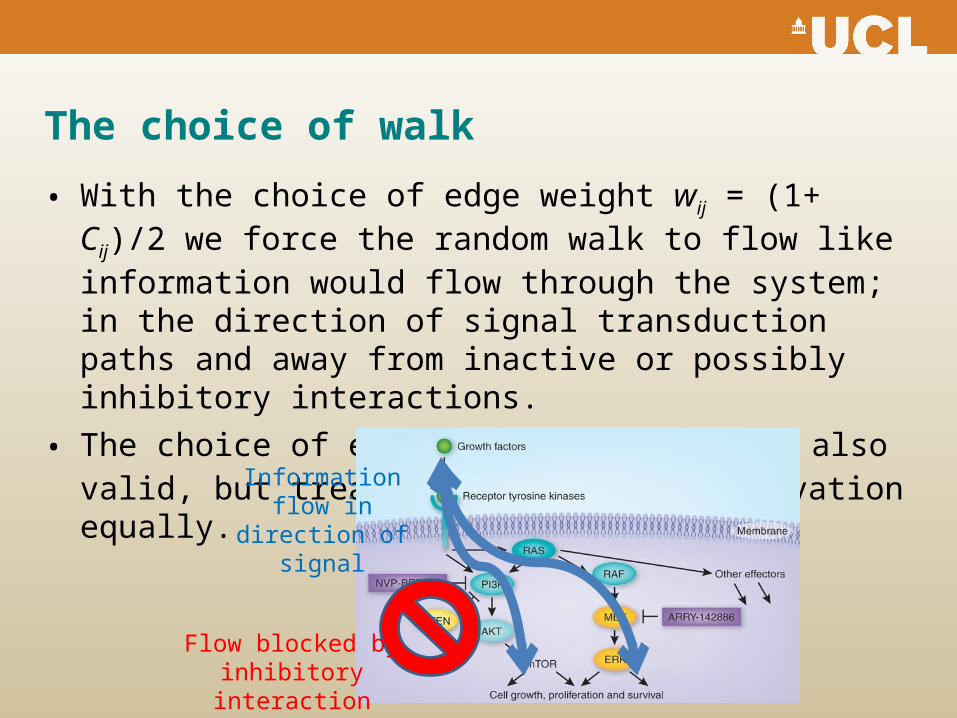
• With the choice of edge weight wij = (1+ Cij)/2 we force the random walk to flow like information would flow through the system; in the direction of signal transduction paths and away from inactive or possibly inhibitory interactions.
• The choice of edge weight wij = |Cij| is also valid, but treats inhibition and activation equally.
Information flow in direction of signal
Flow blocked by inhibitory interaction
Molecular entropy
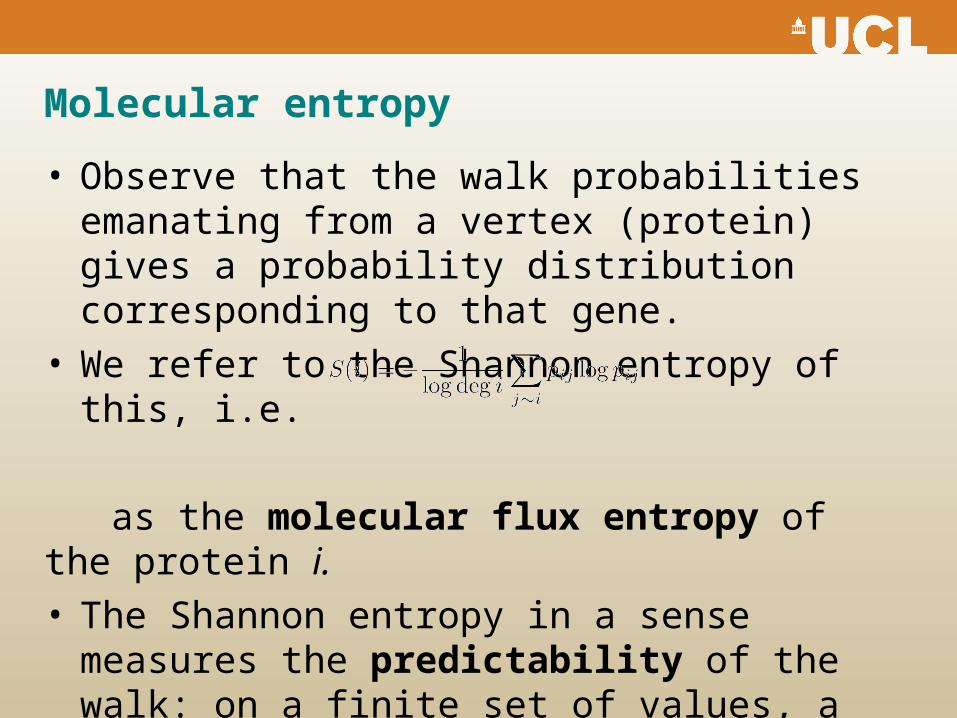
• Observe that the walk probabilities emanating from a vertex (protein) gives a probability distribution corresponding to that gene.
• We refer to the Shannon entropy of this, i.e.
as the molecular flux entropy of the protein i.• The Shannon entropy in a sense measures the
predictability of the walk: on a finite set of values, a uniform distribution is least predictable, and a distribution always taking the same value the most.
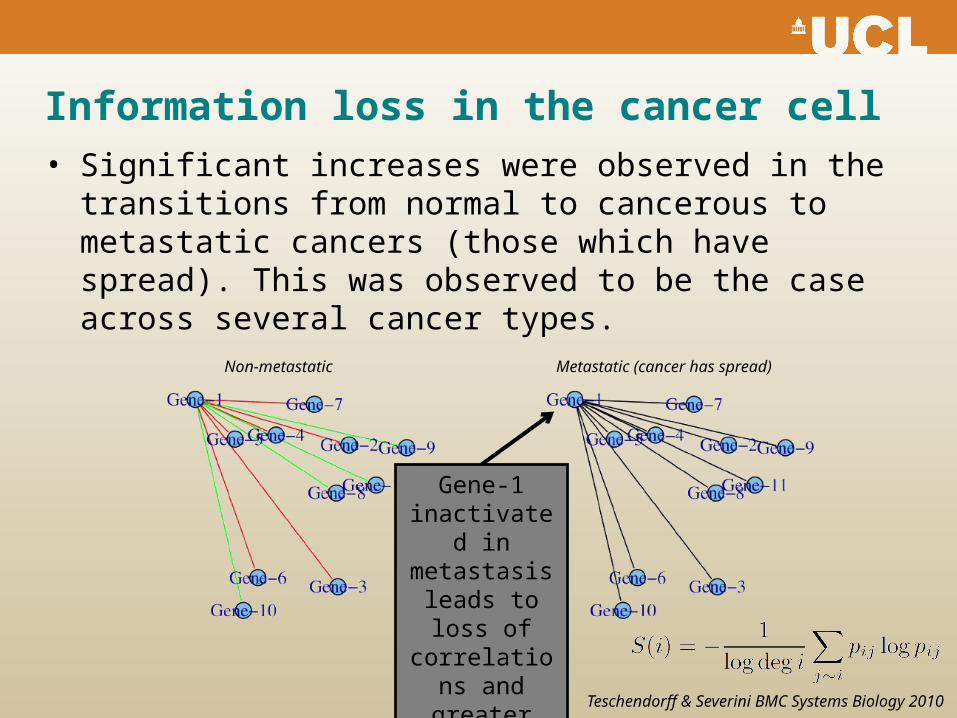
Information loss in the cancer cell• Significant increases were observed in the transitions from
normal to cancerous to metastatic cancers (those which have spread). This was observed to be the case across several cancer types.
Teschendorff & Severini BMC Systems Biology 2010
Non-metastatic Metastatic (cancer has spread)
Gene-1 inactivated in metastasis
leads to loss of correlations
and greater entropy
Information loss in the cancer cell
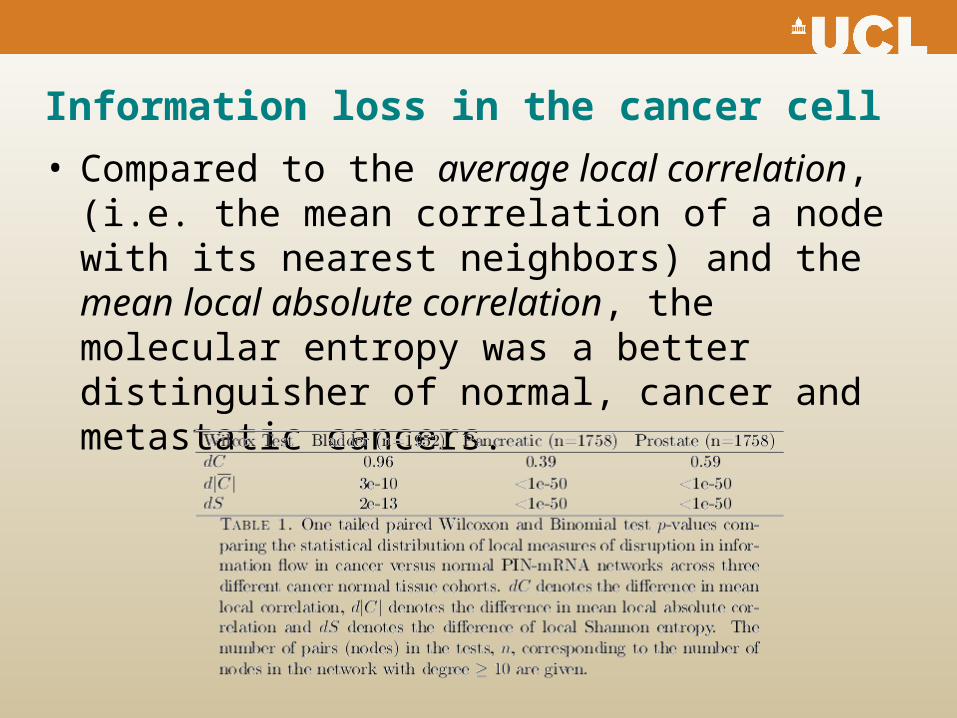
• Compared to the average local correlation, (i.e. the mean correlation of a node with its nearest neighbors) and the mean local absolute correlation, the molecular entropy was a better distinguisher of normal, cancer and metastatic cancers.
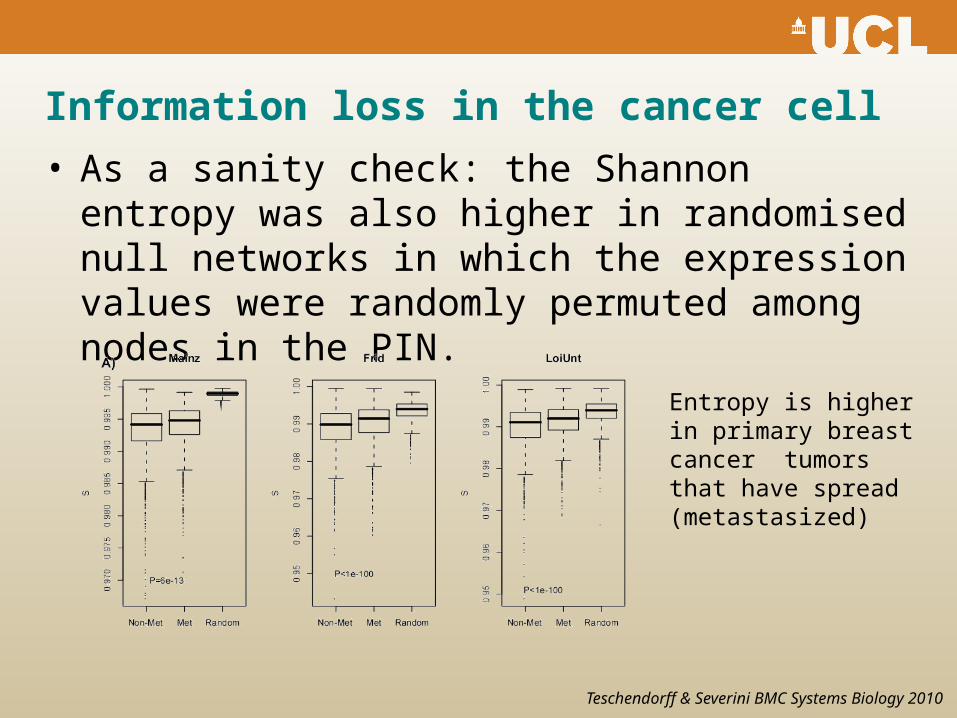
Information loss in the cancer cell
• As a sanity check: the Shannon entropy was also higher in randomised null networks in which the expression values were randomly permuted among nodes in the PIN.
Entropy is higher in primary breast cancer tumors that have spread (metastasized)
Teschendorff & Severini BMC Systems Biology 2010
Dynamical entropy over longer distances
• The previous notion of molecular entropy obtained weights from the correlations in two different phenotypes and computed the disorder of these (after slight adjustment) looking only at immediate neighbors.
• Observe that the kth power of the stochastic matrix p = (pij) gives the information flow over distances of length k.
• The total information flow of various distances between two genes can be obtained by taking a choice of linear combination of powers of p.
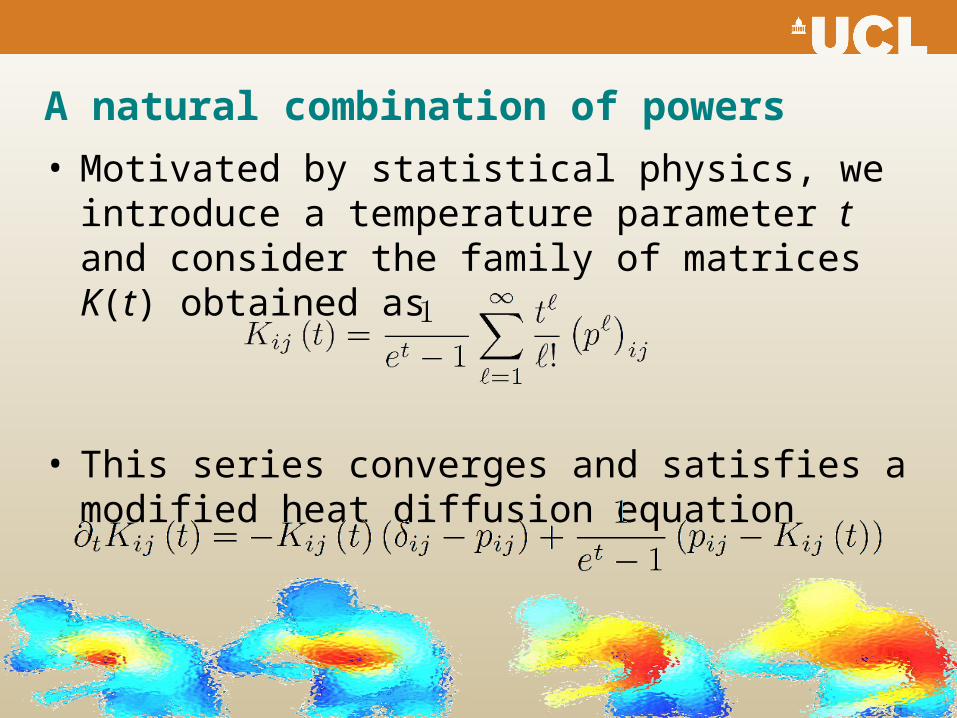
A natural combination of powers
• Motivated by statistical physics, we introduce a temperature parameter t and consider the family of matrices K(t) obtained as
• This series converges and satisfies a modified heat diffusion equation
Heating it up
• In the “hot” temperature limit, this indeed approximates a solution of the heat diffusion equation
• For each t we may write down a “global” entropy S(t) of the information flux as
where Q is the number of non-zero entries of K.• We refer to this as the global flux entropy.
West et al Submitted 2012
Covariance entropy
• Before studying the flux entropy further, we introduce another notion recently studied.
• The covariance entropy quantifies the degree of similarity between samples as determined by their Pearson correlations, first considered in the context of gene expression by van Wieringen and van der Vaart.
• They argue that with the accumulation of copy number aberrations in cancer, there should be an increase in genomic entropy. For this to be cancerous, this should be reflected in expression.
van Wieringen et al Bioinforrmatics 2011
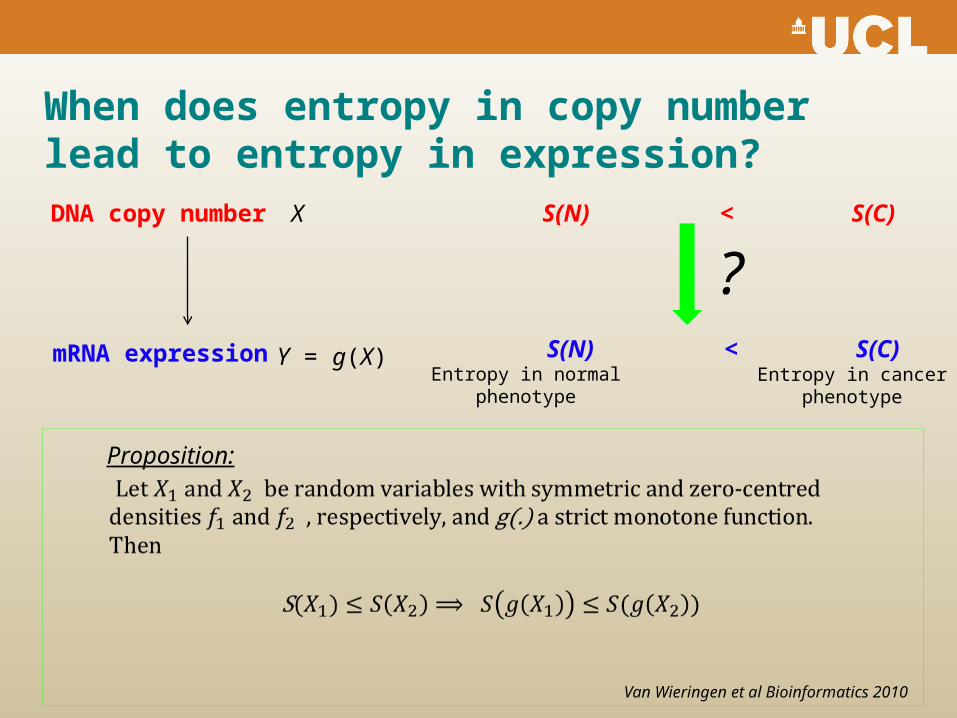
When does entropy in copy number lead to entropy in expression?DNA copy number
Entropy in normal phenotype
Entropy in cancer phenotype
S(N) < S(C)
mRNA expression S(N) < S(C)
X
Y = g(X)
Proposition:
Van Wieringen et al Bioinformatics 2010
?
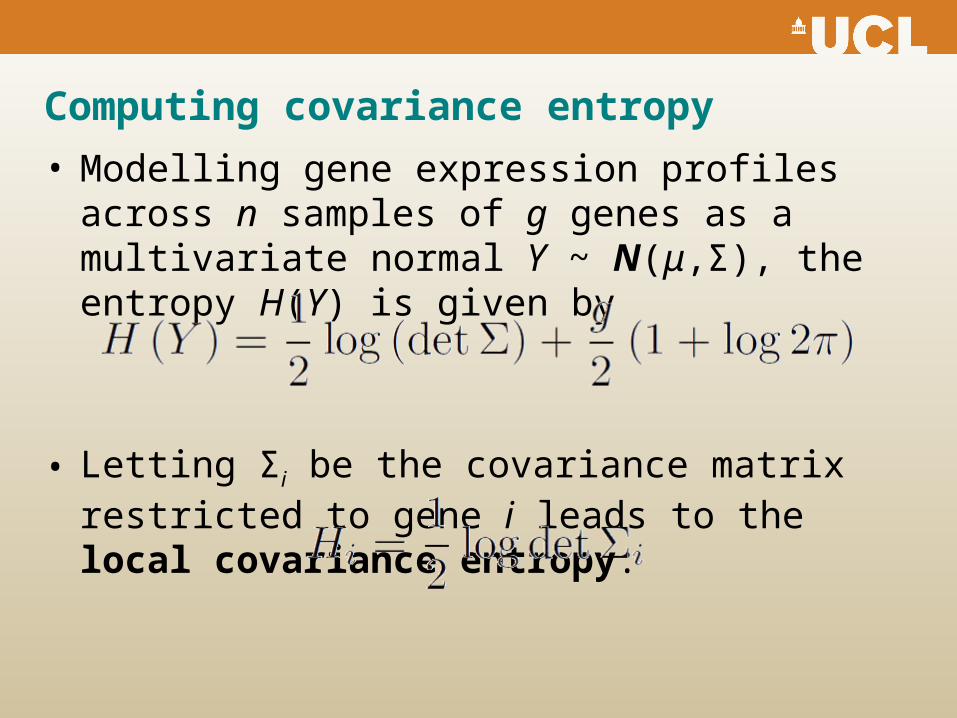
Computing covariance entropy
• Modelling gene expression profiles across n samples of g genes as a multivariate normal Y ~ N(μ,Σ), the entropy H(Y) is given by
• Letting Σi be the covariance matrix restricted to gene i leads to the local covariance entropy:
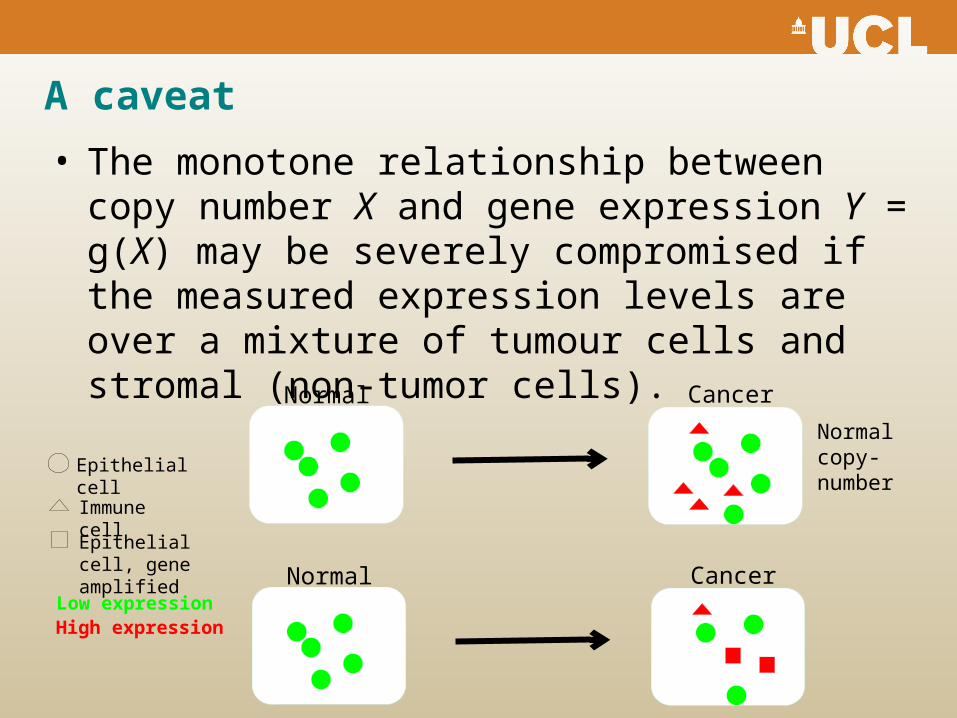
A caveat
• The monotone relationship between copy number X and gene expression Y = g(X) may be severely compromised if the measured expression levels are over a mixture of tumour cells and stromal (non-tumor cells).
Normal Cancer
Normal Cancer
Normal copy-number
Epithelial cell
Immune cell
Low expressionHigh expression
Epithelial cell, gene amplified
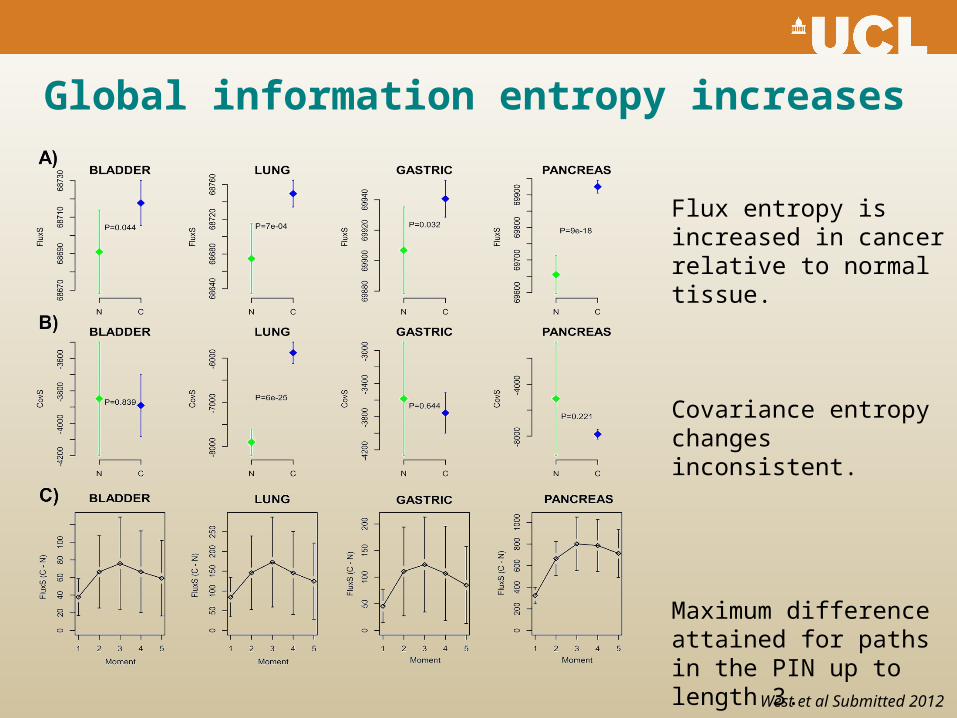
Global information entropy increases
Flux entropy is increased in cancer relative to normal tissue.
Covariance entropy changes inconsistent.
Maximum difference attained for paths in the PIN up to length 3.
West et al Submitted 2012
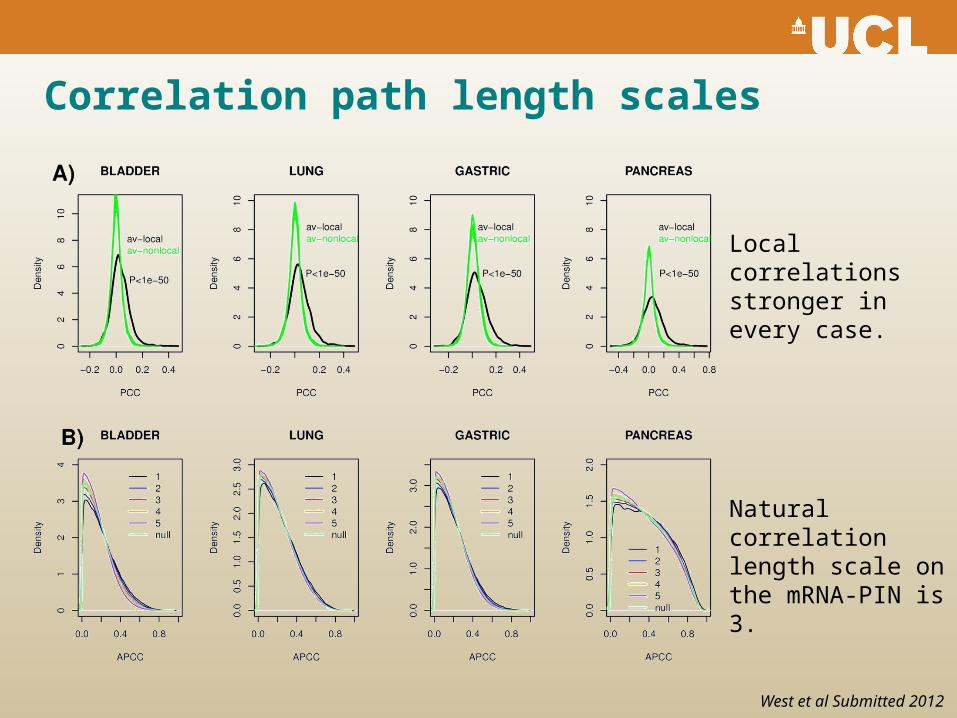
Correlation path length scales
Natural correlation length scale on the mRNA-PIN is 3.
West et al Submitted 2012
Local correlations stronger in every case.
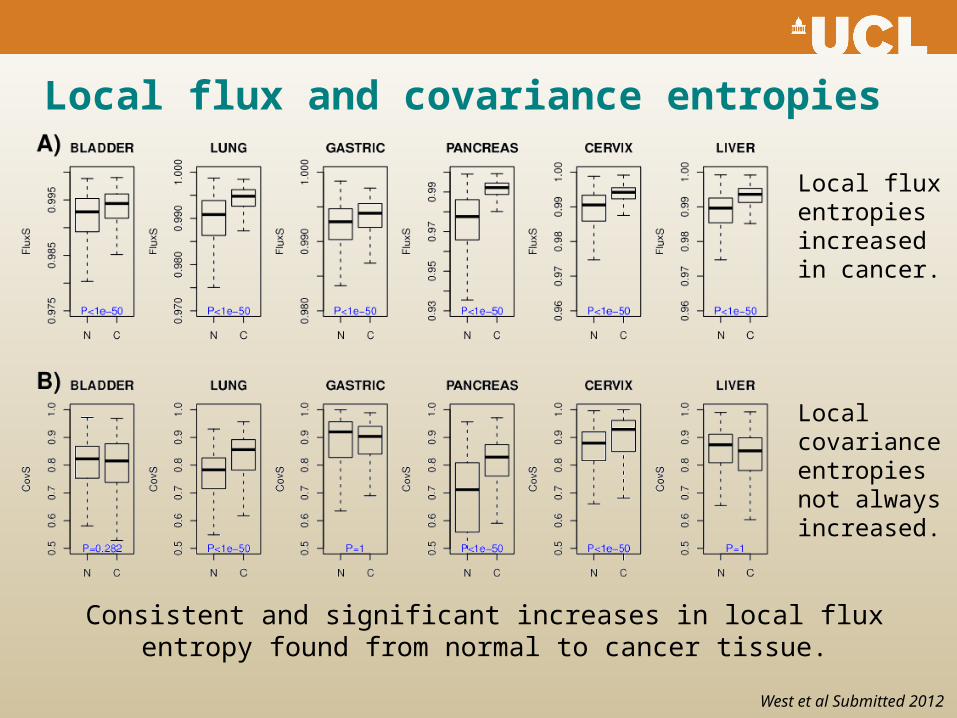
Local flux and covariance entropies
Consistent and significant increases in local flux entropy found from normal to cancer tissue.
Local flux entropies increased in cancer.
Local covariance entropies not always increased.
West et al Submitted 2012
Differential expression and entropy
• Hypothesis: alterations in genes “driving” the cancer should lead to disruptions in local and global gene expression patterns causing changes in entropy.
• Consequences: • Genes whose inactivation confers selective
advantage (tumor suppressors) should tend to show increases in local flux entropy.
• Genes that become activated in cancer (oncogenes) can be expected to show reductions.
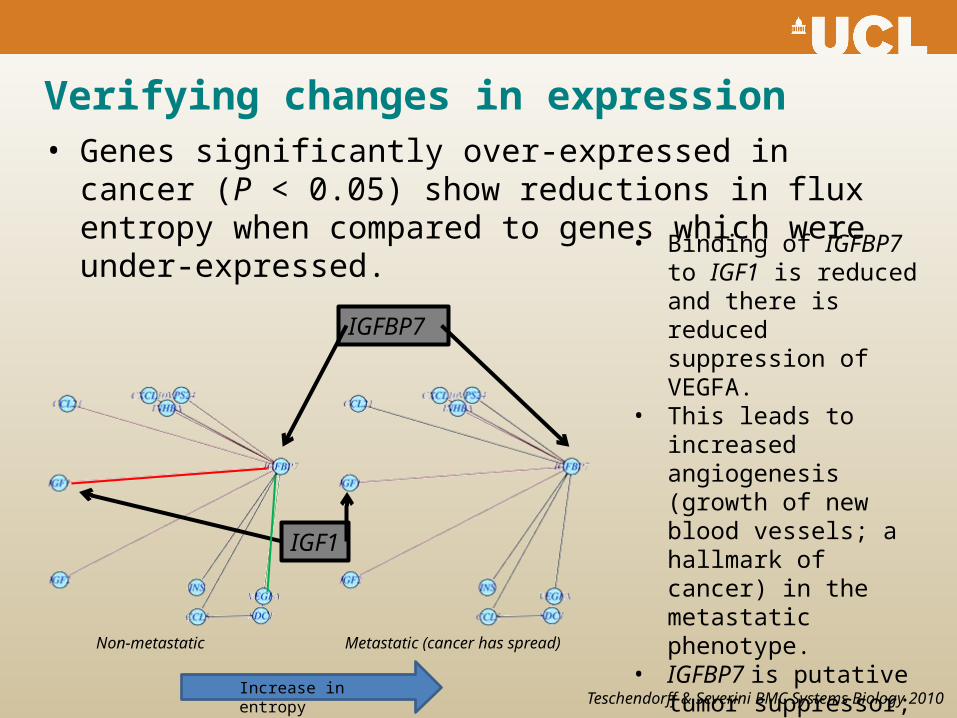
Verifying changes in expression• Genes significantly over-expressed in cancer (P < 0.05)
show reductions in flux entropy when compared to genes which were under-expressed. • Binding of IGFBP7 to
IGF1 is reduced and there is reduced suppression of VEGFA.
• This leads to increased angiogenesis (growth of new blood vessels; a hallmark of cancer) in the metastatic phenotype.
• IGFBP7 is putative tumor suppressor; lower expression in cancer. Wajapeyee et al Cell 2008, Oh Y et al J Biol Chem 1996
Teschendorff & Severini BMC Systems Biology 2010
IGFBP7
Non-metastatic Metastatic (cancer has spread)
IGF1
Increase in entropy
Interpreting flux entropy
• The increased flux entropy in cancer may endow cancer cells with the flexibility to adapt to the strong selective pressures of the tumor microenvironment.
• The fluctuation theorem of Demetrius et al asserts
ΔRΔS > 0
i.e. there is a correlation between changes in network entropy S and robustness R. As such it is possible that cancer alterations leading to significant increases in flux entropy may contribute to the dynamical robustness of such cancer cells.
Demetrius et al 2004 Physics A 346
Therapeutic applications
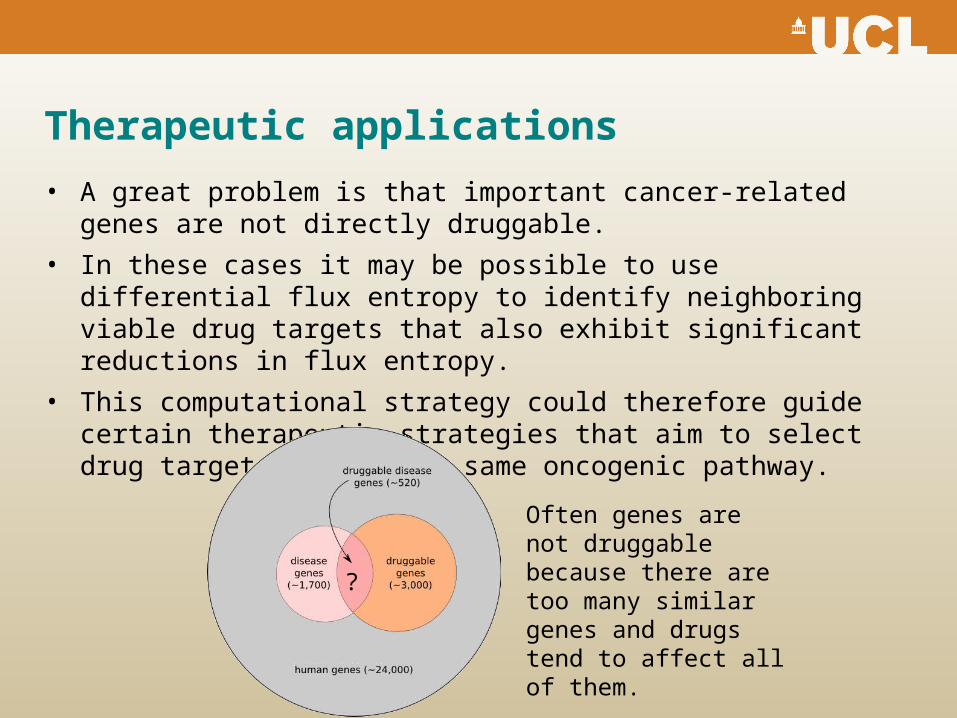
• A great problem is that important cancer-related genes are not directly druggable.
• In these cases it may be possible to use differential flux entropy to identify neighboring viable drug targets that also exhibit significant reductions in flux entropy.
• This computational strategy could therefore guide certain therapeutic strategies that aim to select drug targets within the same oncogenic pathway.
?
Often genes are not druggable because there are too many similar genes and drugs tend to affect all of them.
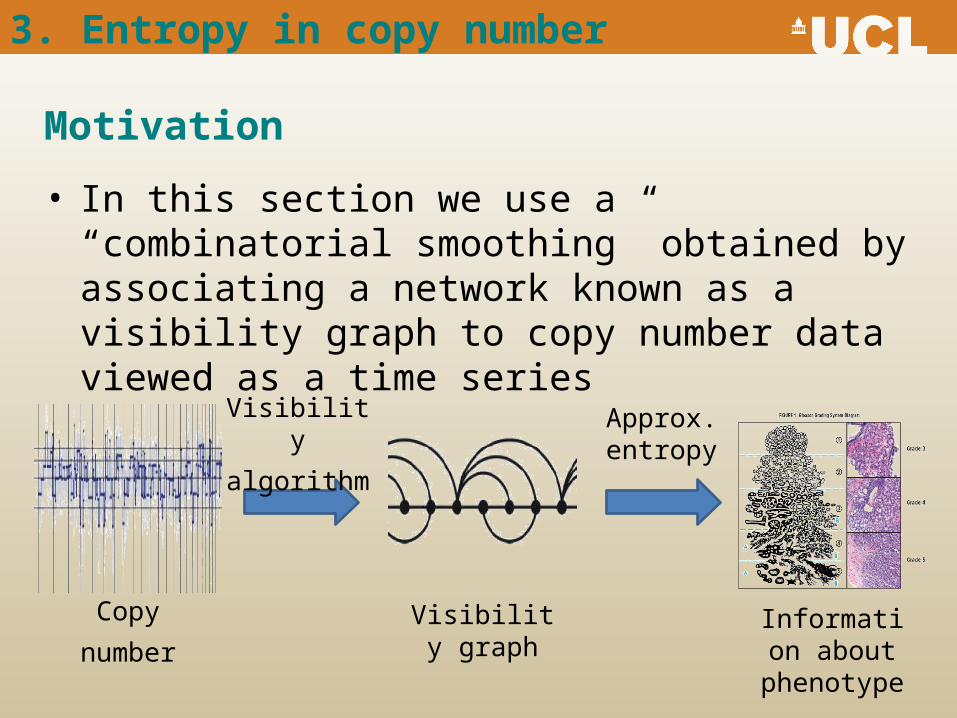
Motivation
3. Entropy in copy number
Copy
number
Visibility graph
Approx. entropy
Visibility
algorithm
Information about
phenotype
• In this section we use a “combinatorial smoothing” obtained by associating a network known as a visibility graph to copy number data viewed as a time series
Approximate entropy of networks
• Much practical work has considered an entropic origin for various properties of complex networks, including biodiversity in ecological networks, the emergence of degree-degree correlations and communities in social and biological networks.
• These approaches focus mainly on the ubiquitous Shannon entropy, and to help complete the picture we introduce a notion based around the approximate entropy.
Approximate entropy
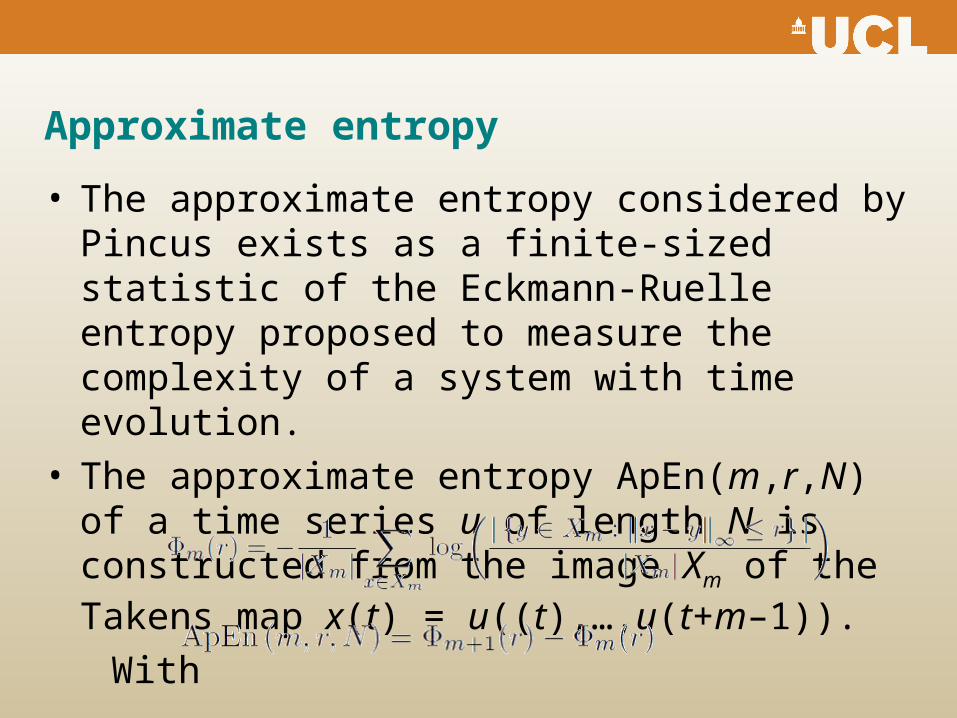
• The approximate entropy considered by Pincus exists as a finite-sized statistic of the Eckmann-Ruelle entropy proposed to measure the complexity of a system with time evolution.
• The approximate entropy ApEn(m,r,N) of a time series u of length N is constructed from the image Xm of the Takens map x(t) = u((t),…,u(t+m–1)).
With
define
The Rukhin estimate
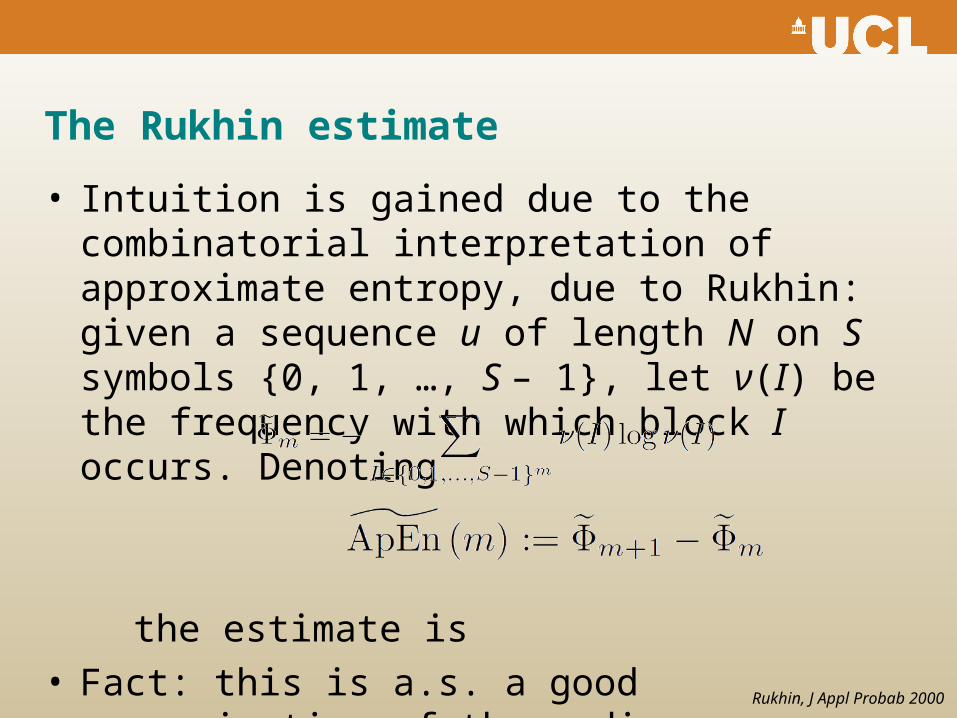
• Intuition is gained due to the combinatorial interpretation of approximate entropy, due to Rukhin: given a sequence u of length N on S symbols {0, 1, …, S – 1}, let ν(I) be the frequency with which block I occurs. Denoting
the estimate is • Fact: this is a.s. a good approximation of the
ordinary approximate entropy of u.
Rukhin, J Appl Probab 2000
Upshot of the Rukhin estimate
• As such, on a finite set of symbols, the approximate entropy adds something new, measuring something distinct from the ordinary statistical moments (mean, variance, … ) and the Shannon entropy of the sequence.
• It can be (almost surely!) thought of measuring how much data a choice of universal data compressor would use to store the object.
Approximate entropy of a degree sequence
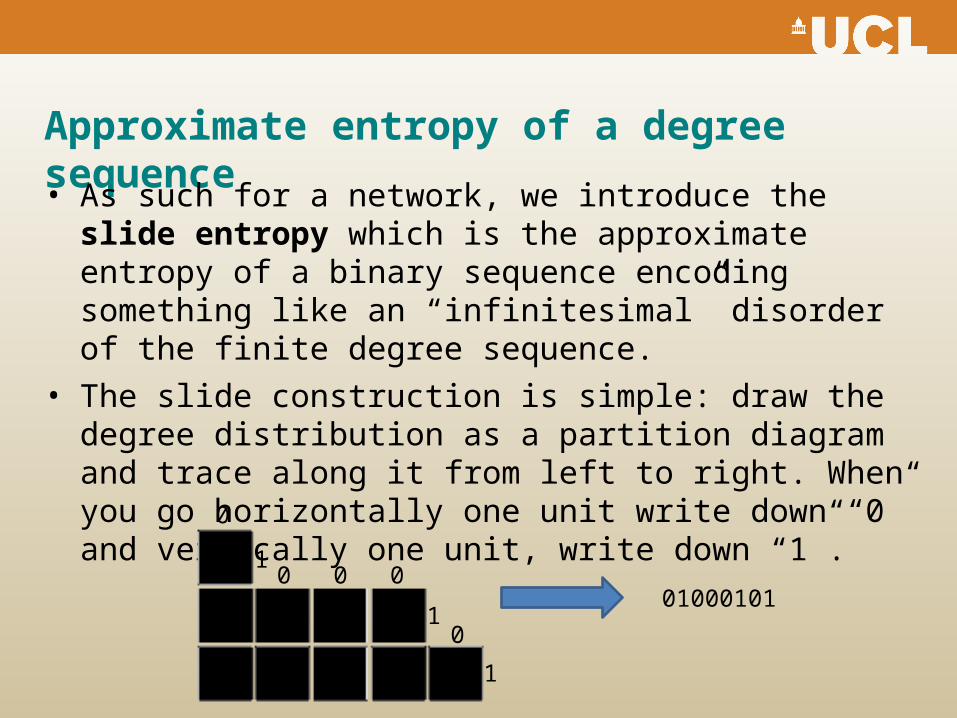
• As such for a network, we introduce the slide entropy which is the approximate entropy of a binary sequence encoding something like an “infinitesimal” disorder of the finite degree sequence.
• The slide construction is simple: draw the degree distribution as a partition diagram and trace along it from left to right. When you go horizontally one unit write down “0” and vertically one unit, write down “1”.
0
0
0 0
0
1
101000101
1
Analytics for the slide entropy
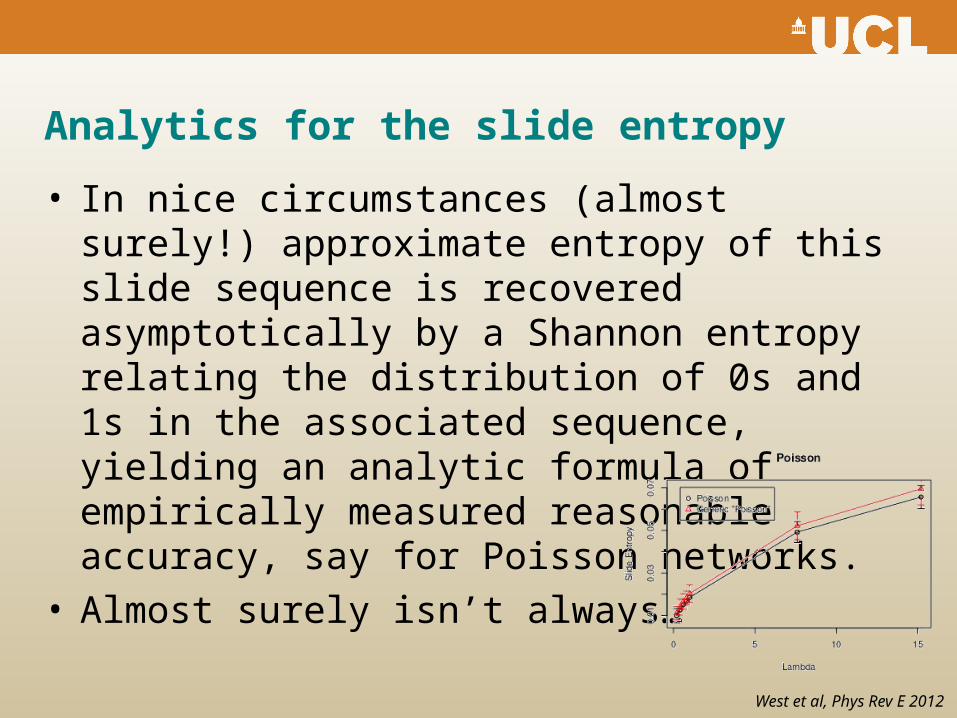
• In nice circumstances (almost surely!) approximate entropy of this slide sequence is recovered asymptotically by a Shannon entropy relating the distribution of 0s and 1s in the associated sequence, yielding an analytic formula of empirically measured reasonable accuracy, say for Poisson networks.
• Almost surely isn’t always…
West et al, Phys Rev E 2012
Visibility graphs
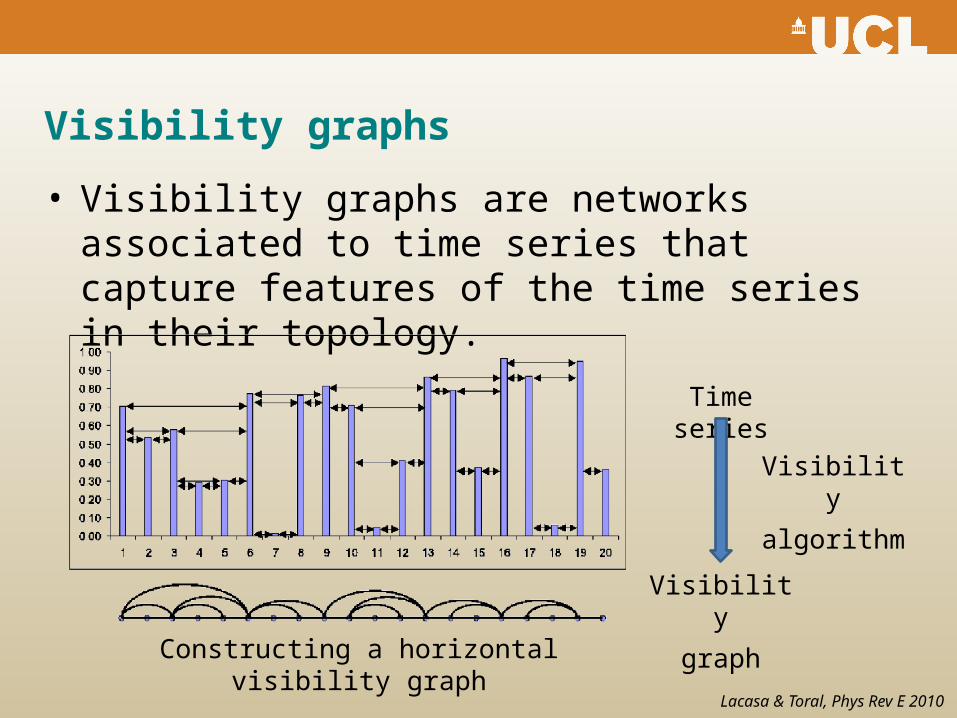
• Visibility graphs are networks associated to time series that capture features of the time series in their topology.
Time series
Visibility
algorithm
Visibility
graphConstructing a horizontal visibility graph
Lacasa & Toral, Phys Rev E 2010
An example application of visibility graphs
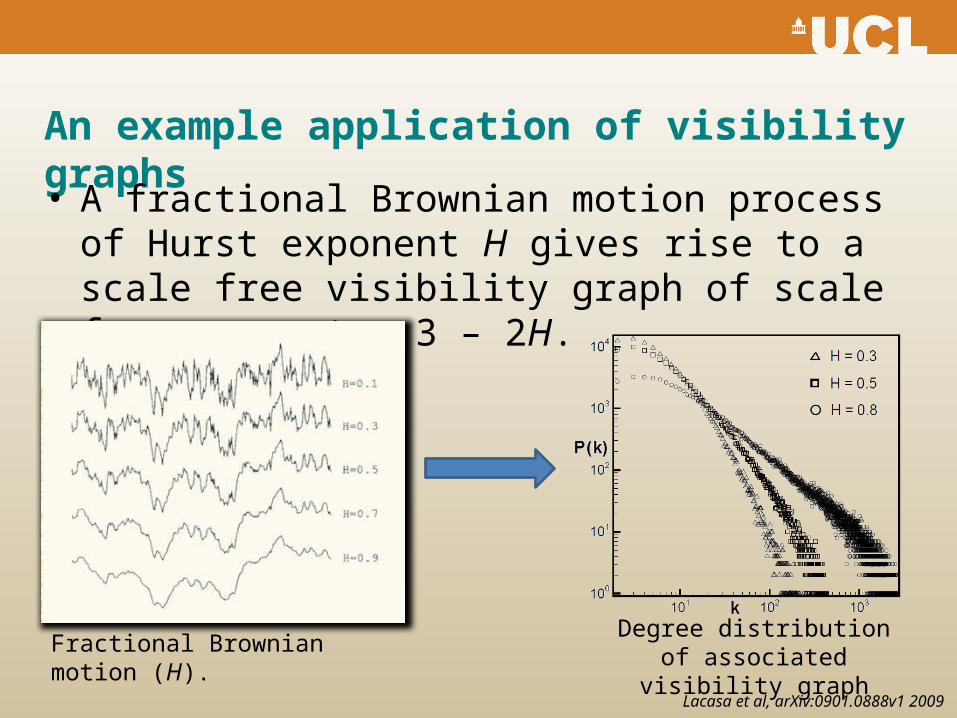
• A fractional Brownian motion process of Hurst exponent H gives rise to a scale free visibility graph of scale free parameter 3 – 2H.
Lacasa et al, arXiv:0901.0888v1 2009
Fractional Brownian motion (H).Degree distribution of
associated visibility graph
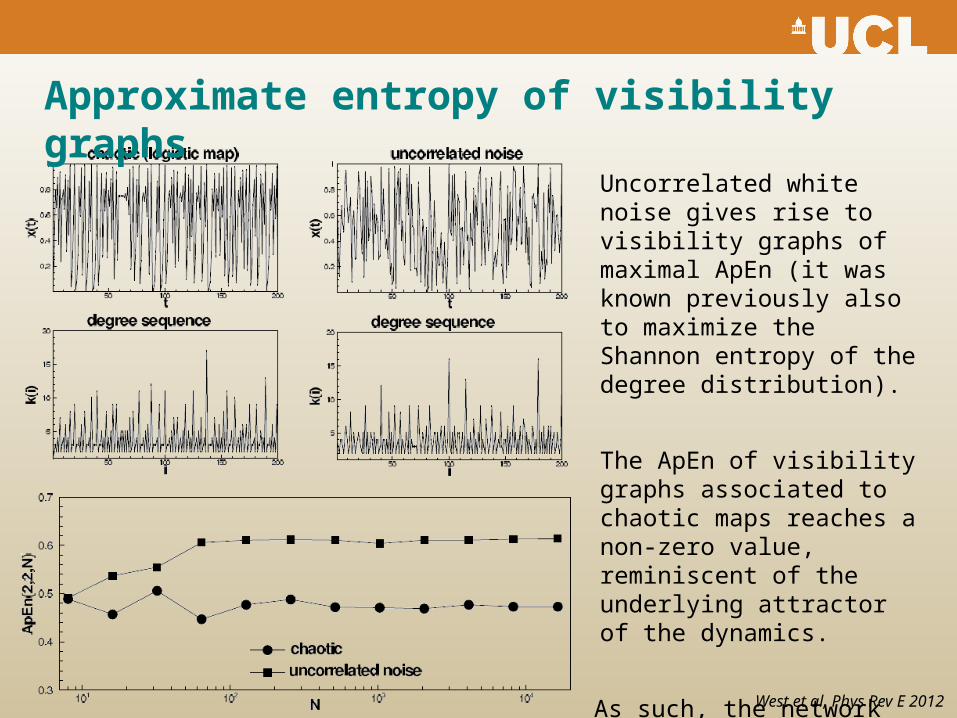
Approximate entropy of visibility graphs
Uncorrelated white noise gives rise to visibility graphs of maximal ApEn (it was known previously also to maximize the Shannon entropy of the degree distribution).
The ApEn of visibility graphs associated to chaotic maps reaches a non-zero value, reminiscent of the underlying attractor of the dynamics.
As such, the network structure also inherits the complexity of the time series.
West et al, Phys Rev E 2012
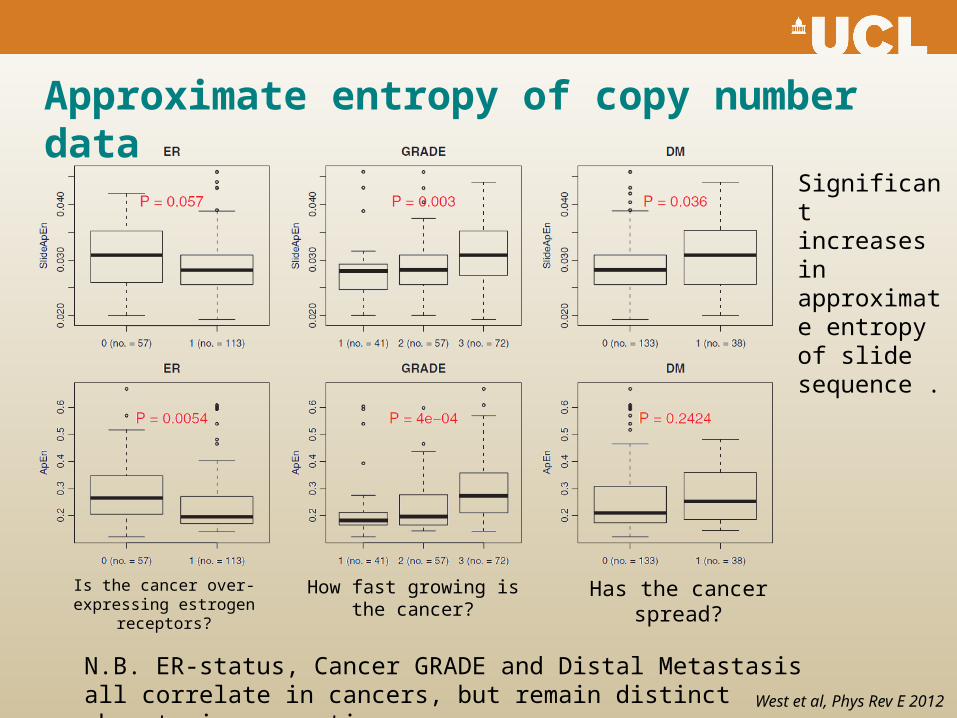
Approximate entropy of copy number data
Significant increases in approximate entropy of slide sequence .
West et al, Phys Rev E 2012
N.B. ER-status, Cancer GRADE and Distal Metastasis all correlate in cancers, but remain distinct phenotypic properties.
Has the cancer spread?How fast growing is the cancer?
Is the cancer over-expressing estrogen receptors?
Summary
4. The End
1. The flux entropy combines network information with gene expression to provide a hallmark of cancer.
2. It is a more consistent indicator than more basic considerations of the correlations, and similarity of samples even when restricted to the network.
3. It may be useful in guiding therapeutic target selection and helps to indicate genes driving cancers.
4. The approximate entropy of the slide sequence associated to copy number data might help to distinguish tumor grade and metastasis.
References
1. “On dynamical network entropy in cancer”. James West, Ginestra Bianconi, Simone Severini and Andrew E. Teschendorff. arXiv:1202.3015v1 [q-bio.MN].
2. “Approximate entropy of network parameters”, Physical Review E 2012. James West, Lucas Lacasa, Simone Severini and Andrew E. Teschendorff. arXiv:1201.0045v1 [cond-mat.dis-nn].
Andrew Teschendorff Simone Severini
Lucas Lacasa Ginestra Bianconi
Acknowledgements