Embed Size (px)
Citation preview
PHYSICAL REVIEW E 00, 002200 (2015)1
Network flow model of force transmission in unbonded and bonded granular media2
Antoinette Tordesillas and Steven T. Tobin3
School of Mathematics and Statistics, The University of Melbourne, Melbourne VIC 3010, Australia4
Mehmet Cil and Khalid Alshibli5
Department of Civil and Environmental Engineering, University of Tennessee, Knoxville, Tennessee 37996, USA6
Robert P. Behringer7
Department of Physics, Duke University, Durham, North Carolina 27708, USA8
(Received 5 February 2015; published xxxxxx)9
An established aspect of force transmission in quasistatic deformation of granular media is the existence of adual network of strongly versus weakly loaded particles. Despite significant interest, the regulation of strong andweak forces through the contact network remains poorly understood. We examine this aspect of force transmissionusing data on microstructural fabric from: (I) three-dimensional discrete element models of grain agglomeratesof bonded subspheres constructed from in situ synchrotron microtomography images of silica sand grains underunconfined compression and (II) two-dimensional assemblies of unbonded photoelastic circular disks submittedto biaxial compression under constant volume. We model force transmission as a network flow and solve themaximum flow–minimum cost (MFMC) problem, the solution to which yields a percolating subnetwork ofcontacts that transmits the “maximum flow” (i.e., the highest units of force) at “least cost” (i.e., the dissipatedenergy from such transmission). We find the MFMC describes a two-tier hierarchical architecture. At the locallevel, it encapsulates intraconnections between particles in individual force chains and in their conjoined 3-cycles,with the most common configuration having at least one force chain contact experiencing frustrated rotation.At the global level, the MFMC encapsulates interconnections between force chains. The MFMC can be used topredict most of the force chain particles without need for any information on contact forces, thereby suggestingthe network flow framework may have potential broad utility in the modeling of force transmission in unbondedand bonded granular media.
10
11
12
13
14
15
16
17
18
19
20
21
22
23
24
25
DOI: 10.1103/PhysRevE.00.002200 PACS number(s): 45.70.−n26
I. INTRODUCTION27
Not all contacts in a granular material are created equal.28
Previous studies have shown that forces in a deforming dense29
granular material are transmitted through a dual network of30
strong versus weak contacts [1,2]. The earliest demonstrations31
of this duality came from experiments that exploited bire-32
fringence patterns in particles made of photoelastic materials33
[3–5], a strategy that was used to deliver the first physical34
measurements of individual contact forces [2]. These studies35
of granular deformation in two-dimensions (2D) were pivotal36
in uncovering the underlying process of self-organization at37
the mesoscopic level. Self-organization is intimately tied to38
force transmission and is similarly dual in nature: Strong load-39
bearing columnar structures known as force chains continually40
form and persist to varying degrees depending on the lateral41
support provided by their weakly loaded neighbors [6–9].42
Force chain columns, aligned in the direction of the major43
(most compressive) principal stress, are axially loaded and44
prone to failure by buckling [10]. The evolution of these45
confined columnar structures directly governs mechanical46
function at the macroscale, specifically, the load-bearing47
capacity and failure of the material [7–16]. Indeed, regardless48
of failure mode, diffused versus localized, the collective failure49
of force chains by buckling precipitates and controls global50
failure [12,14,17]. Detailed knowledge of the evolution of51
force chains and their confining weak neighbors, in 2D and52
3D, is thus crucial for developing robust constitutive models53
that can adequately describe the deformation of many everyday 54
granular materials (e.g., sand, rocks, ceramics, powders, and 55
grains) [11,15,18–21]. Although significant attention has been 56
paid to force transmission in granular systems, little is known 57
about the regulation of internal forces that leads to this dual 58
pattern of heterogeneity, in particular, its dependence on the 59
strength of the contacts as well as the local and global 60
topology of the contact network of the material (e.g., Ref. 61
[11,21–26]). This gap in knowledge has become one of the 62
most pressing issues in the science of granular materials, no 63
doubt pushed to the forefront by the rapid advances in imaging 64
techniques [21,27–34]. With unprecedented access to the grain 65
scale and the ability to “see” inside a deforming granular 66
material, we are now witnessing prodigious and complex data 67
being generated on microstructural fabric (i.e., arrangement 68
of grains and pores) for a wide range of spatial scales (e.g., 69
Refs. [21,27–29]). This trend, coupled with the extant literature 70
on the influence of microstructural fabric on mechanical 71
response (e.g., Refs. [6,15,20,35]), provides clear impetus for 72
new concepts and analytical tools that can harness and leverage 73
the information embodied in these data sets and uncover 74
patterns which facilitate an understanding of how microscale 75
mechanisms (the cause) relate to macroscale performance (the 76
effect). Accordingly, the aim of this study is to develop a model 77
that can be used to establish a clear mechanistic link between 78
these two scales, with the aid of data on microstructural fabric. 79
Of specific interest is whether this model can identify the main 80
structural elements in force transmission and uncover details 81
1539-3755/2015/00(0)/002200(14) 002200-1 ©2015 American Physical Society

TORDESILLAS, TOBIN, CIL, ALSHIBLI, AND BEHRINGER PHYSICAL REVIEW E 00, 002200 (2015)
of intra- and interelement interactions, which may in turn yield82
insights into their functionalities.83
We adopt a strategy that has been inspired by developments84
in complex systems, where heterogeneities in transmission85
patterns have yielded vital clues to the interdependencies86
between structure and functionality. Consider, for example,87
how Google ranks web pages on the Internet for search.88
Web pages are interconnected by hyperlinks, each carrying89
different levels of traffic. Various network-based algorithms90
can rank the pages and/or links by the level of traffic they91
support, thereby measuring their relative importance in the92
system hierarchy [36]. Google’s PageRank [37] algorithm is93
one example. Now suppose that we can map out the grains in94
a deforming sand sample into networks, each representing the95
sample at each equilibrium stage of the loading history. The96
question then arises: Does the abstraction of individual grains97
and their contacts to a network facilitate the development of98
algorithms and models which operate in a similar manner to99
how PageRank finds important web pages, identifying particles100
in key mesoscale structural elements like force chains by101
searching a force network Internet? Here we formulate a102
general framework for developing models that can identify103
the major force pathways, including force chains, based on a104
network constructed from data on microstructural fabric (e.g.,105
contact topology).106
With respect to network representations of granular materi-107
als, past studies have demonstrated the efficacy of complex net-108
work techniques in unraveling the interdependencies between109
functionality and structure; see, for example, Refs. [18,24,38–110
42] and references cited therein. By far the most studied is111
the contact network where the nodes represent the grains and112
edges represent the interparticle contacts. As such, the study of113
force transmission through this contact network as a “network114
flow problem” is a natural next step. Broadly speaking, many115
real-world transmission phenomena, especially in industry,116
have been successfully modelled as a network flow problem117
involving a weighted, directed network [43–45]. In these118
settings, a given product or information is transported from119
a source node (origin) to a sink node (destination) through a120
network of intermediate nodes that are connected by edges121
(or arcs). Three prime examples in industry are transportation,122
communication, and water resources [43,44]. The commod-123
ity here may be cars, messages, and water, respectively;124
the corresponding nodes and edges may be intersections125
connected by streets, communication centers connected by126
communication channels, and water reservoirs or pumping127
stations connected by pipelines. Somewhat surprisingly, while128
network flow theory seems a natural framework for modeling129
force transmission in granular media, its application in130
granular rheology is largely unexplored. To the best of our131
knowledge, the first attempts at modeling force transmission132
patterns in granular media within a network flow framework133
are those in Refs. [46–49]. In Ref. [48], force transmission134
was analyzed as a network flow optimization problem using135
the concept of maximum flow–minimum cost (MFMC) in 2D136
discrete element (DEM) simulations. Guided by the lessons137
learned in Ref. [48], we now explore force transmission138
more deeply and for cohesionless and cohesive granular139
materials in 2D and 3D, based on measurable information140
on the local and global topology of the contact network141
and contact properties (e.g., bond strength). In particular, we 142
test the hypothesis that the particles that form the contacts 143
in the MFMC—namely those contacts in the percolating 144
network that transmit the “maximum flow” (i.e., the highest 145
units of force) at “minimum cost” (i.e., the least dissipated 146
energy from such transmission)—comprise those in the main 147
structural elements of force transmission. Primarily these 148
elements are the columnar force chains and their laterally 149
supporting neighbors in conjoined trusslike configurations 150
[38]. It follows from this hypothesis that the transmission 151
of force through the percolating MFMC must embody intra- 152
as well as interelement interactions, i.e., between particles 153
in individual force chains and their confining supports and 154
between different force chains, respectively. To this end, we 155
construct a network flow model of force transmission for 156
two types of granular systems: (I) crushable agglomerate 157
models of individual silica sand grains subjected to uniaxial 158
compression [28] and (II) assemblies of photoelastic circular 159
disks subjected to biaxial compression [50]. The data in (I) 160
pertain to the prefracture regime with the exception of one 161
data set which comprises measurements taken over many 162
stages of the test well into the postfracture regime. Like (I), 163
the data from the physical test in (II) include information on 164
contacts as well as contact forces, a necessary information 165
for establishing whether the MFMC can be employed to 166
predict force chains. The stark differences in the evolution 167
of the contact network of Systems (I) and (II) have important 168
implications for force transmission, above and beyond those 169
arising from loading conditions, material properties, and 170
dimensionality. In a deforming granular material, forces at 171
contacts undergo continual reconfigurations. Consequently, 172
the force chain membership (i.e., which particles belong to 173
force chains) is likewise subject to perpetual change. In (I), the 174
force reconfigurations prior to fracture ensue over an almost 175
invariant contact network, whereas those in (II) are coupled 176
with the evolution of the contact network. 177
The paper is organized as follows. The physical under- 178
pinnings of the proposed network flow model and the key 179
components of the MFMC are presented in Sec. II. In Sec. III, 180
we present the data sets examined. We formulate the network 181
flow model in Sec. IV before presenting our results in Sec. V. 182
A summary of key findings and future related research is given 183
in Sec. VI. 184
II. MAXIMUM FLOW–MINIMUM COST 185
To understand the motive and objective of this study, 186
consider the key components of the MFMC [43,44]. The 187
MFMC problem for transmission of a product through a 188
network is solved for a given set of capacity and cost assigned 189
to each edge. The former is an upper limit on the total number 190
of product units that can pass, while the latter is a cost 191
associated with the passage of one product unit, through the 192
edge. The transmission of force through the grain contacts 193
invariably involves energy dissipation that may be envisaged 194
as an associated cost. Accordingly, we prescribe (i) a force- 195
bearing capacity that represents the maximum force that can be 196
transmitted through the contact and (ii) a cost that reflects the 197
energy dissipated per unit of force transmitted at such contact. 198
In this context, the solution to the MFMC problem, referred to 199
002200-2

NETWORK FLOW MODEL OF FORCE TRANSMISSION IN . . . PHYSICAL REVIEW E 00, 002200 (2015)
hereafter as simply “MFMC,” consists of a percolating subset200
of contacts that transmit the maximum possible units of force201
with least energy dissipation. More specifically, we can think of202
the MFMC as a percolating subnetwork of major load-bearing203
pathways, which favor the most stable and shortest routes204
through the contact network in the given direction of flow205
(e.g., the most compressive principal stress). Clearly, the more206
stable the contact, the higher the force that it can support and207
transmit. As shown in past studies, notably that of Wolf et al.208
[51], energy dissipation is least along these major pathways.209
Sliding friction, the major contributor to energy dissipation,210
is essentially confined to the complementary weak contact211
network. While energy dissipation may arise from rolling212
friction, this is much less for systems comprising idealized213
shaped particles such as those examined here. Moreover,214
energy dissipation through rolling friction generally occurs215
in a collapsing (buckling) force chain, when member particles216
have weakened and ceased to be a major load bearer. Stability217
is not the only factor governing MFMC. To minimize cost,218
more direct or shortest routes through the contact network219
are also important, which explains why quasilinear structural220
building blocks of force chains are likely to be part of MFMC221
when considering force transmission in the direction of the222
most compressive principal stress.223
The intended application of MFMC is also crucial in224
the formulation of the capacity and cost functions. For the225
purposes of identifying the major load-bearing pathways in a226
system, what matters are the relative values and not the actual227
values of the capacities and costs for the constituent contacts.228
Hence, these functions can be based on qualitative proxy229
measures rather than quantitative measures of force-bearing230
capacity and energy dissipation. If, on the other hand, the intent231
is to use MFMC to establish the actual values of the forces232
transmitted through the different contacts, then the capacity233
and cost functions must accurately quantify the force-bearing234
capacity and energy dissipation at the contacts. This study is235
focused on the former; the latter application is outside the236
scope of the present analysis.237
In light of the factors discussed above, we can now build238
on Ref. [48] and the available information on microstructural239
fabric from high-resolution measurements. In Ref. [48], a240
uniform capacity function was used, coupled with a ternary241
cost function to represent the different modes of contact (0 for242
an elastic stick contact, 1 for plastic sliding or plastic rolling,243
and 2 for a plastic contact that is undergoing both sliding244
and rolling). In that case, the MFMC pathways represent245
percolating shortest routes through the network—in favor of246
the stable elastic contacts as opposed to the unstable plastic247
contacts where relative sliding and/or rolling occurs. While the248
results proved promising, the study in Ref. [48] also prompted249
a need to explore capacity and cost functions that more closely250
reflect reality from two perspectives: (i) the contact strength251
governed by resistances to relative motion at the contacts252
and (ii) both the local as well as global topology of the253
contact network. The capacity function depends on factors254
that govern the contact strength (e.g., bond strength, contact255
area, friction, etc.) For bonded granular systems well into the256
fracture regime, we expect the strength of the bonded contacts257
and the frictional properties of the unbonded contacts to both258
contribute to the capacity function. On the other hand, the259
cost function that describes the energy dissipation associated 260
with the transmission of force may depend on the local contact 261
topology. The dependence of energy dissipation on the local 262
contact topology is best understood from the perspective of 263
structural stability. Recent studies have shown that certain local 264
contact topologies, in particular, the 3-cycles (i.e., three grains 265
arranged in mutual contact), effectively act like triangular 266
trusses with respect to force chain columns. The 3-cycles 267
brace the force chain columns both to increase rigidity where 268
needed (i.e., by propping-up column misalignments) and to 269
frustrate relative grain rotations that constitute the precursory 270
mechanism for force chain failure by buckling [24,38,39]. 271
As shown in recent simulations and physical experiments, 272
the higher the number of 3-cycles that constituent contacts 273
are part of, the more stable are these contacts [38]—and in 274
turn the overall material [9,38–41]. We therefore expect the 275
dissipated energy per unit of force transmitted to be less for a 276
stable-overconstrained contact when compared with that for an 277
unstable-underconstrained contact. This is because significant 278
relative motions (i.e., sliding and rolling) and contact breakage 279
can rapidly occur in the latter, due to lack of local support 280
and rolling resistance at the contact. Corroborative evidence, 281
recently uncovered by tracking the local contact cycle topology 282
of individual grains throughout loading history, showed a 283
strong correlation between the change in the contact cycle 284
topology and measures of the fluctuating kinetic energy and 285
energy dissipation at both the local and global levels [52]. That 286
microstructural (here contact) information alone can be used 287
as a proxy for energy dissipation bears merit, since contacts 288
can now be identified and tracked throughout loading history, 289
even for sand using synchrotron microcomputed tomography 290
[27,28]. Indeed, structural proxy measures for force and energy 291
dissipation are helpful in advancing the state of knowledge 292
on the transmission of force in 3D systems since contact 293
forces have proven to be difficult to reliably capture, especially 294
over many stages of a test under combined compression and 295
shear [27,28,32]. Multiple advanced experimental techniques 296
such as confocal microscopy [30], micro-CT scanning [31,34], 297
refractive index-matching tomography [21], and neutron imag- 298
ing [33] have been applied to overcome this challenge. While 299
promising, these approaches are limited in the systems they 300
can be applied to. For example, index matching only can be 301
used on materials with very specific optical properties, and 302
neutron imaging is too computationally intensive to be used 303
with systems larger than a few hundred grains. 304
III. DATA 305
We examine two systems, (I) and (II), both of which have 306
been reported in the literature [28,50]. For completeness, 307
we summarize the salient aspects of these systems below, 308
providing more information for (I) since the evolution of 309
the microstructural fabric of these agglomerates has only 310
been partially studied [28], whereas that of (II) has been 311
comprehensively characterized in Refs. [9,50]. 312
A. System (I) 313
System (I) consists of crushable agglomerate models of 314
individual silica sand grains subjected to uniaxial compression 315
002200-3

TORDESILLAS, TOBIN, CIL, ALSHIBLI, AND BEHRINGER PHYSICAL REVIEW E 00, 002200 (2015)
TABLE I. System (I). The four agglomerates A–D vary in size,bond strength, and macroscopic response as measured by the peakload (i.e., the highest load experienced before fracture). No obvioustrends in peak load are observed: Both A and D are weaker than B andC despite having lesser and greater numbers of particles, respectively,and B and C have a similar peak load but very different bond strengths.
Number of Bond strength PeakAgglomerate particles (MPa) load (N)
A 263 500 54B 358 510 108C 355 402 110D 501 454 87
[28]. The DEM simulations, performed using PFC3D [53],316
were developed to faithfully represent experimental measure-317
ments using synchrotron micro-tomography to acquire in situ318
three-dimensional (3D) images of silica sand grains. Each319
grain was represented by a crushable agglomerate composed320
of small spherical particles whose radii vary between Rmin and321
1.2Rmin, where Rmin = 0.035 mm. The particles are linked by322
parallel bonds, in accordance with the bonded particle model323
(BMP) proposed by Potyondy and Cundall [53]. The parallel324
bond acts over a circular cross section on the contact plane of325
two bonded particles. This bond can resist force and moment326
and hold two contacting particles together up to a predefined327
limit referred to as the bond strength. Each agglomerate is328
assigned a bond strength, which is chosen randomly from329
a distribution determined from experimental observations of330
silica sand grains. This distribution has a mean strength of331
475 MPa and standard deviation of 150 MPa. The same332
values for the bond strength were used for both tensile and333
shear stresses. Particles overlap at contact points (soft-contact334
approach). The region of overlap is negligibly small compared335
to the particle dimensions and is proportional to the contact336
force. The interaction of particles at contacts is governed by337
a linear contact spring-slider model which permits sliding338
behavior. If a parallel bond is added to the contact, the linear339
contact model and parallel bond act in parallel. If the tensile340
(normal) or shear stress within the bond material exceeds341
its assigned limit, the parallel bond breaks and is removed342
from the system. The linear contact model becomes active343
if the two particles are still in contact. Each agglomerate is344
compressed between two rigid platens at a constant velocity345
and the evolution of the properties of particle contacts are346
tracked throughout the loading history. To achieve the desired347
match to the mechanical and physical behavior of silica sand348
grains, the minimum diameter of spherical subparticles, the349
bond strength between spherical subparticles, and the overall350
shape and fabric of the agglomerates were altered in 40351
different DEM simulations. We study four agglomerates from352
these simulations. Although full details are in Cil and Alshibli353
[28], we summarize their properties and macroscopic response354
in Table I and discuss briefly below their internal fabric and355
force distributions.356
Data for Systems A, B, and D cover the prefracture regime357
only; data for System C extend to the postfracture regime.358
Differences in the internal contact force regulation across359
the agglomerates manifest in the mechanical response at the 360
macroscopic level: see peak load values in Table I. There 361
are two main factors behind these differences. First, each 362
agglomerate has its own unique initial microstructural fabric 363
as evident in the distributions of internal connectivity [Fig. 1 364
(left)], in addition to the number of constituent particles. This 365
fabric was achieved by generating at random nonuniformly 366
sized spherical particles inside an encapsulating spherical 367
shell and then subjecting this assembly to a low isotropic 368
compression by uniform expansion of constituent particles 369
(radii increased uniformly). Second, complex interactions 370
occur between each agglomerate and the loading platens. In the 371
initial stages of compression, the agglomerate may rotate and 372
translate to attain a more stable configuration (e.g., achieved 373
at around stage 150 for agglomerate A) based on agglomerate 374
morphology and orientation. The resultant contact region may 375
also effect the subsequent deformation: in some cases, a single 376
subsphere may be in contact with the loading platen while in 377
others multiple subspheres may be involved. 378
Despite the quantitative differences noted above, there 379
are commonalities and qualitatively similar trends in the 380
agglomerates’ response to crushing. In all cases, the percentage 381
of particles in force chains undergo small fluctuations about 382
an essentially constant value [i.e., average values are 13% 383
(A), 16% (B), 14% (C), and 18% (D)], though the size of 384
these fluctuations increases during breakage events [Fig. 1 385
(top right)]. No correlation between the contact forces and 386
the distribution of the contacts was observed. In all the 387
agglomerates, the major force pathways are generally aligned 388
in the direction of compression as shown in Figs. 1 (bottom 389
right) and 2(d). In the Lambert projection in Fig. 1 (left), 390
these major force pathways would be situated at the center 391
and in the closely spaced circles close to the periphery: 392
that part of the grain agglomerate in contact with the top 393
and bottom platens, respectively. From Fig. 1 (left), we see 394
these are not consistently coincident with the regions of high 395
connectivity (red zones). Finally, despite the continual force 396
reconfigurations inside each agglomerate during crushing, as 397
first reported in Ref. [28], the average number of contacts per 398
particle in force chains is essentially invariant prior to fracture: 399
We observe an average of six (five) contacts per particle in 400
force chains (non force chains) across all agglomerates A–D. 401
B. System (II) 402
System (II) is from a 2D experiment involving an assembly 403
of unbonded photoelastic disks subjected to biaxial shear 404
strain [13,50]. Briefly, collections of roughly 1500 bidisperse 405
particles, here circular disks, rested on a smooth horizontal 406
Plexiglas sheet. A rectangular structure bounded the particles 407
horizontally, and the spacing between opposing pairs of walls 408
in the boundary were driven to produce pure shear, here 409
compression in one direction applied at constant velocity, 410
expansion in the other, all at fixed area. The procedure that was 411
first reported in Ref. [2] was used to determine the contacts 412
among the particles, and the vector values of the forces at 413
contacts. This allowed details of the contact and force networks 414
and the evolution of these networks to be tracked under shear 415
strain. This experiment is discussed in great detail in Ref. [50]. 416
The evolution of microstructure for this system with respect to 417
002200-4

NETWORK FLOW MODEL OF FORCE TRANSMISSION IN . . . PHYSICAL REVIEW E 00, 002200 (2015)
FIG. 1. (Color online) System (I): The microstructural fabric of agglomerates A–D is shown by their initial interparticle contact densitydistribution (left). Each image shows the full surface of a unit sphere in the Lambert projection [54]. Thin white radial lines from the centermark equal 30◦ increments of “longitude” from 0◦ to 360◦. White concentric circles mark 30◦ increments of “latitude” from 0◦ (top of theagglomerate) to 180◦ (bottom of the agglomerate); the thick white circle shows the “equator” at 90◦ latitude, and circles become closer towardsthe bottom of the sphere. System (I)A: Evolution of the compressive load and the percentage of particles in force chains (FC) (top right); polarplots of normalized compressive contact forces (bottom right; color bar used is the same as that for contact densities on left). Similar evolutiontrends apply to B–D.
Contact network
Contact forces
(a) (b) (c)
(d) (e)
Direction of flow
FIG. 2. (Color online) The key components of the proposed analysis of force transmission at each stage of the crushing test for a sandgrain prior to fracture. (a) The sand grain and (b) its associated agglomerate model comprising bonded subspheres. (c) The contact networkand (d) the associated contact force distribution. In (d), the contacts transmitting normal contact forces greater than (less than or equal to) theglobal average are shown in red (yellow) [in black and white, dark grey of varying thickness and light grey of constant thickness respectively];line thickness represents the magnitude of the normal contact force transmitted. This concentration of major force pathways along the centralaxis of the grain agglomerate, in alignment with the direction of compression, is representative of force transmission patterns across all theagglomerate models. (e) The MFMC flow network model with the line thickness representing the flow transmitted at the contacts.
002200-5
TORDESILLAS, TOBIN, CIL, ALSHIBLI, AND BEHRINGER PHYSICAL REVIEW E 00, 002200 (2015)
the structural building blocks of force chains and supporting n418
cycles has been fully characterized in Ref. [9].419
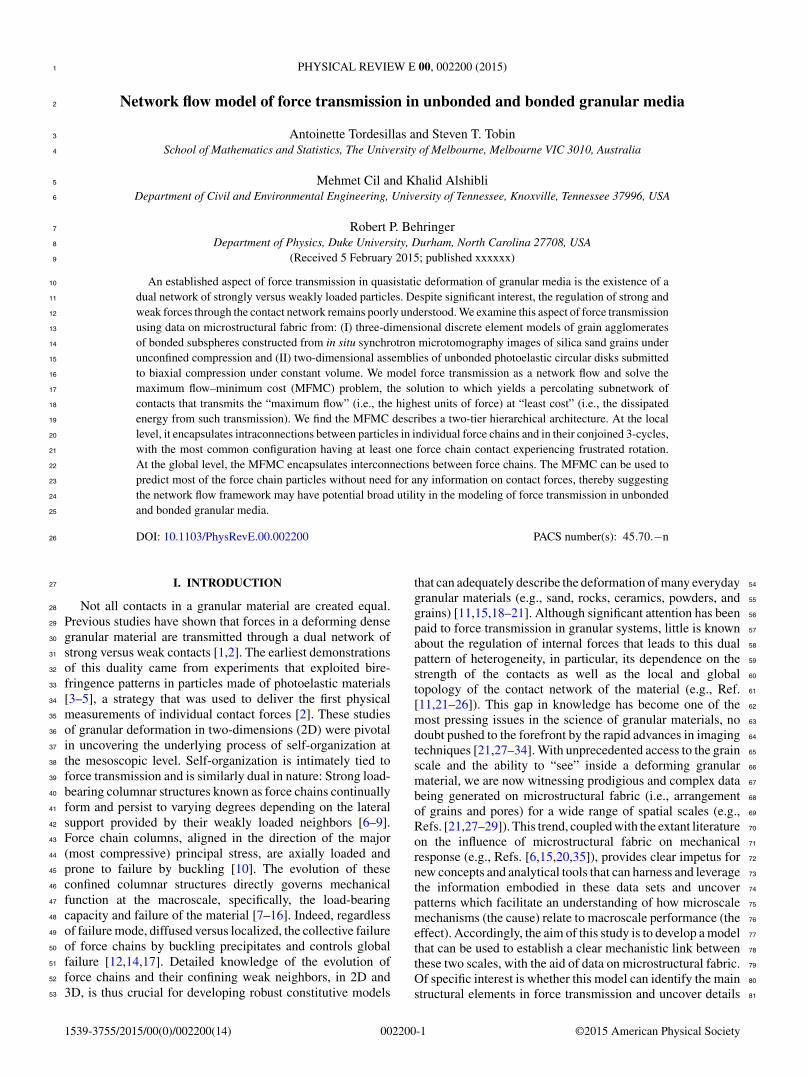
IV. THE NETWORK FLOW MODEL420
We model force transmission in a granular material which is421
compressed in the vertical direction between two parallel walls422
(top and bottom loading platens) at a constant velocity. Figure 2423
provides a depiction of the different parts of this analysis in a424
crushing test of a silica sand grain. We formulate our model as a425
network flow optimization problem [43,44]. This involves the426
construction of a flow network N = (s,t,V ,E,U,C), where427
(i) s and t are two artificial nodes called the source and428
sink, respectively, such that flow can be sent from the source429
node s to the sink node t . These nodes can be used to represent430
the top and bottom loading platens through which the material431
is compressed. By virtue of Newton’s third law, the flow of432
force along each edge is symmetric (i.e., equal and opposite433
forces act at each contact): This means that the flow from the434
source to the sink is the same regardless of which loading435
platen acts as the source versus the sink.436
(ii) V is the set of intermediate nodes that represent the437
particles.438
(iii) E is the set of edges, connecting nodes in V , that439
represent the contacts between particles.440
(iv) U = {u(i,j ) : (i,j ) ∈ E} is the set of capacities of the441
edges. For each edge (i,j ) ∈ E, the element u(i,j ) represents442
the maximum amount of flow (force) that can be transmitted443
through the edge (i,j ).444
(v) C = {c(i,j ) : (i,j ) ∈ E} is the set of costs associated445
with the edges of the networkN . For each edge (i,j ) ∈ E,c(i,j )446
represents the cost of sending one unit of flow through the edge447
(i,j ).448
The problem of transmitting the maximum units of force449
with minimum dissipated energy through the material can be450
formulated as the MFMC problem for the network N . We451
solve this problem in two steps:452
(a) find the maximum flow |f |∗ through the flow network453
from source s to sink t using the Ford-Fulkerson algorithm454
[55] and455
(b) distribute the maximum flow |f |∗ through the network456
N such that the total cost is minimized subject to the following457
constraints on the flow f(i,j ):458
(i) Capacity constraint: f(i,j ) ! u(i,j ),∀(i,j ) ∈ E, where459
the edge weight w(i,j ) is set equal to the capacity, w(i,j ) =460
u(i,j ). The flow f(i,j ) cannot exceed the edge capacity u(i,j ).461
(ii) Conservation of flow:∑
m∈V f(m,p) =462 ∑n∈V f(p,n),p = {s,t}. The net flow entering a node463
is the same as that exiting that node, except for the source464
or sink.465
(iii) The total flow leaving the source node s must equal466
that entering the sink node t :∑
m∈V f(s,m) =∑
m∈V f(m,t).467
The solution to the MFMC problem, coined earlier as468
MFMC, is a subset of edges in N [56]. For the systems469
studied here, the MFMC represents a percolating subnetwork470
in the global contact network of the material: see Fig. 2(e). We471
illustrate the operation of the MFMC algorithm with the aid472
of simple toy model in Fig. 3. It is useful to note the following473
three special cases of the MFMC problem. First, if all costs474
are set to zero, the MFMC problem is equivalent to finding475
FIG. 3. (Color online) A toy model, involving a seven-node flownetwork, to explain the essence of the maximum flow–minimum cost(MFMC) algorithm. Node 1(7) is the source (sink). Next to each edge(i,j ) is [f(i,j )] (u(i,j ),c(i,j )). Thick lines next to a node encode the edgedirection, i.e., the “end” of the flow [e.g., nodes 3 and 6 is connectedby edge (3,6) transmitting flow that starts at 3 and ends at 6, whereasnodes 4 and 5 have two edges (4,5) and (5,4)]. Now consider eachpath from source 1 to sink 7. The right-hand path (1-3, 3-6, 6-7) is thesimplest. Of the edges in this path, 3-6 has the lowest capacity of 2(3-6 is the bottleneck). Therefore, a maximum 2 units of flow can besent along this path, for a total cost of 2 × (1 + 2 + 1) = 8 (i.e., thetotal flow multiplied by the sum of edge costs). The left-hand pathis more complex. Again, we have a bottleneck at 1-2, allowing only1 unit of flow to pass from source to sink at a cost of 2. From node2, multiple routes are possible: (2-4, 4-7), (2-5, 5-7), (2-4, 4-5, 5-7),and (2-5, 5-4, 4-7). The costs of these are 3, 4, 4, and 7, respectively.With (2-4, 4-7) having the lowest cost, the left-hand path is thus (1-2,2-4, 4-7). We now have the complete MFMC pathway, made up ofthe edges (1-3, 3-6, 6-7, 1-2, 2-4, 4-7). This MFMC pathway carries3 units of flow for a total cost of 13.
the maximum flow through the network. Second, if |f |∗ is 476
a solution of the maximum flow with capacities u(i,j ), then 477
γ |f |∗ is a solution with new capacities γ u(i,j ), where γ > 0 is 478
a constant; the solution to the maximum flow problem depends 479
on the relative values of the capacities, not the actual values. 480
Third, the solution to the MFMC problem with costs c(i,j ) is 481
the same as that with costs γ c(i,j ), where γ > 0 is a given 482
constant (the total cost will be increased by a factor γ , without 483
affecting the flow distribution). 484
We construct a total of four MFMC models, each involving 485
a particular pair of capacity and cost functions. We chose 486
these functions to be as simple as possible, while embodying 487
the most critical factors that govern force transmission at the 488
local or particle level (i.e., local contact topology and bond 489
strengths) in addition to the global contact topology of the 490
material that is embodied in the flow network. Of key interest in 491
this study are (i) the force chain capture rate of MFMC for each 492
model, i.e., the fraction of particles in columnar force chains 493
that form the MFMC contact network; (ii) the composition 494
of the MFMC in terms of the strong versus weak contacts; 495
and (iii) the extent to which the weak contacts in the MFMC 496
provide direct support to force chains and their associated 497
configurations relative to the force chains they support. In 498
what follows, we introduce the capacity and cost functions 499
employed in the four MFMC models. 500
002200-6

NETWORK FLOW MODEL OF FORCE TRANSMISSION IN . . . PHYSICAL REVIEW E 00, 002200 (2015)
A. Capacity functions501
1. Uniform capacity function502
For a baseline model, we prescribe a uniform capacity for503
all edges (i,j ):504
u(i,j ) "{
∞, if i = s or j = t
1, otherwise.(1)
2. Capacity function based on breakage criterion505
Here we propose a capacity that is based on the contact506
model used in the agglomerate models [28]. These models507
adopted the bonded particle model (BPM) of Potyondy and508
Cundall [53], in which the contacts are joined by a bond that509
can sustain tensile and shear stresses up to prescribed bond510
strengths, σ(i,j ) and τ(i,j ), respectively. These strengths were511
set equal to a single bond strength S(i,j ) in Ref. [28]: Recall512
also Table I. Bonds carry both force and moment (F and513
M , respectively), which can be resolved into normal and shear514
components with respect to the contact plane (F n,F s,Mn,Ms).515
The maximum tensile and shear stresses acting on the bond516
are given by517
¯σ max = F n
A+ |Ms |R
I, (2)
¯τmax = |F s |A
+ |Mn|RJ
, (3)
where I and J are the moment of inertia and polar moment of518
inertia, respectively. The bond area is A = πR2, where R is519
the bond radius given by520
R = λ min(Ri,Rj ); (4)
here λ is a constant multiplier and min(Ri,Rj ) is the smaller521
of the two radii of the contacting particles i and j , Ri and Rj .522
Recall from Sec. III that the particles’ radii lie in the range523
Rmin–1.2Rmin, where Rmin = 0.035 mm. If either the normal524
or shear stress exceeds the bond strength S(i,j ), then the bond525
is considered broken. Neglecting the moment term in both526
stresses (which are much lower than the force terms in these527
agglomerates) leads to a critical threshold force F(i,j ) for each528
bond, S(i,j ) = F(i,j )
A. This leads to the following load-bearing529
capacity of a bonded contact between particles i and j :530
u(i,j ) "{
∞, if i = s or j = t
F(i,j ) = AS(i,j ) = π S(i,j ) R2, otherwise.
(5)
B. Cost functions531
1. Uniform cost function532
This is the simplest cost function in which all edges are533
assigned identical costs:534
c(i,j ) = 1. (6)
2. Cost determined by the local 3-cycle topology535
A more physically relevant cost function is one governed536
by the 3-cycle membership of the contact (i.e., the number of537
3-cycles that include the edge). Possible values are 0, 1, or 2: 538
c(i,j ) "
⎧⎪⎨
⎪⎩
0, if the edge is a member of 2 or more 3-cycles
1, if the edge is a member of one 3-cycle
2, if the edge is not a member of any 3-cycles.(7)
3. Cost determined by the local 4-cycle topology 539
Analogous to Eq. (7), we can similarly propose a cost 540
function that is based on the 4-cycle membership of the contact: 541
c(i,j ) "
⎧⎪⎨
⎪⎩
0, if the edge is a member of 2 or more 4-cycles
1, if the edge is a member of one 4-cycle
2, if the edge is not a member of any 4-cycles.(8)
Since 4-cycles do not provide the same level of resistance 542
to force chains as 3-cycles (see, for example, Ref. [38]), we 543
expect the capture rate of MFMC for this cost function to be 544
less than that from Eq. (7) for the same capacity function. 545
4. Cost determined by the average clustering coefficients of the 546
particles in contact 547
The cost function can be expressed in terms of the network 548
node property known as clustering coefficient: 549
c(i,j ) " 1 − 12 (Ci + Cj ); (9)
here Ci is the clustering coefficient of node i, defined as the 550
ratio of the number of 3-cycles that the node is part of, Ti , to 551
the maximum number of 3-cycles that the node could be part 552
of given its degree k (i.e., number of edges) [44], 553
Ci = Ti
ki(ki − 1). (10)
Thus higher edge clustering values are assigned lower costs. 554
We expect the capture rate of MFMC to be comparable to that 555
obtained from 7 for the same capacity function. 556
From the cost and capacity functions described above, 557
we construct four different network flow models. These are 558
summarized in Table II. Model 1 uses a uniform capacity 559
and cost function, the most basic model possible. Models 560
2–4 all use the breakage criterion capacity function for the 561
unbonded system (I), paired with the remaining cost functions 562
as described above. The input information to each network 563
flow model is as follows: the bond strengths and the particle 564
contacts for System (I) and the particle contacts for System (II). 565
To assess the predictive capacity of each model, the following 566
data are needed: (i) contact forces to identify the contacts 567
TABLE II. System (I): All four models are implemented inagglomerates A–D. System (II): A hybrid of model 1 and model2 is adopted, i.e., uniform capacity and a cost function determinedfrom 3-cycle membership.
Model Capacity Cost
1 Uniform Uniform2 Breakage criterion 3-cycle topology3 Breakage criterion 4-cycle topology4 Breakage criterion Clustering coefficient
002200-7
TORDESILLAS, TOBIN, CIL, ALSHIBLI, AND BEHRINGER PHYSICAL REVIEW E 00, 002200 (2015)
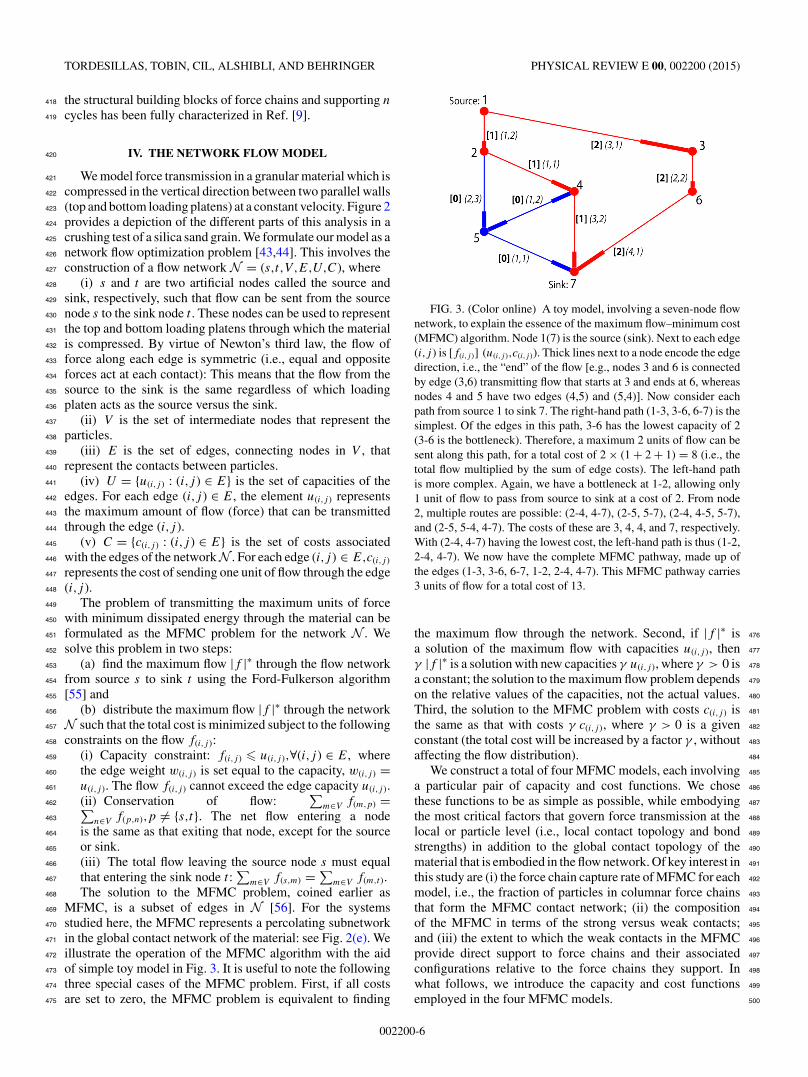
FIG. 4. (Color online) System (I): The relative performances of models 1–4 based on their capture rate. Model 2 (capacity: breakagecriterion; cost: 3-cycle membership) performs the best of all four models, followed by model 4 (capacity: breakage criterion; cost: clustering).
belonging to the strong versus weak contact network and (ii)568
position and contacts of each member particle along with the569
contact forces to identify those particles in force chains, in570
accordance with the method in Refs. [57,58].571
V. RESULTS572
We present here the performance of the candidate MFMC573
models 1–4 for all four agglomerates A–D in System (I)574
before testing the best performing cost function together with575
a uniform capacity in System (II). Keeping in mind these576
network flow models do not require any information on contact577
forces for input, we assess performance based on each model’s578
capture rate (i.e., the fraction of particles in force chains that579
form the MFMC contact network), where the force chains580
are determined using the method in Refs. [57,58]. Of interest581
also are the functional roles of the rest of the MFMC contacts582
that are not part of force chains. We will determine these by583
examining the composition of the MFMC with respect to the584
strong versus weak contacts. We note here that not all strong585
contacts are in force chains; the latter is a more stringent586
category requiring not only the transmission of relatively high587
contact forces that amount to an above average particle load588
vector but also a geometric alignment of these particle load589
vectors, consistent with the transmission of force along a590
particle column [57,58].591
A. MFMC performance before grain fracture for System (I)592
Before fracture, there is little gain or loss of grain contacts593
in the agglomerates. As such, the MFMC problem is solved on594
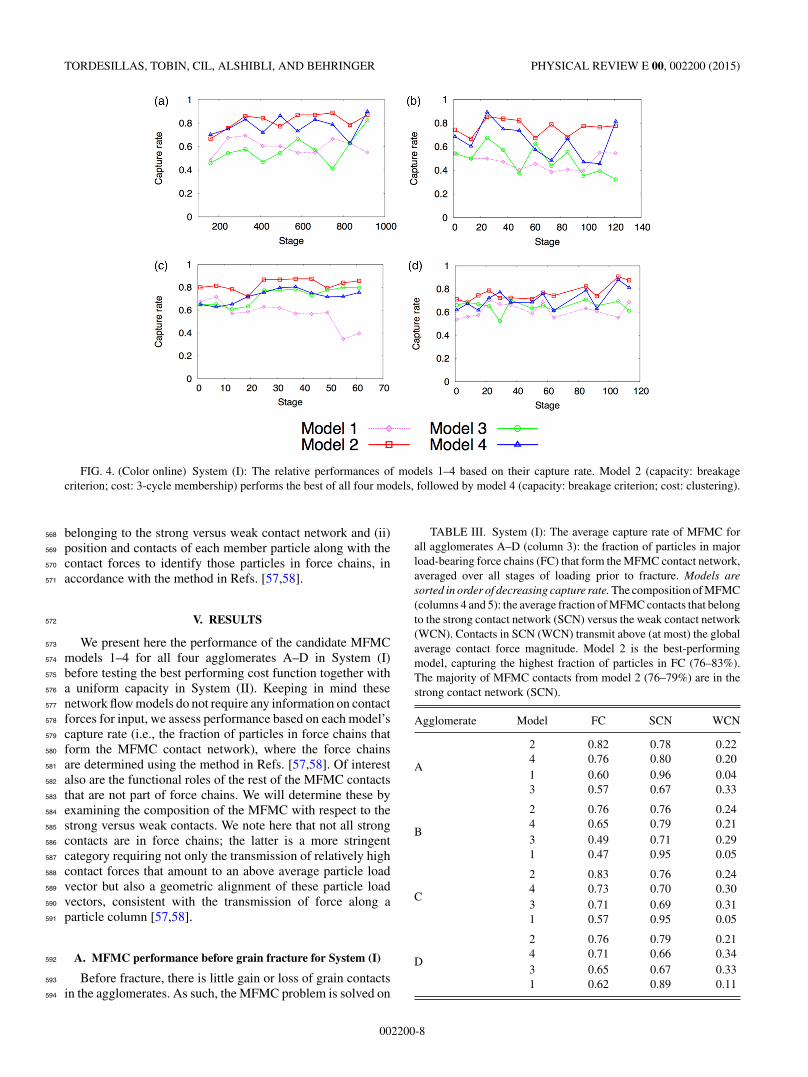
TABLE III. System (I): The average capture rate of MFMC forall agglomerates A–D (column 3): the fraction of particles in majorload-bearing force chains (FC) that form the MFMC contact network,averaged over all stages of loading prior to fracture. Models aresorted in order of decreasing capture rate. The composition of MFMC(columns 4 and 5): the average fraction of MFMC contacts that belongto the strong contact network (SCN) versus the weak contact network(WCN). Contacts in SCN (WCN) transmit above (at most) the globalaverage contact force magnitude. Model 2 is the best-performingmodel, capturing the highest fraction of particles in FC (76–83%).The majority of MFMC contacts from model 2 (76–79%) are in thestrong contact network (SCN).
Agglomerate Model FC SCN WCN
2 0.82 0.78 0.224 0.76 0.80 0.20
A1 0.60 0.96 0.043 0.57 0.67 0.33
2 0.76 0.76 0.244 0.65 0.79 0.21
B3 0.49 0.71 0.291 0.47 0.95 0.05
2 0.83 0.76 0.244 0.73 0.70 0.30
C3 0.71 0.69 0.311 0.57 0.95 0.05
2 0.76 0.79 0.214 0.71 0.66 0.34
D3 0.65 0.67 0.331 0.62 0.89 0.11
002200-8
NETWORK FLOW MODEL OF FORCE TRANSMISSION IN . . . PHYSICAL REVIEW E 00, 002200 (2015)
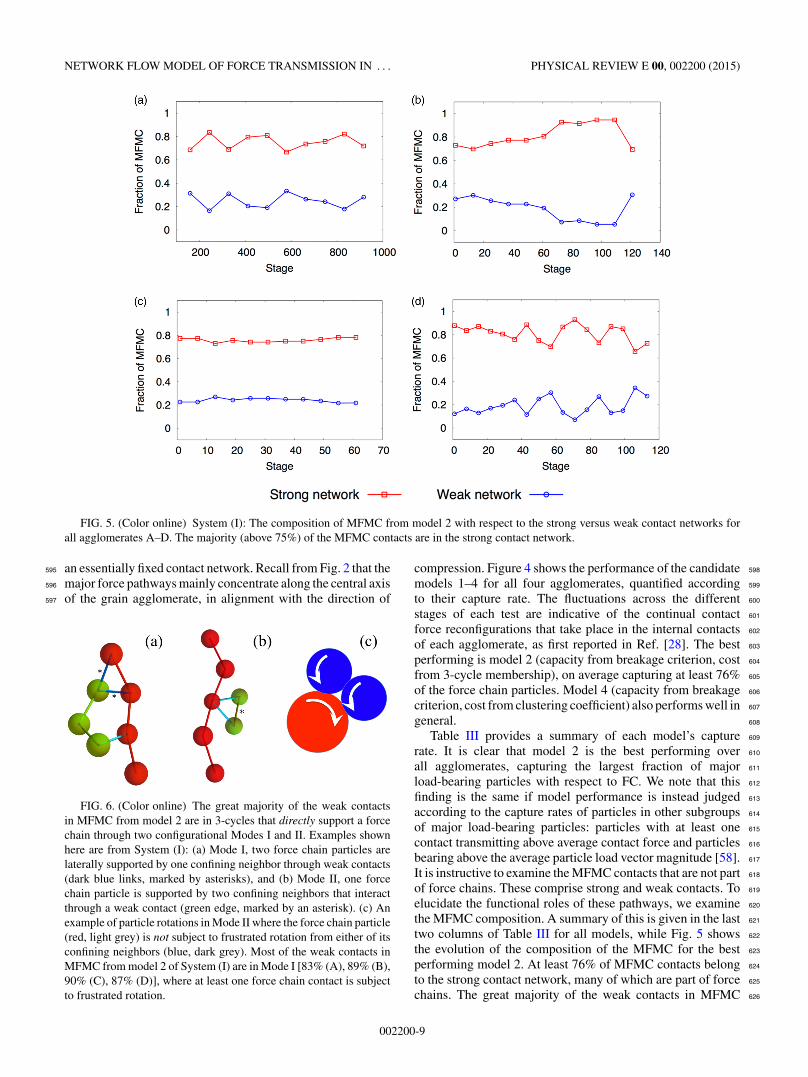
FIG. 5. (Color online) System (I): The composition of MFMC from model 2 with respect to the strong versus weak contact networks forall agglomerates A–D. The majority (above 75%) of the MFMC contacts are in the strong contact network.
an essentially fixed contact network. Recall from Fig. 2 that the595
major force pathways mainly concentrate along the central axis596
of the grain agglomerate, in alignment with the direction of597
FIG. 6. (Color online) The great majority of the weak contactsin MFMC from model 2 are in 3-cycles that directly support a forcechain through two configurational Modes I and II. Examples shownhere are from System (I): (a) Mode I, two force chain particles arelaterally supported by one confining neighbor through weak contacts(dark blue links, marked by asterisks), and (b) Mode II, one forcechain particle is supported by two confining neighbors that interactthrough a weak contact (green edge, marked by an asterisk). (c) Anexample of particle rotations in Mode II where the force chain particle(red, light grey) is not subject to frustrated rotation from either of itsconfining neighbors (blue, dark grey). Most of the weak contacts inMFMC from model 2 of System (I) are in Mode I [83% (A), 89% (B),90% (C), 87% (D)], where at least one force chain contact is subjectto frustrated rotation.
compression. Figure 4 shows the performance of the candidate 598
models 1–4 for all four agglomerates, quantified according 599
to their capture rate. The fluctuations across the different 600
stages of each test are indicative of the continual contact 601
force reconfigurations that take place in the internal contacts 602
of each agglomerate, as first reported in Ref. [28]. The best 603
performing is model 2 (capacity from breakage criterion, cost 604
from 3-cycle membership), on average capturing at least 76% 605
of the force chain particles. Model 4 (capacity from breakage 606
criterion, cost from clustering coefficient) also performs well in 607
general. 608
Table III provides a summary of each model’s capture 609
rate. It is clear that model 2 is the best performing over 610
all agglomerates, capturing the largest fraction of major 611
load-bearing particles with respect to FC. We note that this 612
finding is the same if model performance is instead judged 613
according to the capture rates of particles in other subgroups 614
of major load-bearing particles: particles with at least one 615
contact transmitting above average contact force and particles 616
bearing above the average particle load vector magnitude [58]. 617
It is instructive to examine the MFMC contacts that are not part 618
of force chains. These comprise strong and weak contacts. To 619
elucidate the functional roles of these pathways, we examine 620
the MFMC composition. A summary of this is given in the last 621
two columns of Table III for all models, while Fig. 5 shows 622
the evolution of the composition of the MFMC for the best 623
performing model 2. At least 76% of MFMC contacts belong 624
to the strong contact network, many of which are part of force 625
chains. The great majority of the weak contacts in MFMC 626
002200-9

TORDESILLAS, TOBIN, CIL, ALSHIBLI, AND BEHRINGER PHYSICAL REVIEW E 00, 002200 (2015)
FIG. 7. (Color online) System (I). The evolution of the configurational mode in which weak MFMC contacts from model 2 belong for allagglomerates A–D. Essentially all weak MFMC contacts are in 3-cycles directly supporting a force chain particle. The great majority are inMode I.
are in conjoined 3-cycles, i.e., those that directly support627
force chains (Fig. 6). Although to some extent this is to be628
expected given the cost function, there is a clear preference in629
the topology of these supports: most are in configurational630
Mode I (Figs. 6–7), consistent with an earlier finding on631
the preferred configuration of weak contacts around force632
chains in a cohesionless assembly of polyellipsoid particles633
under triaxial compression [17]. In Mode I [Fig. 6(a)], both634
frustration of rotation and lateral support are provided to two635
force chain particles by one confining neighbor. In this mode,636
at least one of the contacts with the force chain will be subject637
to frustrated rotation, regardless of the direction of rotations638
among member particles of the 3-cycle. In Mode II, it is639
possible for frustrated rotation to operate only at the contact640
between the confining neighbors, as depicted in Fig. 6(c). Thus,641
the MFMC consists mainly of the contacts in force chains and642
their supporting conjoined 3-cycles.643
B. MFMC performance after grain fracture for System (I)644
As previously mentioned, we focus our analysis of System645
(I) on force transmission in the prefracture regime, since the646
data for these agglomerates were confined to this regime647
[28], except for one agglomerate (System C) for which648
the simulation was undertaken well into the postfracture649
regime. Specifically, loading continued for System C after650
the agglomerate had split into two “daughter” fragments,651
fracturing parallel to the major and most compressive principal 652
stress, as shown in the inset of Fig. 8. For completeness, we 653
capitalize on this opportunity and test the capture rate of the 654
best performing MFMC model 2 with respect to force chains 655
in the postfracture regime. 656
After fracture, the contact network is no longer a single 657
connected graph: Instead, multiple smaller contact networks 658
arise corresponding to the daughter fragments. In this case, the 659
MFMC problem is solved for the contact network of each of 660
these daughter fragments. While the MFMC performs well on 661
intact agglomerate systems, applying it to larger collections of 662
agglomerates would require robust performance in the pres- 663
ence of large frictional rearrangements among fragments and 664
continuing contact breakages among particles. From Fig. 8, it 665
can be seen that the MFMC continues to capture the majority 666
of force chain particles past the point of fracture, albeit the 667
capture rate is smaller. This is to be expected as the capacity 668
and cost functions that were used here were the same as those 669
prior to the first fracture event, i.e., the capacity function 670
does not distinguish between unbonded-frictional contacts 671
versus bonded contacts. It may be possible to further improve 672
the MFMC algorithm and maintain the high capture rates 673
postfracture through improved capacity and cost functions that 674
account for the progressive damage to the grain agglomerate 675
(i.e., to explicitly handle new frictional unbonded contacts that 676
come into existence as the agglomerate breaks up). 677
002200-10

NETWORK FLOW MODEL OF FORCE TRANSMISSION IN . . . PHYSICAL REVIEW E 00, 002200 (2015)
FIG. 8. (Color online) System (I): The evolution of the capturerate of MFMC from model 2 well into the fracture regime foragglomerate C. While the capture rate does decrease after the firstmajor fracture event (fragments shown in inset), it maintains a capturerate of 60% or more until around stage 140. At this point, anotherfracture event occurs; the capture rate drops slightly though remainsabove 50%.
C. MFMC performance for System (II) and commonalities678
with System (I)679
Given that the constituent particles of System (II) are made680
of the same material and there are no bonds at contacts, we681
adopt a uniform capacity function for this system. For the cost682
function, we adopt that of model 2, the best-performing model683
from System (I). As shown in Fig. 9, we found comparable684
capture rates as those observed for System (I). Similarly,685
almost all the weak contacts in MFMC (approximately 98%)686
are in conjoined 3-cycles that directly support force chains.687
Like those found in System (I), these are mostly arranged in688
one of two configurational modes, as depicted in Fig. 6. Mode689
I weak contacts comprise on average 79% (Fig. 9): Here a 690
side neighbor supports two force chain particles, each through 691
this weak contact. The evolution of Mode 1 versus Mode 2 692
configurations among the weak MFMC contacts is almost 693
constant throughout loading, especially when compared to 694
the bonded particles in agglomerates A–D. This suggests 695
that there are more reconfigurations in the supporting weak 696
contacts in the fixed contact networks of the agglomerates 697
in (I) prior to fracture. Presumably, this is to compensate for 698
these systems’ inability to regulate the confining weak supports 699
to force chains through loss and/or gain of contacts from 700
physical rearrangements of member particles, which happen 701
continually in (II). These grain rearrangements are evident 702
in the average number of contacts per particle fluctuating 703
continually between 3 and 4 [50]. 704
While comparisons between MFMC pathways and force 705
chains are difficult to follow in full 3D space, they are trivial 706
in 2D. Hence we capitalize on the ease of visualization of 707
patterns in System (II) to summarize the trends we observed 708
across all the systems studied here, bonded and unbonded. 709
In Fig. 10 (top), we show the percolating MFMC consisting 710
entirely of red and orange edges for one of the representative 711
stages of loading (stage 65 in Fig. 9) for System (II). The 712
contacts in force chains, which were missed by the MFMC, 713
are in blue. Those edges in the MFMC belonging to force 714
chains are in orange; the rest are in red. The red edges consist 715
of strong and weak contacts. The majority in the latter set 716
are in 3-cycles directly supporting a force chain particle in 717
Mode I configuration. With the aid of the zoom-in images of 718
the MFMC as examples [Fig. 10(a)–10(c)], we highlight three 719
recurring patterns in force transmission that are common to all 720
the systems examined. First, in cases where two force chains 721
are right next to each other [e.g., Fig. 10(a)], the MFMC will 722
take the lower cost pathway, often missing one of the force 723
chains (the left chain is favored in this example). Second, the 724
red edges in the MFMC link or join distant as well as proximal 725
force chains (red edges connect orange edges), suggesting the 726
MFMC is indeed correctly identifying paths of optimum force 727
FIG. 9. (Color online) System (II), left: The capture rate of MFMC for the assembly of unbonded photoelastic disks for a model with auniform capacity and a cost function governed by 3-cycle membership. The average capture rate with respect to force chains is 70%, which iscomparable to those obtained in System (I) agglomerates. Right: The fraction of weak MFMC particles in Mode I and Mode II for the assemblyof unbonded photoelastic disks.
002200-11

TORDESILLAS, TOBIN, CIL, ALSHIBLI, AND BEHRINGER PHYSICAL REVIEW E 00, 002200 (2015)
FIG. 10. (Color online) System (II): The percolating MFMC andforce chains at a representative stage in the loading history (top).Black dots represent disk centroids. Thin blue edges (thin light grey)are those missed by the MFMC, which belong to force chains. Thickorange (thick dark grey) edges are those that belong to MFMC andare part of force chains. Red edges (thin grey) comprise contactsfrom both the strong and weak contact network. Zoom-in imagesof MFMC pathways that are commonly observed across all systems(bottom): (a) When two aligned force chains are located side byside, the MFMC pathway goes through the cheaper route causing oneforce chain to be missed; (b) independent force chains are often joinedtogether by MFMC pathways; (c) MFMC pathways include direct-quasilinear and as well as tortuous pathways that typically representintraconnections in force chains and interconnections between forcechains, respectively.
transmission [Fig. 10(b)]. Third, a wide variety of pathways728
are possible, from the sometimes-tortuous path on the left729
(red) connecting distant force chains to the direct linear path730
on the right (orange) which is in fact a force chain [Fig. 10(c)].731
These patterns reinforce the fact that the percolating MFMC732
network is holistic in its description of the major pathways733
for force transmission. To summarize, the structural elements734
in force transmission, as defined by the MFMC, embody735
a two-tier hierarchical architecture, as depicted in Fig. 11.736
At the local level, it encapsulates intraconnections between737
particles in individual force chains and their supporting738
contacts in conjoined 3-cycles. At the global level, the MFMC739
encapsulates interconnections between force chains, enabling740
load transfer from one force chain to the next. Geometrically,741
the direct and quasilinear pathways represent intraconnections742
in force chains or interconnections between proximal force743
FIG. 11. (Color online) A depiction of the two-tier hierarchi-cal architecture of the percolating MFMC network (left). Localpathways (red) encapsulate intraconnections between particles inindividual force chains and their confining weak contacts in 3-cycles.Global pathways (blue dashed lines with dots at end) encapsulateinterconnections between distinct force chains. A depiction of somepossible intraconnections in a local pathway and frustrated rotations(right). The majority of the weak contacts are in Mode I: A sideneighbor supports two force chain particles, one or both of whichexperiences frustrated rotation (dashed white lines) regardless of thedirection of particle rotations in the 3-cycle. A small minority are inMode II: Two side neighbors support a force chain particle which,depending on the direction of particle rotations, may or may notexperience frustrated rotation.
chains, while tortuous pathways typically connect force chains 744
that are far apart. 745
VI. CONCLUSION 746
We developed a family of network flow models of force 747
transmission and tested these on data on microstructural fabric 748
in unbonded as well as bonded granular media. For the bonded 749
systems in 3D, comprising single grain agglomerates, the 750
models depend solely on knowledge of the contacts and the 751
relative bond strengths. For the cohesionless unbonded system 752
in 2D, involving an assembly of unbonded photoelastic disks, 753
the model depends solely on knowledge of the contacts. We 754
solved the maximum flow–minimum cost problem, the solu- 755
tion to which yielded a percolating subnetwork of contacts that 756
transmits the maximum flow (i.e., the highest units of force) at 757
least cost (i.e., the dissipated energy from such transmission). 758
This subnetwork (termed MFMC) represents a network of 759
major force pathways through the global contact network of the 760
material. The best-performing model has these force pathways 761
passing through most of the force chains: Thus the majority 762
of particles in force chains can be predicted through MFMC 763
(i.e., capture rates of 76–82% were observed across all four 764
agglomerates). This model has a capacity function that is based 765
on the bond strength and a cost function that is determined by 766
002200-12

NETWORK FLOW MODEL OF FORCE TRANSMISSION IN . . . PHYSICAL REVIEW E 00, 002200 (2015)
the local 3-cycle topology. With respect to the composition of767
this model’s MFMC contact network, we find that 76–79%768
belong to the strong network while the rest belong to the769
weak network in 3-cycles that directly support force chains.770
A clear preference is observed for 3-cycle configurations771
where one side neighbor supports two force chain particles:772
Here frustrated rotation operates in at least one force chain773
contact regardless of the direction of rotation of particles774
in the 3-cycle. For the assembly of unbonded photoelastic775
disks, comparable, though smaller, capture rates of force776
chains were found for the same cost function and a uniform777
capacity. In all the systems studied here, the MFMC embodies778
a two-tier hierarchical architecture comprising the main779
structural elements of force transmission. At the local level, it780
encapsulates intraconnections between particles in individual781
columnar force chains and their supporting truss-like 3-cycles;782
at the global level, the MFMC encapsulates interconnections783
that enable load transfer between force chains. Robustness784
of trends across these systems suggests the network flow785
framework may have potential broad utility in the modeling786
of force transmission in bonded as well as unbonded granular787
materials. In particular, findings from here and related studies788
of bottlenecks in force transmission using network flow theory789
[46–49] pave the way for the prediction of internal forces790
[59] and the manipulation of granular behavior from the grain 791
scale [60] from data on microstructural fabric. We envisage 792
many opportunities within the framework of network flow to 793
leverage information encoded in high-resolution imaging data 794
for a broad range of granular materials, including cementitious 795
composite materials and loose multicomponent aggregates. 796
We will report on these developments in a future paper. 797
ACKNOWLEDGMENTS 798
We thank an anonymous reviewer for helpful sugges- 799
tions and Reena Kapoor for careful proofreading of the 800
manuscript. This work was supported by the US Army 801
Research Office through Grants No. W911NF1110175 and 802
No. W911NF1110110, the Australian Research Council 803
DP120104759, the Melbourne Energy Institute, the Melbourne 804
Research Grant Support Scheme, The US National Science 805
Foundation through Grant No. CMMI-1362510 to M.C. and 806
K.A. and Grants No. CMMI-1156436 and No. DMRI-1206351 807
to R.P.B., and NSF Grants No. DMR-1206351 and No. 808
DMS-3530656 and NASA Grants No. NNX10AU01G and 809
No. NNX15AD38G. 810
[1] F. Radjai, D. E. Wolf, M. Jean, and J.-J. Moreau, Phys. Rev.Lett. 80, 61 (1998).
[2] T. S. Majmudar and R. P. Behringer, Nature 435, 1079 (2005).[3] P. Dantu, in Proceedings of the 4th International Conference
on Soil Mechanics and Foundation Engineering (ButterworthsScientific Publications, London, 1957), Vol. 1, p. 144.
[4] T. Wakabayashi, in Proceedings of the 7th Japan NationalCongress for Applied Mechanics, 1957 (University of TokyoPress, Tokyo, Japan, 1958), pp. 153–158.
[5] A. Drescher and G. de Josselin de Jong, J. Mech. Phys. Solids20, 337 (1972).
[6] M. Oda and H. Kazama, Geotechnique 48, 465 (1998).[7] A. Tordesillas, Philos. Mag. 87, 4987 (2007).[8] A. Tordesillas, J. Zhang, and R. P. Behringer, Geomech. Geoeng.
4, 3 (2009).[9] A. Tordesillas, Q. Lin, J. Zhang, R. P. Behringer, and J. Shi,
J. Mech. Phys. Solids 59, 265 (2011).[10] A. Tordesillas and M. Muthuswamy, J. Mech. Phys. Solids 57,
706 (2009).[11] F. Meng, K. Liu, and W. Wang, Tribol. Transact. 58, 70 (2015).[12] A. Tordesillas, S. Pucilowski, D. M. Walker, J. F. Peters, and L.
E. Walizer, Intl. J. Numer. Anal. Methods Geomech. 38, 1247(2014).
[13] D. Bi, J. Zhang, B. Chakraborty, and R. P. Behringer, Nature480, 355 (2011).
[14] A. Tordesillas, S. Pucilowski, L. Sibille, F. Nicot, and F. Darve,Philos. Mag. 92, 4547 (2012).
[15] A. Rechenmacher, S. Abedi, and O. Chupin, Geotechnique 60,343 (2010).
[16] K. E. Daniels and N. W. Hayman, J. Geophys. Res.: Solid Earth(1978-2012) 113, B11411 (2008).
[17] A. Tordesillas, S. Pucilowski, D. M. Walker, J. Peters, and M.Hopkins, Dynam. Cont. Dis. Ser. B 19, 471 (2012).
[18] A. G. Smart and J. M. Ottino, Soft Matter 4, 2125 (2008).[19] P. C. Burnley, Nat. Commun. 4, 2117 (2013).[20] N. Guo and J. Zhao, Intl. J. Numer. Methods Eng. 99, 789 (2014).[21] N. Brodu, J. A. Dijksman, and R. P. Behringer, Nat. Commun.
6, 6361 (2015).[22] M. Kramar, A. Goullet, L. Kondic, and K. Mischaikow, Phys.
Rev. E 90, 052203 (2014).[23] A. Tordesillas, D. M. Walker, G. Froyland, J. Zhang, and R. P.
Behringer, Phys. Rev. E 86, 011306 (2012).[24] R. Arevalo, I. Zuriguel, and D. Maza, Phys. Rev. E 81, 041302
(2010).[25] L. Kondic, A. Goullet, C. S. O’Hern, M. Kramar, K. Mischaikow,
and R. P. Behringer, Europhys. Lett. 97, 54001 (2012).[26] D. M. Walker, A. Tordesillas, C. Thornton, R. P. Behringer, J.
Zhang, and J. F. Peters, Granul. Matter 13, 233 (2011).[27] E. Ando, G. Viggiani, S. A. Hall, and J. Desrues, Geotech. Lett.
3, 142 (2013).[28] M. B. Cil and K. A. Alshibli, Geotech. Lett. 2, 161 (2012).[29] O. Rozenbaum and S. R. du Roscoat, Phys. Rev. E 89, 053304
(2014).[30] J. Zhou, S. Long, Q. Wang, and A. Dinsmore, Science 312, 1631
(2006).[31] J. E. Andrade, I. VlahiniC, K.-W. Lim, and A. Jerves, Geotech.
Lett. 2, 135 (2012).[32] M. Saadatfar, A. P. Sheppard, T. J. Senden, and A. J. Kabla,
J. Mech. Phys. Solids 60, 55 (2012).[33] C. M. Wensrich, E. H. Kisi, V. Luzin, U. Garbe, O. Kirstein,
A. L. Smith, and J. F. Zhang, Phys. Rev. E 90, 042203(2014).
002200-13

TORDESILLAS, TOBIN, CIL, ALSHIBLI, AND BEHRINGER PHYSICAL REVIEW E 00, 002200 (2015)
[34] J. Brujic, S. F. Edwards, D. V. Grinev, I. Hopkinson, D. Brujic,and H. A. Makse, Farad. Discuss. 123, 207 (2003).
[35] M. M. Mehrabadi, S. Nemat-Nasser, and M. Oda, Intl. J. Numer.Anal. Methods Geomech. 6, 95 (1982).
[36] G. Meghabghab and A. Kandel, Search Engines, Link Analysis,and User’s Web Behavior: A Unifying Web Mining Approach(Springer Science and Business Media, Berlin, 2008).
[37] S. Brin and L. Page, Comput. Network. ISDN Syst. 30, 107(1998).
[38] A. Tordesillas, D. M. Walker, and Q. Lin, Phys. Rev. E 81,011302 (2010).
[39] D. M. Walker, A. Tordesillas, J. Ren, J. A. Dijksman, and R. P.Behringer, Europhys. Lett. 107, 18005 (2014).
[40] D. M. Walker, A. Tordesillas, J. Zhang, R. P. Behringer, E. Ando,G. Viggiani, A. Druckrey, and K. Alshibli, Intl. J. Solids Struct.54, 20 (2015).
[41] D. M. Walker, A. Tordesillas, N. Brodu, J. A. Dijksman, R. P.Behringer, and G. Froyland, Soft Matter 11, 2157 (2015).
[42] A. Tordesillas, D. M. Walker, E. Ando, and G. Viggiani, Proc.R. Soc. London Ser. A 469, 20120606 (2013).
[43] R. K. Ahuja, T. L. Magnanti, and J. B. Orlin, Network Flows:Theory, Algorithms and Applications (Prentice Hall, UpperSaddle River, NJ, 1993).
[44] M. E. J. Newman, Networks: An Introduction (Oxford UniversityPress, Oxford, 2010).
[45] W. J. Cook, W. H. Cunningham, W. R. Pulleyblank, andA. Schrijver, Combinatorial Optimization (Wiley-Interscience,New York, 1998).
[46] A. Tordesillas, A. Cramer, and D. M. Walker, Powders andGrains 2013, AIP Conf. Proc. 1542, 507 (2013).
[47] Q. Lin and A. Tordesillas, Powders and Grains 2013, AIP Conf.Proc. 1542, 547 (2013).
[48] Q. Lin and A. Tordesillas, J. Ind. Manag. Optim. 10, 337 (2014).[49] A. Tordesillas, S. Pucilowski, S. Tobin, M. R. Kuhn, E. Ando,
G. Viggiani, A. Druckrey, and K. Alshibli (unpublished).[50] J. Zhang, T. S. Majmudar, A. Tordesillas, and R. P. Behringer,
Granul. Matter 12, 159 (2010).[51] D. E. Wolf, F. Radjai, and S. Dippel, Philos. Mag. 77, 1413
(1998).[52] D. M. Walker, A. Tordesillas, and G. Froyland, Phys. Rev. E 89,
032205 (2014).[53] D. O. Potyondy and P. A. Cundall, Intl. J. Rock Mech. Min. Sci.
41, 1329 (2004).[54] E. W. Weisstein, Lambert azimuthal equal-area
projection, Wolfram Mathworld, http://mathworld.wolfram.com/LambertAzimuthalEqual-AreaProjection.html.
[55] L. R. Ford and D. R. Fulkerson, Can. J. Math. 8, 399 (1956).[56] A. A. Hagberg, D. A. Schult, and P. J. Swart, in Proceedings
of the 7th Python in Science Conference (SciPy2008), edited byG. Varoquaux, T. Vaught, and J. Millman (Pasadena, CA, USA,2008), pp. 11–15.
[57] M. Muthuswamy and A. Tordesillas, J. Stat. Mech. Theor. Exp.(2006) P09003.
[58] J. F. Peters, M. Muthuswamy, J. Wibowo, and A. Tordesillas,Phys. Rev. E 72, 041307 (2005).
[59] S. T. Tobin, A. Tordesillas, A. Druckrey, M. Cil, K. Alshibli,N. Brodu, J. A. Dijksman, and R. P. Behringer (unpublished)(2015).
[60] D. M. Walker, A. Tordesillas, T. Nakamura, and T. Tanizawa,Phys. Rev. E 87, 032203 (2013).
002200-14