Embed Size (px)
Citation preview
Network Safety Analysis
HD15
Collision Rate Analysis on the
National Road Network– Post
HD15
Clodagh Staunton
Road Safety

Introduction
• Collision Rate Analysis - Network Safety
Ranking
• Collision Trends
– National Roads
– Reference Populations
– Routes
• Road Safety Inspections
• Summary

HD15 - Network Safety Ranking

Control Data Poster
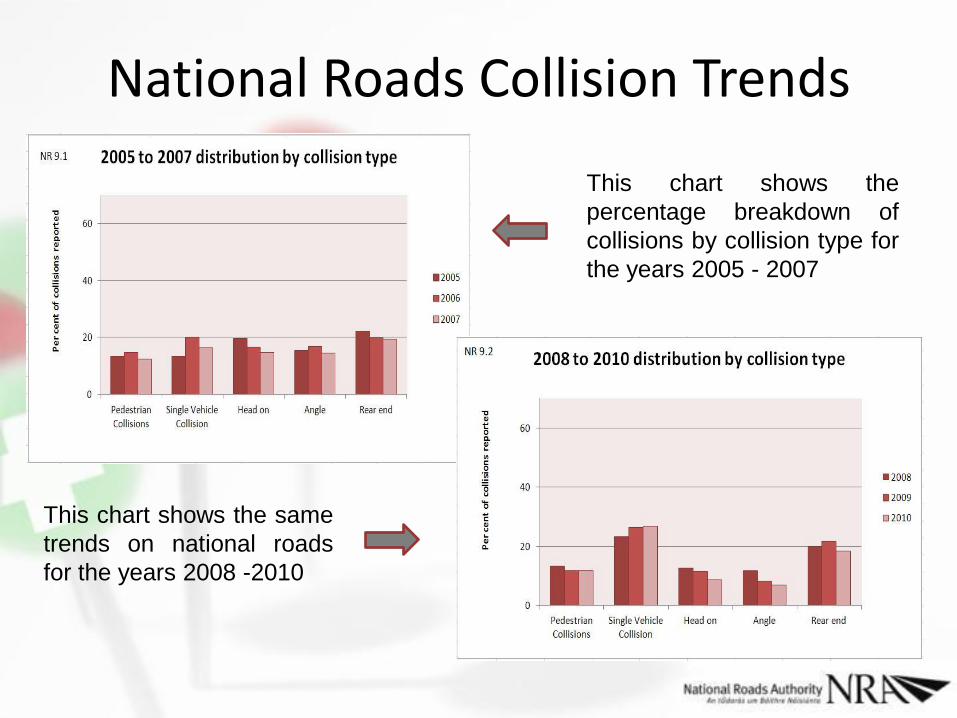
National Roads Collision Trends
This chart shows the
percentage breakdown of
collisions by collision type for
the years 2005 - 2007
This chart shows the same
trends on national roads
for the years 2008 -2010
Reference Populations
• Five reference populations
• Collision trends over time
• Collision trends across reference
populations
• Control data for the routes

Reference Population Collision
Trends
This chart shows the
percentage breakdown of
collisions by collision type
for the Rural 2 Lane
reference population 2008
- 2010
This chart shows the
same trends on
Motorways for the
years 2008 -2010
Route Collision Trends
• Generated charts for each route on the national road network
• Compare Route Collision Trends
– With Reference Population
– Over Time

0
20
40
60
80
Pedestrian Collisions
Single Vehicle
Collision
Head on Angle Rear end Pe
r ce
nt
of
rep
ort
ed
co
lliso
ns
N51 Rural 2 Lane distribution by collision type
2005-2007
2008-2010
0
20
40
60
80
Pedestrian Collisions
Single Vehicle
Collision
Head on Angle Rear end Pe
r ce
nt
of
rep
ort
ed
co
llisi
on
s
Rural 2 Lane distribution by collision type
2005-2007
2008-2010
25 % increase in SVC from 05-07 to 08-10
25 % decrease in head on collisions from 05-07 to 08-10
10 % increase in SVC from 05-07 to 08-10
5 % decrease in head on collisions from 05-07 to 08-10
Comparing collision trends over time on N51
Comparing collision trends over time within reference population
Ro
ute
dat
a R
efer
ence
po
pu
lati
on
dat
a

0
20
40
60
80
100
Dry Surface Wet Surface
Pe
r ce
nt
of
rep
ort
ed
co
lliso
ns
N51 Rural 2 Lane collision distribution by surface condition
2005-2007
2008-2010
0
20
40
60
80
100
Dry Surface Wet Surface
Pe
r ce
nt
of
rep
ort
ed
co
llisi
on
s
Rural 2 Lane collision distribution by surface condition
2005-2007
2008-2010
Comparing N51 and the reference
population of all rural 2-Lane roads
Shown is the per cent difference
between collisions on dry surface
Difference of
about 5 % during
05 - 07 period
Difference of about
10 % during 08 -10
period
Ro
ute
dat
a R
efer
ence
po
pu
lati
on
dat
a
Road Safety Inspections
• EU Directive on Road Infrastructure Safety
Management (2008)
• Investigating current safety of national
roads
• Where does the collision data fit into RSI?
Summary
• Post HD-15 Analysis
• Collision Trends
– Over Time
– Across Road Types
• Uses of Collision Trends