Embed Size (px)
DESCRIPTION
Network & Systems Modeling. 29 June 2009 NCSU GO Workshop. GO Enrichment & Systems Biology. GO Enrichment: the structure of the GO allows its to be queried in a hierarchical manner. use the GO DAG Structure to cluster differentially expressed gene sets - PowerPoint PPT Presentation
Citation preview
Network & Systems Modeling
29 June 2009
NCSU GO Workshop
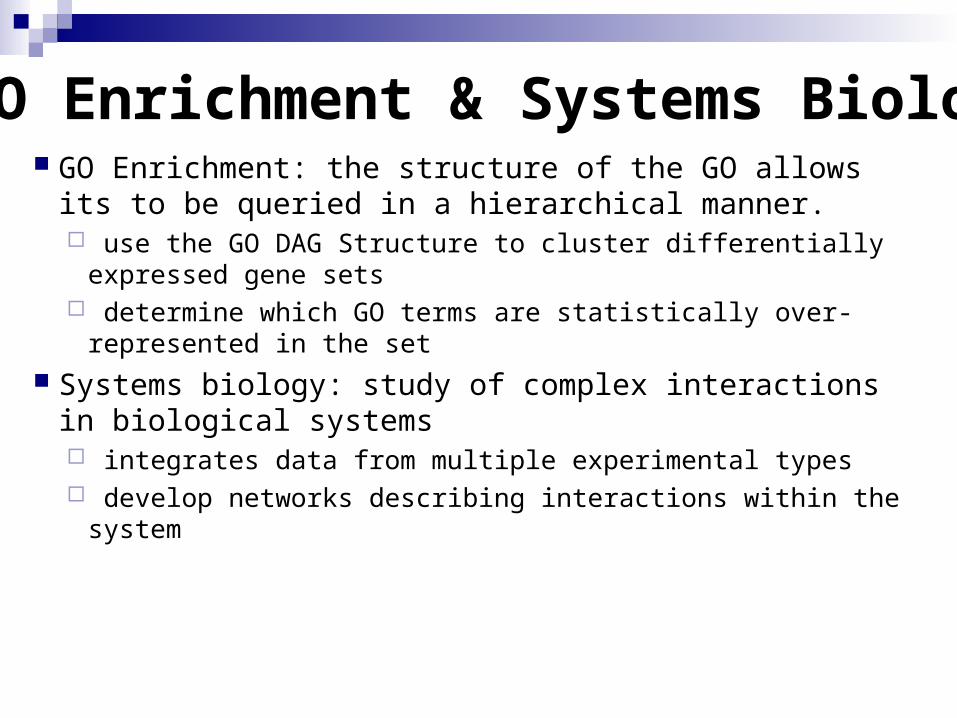
GO Enrichment: the structure of the GO allows its to be queried in a hierarchical manner. use the GO DAG Structure to cluster differentially expressed gene
sets determine which GO terms are statistically over-represented in the set
Systems biology: study of complex interactions in biological systems integrates data from multiple experimental types develop networks describing interactions within the system
GO Enrichment & Systems Biology
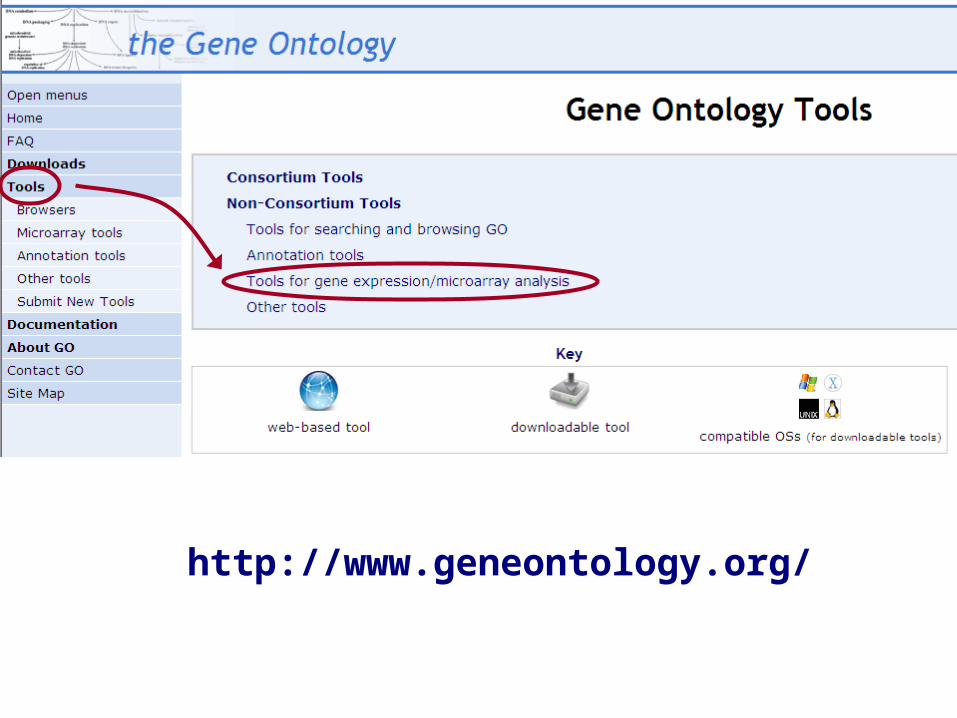
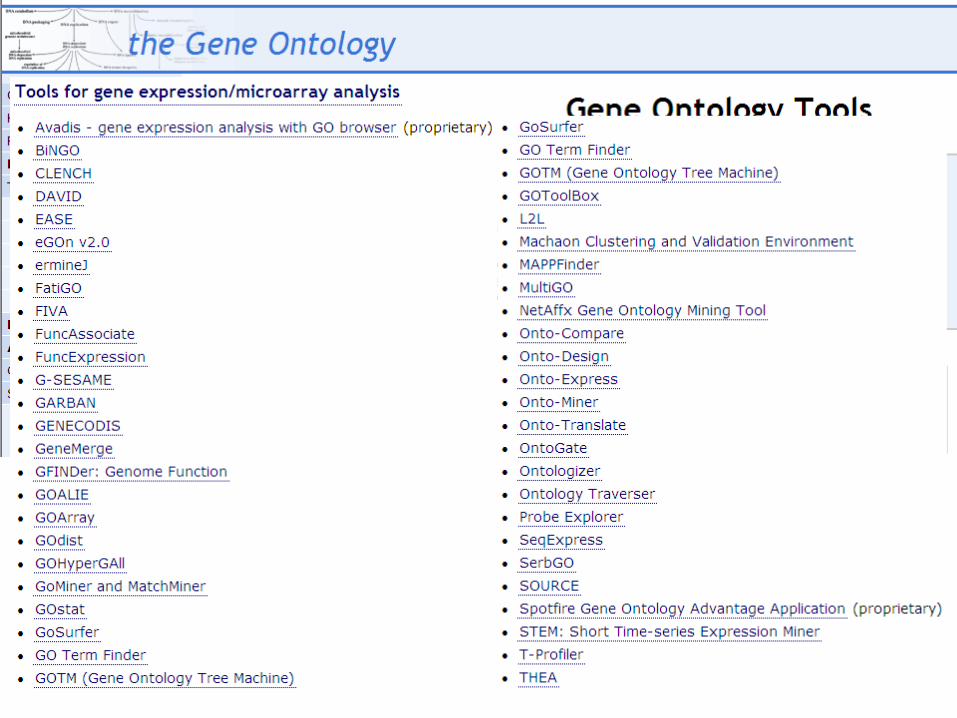
http://www.geneontology.org/
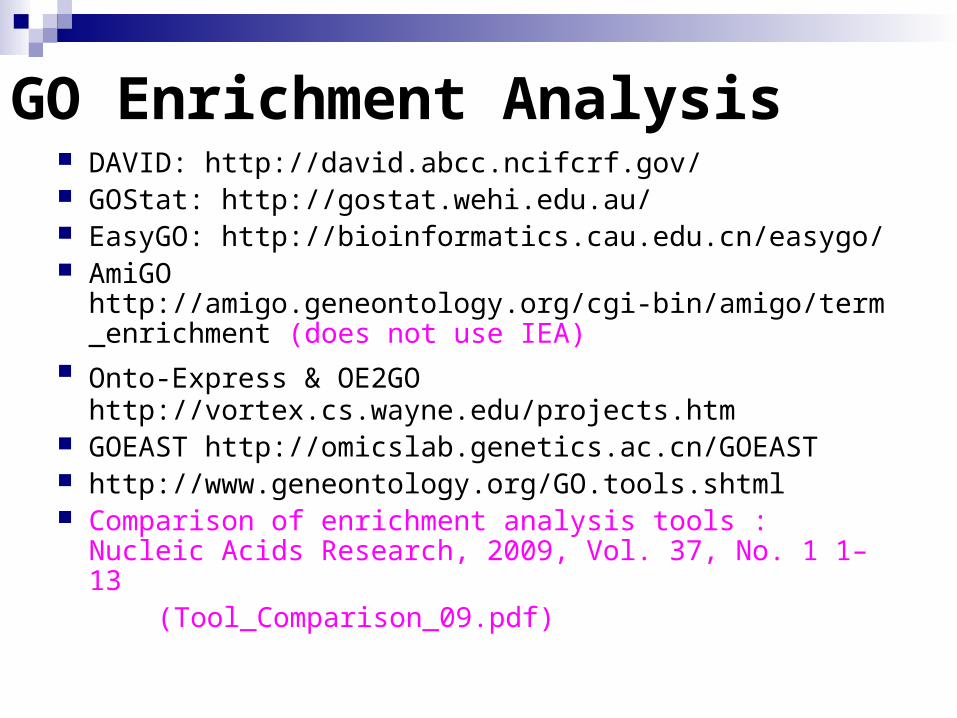
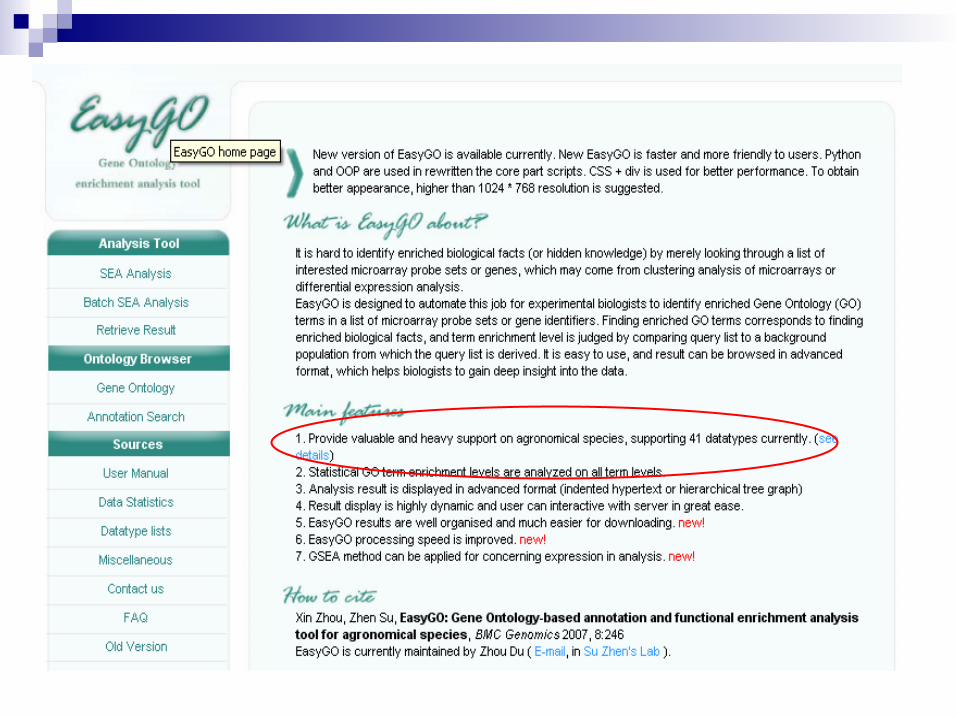
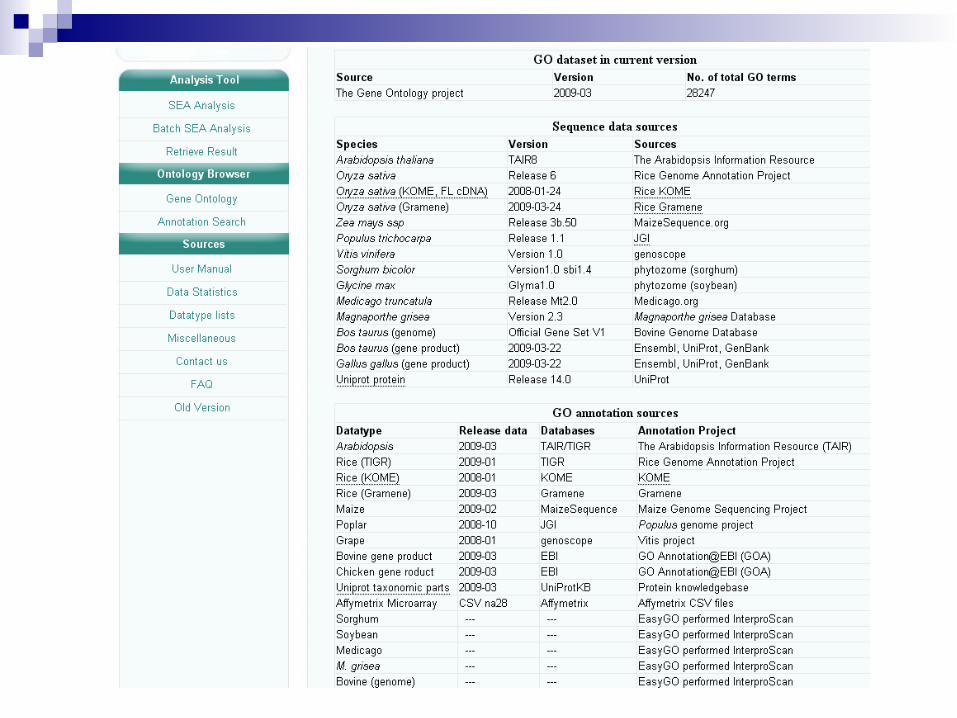
GO Enrichment Analysis DAVID: http://david.abcc.ncifcrf.gov/ GOStat: http://gostat.wehi.edu.au/ EasyGO: http://bioinformatics.cau.edu.cn/easygo/ AmiGO
http://amigo.geneontology.org/cgi-bin/amigo/term_enrichment (does not use IEA)
Onto-Express & OE2GO http://vortex.cs.wayne.edu/projects.htm
GOEAST http://omicslab.genetics.ac.cn/GOEAST http://www.geneontology.org/GO.tools.shtml Comparison of enrichment analysis tools : Nucleic Acids
Research, 2009, Vol. 37, No. 1 1–13 (Tool_Comparison_09.pdf)
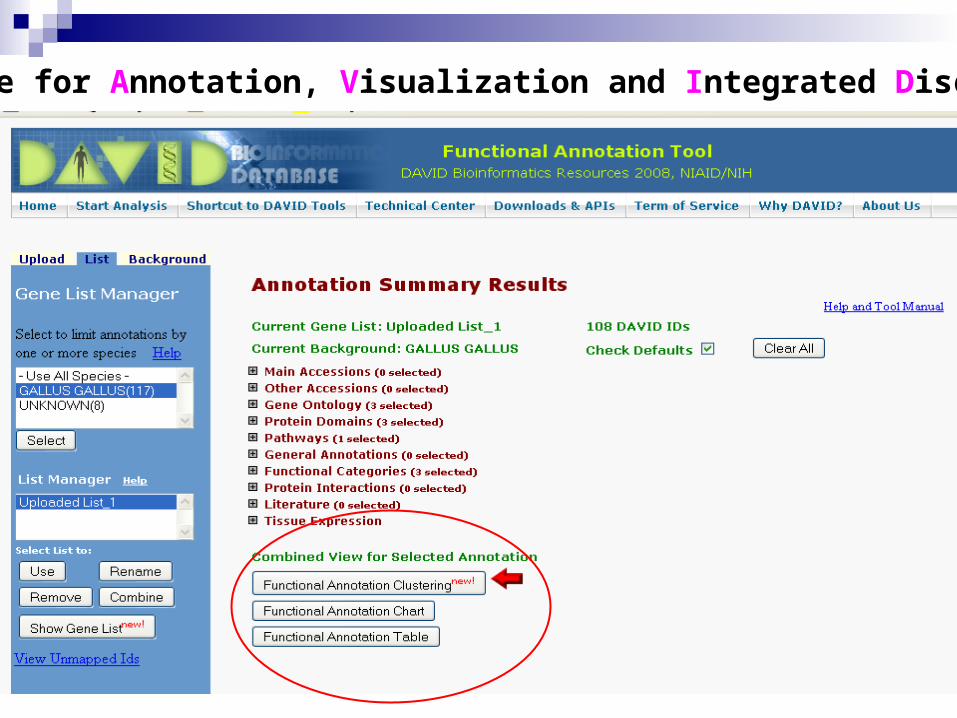
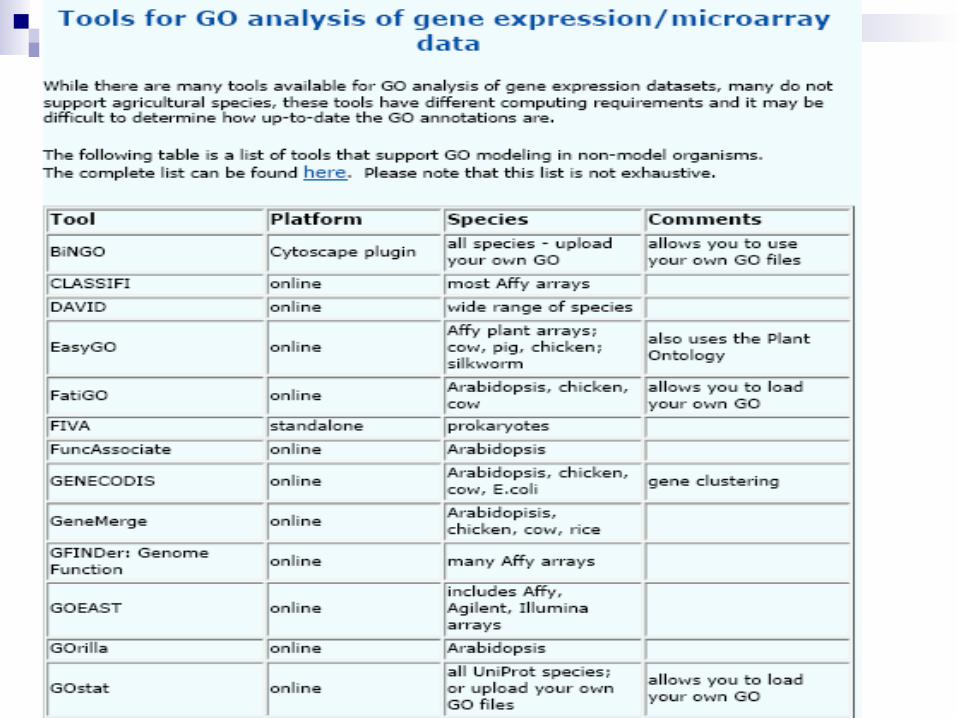
Database for Annotation, Visualization and Integrated Discovery
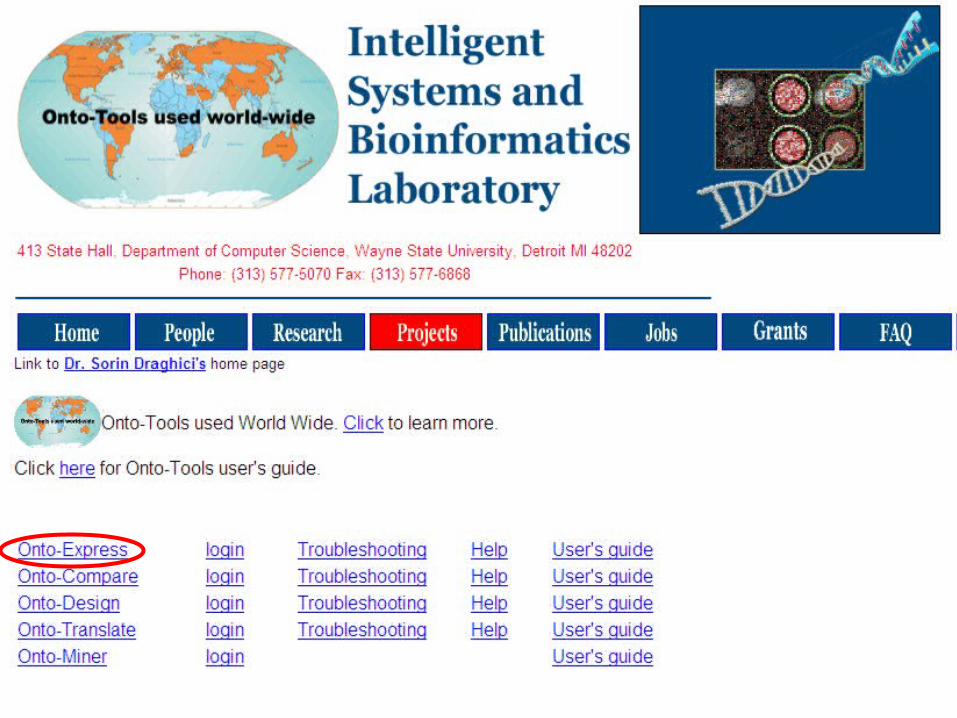
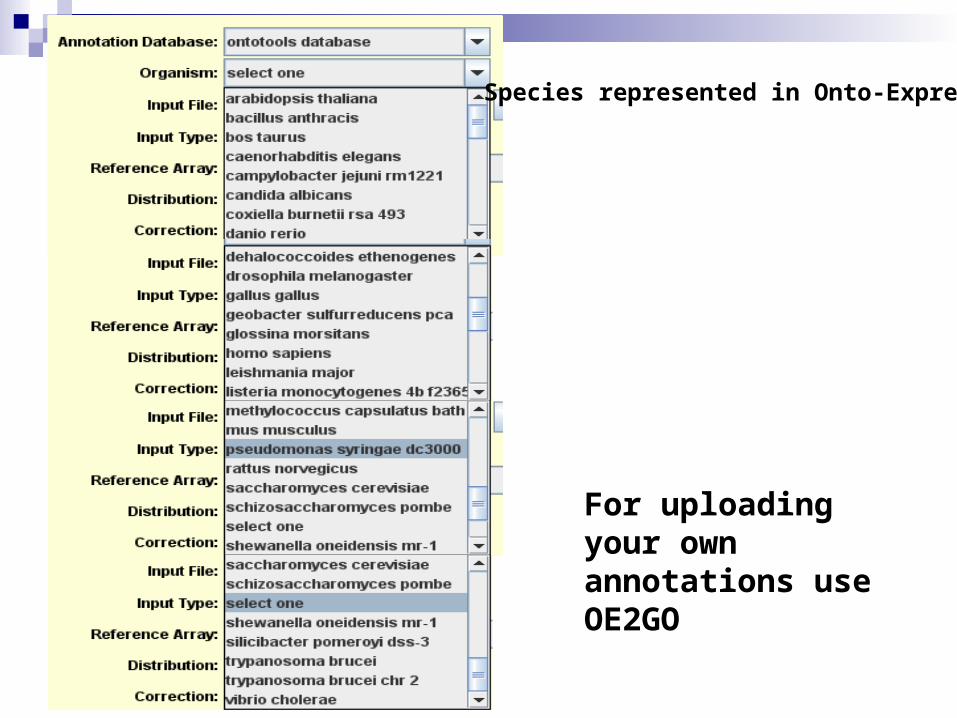
Species represented in Onto-Express
For uploading your own annotations use OE2GO
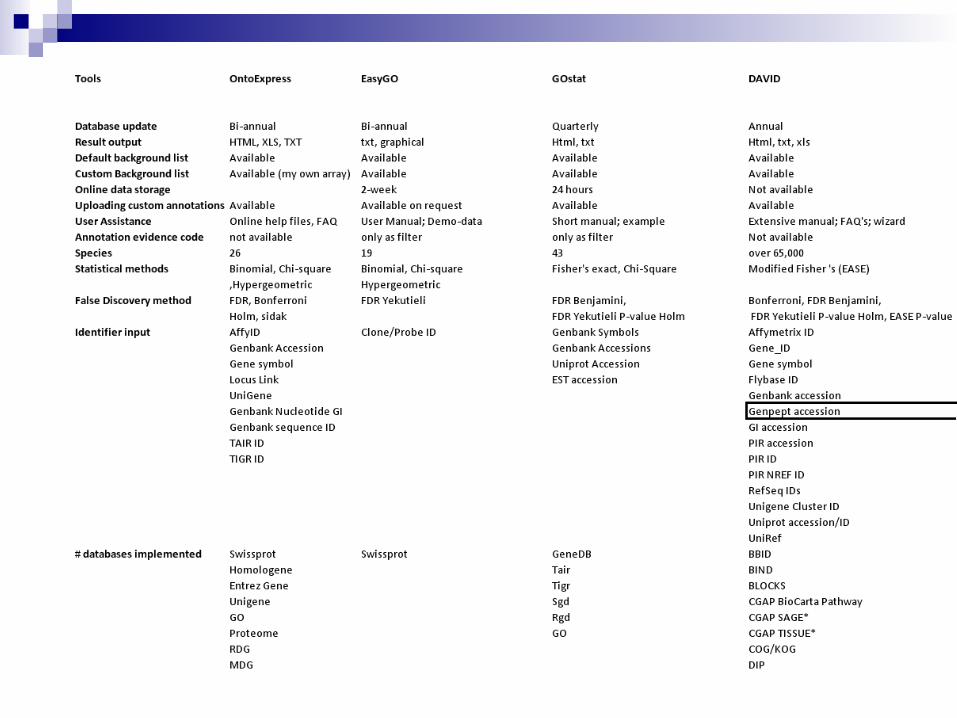
Comparison
Onto-Express , EasyGO, GOstat and DAVID Test set: 60 randomly selected chicken genes Used AgBase GO annotations as baseline
annotations
Vandenberg et al (BMC Bioinformatics, in review)
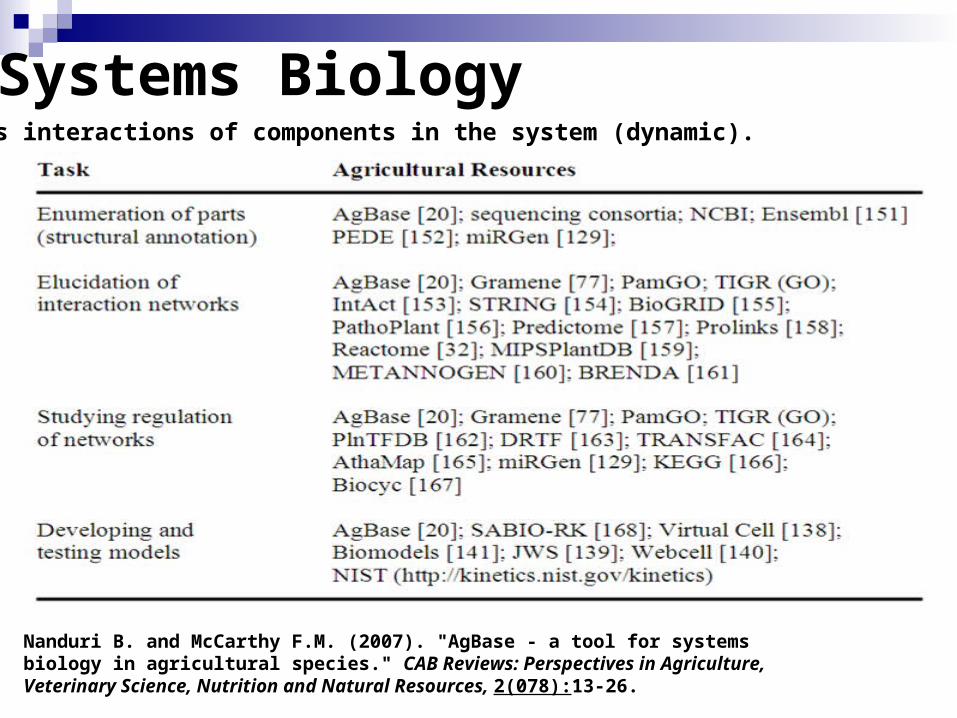
Systems BiologyModels interactions of components in the system (dynamic).
Nanduri B. and McCarthy F.M. (2007). "AgBase - a tool for systems biology in agricultural species." CAB Reviews: Perspectives in Agriculture, Veterinary Science, Nutrition and Natural Resources, 2(078):13-26.
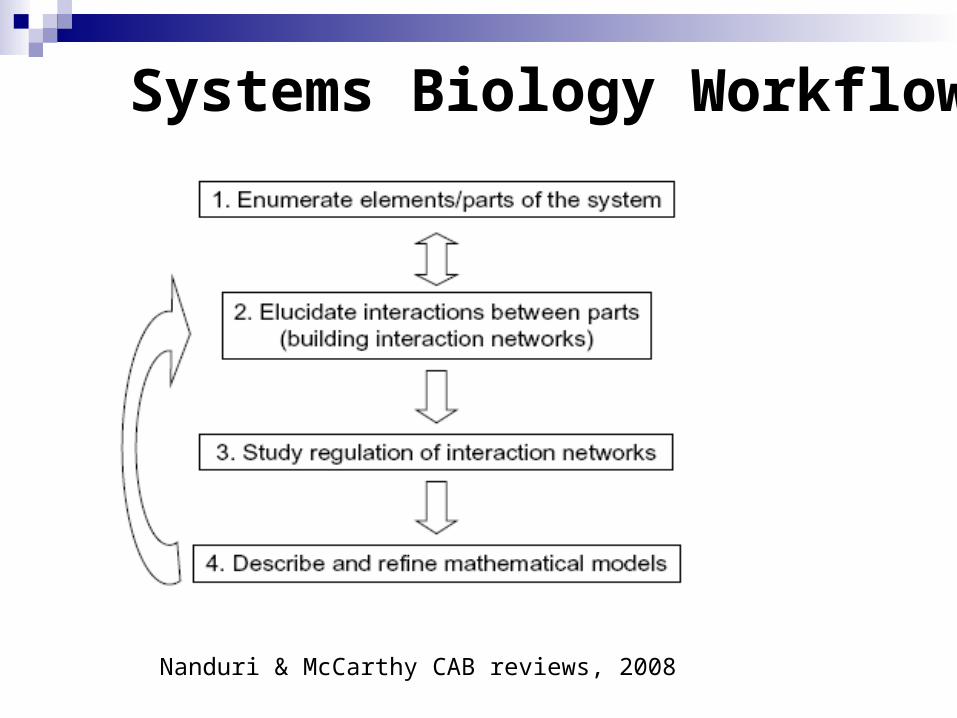
Systems Biology Workflow
Nanduri & McCarthy CAB reviews, 2008

Pathways & Networks
A network is a collection of interactions
Pathways are a subset of networks Network of interacting proteins that carry out biological
functions such as metabolism and signal transduction
All pathways are networks of interactions
NOT ALL NETWORKS ARE PATHWAYS
Biological Networks
Networks often represented as graphs Nodes represent proteins or genes that code for
proteins Edges represent the functional links between
nodes (ex regulation) Small changes in graph’s topology/architecture
can result in the emergence of novel properties
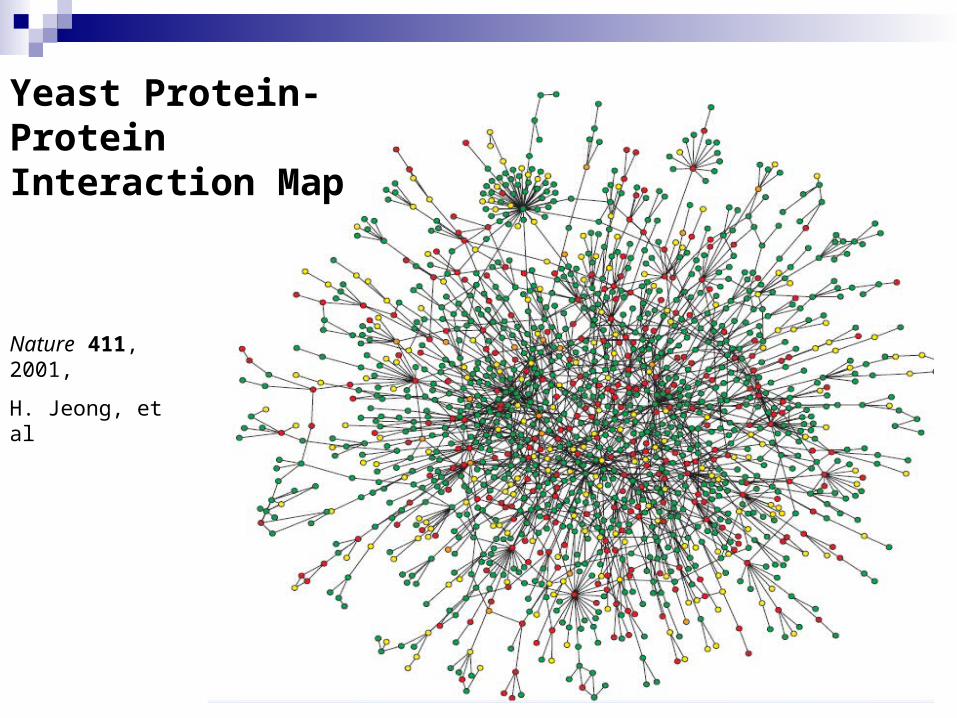
Nature 411, 2001,
H. Jeong, et al
Yeast Protein-Protein Interaction Map

Types of interactions protein (enzyme) – metabolite (ligand)
metabolic pathways
protein – protein cell signaling pathways, protein complexes
protein – gene genetic networks
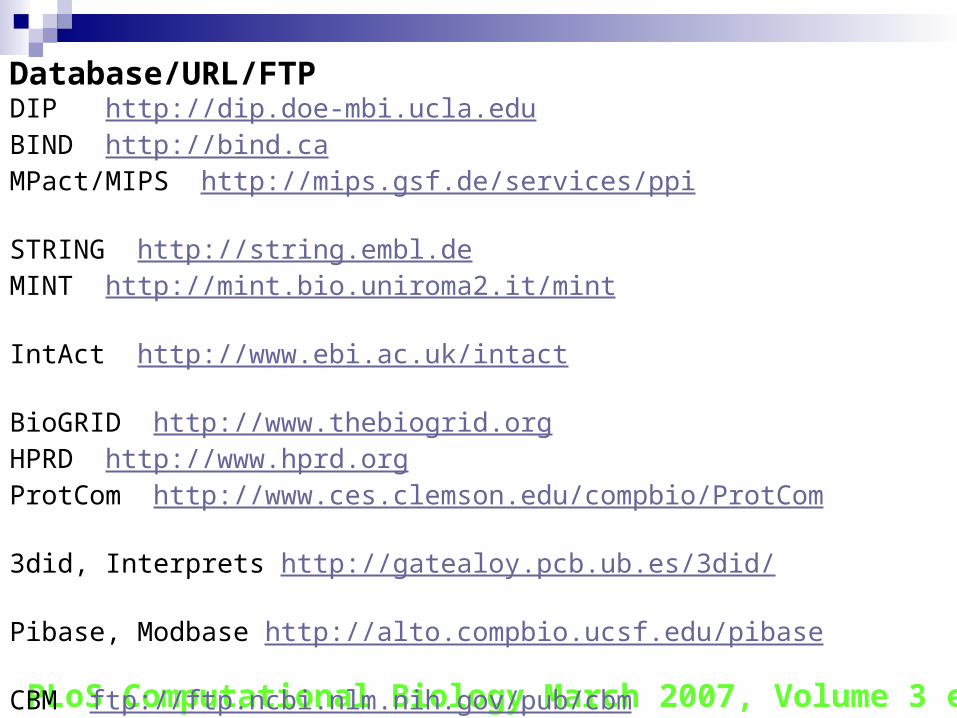
PLoS Computational Biology March 2007, Volume 3 e42
Database/URL/FTPDIP http://dip.doe-mbi.ucla.eduBIND http://bind.ca MPact/MIPS http://mips.gsf.de/services/ppi STRING http://string.embl.deMINT http://mint.bio.uniroma2.it/mintIntAct http://www.ebi.ac.uk/intactBioGRID http://www.thebiogrid.orgHPRD http://www.hprd.orgProtCom http://www.ces.clemson.edu/compbio/ProtCom3did, Interprets http://gatealoy.pcb.ub.es/3did/Pibase, Modbase http://alto.compbio.ucsf.edu/pibaseCBM ftp://ftp.ncbi.nlm.nih.gov/pub/cbmSCOPPI http://www.scoppi.org/iPfam http://www.sanger.ac.uk/Software/Pfam/iPfamInterDom http://interdom.lit.org.sgDIMA http://mips.gsf.de/genre/proj/dima/index.htmlProlinks http://prolinks.doe-mbi.ucla.edu/cgibin/functionator/pronav/Predictome http://predictome.bu.edu/
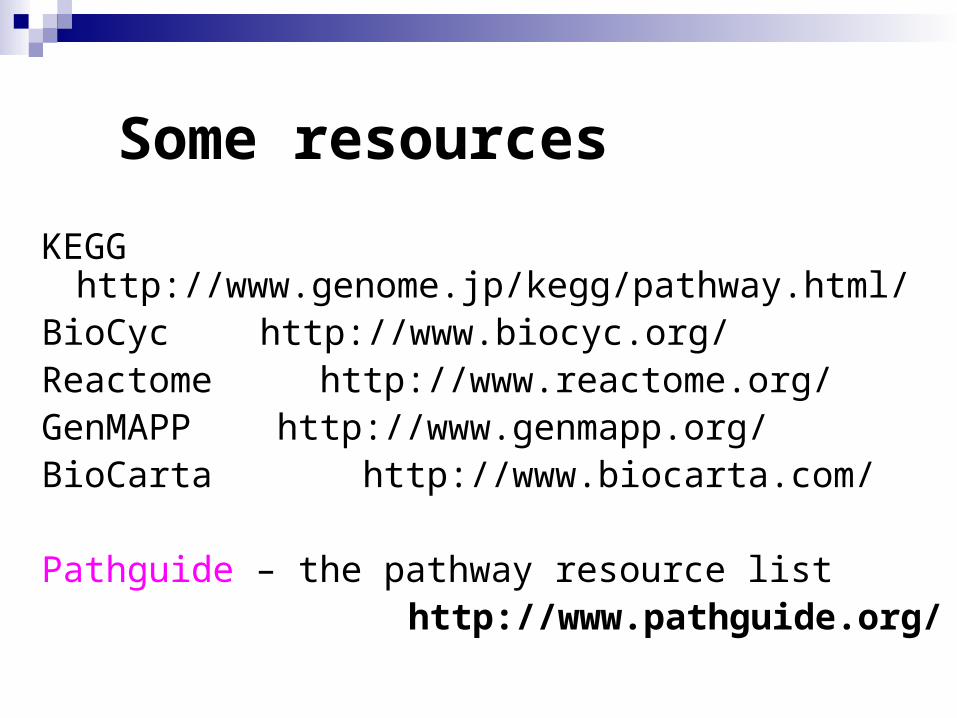
KEGG http://www.genome.jp/kegg/pathway.html/BioCyc http://www.biocyc.org/Reactome http://www.reactome.org/GenMAPP http://www.genmapp.org/BioCarta http://www.biocarta.com/
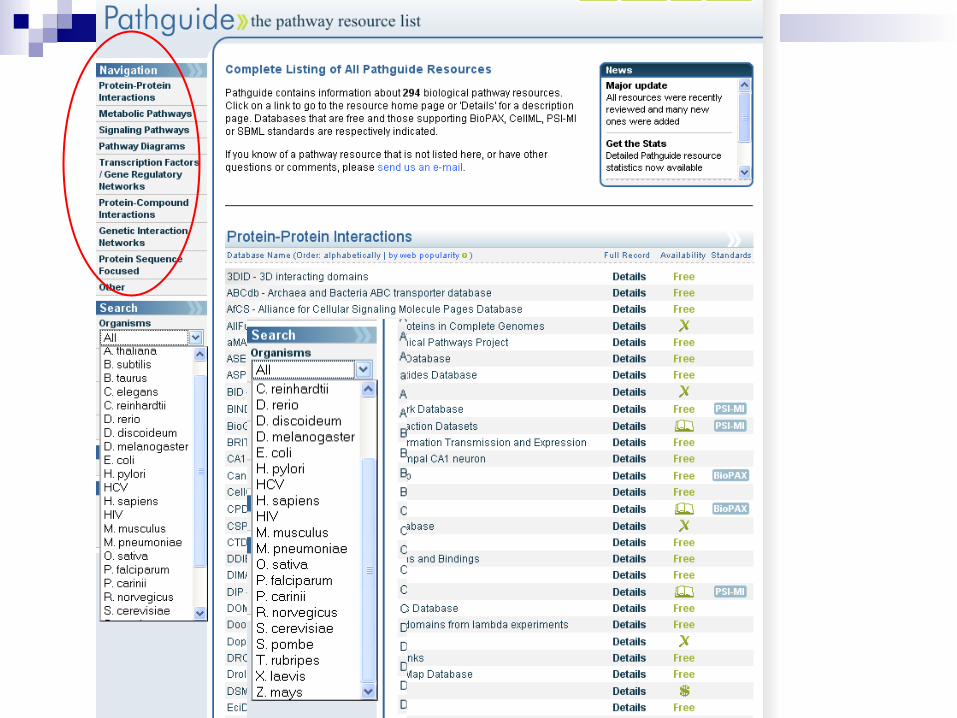
Pathguide – the pathway resource list http://www.pathguide.org/
Some resources
I have interactions what next?
Evaluate the quality of interactions i.e. type of method used for identification….what exactly are these methods?
Visualize these interactions as a network and analyze.