Embed Size (px)
Citation preview

Life is for sharing.
Network Traces of Virtual Worlds: Measurements and Applica:ons Yichuan Wang*^, Cheng-‐hsin Hsu*, Ja:nder Pal Singh*, and Xin Liu^
*Deustche Telekom R&D Lab USA ^University of California, Davis
Deutsche Telekom Inc. R&D Lab USA
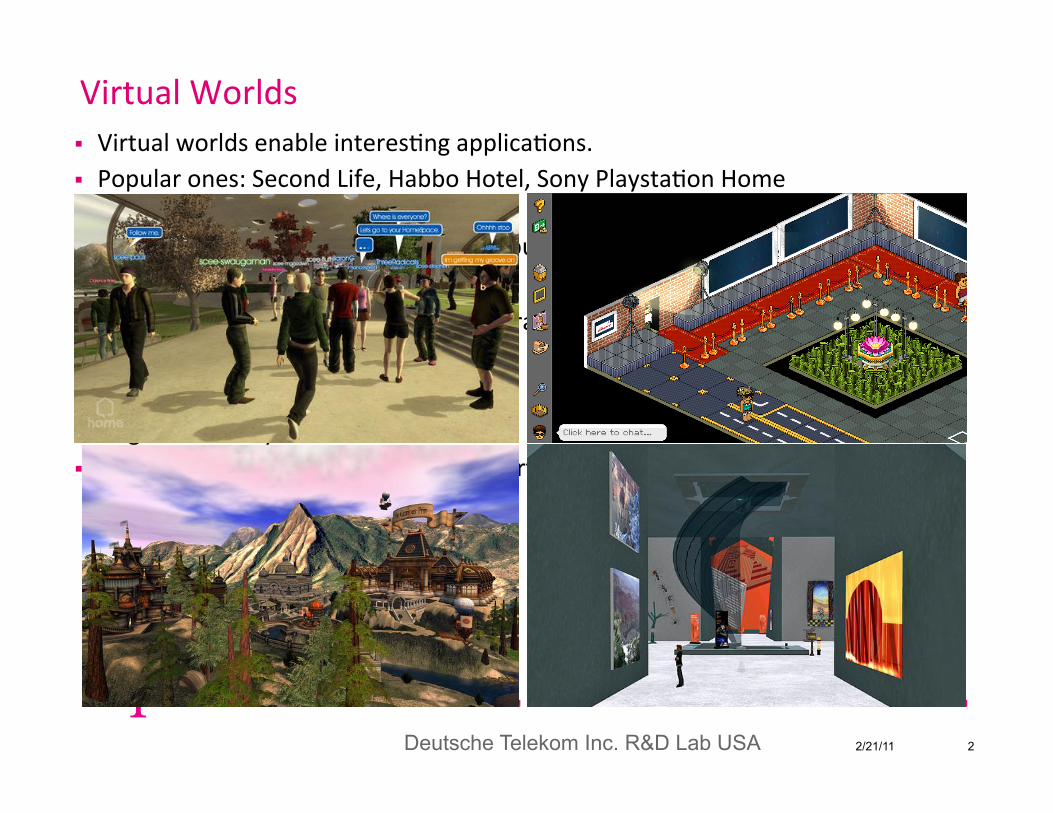
Virtual Worlds Virtual worlds enable interes:ng applica:ons. Popular ones: Second Life, Habbo Hotel, Sony Playsta:on Home
Virtual worlds became increasingly popular. (Second Life)
Virtual worlds host dynamic user-‐generated contents. (So no preload DVD with all the textures) Huge and bursty network demand Traffic model are valuable to ISP and virtual world hos:ng companies.
2/21/11 2

Deutsche Telekom Inc. R&D Lab USA
Challenges
High volume: peak requirement 1.4Mbps vs 20kbps for Starcra[.
Dynamic: Traffic pa\ern is hard to predict and accommodate.
Diversified: 3D meshes, texture, audio, video, and game logic.
UGC: user generated content, uplink traffic, third party data.
2/21/11 3

Deutsche Telekom Inc. R&D Lab USA
Second Life
Virtual World developed by Linden research Region: about 30000 regions Resident, Avatar: up to 40-‐60 avatars per regions Object, primi:ve: up to 15000 per region
Client/Server Viewer, snowglobe Server (Grid): one server for one region
Ac:ons Stand, Yaw, Walk, Run, Fly, Teleport Programmable via Liden Scrip:ng Language (LSL)
2/21/11 4

Deutsche Telekom Inc. R&D Lab USA
Na:onal Geography of Second Life
What to collect? Avatar mobility Object count: region and local Network packet traces
Where to collect? Network crawler Region classes
How to collect? Modified viewer Avatar script injec:on
2/21/11 5
Deutsche Telekom Inc. R&D Lab USA
Meet Bot Mirror
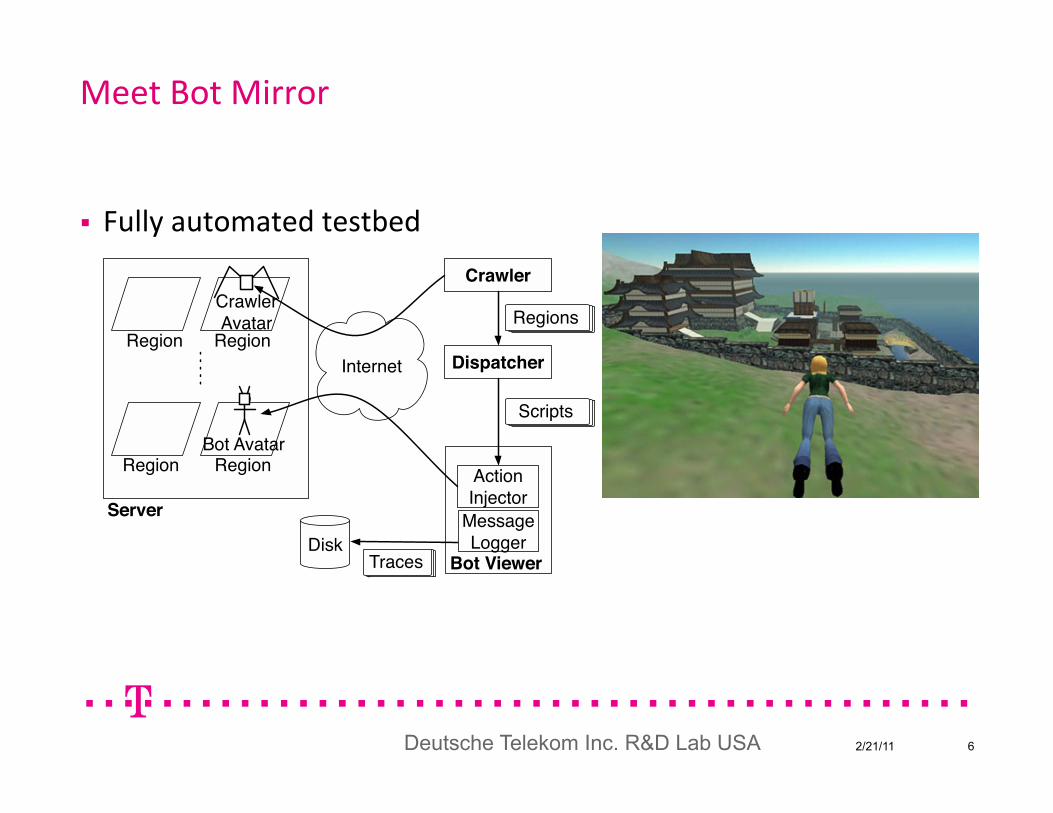
Fully automated testbed
2/21/11 6
!"#$%"$#
&%'()$%*+'#'%
,-#.*+'#'%
*/#0-".!"1$/#-%
!"#$%&'()*
+)*,)*
2$30-"
2$30-"
-*%./)*
2$30-"
2$30-"
4056
2$30-"5
7/%08#5
9%'/$5
:$55'3$;-33$%
01&23").)*
Figure 1: Second Life testbed setup.
7. YWRFT: Sequentially perform four actions: yaw, walk,run, and fly, each for 12 secs. Then teleport to a random lo-cation in the same region and wait until 12 secs have passed.
8. TFRWY: Reversed YWRFT script.
For scripts other than Yaw, we turn an avatar’s direction by directlysetting its orientation, which takes virtually no time to complete.
4.3 Testbed ImplementationWe design and build a testbed to collect Second Life network
traces. We briefly describe three major design decisions made byus.
1. Modifying a GUI viewer. Viewers can be categorized intotwo classes: GUI viewers and text-based chat clients. Wehave augmented both a GUI viewer (Snowglobe [19]) and achat client (TestClient of LibOpenMetaverse [10]), and usedthem to collect network traces. Our experimental resultsindicate that chat clients ignore several multimedia packettypes, and may lead to unrepresentative traffic patterns.
2. Logging packets at the viewer. Packets can be logged: (i)at a viewer, (ii) at a proxy, and (iii) with a packet sniffer, suchas Wireshark [22]. While using a proxy (or a packet snif-fer) is easier than modifying a viewer to log network traces,additional networking and processing latency may result indeviated packet timestamps.
3. Using official Linden servers. While private servers can beset up using the open-source OpenSim [13] implementation,doing so prevents us from capturing the actual traffic patternsin live Second Life networks.
Following these design decisions, we implement our testbed asillustrated in Fig. 1. Our testbed contains two parts: Server on theleft, and the measurement tools, including Crawler, Dispatcher, andBot Viewer, on the right. We run the tools on a PC with 2.4 GHz In-tel processor, which is connected to the Internet via a dedicated linkwith 10 Mbps bandwidth in both directions. The same link is usedfor common office applications such as emails and web browsing.Next, we present our measurement tools in details.
Crawler. We implement Crawler based on TestClient of Li-bOpenMetaverse [10]. Crawler first logins to the virtual world witha starting region. It then checks its current location and aborts ifit’s not in the specified starting region. Last, Crawler sends a querypacket to Server for the number of avatars/objects in that region.The regions are then classified into 25 classes (see Sec. 4.1 for de-tails).
Dispatcher. Dispatcher is implemented in Python and Bourneshell. Dispatcher first generates the eight scripts mentioned abovefor each considered region. The avatar starts at random location
1: Crawler collects avatar/object density of all regions and cate-gorizes them into 25 classes
2: for all Class Ci,j , where 1 ! i, j ! 5 do3: Let C! be four random regions from Ci,j
4: for all Region r in C! do
5: Dispatcher compiles eight scripts Sr
6: for all script s in Sr do7: Bot Viewer performs s8: Bot Viewer saves traces of s into files9: end for
10: end for11: end for
Figure 2: Pseudocode to collect network traces.
Table 1: Packet trace formatField Example Description
Timestamp 12834907204 Unix Time in usecProtocol UDP Transport protocolDirection in Downlink or uplinkRemote IP 216.82.23.202 IP addressRemote Port 13001 TCP/UDP portPacket Type LayerData Second Life packet typePayload Size 81 Second Life packet size
in each script. All the scripts are saved for future reference. Dis-patcher then calls Bot Viewer to follow each script and collect net-work traces.
Bot Viewer. We implement the Bot Viewer by adding twonew components: Action Injector and Message Logger, to Snow-globe [19]. After logging in a region, Action Injector reads thescript created by Dispatcher, and injects actions into Bot Viewer.Since we are doing this in the core engine of Bot Viewer, we canaccurately control the action time and collect exact location infor-mation among other useful statistics. Bot Viewer exits after eachscript is finished. We perform several sanity checks in Bot Viewer,e.g., we rerun a script if a teleportation gets rejected or a loginauthentication fails. Message Logger logs all network packets, in-cluding their timestamps, sizes, types, and remote addresses. It alsologs the avatar’s location and surrounding avatar/object density.
4.4 Trace CollectionWe systematically collect network traces of eight scripts from
100 regions with diverse characteristics. Fig. 2 shows the high-level steps used in trace collection. The for-loop starting from lines2, 4, and 6, iterate through the considered region classes, randomregions, and action scripts, respectively.
We collect network traces in two setups: uncached and cached.We consider both cases because viewer cache can significantly re-duce network traffic amount [6]. For uncached experiments, weinstruct the viewer to clean its cache before running each script.For cached experiments, we only clean the cache before runningthe first script in a region, and for each region, we repeat the eightscripts twice without cleaning the cache. The first run of the eightscripts warms up the cache, and we collect network traces duringthe second run. We started the trace collection on Aug 25, 2010.
5. TRACES
5.1 FormatTo assist readers better utilizing the traces, we processed the raw
trace files into a well-structured and concise format. The trace files
Deutsche Telekom Inc. R&D Lab USA
Testbed Implementa:on
Crawler: Command line tool, fast and lightweight
Bot: Modified GUI viewer Official GUI client, genuine network traffic Inject script Collect trace (both)
Dispatcher Python program to generate
Script for a list of region and ac:ons Bash script to drive the experiment
2/21/11 7

Deutsche Telekom Inc. R&D Lab USA
Experiment
Ac:on script: 1 min each Randomly change des:na:on/direc:on 5 :mes Within region boundary
Systemically visit 125 regions Cached and uncached Trace are processed for publica:on
Packet trace Loca:on trace Sta:s:cs trace
2/21/11 8

Deutsche Telekom Inc. R&D Lab USA
Downlink Traffic Characteris:c
Region Tokugawa, uncached High traffic volume Bandwidth thro\ling Packet type
2/21/11 9
0 200 400 600 8000
20
40
60
80
100
Throughput (kbps)
CD
F(%
)
StandYawWalkRunFlyTeleport
(a)
0 500 1000 15000
20
40
60
80
100
Packet Size (bytes)
CD
F(%
)
StandYawWalkRunFlyTeleport
(b)
0 0.05 0.1 0.15 0.20
20
40
60
80
100
Interarrival Time (seconds)
CD
F(%
)
StandYawWalkRunFlyTeleport
(c)
Figure 3: Downlink statistics of an uncached region: (a) throughput, (b) packet size, and (c) interarrival time.
0 20 40 60 800
20
40
60
80
100
Throughput (kbps)
CD
F(%
)
StandYawWalkRunFlyTeleport
(a)
0 100 200 300 400 5000
20
40
60
80
100
Packet Size (bytes)
CD
F(%
)
StandYawWalkRunFlyTeleport
(b)
0 0.05 0.1 0.15 0.20
20
40
60
80
100
Interarrival Time (seconds)
CD
F(%
)
StandYawWalkRunFlyTeleport
(c)
Figure 4: Uplink statistics of an uncached region: (a) throughput, (b) packet size, and (c) interarrival time.
0 100 200 300 4000
20
40
60
80
100
Throughput (kbps)
CD
F(%
)
StandYawWalkRunFlyTeleport
(a)
0 10 20 30 400
20
40
60
80
100
Throughput (kbps)
CD
F(%
)
StandYawWalkRunFlyTeleport
(b)
0 500 1000 15000
20
40
60
80
100
Packet Size (bytes)
CD
F(%
)
StandYawWalkRunFlyTeleport
(c)
Figure 5: Statistics of a cached region: (a) downlink throughput, (b) uplink throughput, and (c) downlink packet size.
0 200 400 600 800 10000
20
40
60
80
100
Throughtput (kbps)
CD
F(%
)
StandYawWalkRunFlyTeleport
(a)
0 500 1000 15000
20
40
60
80
100
Packet Size (bytes)
CD
F(%
)
StandYawWalkRunFlyTeleport
(b)
0 0.05 0.1 0.15 0.2 0.25 0.30
20
40
60
80
100
Interarrival Time (seconds)
CD
F(%
)
StandYawWalkRunFlyTeleport
(c)
Figure 6: Aggregated uncached downlink statistics: (a) throughput, (b) packet size, and (c) interarrival time.

Deutsche Telekom Inc. R&D Lab USA
Uplink Traffic Characteris:cs
Region Tokugawa, uncached Lower traffic Game logic only Small packet size
2/21/11 10
0 200 400 600 8000
20
40
60
80
100
Throughput (kbps)
CD
F(%
)
StandYawWalkRunFlyTeleport
(a)
0 500 1000 15000
20
40
60
80
100
Packet Size (bytes)
CD
F(%
)
StandYawWalkRunFlyTeleport
(b)
0 0.05 0.1 0.15 0.20
20
40
60
80
100
Interarrival Time (seconds)
CD
F(%
)
StandYawWalkRunFlyTeleport
(c)
Figure 3: Downlink statistics of an uncached region: (a) throughput, (b) packet size, and (c) interarrival time.
0 20 40 60 800
20
40
60
80
100
Throughput (kbps)
CD
F(%
)
StandYawWalkRunFlyTeleport
(a)
0 100 200 300 400 5000
20
40
60
80
100
Packet Size (bytes)
CD
F(%
)
StandYawWalkRunFlyTeleport
(b)
0 0.05 0.1 0.15 0.20
20
40
60
80
100
Interarrival Time (seconds)
CD
F(%
)
StandYawWalkRunFlyTeleport
(c)
Figure 4: Uplink statistics of an uncached region: (a) throughput, (b) packet size, and (c) interarrival time.
0 100 200 300 4000
20
40
60
80
100
Throughput (kbps)
CD
F(%
)
StandYawWalkRunFlyTeleport
(a)
0 10 20 30 400
20
40
60
80
100
Throughput (kbps)
CD
F(%
)
StandYawWalkRunFlyTeleport
(b)
0 500 1000 15000
20
40
60
80
100
Packet Size (bytes)
CD
F(%
)
StandYawWalkRunFlyTeleport
(c)
Figure 5: Statistics of a cached region: (a) downlink throughput, (b) uplink throughput, and (c) downlink packet size.
0 200 400 600 800 10000
20
40
60
80
100
Throughtput (kbps)
CD
F(%
)
StandYawWalkRunFlyTeleport
(a)
0 500 1000 15000
20
40
60
80
100
Packet Size (bytes)
CD
F(%
)
StandYawWalkRunFlyTeleport
(b)
0 0.05 0.1 0.15 0.2 0.25 0.30
20
40
60
80
100
Interarrival Time (seconds)
CD
F(%
)
StandYawWalkRunFlyTeleport
(c)
Figure 6: Aggregated uncached downlink statistics: (a) throughput, (b) packet size, and (c) interarrival time.

Deutsche Telekom Inc. R&D Lab USA
Effect of Cache
Region Tokugawa, cached Greatly lower traffic
2/21/11 11
0 200 400 600 8000
20
40
60
80
100
Throughput (kbps)
CD
F(%
)
StandYawWalkRunFlyTeleport
(a)
0 500 1000 15000
20
40
60
80
100
Packet Size (bytes)
CD
F(%
)
StandYawWalkRunFlyTeleport
(b)
0 0.05 0.1 0.15 0.20
20
40
60
80
100
Interarrival Time (seconds)
CD
F(%
)
StandYawWalkRunFlyTeleport
(c)
Figure 3: Downlink statistics of an uncached region: (a) throughput, (b) packet size, and (c) interarrival time.
0 20 40 60 800
20
40
60
80
100
Throughput (kbps)
CD
F(%
)
StandYawWalkRunFlyTeleport
(a)
0 100 200 300 400 5000
20
40
60
80
100
Packet Size (bytes)
CD
F(%
)
StandYawWalkRunFlyTeleport
(b)
0 0.05 0.1 0.15 0.20
20
40
60
80
100
Interarrival Time (seconds)
CD
F(%
)
StandYawWalkRunFlyTeleport
(c)
Figure 4: Uplink statistics of an uncached region: (a) throughput, (b) packet size, and (c) interarrival time.
0 100 200 300 4000
20
40
60
80
100
Throughput (kbps)
CD
F(%
)
StandYawWalkRunFlyTeleport
(a)
0 10 20 30 400
20
40
60
80
100
Throughput (kbps)
CD
F(%
)
StandYawWalkRunFlyTeleport
(b)
0 500 1000 15000
20
40
60
80
100
Packet Size (bytes)
CD
F(%
)
StandYawWalkRunFlyTeleport
(c)
Figure 5: Statistics of a cached region: (a) downlink throughput, (b) uplink throughput, and (c) downlink packet size.
0 200 400 600 800 10000
20
40
60
80
100
Throughtput (kbps)
CD
F(%
)
StandYawWalkRunFlyTeleport
(a)
0 500 1000 15000
20
40
60
80
100
Packet Size (bytes)
CD
F(%
)
StandYawWalkRunFlyTeleport
(b)
0 0.05 0.1 0.15 0.2 0.25 0.30
20
40
60
80
100
Interarrival Time (seconds)
CD
F(%
)
StandYawWalkRunFlyTeleport
(c)
Figure 6: Aggregated uncached downlink statistics: (a) throughput, (b) packet size, and (c) interarrival time.

Deutsche Telekom Inc. R&D Lab USA
Aggregated Traffic Characteris:cs
Aggregated over 125 regions, uncached, downlink In ini:al stage, ac:on has insignificant effect Packet size showed bimodel characteris:cs
2/21/11 12
0 200 400 600 8000
20
40
60
80
100
Throughput (kbps)
CD
F(%
)
StandYawWalkRunFlyTeleport
(a)
0 500 1000 15000
20
40
60
80
100
Packet Size (bytes)
CD
F(%
)
StandYawWalkRunFlyTeleport
(b)
0 0.05 0.1 0.15 0.20
20
40
60
80
100
Interarrival Time (seconds)
CD
F(%
)
StandYawWalkRunFlyTeleport
(c)
Figure 3: Downlink statistics of an uncached region: (a) throughput, (b) packet size, and (c) interarrival time.
0 20 40 60 800
20
40
60
80
100
Throughput (kbps)
CD
F(%
)
StandYawWalkRunFlyTeleport
(a)
0 100 200 300 400 5000
20
40
60
80
100
Packet Size (bytes)
CD
F(%
)
StandYawWalkRunFlyTeleport
(b)
0 0.05 0.1 0.15 0.20
20
40
60
80
100
Interarrival Time (seconds)
CD
F(%
)
StandYawWalkRunFlyTeleport
(c)
Figure 4: Uplink statistics of an uncached region: (a) throughput, (b) packet size, and (c) interarrival time.
0 100 200 300 4000
20
40
60
80
100
Throughput (kbps)
CD
F(%
)
StandYawWalkRunFlyTeleport
(a)
0 10 20 30 400
20
40
60
80
100
Throughput (kbps)
CD
F(%
)
StandYawWalkRunFlyTeleport
(b)
0 500 1000 15000
20
40
60
80
100
Packet Size (bytes)
CD
F(%
)
StandYawWalkRunFlyTeleport
(c)
Figure 5: Statistics of a cached region: (a) downlink throughput, (b) uplink throughput, and (c) downlink packet size.
0 200 400 600 800 10000
20
40
60
80
100
Throughtput (kbps)
CD
F(%
)
StandYawWalkRunFlyTeleport
(a)
0 500 1000 15000
20
40
60
80
100
Packet Size (bytes)
CD
F(%
)
StandYawWalkRunFlyTeleport
(b)
0 0.05 0.1 0.15 0.2 0.25 0.30
20
40
60
80
100
Interarrival Time (seconds)
CD
F(%
)
StandYawWalkRunFlyTeleport
(c)
Figure 6: Aggregated uncached downlink statistics: (a) throughput, (b) packet size, and (c) interarrival time.

Deutsche Telekom Inc. R&D Lab USA
Avatar/object density correla:on
Local object count affects is correlated to traffic metrics Local avatar too li\le to sta:s:cally meaningful
2/21/11 13
Table 4: Action record formatField Example Description
Type Action Record typeTimestamp 12543524234 Unix timeAction Walk 10 Action
Table 5: Statistics trace formatField Example Description
Region Morris Name of the regionCrawled Object Density 9484 Object density from CrawlerCrawled Avatar Density 10 Avatar density from CrawlerGlobal Object Density 9730.5 Mean global object density from Bot ViewerGlobal Avatar Density 14.9 Mean global avatar density from Bot ViewerLocal Object Density 181.5 Mean local object density from Bot ViewerLocal Avatar Density 3.6 Mean local avatar density from Bot Viewer
100 200 300 400 500 600100
200
300
400
500
Local Object Density
Thro
ughput
(kbps)
Samples
Cubic fitting
(a)
100 200 300 400 500 6000
0.01
0.02
0.03
0.04
Local Object Density
Inte
rarr
ival
Tim
e(s
econds)
Samples
Cubic fitting
(b)
2 4 6 8 10 12100
200
300
400
500
Local Avatar Density
Thro
ughput
(kbps)
Samples
Cubic fitting
(c)
Figure 7: Correlation between avatar/object density and traffic pattern: (a) throughput vs. local object density, (b) interarrival timevs. local object density, and (c) throughput vs. local avatar density.
network traces from virtual worlds. We used the testbed to gatherextensive traces from 100 diverse Second Life regions, which resultin more than 60 hour traffic patterns and more than 3 GB trace files.Different from the present work, most previous studies only con-sider a few regions, and more importantly, they did not make theirtraces public. We analyzed the virtual world traffic patterns usingthe collected traces. Our results are consistent with work in the lit-erature, and also reveal new insights, e.g., local avatar/object den-sity imposes clear implications on the downlink throughput. Ournetwork traces [17] can stimulate the research on virtual worlds.
8. REFERENCES[1] R. Antonello, S. Fernandes, J. Moreira, P. Cunha, C. Kamienski, and
D. Sadok. Traffic analysis and synthetic models of Second Life.Multimedia Tools and Applications, 15(1):33–47, February 2009.
[2] S. Fernandes, F. Antonello, J. Moreira, D. Sadok, and C. Kamienski.Traffic analysis beyond this world: the case of Second Life. In Proc.of ACM International Workshop on Network and Operating SystemsSupport for Digital Audio and Video (NOSSDAV’07),Urbana-Champaign, IL, June 2007.
[3] M. Ferreira and R. Morla. Second Life in-world action trafficmodeling. In Proc. of ACM International Workshop on Network andOperating Systems Support for Digital Audio and Video(NOSSDAV’10), pages 3–8, Amsterdam, The Netherlands, June 2010.
[4] Habbo Hotel official site, August 2010.http://www.habbo.com.
[5] J. Kinicki and M. Claypool. Traffic analysis of avatars in SecondLife. In Proc. of ACM International Workshop on Network andOperating Systems Support for Digital Audio and Video(NOSSDAV’08), pages 69–74, Braunschweig, Germany, May 2008.
[6] S. Kumar, J. Chhugani, K. Changkyu, D. Kim, A. Nguyen, P. Dubey,C. Bienia, and Y. Kim. Second Life and the new generation of virtualworlds. IEEE Computer, 41(9):46–53, September 2008.
[7] C. La and P. Michiardi. Characterizing user mobility in Second Life.In Proc. of ACM Workshop on Online Social Networks (WOSN’08),pages 79–84, Seattle, WA, August 2008.
[8] H. Liang, M. Motani, and W. Ooi. Textures in Second Life:Measurement and analysis. In Proc. of IEEE InternationalConference on Parallel and Distributed Systems (ICPADS’08), pages823–828, Melbourne, Australia, December 2008.
[9] H. Liang, R. Silva, W. Ooi, and M. Motani. Avatar mobility inuser-created networked virtual worlds: Measurements, analysis, andimplications. Multimedia Tools and Applications, 45(1-3):163–190,October 2009.
[10] LibOpenMetaverse official site, August 2010.http://www.libsecondlife.org.
[11] Measurement and analysis of large distributed virtual environments,August 2010. http://nemesys.comp.nus.edu.sg/projects/secondlife.
[12] I. Oliver, A. Miller, and C. Allison. Virtual worlds, real traffic:Interaction and adaptation. In Proc. of ACM conference onMultimedia systems (MMSys’10), pages 305–316, Scottsdale, AZ,February 2010.
[13] OpenSimulator official site, August 2010.http://opensimulator.org.
[14] OSgrid official site, August 2010. http://www.osgrid.org.[15] Playstation Home official site, August 2010. http:
//us.playstation.com/psn/playstation-home.[16] Second Life economic statistics, August 2010. http:
//secondlife.com/statistics/economy-data.php.[17] Second Life network traces, September 2010.
http://12.71.54.173/sl.[18] Second Life official site, August 2010.
http://secondlife.com.[19] Snowglobe official site, August 2010.
http://snowglobeproject.org.[20] M. Varvello, F. Picconi, C. Diot, and E. Biersack. Is there life in
Second Life? In Proc. of ACM International Conference onEmerging Networking Experiments and Technologies (CoNEXT’08),Madrid, Spain, December 2008.
[21] M. Varvello, F. Picconi, C. Diot, and E. Biersack. Is there life insecond life? In Proceedings of the 2008 ACM CoNEXT Conference,CoNEXT ’08, pages 1:1–1:12, New York, NY, USA, 2008. ACM.
[22] Wireshark official site, August 2010.http://www.wireshark.org.

Deutsche Telekom Inc. R&D Lab USA
References
S. Fernandes, F. Antonello, J. Moreira, D. Sadok, and C. Kamienski. Traffic analysis beyond this world: the case of Second Life. (NOSSDAV’07)
M. Ferreira and R. Morla. Second Life in-‐world ac:on traffic modeling. (NOSSDAV’10)
I. Oliver, A. Miller, and C. Allison. Virtual worlds, real traffic: Interac:on and adapta:on. (MMSys’10)
J. Kinicki and M. Claypool. Traffic analysis of avatars in Second Life. (NOSSDAV’08)
And many others, omi\ed due to space limita:on
2/21/11 14

Deutsche Telekom Inc. R&D Lab USA
Conclusion
Applica:ons: Traffic modeling
Synthe:c trace genera:on Improving QoS
Priori:ze according to packet type Gateway for mobile devices
Texture down-‐sampling
What we need: Parameterized model There is no one-‐size-‐fits-‐all model
2/21/11 15