Embed Size (px)
Citation preview
NetXplorer Report Binder
Enterprise Edition 2010

Notice of Confidentiality
This document contains proprietary information that is the sole property of Allot Communications. No part of its content may be used for any other purpose, disclosed to any party or reproduced by any means, electronic or mechanical, without the express prior written permission of Allot Communications.
Copyright © 2010 Allot Communications. All rights reserved.
Allot Communications and the Allot logo are registered trademarks of Allot Communications. All other brand or product names are trademarks of their respective holder(s). Specifications subject to change without notice.

Contents
NetXplorer Report Binder – Enterprise Edition i
Table of Contents
1 Introduction ...................................................................................................... 1
Enterprise Network Deployment Scenarios ................................................................... 1
Scenario One: Internet Access Optimization ....................................................... 1
Scenario Two: WAN Application Optimization ..................................................... 1
Scenario Three: Data Center Optimization .......................................................... 2
2 System Reports ................................................................................................ 3
Statistics Report ........................................................................................................... 6
Utilization Report .......................................................................................................... 7
NetEnforcers Report ..................................................................................................... 8
Lines Report ................................................................................................................. 9
Pipes Report ............................................................................................................... 10
Virtual Channels Report .............................................................................................. 11
Protocols Report ......................................................................................................... 12
Hosts Report .............................................................................................................. 13
Internal Hosts Report .................................................................................................. 14
External Hosts Report ................................................................................................. 15
Conversations Report ................................................................................................. 16
Average Protocol Popularity Report ............................................................................ 17
Percentile Protocol Report .......................................................................................... 18
Typical Time Report .................................................................................................... 19
Bandwidth Usage Percentile Report ............................................................................ 20
3 Services Reports ............................................................................................ 21
Integrated Services Report ......................................................................................... 22
Integrated Services Servers Report ............................................................................ 23
WebSafe Traffic Report .............................................................................................. 24
Asymmetry Traffic Report ........................................................................................... 25
HTTP (Most Active Domains) Report .......................................................................... 26
4 Special Reporting Options ............................................................................ 27
Real-time and Long-term reporting .............................................................................. 27
Information Drill-down ................................................................................................. 27
Rich Export Formats ................................................................................................... 28
Stacked Graphs .......................................................................................................... 29
Show Data by… .......................................................................................................... 30
Scheduled Reports ..................................................................................................... 30

Contents
ii NetXplorer Report Binder – Enterprise Edition
Compound Reports ..................................................................................................... 30
Report Folders ............................................................................................................ 30
Group Reports ............................................................................................................. 31

Introduction
NetXplorer Report Binder – Enterprise Edition 1
1 Introduction
The purpose of this document is to present the monitoring and reporting capabilities of Allot’s NetXplorer solution. It describes each report NetXplorer can produce, along with all available options, and explains how it can be used to gain vital insight on your network application traffic and on the behavior patterns and profiles of your network users.
Enterprise Network Deployment Scenarios
Allot’s NetXplorer solutions are typically deployed within the framework of one of three possible scenarios, depending on the desired objective – Internet access optimization, WAN application optimization or data center optimization.
Scenario One: Internet Access Optimization
In today’s fast-paced, information-driven business arena, the Internet connection is of crucial importance to most enterprises. Allot’s NetEnforcer and NetXplorer offerings are designed to maximize return on investment on enterprise Internet connections and to guarantee access to business-critical Internet resources. In this deployment scenario, NetEnforcer is placed as close as possible to the Internet gateway router (see NetEnforcer deployed between the firewall and the Internet in Figure 1), either inside or outside the firewall (if one is in use). This configuration will grant the enterprise complete visibility on how the Internet connection is being used and will provide it with full Internet access optimization control.
Scenario Two: WAN Application Optimization
All enterprises rely heavily on the performance of their business-critical WAN applications (e-mail, CRM, ERP, VoIP, etc.). In this deployment scenario, multiple NetEnforcers are typically placed as close as possible to routers throughout the WAN, and NetXplorer is installed at the corporate headquarters. This enables corporate IT managers to study traffic flowing to and from various branch offices, optimize WAN links, guarantee optimal business-critical application performance and reduce interference from non-critical or non-business-related applications (see NetEnforcers deployed next to VPN/Leased Line/MPLS routers in Figure 1).
Figure 1: Internet Access and WAN Application Optimization with NetEnforcer

2 NetXplorer Report Binder – Enterprise Edition
Scenario Three: Data Center Optimization
Many enterprises have consolidated application, e-mail, CRM and other servers into corporate data centers. While this strategy has proven cost effective for many corporations, it could actually cause more problems than it solves if the bandwidth pipes to and from the data centers are not properly managed. Placing many corporate servers behind a single link typically creates congestion on available (bandwidth) resources. In this deployment scenario, NetEnforcer is placed between corporate servers and the link connecting them to users, so as to maintain fair and logical distribution of application bandwidth to remote users.
Figure 2: Data Center Optimization with NetEnforcer

System Reports
NetXplorer Report Binder – Enterprise Edition 3
2 System Reports
This chapter presents a detailed description of the global network reports offered by NetXplorer.
The following table summarizes the network reports available. Note that each report may serve as the basis for multiple additional reports, and can be redefined to display data by different criteria (e.g. by number of packets, by number of active connections, etc.).
Report Description Page
Statistics Report A network report that displays the total inbound and outbound traffic passing through all NetEnforcers.
Page 6
Utilization Report
A report that displays how much of the bandwidth available to an object (line/pipe/virtual channel) is being used
Page 7
NetEnforcers Report
A network report that displays total bandwidth usage either on a single NetEnforcer or across multiple NetEnforcers.
Page 8
Lines Report A report that displays the total traffic passing through a particular line (or through particular lines).
Page 9
Pipes Report A report that displays the total traffic passing through a particular pipe, or the most active pipes.
Page 10
Virtual Channels Report
A report that displays the total traffic passing through particular virtual channels, or the most active VCs.
Page 11
Protocols Report A report that displays traffic breakdown by protocol/application.
Page 12

System Reports
4 NetXplorer Report Binder – Enterprise Edition
Report Description Page
Hosts Report A report that displays the most active hosts on both sides of the NetEnforcer(s), or the distribution of traffic over time between different hosts.
Page 13
Internal Hosts Report
A report that displays the most active hosts on the internal side of the NetEnforcer(s), or the distribution of traffic over time between different hosts.
Page 14
External Hosts Report
A report that displays the most active hosts on the external side of the NetEnforcer(s), or the distribution of traffic over time between different hosts.
Page 15
Conversations Report
A report that displays the most active conversations between two hosts, by bandwidth.
Page 16
Average Protocol Popularity Report
A report that displays the popularity of a particular application (or applications), as per the number of hosts using it.
Page 17
Percentile Protocol Report
A report that displays the most active protocols by percentile, the number of hosts using those protocols (applications) and the average bandwidth used by the network users (hosts).
Page 18
Protocol Popularity (accessible as a drill-down option)
A drill-down option of the Average Protocol Popularity Report; enables generation of reports that display the most active protocols, as per the number of network users utilizing them.
Page 17
Typical Time Report
A report designed to present application/user behavior over a particular time window. The majority of long-term reports may be generated as typical time reports.
Page 19

System Reports
NetXplorer Report Binder – Enterprise Edition 5
Report Description Page
Bandwidth Usage Percentile Report
A report that displays the average bandwidth used by hosts within a specific percentile group.
Page 20

System Reports
6 NetXplorer Report Binder – Enterprise Edition
Statistics Report
Description: a report capable of providing a consolidated view of various traffic statistics. It can present the total inbound and outbound traffic passing through any entity (network, NetEnforcer, line, pipe, VC), as well as the number of connections generated, and even dropped connections (in case drop/reject is included in the policy).
What it’s useful for: this report displays a consolidated view of data collected from either all NetEnforcers or from specific NetEnforcers on the Network, and can assist in observing global changes in corporate throughput – both inbound and outbound. It is relevant to all three deployment scenarios (see Enterprise Network Deployment Scenarios on page 1). For example, when performing Internet access optimization, the report will provide network administrators with a real-time view of the amount of traffic moving to and from the Internet. Additional application or user-specific information may also be drilled down into.
Available presentation styles: line chart, tabular data display.
Real-time/long-term report mode availability:
Information drill-down: NetEnforcers, lines, pipes, virtual channels, protocols, hosts, internal hosts, (optional/disabled by default: external hosts, conversations, protocol popularity).
Data display options: by total bandwidth, inbound bandwidth, outbound bandwidth, inbound packets, outbound packets, live connections, new connections, dropped connections.
Figure 3: Statistics Report (with Optional Tabular Display)

System Reports
NetXplorer Report Binder – Enterprise Edition 7
Utilization Report
Description: displays utilization percentage on a particular line, pipe or virtual channel. This report is available at line level and down.
What it’s useful for: this report is useful to understanding how busy a particular line, pipe or virtual channel is, and to determining how much spare room may be available. Utilization is displayed as a percentage of the maximum set on the particular line, pipe or virtual channel. Should 90% utilization be reached, the remaining 10% are highlighted in a dark orange shade to alert administrators to the fact that the relevant entity is nearing full utilization.
Available presentation styles: stacked bar chart, tabular data display.
Real-time/long-term report mode availability:
Information drill-down: statistics, virtual channels, protocols, hosts, internal hosts (optional/disabled by default: external hosts, conversations , protocol popularity).
Data display options: by utilization.
Figure 4: Pipe Utilization Report (with Optional Tabular Display)

System Reports
8 NetXplorer Report Binder – Enterprise Edition
NetEnforcers Report
Description: displays total bandwidth usage, either on a single NetEnforcer or across multiple NetEnforcers, and can be used to pinpoint the most active NetEnforcer.
What it’s useful for: this report is useful for WAN application optimization in that it enables network administrators to determine application traffic loads at various points throughout the network by viewing the traffic flowing through either specific or multiple NetEnforcers.
Available presentation styles: bar chart, pie chart, line chart, stack area chart, tabular data display.
Real-time/long-term report mode availability:
Information drill-down: statistics, lines, pipes, virtual channels, protocols, hosts, internal hosts(optional/disabled by default: external hosts, conversations , protocol popularity).
Data display options: by total bandwidth, percentage of total bandwidth, inbound bandwidth, outbound bandwidth.
Figure 5: NetEnforcers Report (with Optional NetEnforcer Distribution Display)

System Reports
NetXplorer Report Binder – Enterprise Edition 9
Lines Report
Description: displays the total traffic passing through a particular line(s).
What it’s useful for: this report is useful when a multiple line policy (i.e. a policy utilizing all 3 NetEnforcer hierarchy levels) is defined. Reports may be grouped together (presenting data from select NetEnforcers/lines) and results stacked (in this case, by protocol).
Available presentation styles: bar chart, pie chart, line chart, stack area chart, tabular data display.
Real-time/long-term report mode availability:
Information drill-down: pipes, virtual channels, protocols, hosts, internal hosts(optional/disabled by default: external hosts, conversations, protocol popularity).
Data display options: by total bandwidth, percentage of total bandwidth, inbound bandwidth, outbound bandwidth.
Figure 6: Lines Report (with Optional Line Distribution Display)

System Reports
10 NetXplorer Report Binder – Enterprise Edition
Pipes Report
Description: displays the total traffic passing through a particular pipe(s).
What it’s useful for: pipes are most often used to represent remote or regional sites. The Pipes report is typically useful for WAN application optimization in that it enables the administrator to view traffic on any individual pipe or link to a remote site. Information drill-down options then enable the administrator to perform closer examination of individual sites (or pipes).
Available presentation styles: bar chart, pie chart, line chart, stack area chart, tabular data display.
Real-time/long-term report mode availability:
Information drill-down: statistics, utilization, virtual channels, protocols, hosts, internal hosts (optional/disabled by default: external hosts, conversations, protocol popularity).
Data display options: by total bandwidth, percentage of total bandwidth, inbound bandwidth, outbound bandwidth.
Figure 7: Pipes Report (with Optional Pipe Distribution Display)

System Reports
NetXplorer Report Binder – Enterprise Edition 11
Virtual Channels Report
Description: displays the total traffic passing through particular virtual channels.
What it’s useful for: virtual channels are most commonly used to monitor and control individual applications. This report enables each virtual channel to be monitored individually, and can prove useful in all enterprise network deployment scenarios. For example, if users at a particular site are complaining about the performance of a specific application, the network administrator can use this report when performing WAN application optimization to zoom in on the virtual channel representing that particular application and check its current performance.
Available presentation styles: bar chart, pie chart, line chart, stack area chart, tabular data display.
Real-time/long-term report mode availability:
Information drill-down: statistics, utilization, protocols, hosts, internal hosts (optional/disabled by default: external hosts, conversations, protocol popularity).
Data display options: by total bandwidth, percentage of total bandwidth, inbound bandwidth, outbound bandwidth.
Figure 8: Virtual Channels Report (with Optional Virtual Channel Distribution Display)
System Reports
12 NetXplorer Report Binder – Enterprise Edition
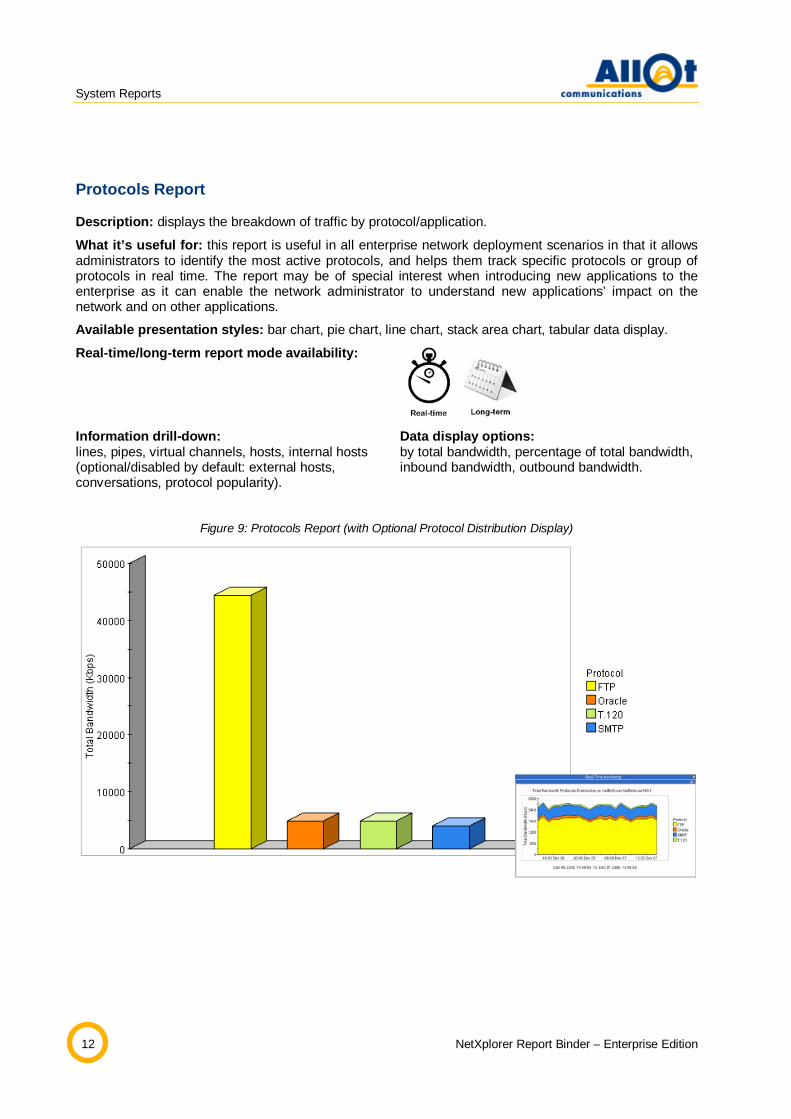
Protocols Report
Description: displays the breakdown of traffic by protocol/application.
What it’s useful for: this report is useful in all enterprise network deployment scenarios in that it allows administrators to identify the most active protocols, and helps them track specific protocols or group of protocols in real time. The report may be of special interest when introducing new applications to the enterprise as it can enable the network administrator to understand new applications’ impact on the network and on other applications.
Available presentation styles: bar chart, pie chart, line chart, stack area chart, tabular data display.
Real-time/long-term report mode availability:
Information drill-down: lines, pipes, virtual channels, hosts, internal hosts (optional/disabled by default: external hosts, conversations, protocol popularity).
Data display options: by total bandwidth, percentage of total bandwidth, inbound bandwidth, outbound bandwidth.
Figure 9: Protocols Report (with Optional Protocol Distribution Display)

System Reports
NetXplorer Report Binder – Enterprise Edition 13
Hosts Report
Description: displays the most active hosts or distribution of specific hosts over time on both sides of a NetEnforcer(s)/Line(s)/Pipe(s)/Virtual Channel(s).
What it’s useful for: this report is useful in all enterprise network deployment scenarios in that it enables administrators to identify the clients and/or the servers generating the most traffic. For example, it could help track down a bandwidth hog or a server that happens to be acting up in the corporate data center.
Available presentation styles: bar chart, pie chart, line chart, stack area chart, tabular data display.
Real-time/long-term report mode availability:
Information drill-down: no drill down is available for this report.
Data display options: by total bandwidth, inbound bandwidth, outbound bandwidth.
Figure 10: Hosts Report

System Reports
14 NetXplorer Report Binder – Enterprise Edition
Internal Hosts Report
Description: displays the most active hosts or distribution of hosts over time on the internal side of the NetEnforcer(s).
What it’s useful for: this report is useful in all enterprise network deployment scenarios in that it enables administrators to identify the internal clients and/or servers generating the most traffic. For example, it could help track down a virus- or malware-infected PC.
Available presentation styles: bar chart, pie chart, line chart, stack area chart, tabular data display.
Real-time/long-term report mode availability:
Information drill-down: lines, pipes, virtual channels, protocols, external hosts, conversations, protocol popularity.
Data display options: by total bandwidth, inbound bandwidth, outbound bandwidth.
Figure 11: Internal Hosts Report

System Reports
NetXplorer Report Binder – Enterprise Edition 15
External Hosts Report
Description: displays the most active hosts or distribution of hosts over time on the external side of the NetEnforcer(s). Note that this report and the “External Hosts” drill-down options on other reports are disabled by default, so as to avoid database loads and management overhead, and may be enabled by the network administrator.
What it’s useful for: this report is useful in all enterprise network deployment scenarios in that it enables administrators to identify the external clients and/or servers generating the most traffic. For example, when performing Internet access optimization, it could be used to determine the most popular Web sites being accessed by employees.
Available presentation styles: bar chart, pie chart, line chart, stack area chart, tabular data display.
Real-time/long-term report mode availability:
Information drill-down: lines, pipes, virtual channels, protocols, internal hosts, conversations, protocol popularity.
Data display options: by total bandwidth, inbound bandwidth, outbound bandwidth.
Figure 12: Real-time External Hosts Report
System Reports
16 NetXplorer Report Binder – Enterprise Edition
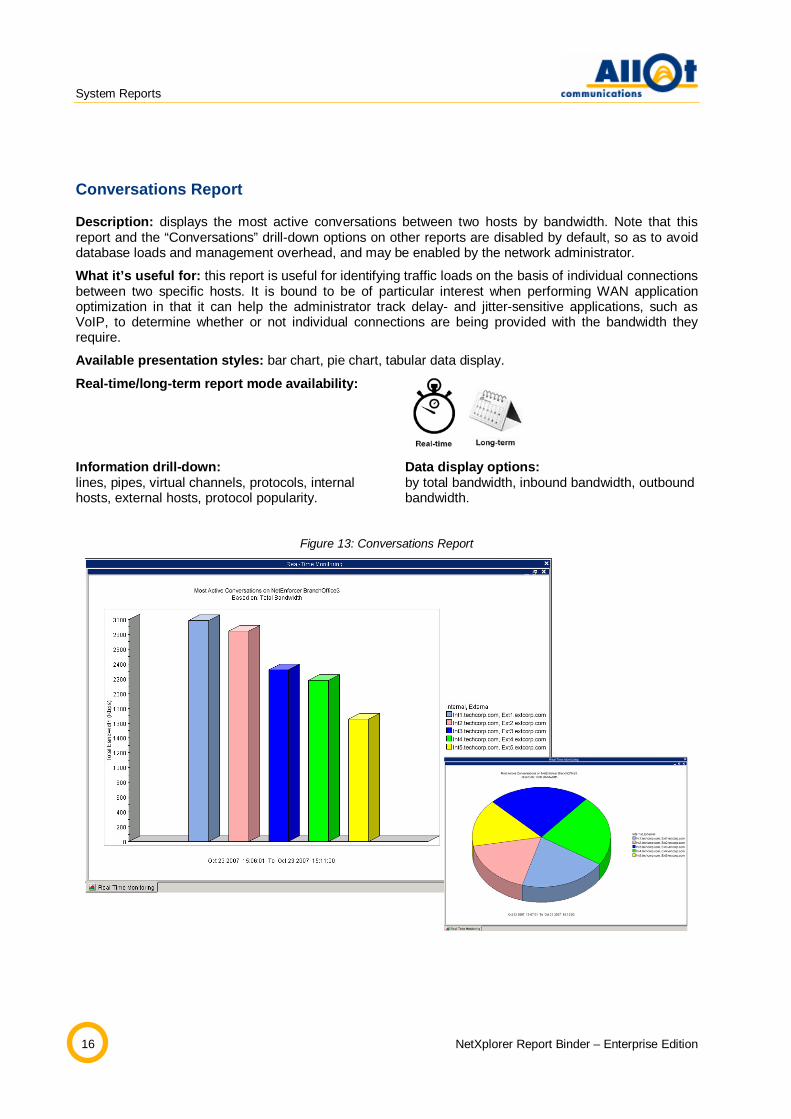
Conversations Report
Description: displays the most active conversations between two hosts by bandwidth. Note that this report and the “Conversations” drill-down options on other reports are disabled by default, so as to avoid database loads and management overhead, and may be enabled by the network administrator.
What it’s useful for: this report is useful for identifying traffic loads on the basis of individual connections between two specific hosts. It is bound to be of particular interest when performing WAN application optimization in that it can help the administrator track delay- and jitter-sensitive applications, such as VoIP, to determine whether or not individual connections are being provided with the bandwidth they require.
Available presentation styles: bar chart, pie chart, tabular data display.
Real-time/long-term report mode availability:
Information drill-down: lines, pipes, virtual channels, protocols, internal hosts, external hosts, protocol popularity.
Data display options: by total bandwidth, inbound bandwidth, outbound bandwidth.
Figure 13: Conversations Report

System Reports
NetXplorer Report Binder – Enterprise Edition 17
Average Protocol Popularity Report
Description: displays the popularity of a particular application (or applications), as per the number of network users utilizing it. This report is available on the network or device level only.
What it’s useful for: this report is useful to understanding how many users on average utilize a particular application. This information can be correlated with the amount of bandwidth consumed by each individual application.
Available presentation styles: bar chart, pie chart, tabular data display.
Real-time/long-term report mode availability:
Information drill-down: lines, pipes, virtual channels, hosts, internal hosts, external hosts.
Data display options: by internal hosts.
Figure 14: Average Protocol Popularity Report

System Reports
18 NetXplorer Report Binder – Enterprise Edition
Percentile Protocol Report
Description: displays the most active protocols by percentile, the number of users using those protocols (applications) and the average bandwidth used by the hosts. For example, the report in Figure 15 below shows that within the 95-100 percentile group, there are 84 users using RapidShare at an average rate of 80 Kbps.
What it’s useful for: the Percentile Protocol report can be used to study the average bandwidth used by network users in applications within a specific percentile group.
Available presentation styles: bar chart, pie chart, tabular data display.
Real-time/long-term report mode availability:
Information drill-down: no drill down is available for this report.
Data display options: by host bandwidth usage percentile.
Figure 15: Percentile Protocol Report (with Optional Pie Chart Display)

System Reports
NetXplorer Report Binder – Enterprise Edition 19
Typical Time Report
Description: displays application/user behavior over a specific time window. Most of the reports described in this chapter may be generated as typical time reports.
What it’s useful for: this report can be used to understand usage trends across the network during recurring time periods that are of particular interest to the corporate IT department. Typical time windows may be set up to reflect regular business hours (Mondays to Fridays, 9:00am to 5:00pm – allowing, for example, the network administrator to study network user behavior during peak times as opposed to off work hours), inventory count days (last two days of the month), weekends or other desired time periods. The reports presented in Figure 16 below displays “typical week” throughput on selected virtual channels during a single week.
Available presentation styles: bar chart, pie chart, line chart, stack area chart, tabular data display.
Real-time/long-term report mode availability:
Information drill-down: statistics, utilization, protocols, hosts, subscribers, internal hosts (optional/disabled by default: external hosts, conversations, protocol popularity).
Data display options: by total bandwidth, percentage of total bandwidth, inbound bandwidth, outbound bandwidth.
This report may be viewed by volume/rate.
Figure 16: Typical Time Report – One Week Reporting Period
20 NetXplorer Report Binder – Enterprise Edition
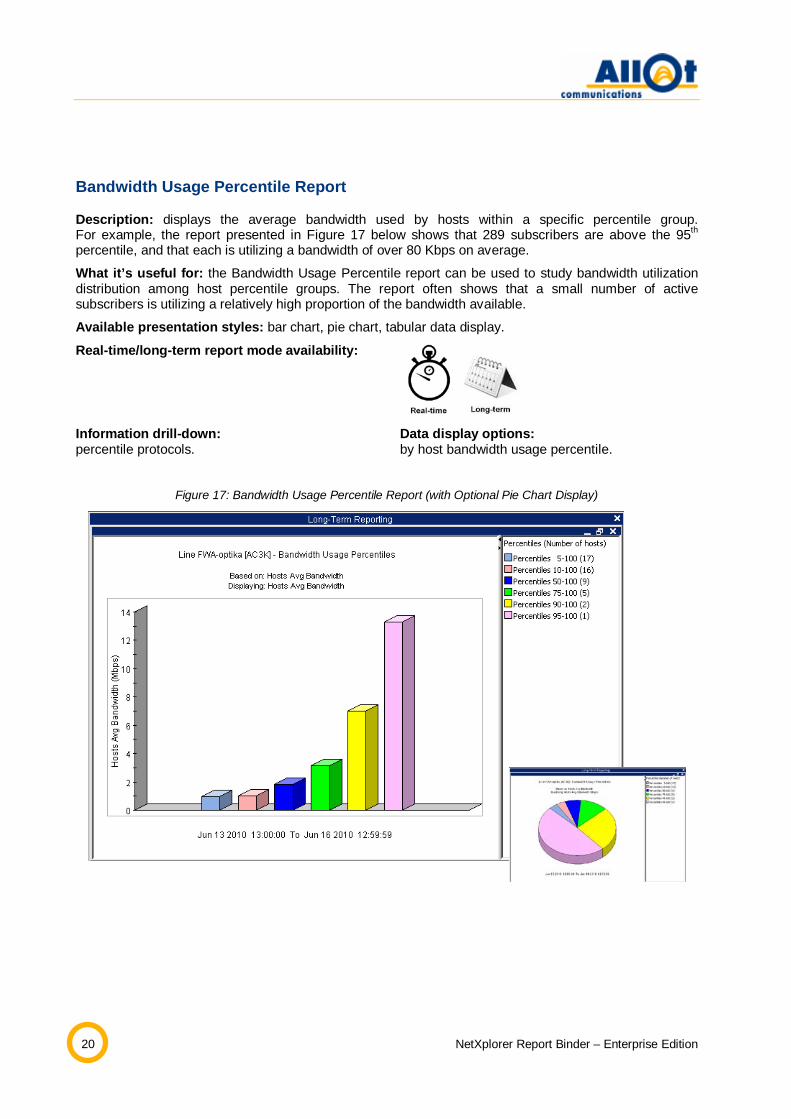
Bandwidth Usage Percentile Report
Description: displays the average bandwidth used by hosts within a specific percentile group. For example, the report presented in Figure 17 below shows that 289 subscribers are above the 95th percentile, and that each is utilizing a bandwidth of over 80 Kbps on average.
What it’s useful for: the Bandwidth Usage Percentile report can be used to study bandwidth utilization distribution among host percentile groups. The report often shows that a small number of active subscribers is utilizing a relatively high proportion of the bandwidth available.
Available presentation styles: bar chart, pie chart, tabular data display.
Real-time/long-term report mode availability:
Information drill-down: percentile protocols.
Data display options: by host bandwidth usage percentile.
Figure 17: Bandwidth Usage Percentile Report (with Optional Pie Chart Display)

Services Reports
NetXplorer Report Binder – Enterprise Edition 21
3 Services Reports
This chapter presents a detailed description of the services-related reports offered by NetXplorer.
The following table summarizes the services reports available. Note that each report may serve as the basis for multiple additional reports, and can be redefined to display data by different criteria (e.g. by bandwidth consumption, by number of active connections, by number of packets, etc.).
Report Description Page
Integrated Services Report
A report that displays the traffic routed to the various integrated services deployed.
Page 22
Integrated Services Servers Report
A report that displays the traffic routed to the particular integrated services stacked by the most active servers (a service may include one or more sub-entities/servers).
Page 23
WebSafe Traffic Report (requires that WebSafe be enabled)
A report that displays the number of HTTP requests or illegal URLs inspected per second over time, in accordance with the element selected (network or specific device).
Page 24
Asymmetry Traffic Report
A report that displays asymmetric statistics for the selected device.
Page 25
HTTP (Most Active Domains) Report
A report that displays the most active domain names accessed by network users for selected devices or policy entities.
Page 26

Services Reports
22 NetXplorer Report Binder – Enterprise Edition
Integrated Services Report
Description: this report displays the traffic routed to the various integrated services deployed in an enterprise network. The report can be presented in two ways, as follows:
• Most active integrated services: a bar/pie chart showing the most active integrated services.
• Integrated service distribution: presents detailed information on a particular service (or services) over a selected period of time.
The Integrated Services report is available at the network or device level only.
What it’s useful for: this report is useful to identifying the volume of traffic redirected to integrated services. It helps network administrator to perform intelligent capacity planning for deployed services.
Available presentation styles: bar chart, pie chart, line chart, stack area chart, tabular data display.
Real-time/long-term report mode availability:
Information drill-down: no drill down is available for this report.
Data display options: by total bandwidth, inbound bandwidth, outbound bandwidth, live connections.
Figure 18: Integrated Services Report (with Optional Integrated Service Distribution Display)

Services Reports
NetXplorer Report Binder – Enterprise Edition 23
Integrated Services Servers Report
Description: this report presents how the traffic routed to a specific integrated service is divided up between the servers used by this service. The report can be presented in two ways, as follows:
• Most active integrated servers: a bar/pie chart showing the most active servers for the selected integrated service.
• Integrated services servers distribution: displays detailed server information for a particular service (or services) over a selected period of time. This report is also available as a drill-down option from the Integrated Services report.
What it’s useful for: this report offers the information on how routed traffic is divided up between different servers associated with a particular service, enabling them to configure (via the NetXplorer GUI) efficient load balancing between servers.
Available presentation styles: bar chart, pie chart, line chart, stack area chart, tabular data display.
Real-time/long-term report mode availability:
Information drill-down: no drill down is available for this report.
Data display options: by total bandwidth, inbound bandwidth, outbound bandwidth, live connections.
Figure 19: Integrated Services Server Distribution Report

Services Reports
24 NetXplorer Report Binder – Enterprise Edition
WebSafe Traffic Report
Description: this report, which is available at the device or network level, presents the number of inspected requests and illegal URLs encountered per second.
What it’s useful for: this report offers service providers an indication of the number of illegal requests blocked by the Allot WebSafe service and allows them to perform intelligent capacity planning for WebSafe servers.
Available presentation styles: line chart, stack area chart, tabular data display.
Real-time/long-term report mode availability:
Information drill-down: no drill down is available for this report.
Data display options: by number of illegal URLs.
Figure 20: WebSafe Traffic Report - Inspected URL Requests

Services Reports
NetXplorer Report Binder – Enterprise Edition 25
Asymmetry Traffic Report
Description: in some network topologies, traffic flows belonging to the same connection may be routed upstream and downstream via different devices (these flows are referred to as asymmetric flows, or asymmetric traffic). This leads to a situation where a single device sees one flow of the connection while another, remotely located NetEnforcer sees the complementary flow belonging to the same connection. The Asymmetry Traffic report displays an over-time distribution graph that presents – for a selected device – its asymmetric traffic statistics as opposed to those of each other device in the asymmetry group.
What it’s useful for: this report is useful to identifying the volume of asymmetric traffic in the network, which is important for precise protocol inspection and identification.
Available presentation styles: line chart, stack area chart, tabular data display.
Real-time/long-term report mode availability:
Information drill-down: lines, pipes, virtual channels, hosts, internal hosts, external hosts, integrated services, integrated services servers, asymmetry traffic, WebSafe traffic, HTTP, bandwidth usage percentiles.
Data display options: by inbound asymmetry bandwidth, outbound asymmetry bandwidth, number of asymmetry sessions.
Figure 21: Asymmetry Traffic Report

26 NetXplorer Report Binder – Enterprise Edition
HTTP (Most Active Domains) Report
Description: this report displays the most accessed domains for policy entities (lines/pipes/VC), on which HTTP monitoring is selected as an action (when working in “policy based mode”), or for all policy entities (when working in “always enabled” mode).
What it’s useful for: this report is useful in that it helps network administrators understand employees’ Web surfing habits.
Available presentation styles: bar chart, pie chart, tabular data display.
Real-time/long-term report mode availability:
Information drill-down: no drill down is available for this report.
Data display options: By inbound bandwidth, outbound bandwidth, live connections, new connections, in packets, out packets.
Figure 22: HTTP (Most Active Domains) Report

Special Reporting Options
NetXplorer Report Binder – Enterprise Edition 27
4 Special Reporting Options
The features described in this chapter apply to all reports and may be accessed via the NetXplorer user interface.
Real-time and Long-term reporting
NetXplorer enables current (real-time) and historical (long-term) network views, by providing two separate monitoring mechanisms, as follows:
• Real-time monitoring provides a real-time, multidimensional view of network traffic at a resolution as detailed as 30 second intervals. Real-time monitoring is typically used to view and troubleshoot events on the network as they occur.
• Long-term reporting offers an extended, multi-faceted display of the network over configurable periods of time, in resolutions ranging from hours, days and weeks, and all the way up to 12-month spans. Long-term reports, which can be viewed by data or traffic rate, are typically used by operators’ Planning and Operations departments to determine usage trends, predict problems even before they occur, and enforce capacity control on network links, applications and users.
Information Drill-down
Most reports offer the option of drilling down deeper into the information presented. A network administrator would typically start off by reviewing the “big picture”, and would then be able to drill down further, to reveal additional details on a subset of the information presented. For example, after generating a report on SAP protocol usage uring the most recent 6 months, the network administrator can right-click the report to activate a context-sensitive pop-up menu that enables further drill-down into the specific network entities responsible for this usage (such as top internal hosts, conversations, etc.).

Special Reporting Options
28 NetXplorer Report Binder – Enterprise Edition
Rich Export Formats
All NetXplorer reports can easily be exported in a variety of rich formats. Export options supported include such standard image formats as JPEG and PNG, as well as the more versatile HTML, XML and CSV formats.
Figure 23: Exporting a Report in a Variety of Rich Formats
Figure 24: Sample CSV Export
NetXplorer’s export formats enable easy integration with external reporting and accounting systems. While available in both real-time and long-term reports, they are typically used for long-term monitoring purposes.

Special Reporting Options
NetXplorer Report Binder – Enterprise Edition 29
Stacked Graphs
NetXplorer reports may not only be configured to display information with a network-wide perspective, but may also be stacked to present desired information relating to either individual network entities (NetEnforcers, lines, pipes, virtual channels, hosts, etc.) or entire groups of network entities.
For example, an network administrator may stack real-time protocol reports by internal hosts (subscribers) to produce a consolidated view of the protocols used by individual subscribers on the network (see Figure 25).
Figure 25: Real-time Protocol Report Stacked by Internal Hosts
Stacked graphs can be used to achieve a truly multidimensional view, so that reports not only present overall bandwidth usage, but are also broken down by desired criteria, such as most popular protocols (applications), top users and others. For example, the report shown in Figure 26 below not only presents virtual channel utilization in terms of overall bandwidth usage, but is also broken down to show the respective amount of bandwidth used by individual protocols.
Figure 26: Virtual Channel Usage Report Stacked by Protocols (Applications)
Special Reporting Options
30 NetXplorer Report Binder – Enterprise Edition
Show Data by…
Most graphs can be viewed not only by bandwidth, but also by other criteria, such as packets per second or live connections. Additionally, long-term bandwidth reports can be viewed by data volume or rate.
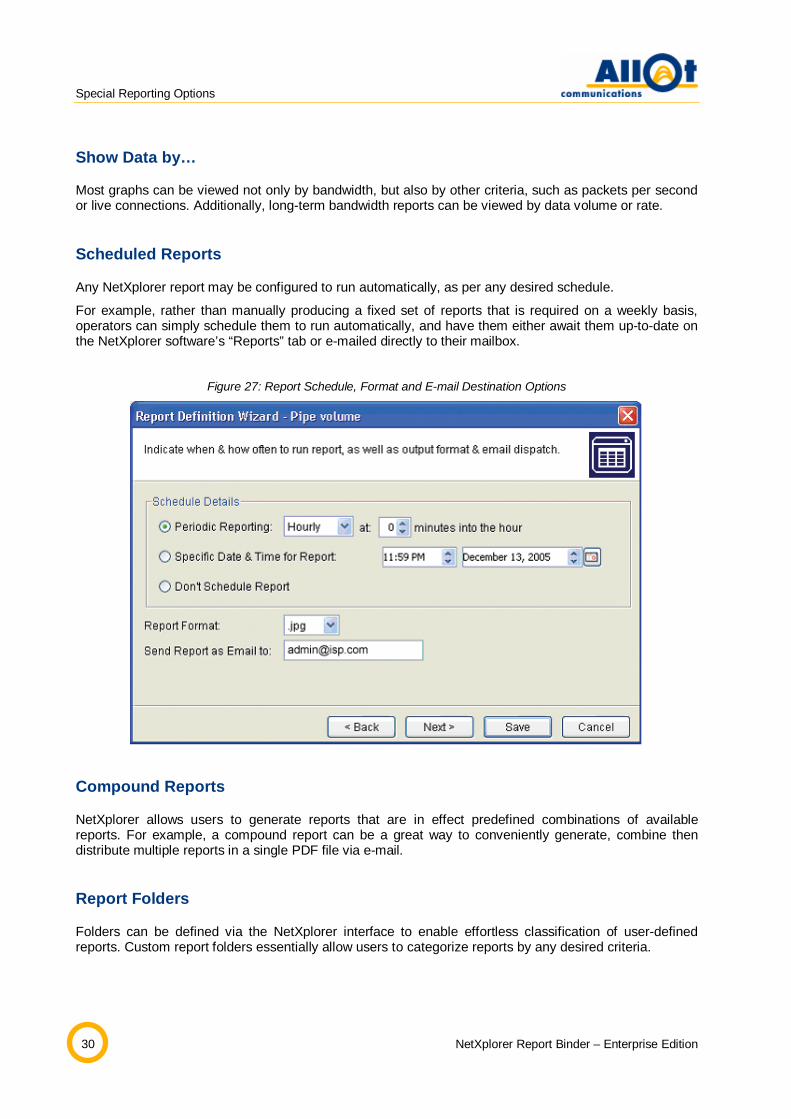
Scheduled Reports
Any NetXplorer report may be configured to run automatically, as per any desired schedule.
For example, rather than manually producing a fixed set of reports that is required on a weekly basis, operators can simply schedule them to run automatically, and have them either await them up-to-date on the NetXplorer software’s “Reports” tab or e-mailed directly to their mailbox.
Figure 27: Report Schedule, Format and E-mail Destination Options
Compound Reports
NetXplorer allows users to generate reports that are in effect predefined combinations of available reports. For example, a compound report can be a great way to conveniently generate, combine then distribute multiple reports in a single PDF file via e-mail.
Report Folders
Folders can be defined via the NetXplorer interface to enable effortless classification of user-defined reports. Custom report folders essentially allow users to categorize reports by any desired criteria.

Special Reporting Options
NetXplorer Report Binder – Enterprise Edition 31
Group Reports
NetXplorer reports may be generated to represent either the network level (i.e. reports reflect information collected from multiple NetEnforcers) or individual NetEnforcers.
They may also be configured to group together different objects (lines, pipes or virtual channels) from different parts of the network (i.e. from different NetEnforcers deployed throughout the network). This can be useful in gaining insight at a global level. For example, generating the report on total Web Browsing could be achieved by simply combining data on Web Browsing traffic from each NetEnforcer located at branches within a single group report. This option provides powerful means for gaining global or network-wide insight on application and user behavior.

About Allot Communications
Allot Communications (NASDAQ: ALLT) is a leading provider of intelligent IP Service Optimization solutions for DSL, wireless and mobile broadband carriers, service providers and enterprises. Allot's rich portfolio of hardware platforms and software applications utilize deep packet inspection (DPI) technology to transform broadband pipes into smart networks that can rapidly and efficiently deploy value added Internet services. Allot's scalable, carrier-grade solutions provide the visibility, application control and subscriber management that are vital to managing Internet service delivery, guaranteeing quality of experience (QoE), containing operating costs and maximizing revenue in broadband networks. For more information, please visit www.allot.com.
www.allot.com [email protected]
• Americas: 300 TradeCenter, Suite 4680 Woburn, MA 01801 USA Toll free: 1 (877) 255 6826; Tel.: 1 (781) 939 9300;Fax: 1 (781) 939 9393
• Europe: NCI-Les Centres d'Affaires Village d'Entreprises, 'Green Side' 400 Avenue Roumanille, BP309 06906 Sophia Antipolis, Cedex France Tel.: 33 (0) 4 93 001167; Fax: 33 (0) 4 93 001165
• Asia Pacific: 6 Ubi Road 1, Wintech Centre 6-12, Singapore 408726 Tel.: 65 6841 3020; Fax: 65 6747 9137
• Japan: Kanda Surugadai 4-2-3-301 Chiyoda-ku, Tokyo 101-0062 Japan Tel.: 81 3 5297 7668; Fax: 81 3 5297 7669
• Middle East & Africa: 22 Hanagar Street, Industrial Zone B, Hod Hasharon, 45240 Israel Tel.: 972 (9) 761 9200; Fax: 972 (9) 744 3626