Embed Size (px)
Citation preview

NEURAL CORRELATES OF REPETITIVE BEHAVIOR IN AUTISM
SPECTRUM DISORDER
_______________
A Thesis
Presented to the
Faculty of
San Diego State University
_______________
In Partial Fulfillment
of the Requirements for the Degree
Master of Arts
in
Psychology
_______________
by
Angela Abbott
Fall 2013

iii
Copyright © 2013
by
Angela Abbott
All Rights Reserved

iv
ABSTRACT OF THE THESIS
Neural Correlates of Repetitive Behavior in Autism Spectrum
Disorder
by
Angela Abbott
Master of Arts in Psychology
San Diego State University, 2013
Autism spectrum disorder (ASD) is a heterogeneous neurodevelopmental disorder
associated with repetitive behavior (RB), which may impair daily functioning at a lower-
order sensorimotor level (e.g. rocking back and forth) and a higher-order cognitive level (e.g.
adherence to a routine). Evidence for brain abnormalities involved in RB is shown in
volumetric studies indicating basal ganglia enlargement and functional studies indicating
altered corticostriatal circuitry. Connectivity differences in the default mode network
(DMN), involved in self-referential, baseline ‘resting-state,’ and the salience network (SN),
involved in inhibitory functioning and directing attentional resources, may also have a role in
RB symptoms. To investigate patterns of connectivity underlying RB in ASD, the current
study examined two regions of interest (ROIs) in the striatum (dorsal caudate nucleus, dorsal
caudal putamen), two in the SN (anterior insula, dorsal anterior cingulate cortex), and two in
the DMN (ventral medial prefrontal and posterior cingulate cortex). Archival resting state
functional magnetic resonance imaging (fMRI) data and repetitive behavior scores were
obtained for overall 66 participants (35 ASD, 31 typically developing [TD]). Imaging data
were motion-corrected and preprocessed using spatial smoothing, band-pass filtering and
removal of nuisance regressors, including 6 rigid-body motion parameters and their
derivatives, white matter and ventricular signals and their derivatives, and physiological time
series. Average blood oxygen level dependent (BOLD) time series were extracted for each
region of interest in each participant and correlated with all other voxels in the brain in a
whole-brain analysis. The resulting Pearson’s correlation values were standardized using
Fisher’s r-to-z transformation. One- and two-sample t-tests were then used to examine
functional connectivity within and between groups. Results showed similar patterns of
within-group functional connectivity; however, in between-group comparisons, mixed
findings emerged with the ASD group showing mixed patterns of both over- and
underconnectivity for each seed, except for the SN and dorsal caudate nucleus, for which
only underconnectivity was detected. Clusters showing significant group differences in
connectivity (mean z’ converted from BOLD signal correlations) were then correlated with
cumulative total RB scores, using the Repetitive Behavior Scale–Revised along with separate
cognitive and motor RB subscales, and several areas in which underconnectivity was
associated with higher RB scores were found. Finally, network connectivity was assessed by
calculating the correlation between time series for each ROI pair in each participant,
separately for each group. Only the putamen and caudate nucleus ROI pair emerged as
significant, with overconnectivity in the ASD group. Analyses conducted within the ASD
group showed increased connectivity of the putamen, primarily with the DMN, correlating

v
with fewer RB symptoms. Furthermore, increased connectivity between the SN and DMN
was associated with decreased symptom severity on the cognitive subscore of the Social
Responsiveness Scale, a measure highly correlated with the RBS–R. Overall, results suggest
that functional connectivity of the DMN, putamen, and – to a lesser extent – the salience
network are associated with symptom severity and repetitive behaviors in ASD. Patterns of
connectivity were largely decreased within networks and increased between networks,
emphasizing the need for further examination of the segregation and interaction of separate
functional networks in relation to characteristics of ASD.
vi
TABLE OF CONTENTS
PAGE
ABSTRACT ............................................................................................................................. iv
LIST OF TABLES ................................................................................................................. viii
LIST OF FIGURES ................................................................................................................. ix
ACKNOWLEDGEMENTS .......................................................................................................x
CHAPTER
1 INTRODUCTION .........................................................................................................1
Repetitive Behavior In ASD ....................................................................................1
Neural Abnormalities and RB ..................................................................................2
Functional Connectivity ...........................................................................................3
Corticostriatal Circuitry ...........................................................................................4
Neural Networks and RB .........................................................................................6
Objectives and Hypotheses ......................................................................................8
2 METHODS ....................................................................................................................9
Participants ...............................................................................................................9
Scales and Instruments .............................................................................................9
MRI Data Acquisition ............................................................................................11
fMRI Data Preprocessing .......................................................................................11
Regions of Interest .................................................................................................12
FcMRI Data Analysis ............................................................................................13
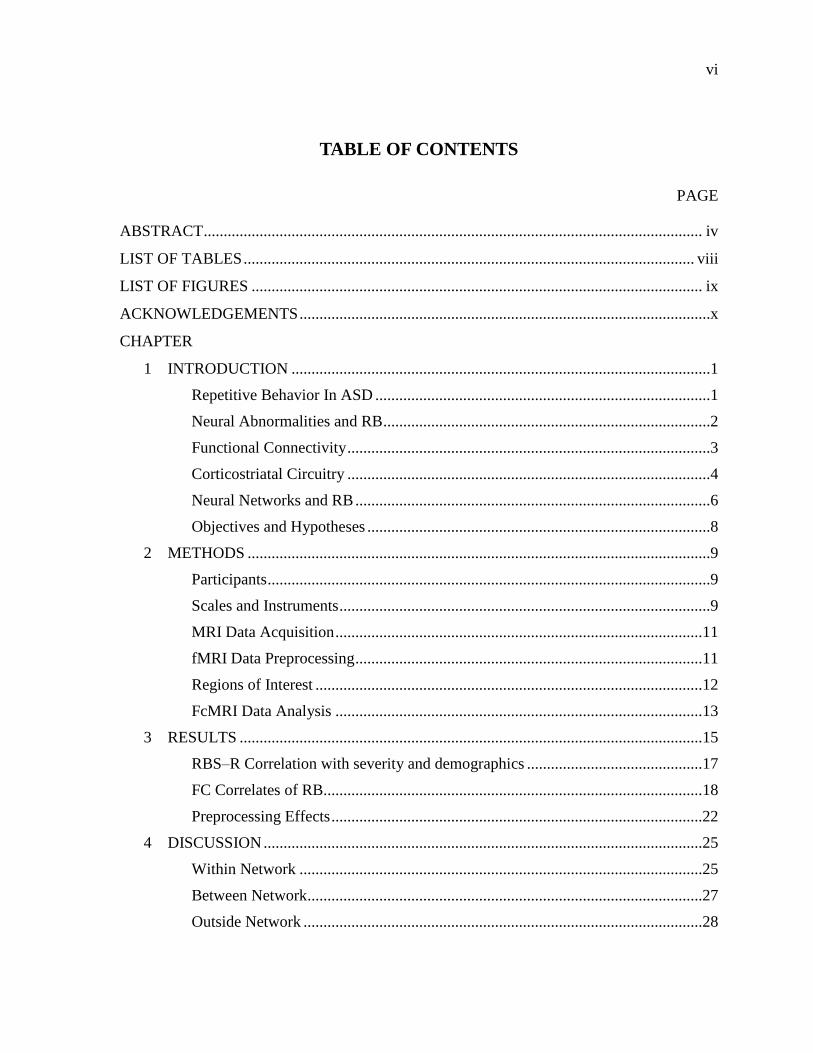
3 RESULTS ....................................................................................................................15
RBS–R Correlation with severity and demographics ............................................17
FC Correlates of RB...............................................................................................18
Preprocessing Effects .............................................................................................22
4 DISCUSSION ..............................................................................................................25
Within Network .....................................................................................................25
Between Network...................................................................................................27
Outside Network ....................................................................................................28

vii
Limitations .............................................................................................................29
REFERENCES ........................................................................................................................31

viii
LIST OF TABLES
PAGE
Table 1. Participant Characteristics .........................................................................................10
Table 2. Talairach Coordinates of Regions of Interest ............................................................13
Table 3. RBS–R Correlations with Diagnostic and Behavioral Measures ..............................19
Table 4 Associations Between RBS–R scores and Clusters Showing Group
Connectivity Differences .............................................................................................22
ix
LIST OF FIGURES
PAGE
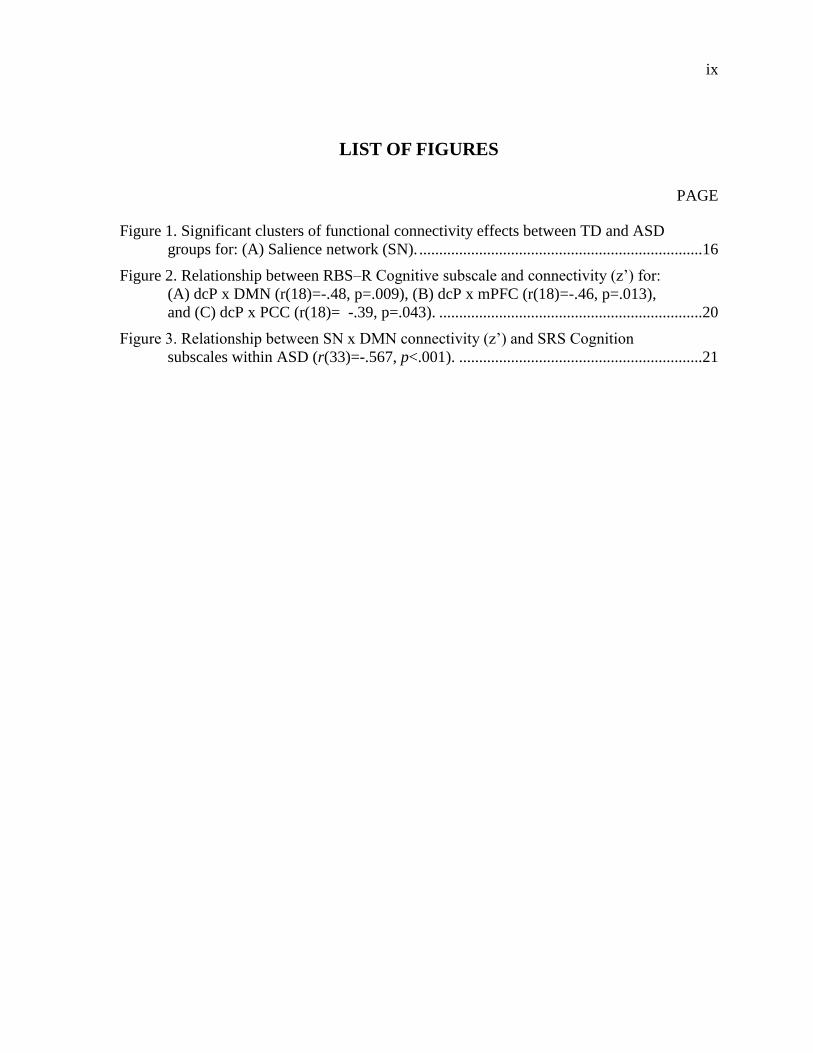
Figure 1. Significant clusters of functional connectivity effects between TD and ASD
groups for: (A) Salience network (SN). .......................................................................16
Figure 2. Relationship between RBS–R Cognitive subscale and connectivity (z’) for:
(A) dcP x DMN (r(18)=-.48, p=.009), (B) dcP x mPFC (r(18)=-.46, p=.013),
and (C) dcP x PCC (r(18)= -.39, p=.043). ..................................................................20
Figure 3. Relationship between SN x DMN connectivity (z’) and SRS Cognition
subscales within ASD (r(33)=-.567, p<.001). .............................................................21

x
ACKNOWLEDGEMENTS
I would like to thank the faculty and staff of the psychology department of San Diego
State University for making possible the educational benefits of the master’s program in
psychology. I am particularly grateful to my mentor, Axel Müller, for providing me with
guidance throughout my thesis and with research training that will be useful in future
endeavors. Thank you to BDIL lab members, past and present, who were always available to
answer questions and were an invaluable resource for helping me learn data analysis
techniques. I would also like to express my appreciation to my committee members for their
contributions: to Pamela Moses for helping me conceptually refine the ideas presented, to
Bonnie Kraemer for helping me ground the research from an applied perspective, and to Alan
Lincoln for offering his clinical expertise and facilitating participant recruitment. My deep
respect and special thanks also goes out to the participants and their families for giving their
time and making research projects like this possible. Finally, thank you to my family and
friends for their support and, especially, to my mother, to whom I will always be grateful for
instilling in me enjoyment for learning and growth.
1
CHAPTER 1
INTRODUCTION
Autism spectrum disorder (ASD) is a heterogeneous neurodevelopmental disorder
steadily increasing in prevalence (Centers for Disease Control and Prevention [CDC], 2012).
Its core characteristics include qualitative impairments in social interaction and
communication, and repetitive behavior (RB). ASD symptoms appear within the first three
years of life and are accompanied by widespread brain abnormalities. RBs emerge early on
in development and can have detrimental effects on learning, socialization, parenting, and
family cohesion, all of which may negatively impact subsequent development (Boyd,
McBee, Holtzclaw, Baranek, & Bodfish, 2009)
REPETITIVE BEHAVIOR IN ASD
RBs encompass a broad spectrum of behavioral manifestations, which vary in part
depending on the severity of the disorder, but can be loosely categorized as “lower-order” or
“higher-order” behaviors (Turner, 1999). Lower-order RB occurs in all babies as gross
motor skills develop, but becomes symptomatic of ASD when it persists beyond the first year
of life (Loh et al., 2007). Included in this category are stereotyped behavior, such as arm
flapping, and self-injurious behavior, most commonly head-banging. Around two to three
years of age, RBs take on a higher-order component characterized by restricted interests,
adherence to a routine, and compulsions analogous to those seen in obsessive compulsive
disorders (Arnott et al., 2010; Turner, 1999). Throughout development, RBs are linked with
abnormal sensory processing (Gabriels et al., 2008) and have been shown to increase in
visually stimulating environments (Colman, Frankel, Ritvo, & Freeman, 1976). However,
rather than strictly impairing, RBs appear to serve a calming function in overstimulating
environments and are associated with a reduced heart rate, particularly under distress
(Willemsen-Swinkels, Buitelaar, Dekker, & van Engeland, 1998). While RBs correlate with
anxiety (Rodgers, Glod, Connolly, & McConachie, 2012), one theory suggests that this helps

2
individuals with ASD compensate for an unstable arousal system by narrowing sensory input
to a more restricted, controllable scope (Liss, Sauliner, Fein, & Kinsbourne, 2006).
NEURAL ABNORMALITIES AND RB
Studies of altered brain anatomy and function in ASD have provided some insight
into the etiology of RB and its potential role in mitigating core symptoms. In anatomical
studies, the basal ganglia have been closely scrutinized given this region’s known
involvement in movement. Estes et al. (2011) found that decreased size of the putamen, but
not the caudate, correlated with increased RB in pre-school age children, many of whom
were low-functioning. In older children, caudate volume was shown to be increased in ASD
relative to controls even after controlling for total brain volume. Interestingly, in two studies
(Langen et al., 2009; Sears et al., 1999) increased caudate size was associated with decreased
RB symptoms within ASD cohorts. This effect was moderated by age, with children and
adolescents driving the correlation. In a sample of adults with ASD, however, opposite
findings have emerged showing a positive correlation between caudate volume and RB
(Hollander et al., 2005). In addition, altered growth trajectories in ASD are likely to play a
role, as the volume of the head of the caudate nucleus has been found to increase with age in
ASD, but to decrease with age in typical development (Langen et al., 2009). Taken together,
findings suggest volumetric abnormalities in the striatum, some of which could potentially be
related to compensatory changes.
Impaired cognitive control, commonly found in ASD, has been correlated with
higher-order RB (Mosconi et al., 2009) and is consistently associated with altered activation
of frontal areas. Cognitive control task paradigms, including target detection tasks with
distracters and response set shifting tasks, have been shown to elicit hypoactivation of the
rostral anterior cingulate cortex (rACC) (Dichter & Belger, 2008; Kana, Keller, Minshew, &
Just, 2007) and the intraparietal sulcus in ASD, which in turn is associated with more severe
RB (Shafritz, Dichter, Baranek, & Belger, 2008). A double case study involving SSRI
treatment supported these findings showing a reduction in RB with concurrent increased
rACC activation in one participant, and RB symptom worsening accompanied by increased
activation in the supplementary motor cortex in another (Dichter et al., 2010). However, a
hyperactive inhibition response has also been detected in the rACC (Thakkar et al., 2008) and

3
in the frontal eye fields, subserving the oculomotor network (Agam, Joseph, Barton, &
Manoach, 2010; Alexander, DeLong, & Strick, 1986), both of which correlated with
increased RB. Dichter, Felder, & Bodfish (2009) also detected overactivation during a shape
detection task for the anterior cingulate cortex as well as the insula, important for basic
sensory and interoceptive processing, and the frontopolar cortex, a region contributing to the
highest levels of cognitive control (Badre, Hoffman, Cooney, & D'Esposito, 2009). The
apparent discrepancy in fMRI activation findings in ASD may be due, in part, to sample
variability of a heterogeneous population and differences in task paradigms, particularly in
whether working memory is involved (Kana et al., 2007). Finally, increased activation in the
supplementary motor area along with decreased activation in the cerebellum was found
during a simple finger-tapping motor task (Mostofsky et al., 2009) suggesting altered
recruitment of motor regions. Although mixed, these findings suggest that altered cognitive
control and sensorimotor processing may both contribute to RB symptomatology. The
investigation of functional brain networks may therefore lead to a better understanding of
brain dysfunction underlying RBs in ASD than the focus on abnormalities at the level of
single brain regions.
FUNCTIONAL CONNECTIVITY
Functional connectivity magnetic resonance imaging (fcMRI) has become the most
commonly used technique for the study of functional brain networks in recent years. Similar
to conventional activation fMRI, fcMRI is based on measuring changes in the blood oxygen
level dependent (BOLD) signal. This signal reflects the hemodynamic response, in particular
the replenishment of oxygen for firing neurons, and thus serves as an indirect indicator of
neuronal activity (Huettel, Song, & McCarthy, 2009). Independent of stimuli-induced
activation, spontaneous fluctuations occur in the BOLD signal at low frequencies and are
thought to indicate endogenous neural properties and offer an unbiased measure of brain
functioning. For particular brain regions, BOLD signals have a propensity to fluctuate in
synchrony and may indicate processing for related tasks. Such functionally related but often
spatially discrete areas, called functional networks, are thought to underlie mature brain
dynamics (Fox & Raichle, 2007). Functional connectivity, therefore, is measured by
examining the correlation in the BOLD signal between areas of the brain. While task-based
4
and ‘resting-state’ studies have yielded similar patterns of connectivity, the ‘resting-state’
may be especially useful in examining networks that predominate in the absence of a task,
which have shown to be affected in ASD. Patterns of connectivity are best observed by
isolating frequencies at which subtle, task-independent variations occur reflecting intrinsic
connectivity properties (Van Dijk et al., 2010). This method of analysis may be particularly
useful in gaining insight into the neurological profile of ASD as it is characterized by
distributed dysfunction (Müller, 2007).
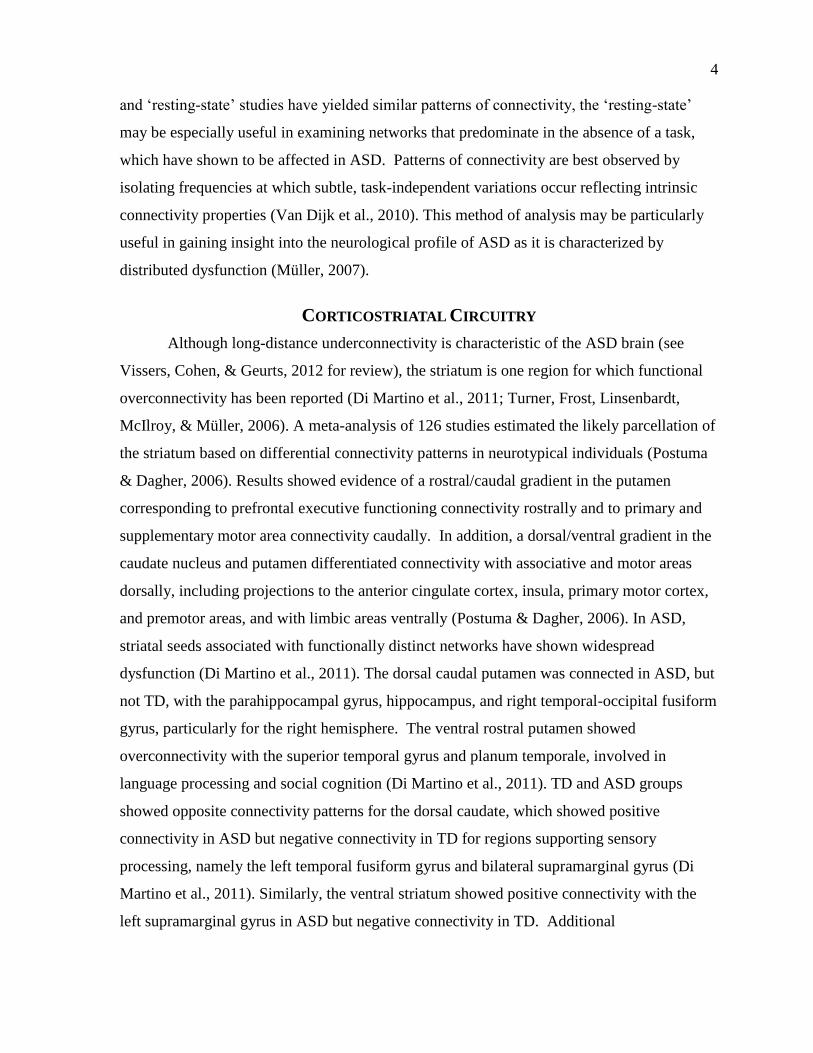
CORTICOSTRIATAL CIRCUITRY
Although long-distance underconnectivity is characteristic of the ASD brain (see
Vissers, Cohen, & Geurts, 2012 for review), the striatum is one region for which functional
overconnectivity has been reported (Di Martino et al., 2011; Turner, Frost, Linsenbardt,
McIlroy, & Müller, 2006). A meta-analysis of 126 studies estimated the likely parcellation of
the striatum based on differential connectivity patterns in neurotypical individuals (Postuma
& Dagher, 2006). Results showed evidence of a rostral/caudal gradient in the putamen
corresponding to prefrontal executive functioning connectivity rostrally and to primary and
supplementary motor area connectivity caudally. In addition, a dorsal/ventral gradient in the
caudate nucleus and putamen differentiated connectivity with associative and motor areas
dorsally, including projections to the anterior cingulate cortex, insula, primary motor cortex,
and premotor areas, and with limbic areas ventrally (Postuma & Dagher, 2006). In ASD,
striatal seeds associated with functionally distinct networks have shown widespread
dysfunction (Di Martino et al., 2011). The dorsal caudal putamen was connected in ASD, but
not TD, with the parahippocampal gyrus, hippocampus, and right temporal-occipital fusiform
gyrus, particularly for the right hemisphere. The ventral rostral putamen showed
overconnectivity with the superior temporal gyrus and planum temporale, involved in
language processing and social cognition (Di Martino et al., 2011). TD and ASD groups
showed opposite connectivity patterns for the dorsal caudate, which showed positive
connectivity in ASD but negative connectivity in TD for regions supporting sensory
processing, namely the left temporal fusiform gyrus and bilateral supramarginal gyrus (Di
Martino et al., 2011). Similarly, the ventral striatum showed positive connectivity with the
left supramarginal gyrus in ASD but negative connectivity in TD. Additional

5
overconnectivity of the ventral striatum was seen with the anterior and mid-insula and the
superior temporal gyrus, possibly reflecting impaired paralimbic processing and social
reward deficits, respectively. Notably, all striatal seeds were overconnected to the pons,
which is responsible for basic sensory and arousal processes. This finding could reflect
impaired connectivity beginning early stages of development (Di Martino et al., 2011).
Trends in the data reported by (Di Martino et al., 2011) also suggested that RB may
be related to connectivity between the dorsal caudal putamen/pons and the right ventral
rostral putamen/superior temporal gyrus. The caudal putamen, which is thought to play a
prominent role in initiating movement, could reasonably be assumed to impact RB; however,
the RB measure used in this study was part of a diagnostic test and may not have been
sensitive enough to the heterogeneous class of RB found in ASD to detect reliable neural
associations. The superior temporal gyrus and ventral striatum are hypothesized to be
involved in an anterior cingulate loop, one of five basal ganglia circuits described by
Alexander et al. (1986), who posited that discrete parallel circuits connect the basal ganglia
with the cortex. The anterior cingulate loop receives input from other areas showing
abnormalities in ASD, such as the hippocampus and temporal regions (Alexander et al.,
1986; Di Martino et al., 2011; Turner et al., 2006). Although the exact function of this loop
remains speculative, all five proposed parallel corticostriatal circuits have been supported by
fcMRI findings (Di Martino et al., 2008).
Another fcMRI study (Turner et al., 2006) reported diffuse overconnectivity of the
caudate nucleus in the left hemisphere, which extended to the right middle frontal gyrus, left
medial frontal gyrus, bilateral precentral gyrus, right postcentral gyrus, bilateral cingulate
gyrus and the left cuneus. Altered connectivity with frontal areas as reported here may play a
role in cognitive control deficits while diffuse connectivity of the caudate nucleus with
sensorimotor areas may disrupt functioning of the motor loop which connects the putamen
and motor and somatosensory cortices among other sensorimotor regions to form circuit
(Alexander et al., 1986). This may reflect less differentiated striatal networks and provide a
plausible link for cognitive control deficits and motor abnormalities.

6
NEURAL NETWORKS AND RB
Impaired connectivity in ASD has also been shown within sensorimotor and
inhibition networks. For sensorimotor functioning, Mostofsky et al. (2009) reported
decreased connectivity within a motor execution network, including the primary
sensorimotor cortex, thalamus, cerebellum, and supplementary motor area, during a simple
finger tapping task. Reduced connectivity with the somatosensory cortex has also been found
for the posterior insula, which receives sensory information and connects to the motor
thalamus (Ebisch et al., 2010). Likewise, the anterior insula, important in integrating
interoceptive states with sensory input from the posterior insula, showed reduced
connectivity with the amygdala and, in individuals with ASD but not Asperger syndrome,
with the dorsal anterior cingulate cortex (Ebisch et al., 2010). This may reflect diminished
emotional awareness of self and others and reduced ability to regulate emotions, respectively.
Importantly, the anterior insula and dACC are key regions of the salience network, which is
purportedly responsible for directing attentional resources and acting as a switch between the
internally guided default mode network and the externally guided executive control network
(Uddin & Menon, 2009). Interestingly, the dACC and the frontal eye fields, involved in an
inhibitory network, showed increased functional connectivity in ASD, which correlated with
increased RB (Agam et al., 2010). One view suggests that heightened inhibitory signals may
be required in more severe cases of ASD, and consequently, may compensate for reduced
functioning of the salience network. Such a dysregulated “switching” mechanism may
explain reduced coherence within networks. In a separate study measuring structural
covariance, correlations among regions of the salience network were reduced in ASD,
specifically for the left insula and anterior cingulate as well as bilateral frontal regions and
the anterior temporal cortex (Zielinski et al., 2012). The same study found greater covariance
between the right insula and bilateral motor areas in the ASD group. This supports findings
of dysregulation among the salience network, but may also link processing of this network
with motor regions.
Among the most robust findings involving correlations with RB are those related to
the default mode network (DMN), which is implicated in self-reflection and mind-wandering
in the ‘resting state’. Activation studies have shown less DMN suppression during task
performance in ASD relative to controls (Kennedy & Courchesne, 2008), especially under

7
high perceptual load conditions (Ohta et al., 2012). Altered processing may be the result of
reduced coordination among regions of the network. Weng et al. (2010) found reduced
connectivity of the left posterior cingulate cortex in 9 out of 11 DMN regions. Among these,
connectivity to the medial prefrontal cortex, temporal lobes and superior frontal gyri was
negatively correlated with RB in adolescents with ASD. In particular, the ventral medial
prefrontal cortex (vmPFC) may be particularly affected by decreased network connectivity
and has been shown to exhibit greater connectivity during self-referential compared to other-
referential processing (Lombardo et al., 2010). Interestingly, in ASD, the less of a distinction
between the self and other conditions, the greater the social symptom severity. A separate
DMN study conducted in adults showed the opposite trend in symptom association with RB
positively correlating with functional connectivity between the left PCC and the
parahippocampal gyrus (Monk et al., 2009). Although developmental differences cannot be
ruled out, a simpler explanation may be an anterior-posterior distinction in DMN
connectivity. A study measuring structural covariance in the DMN showed the PCC to be
correlated with posterior regions of the DMN and with motor, associative, and sensory
regions not associated with the DMN in neurotypical individuals, but no correlations were
found with prefrontal DMN regions (Zielinski et al., 2012).
Growing evidence has shown that neurotypical processing is characterized not only
by synchrony within networks, but by coordination between networks. This may be
particularly important for proper inhibitory functioning (Agam et al., 2010) and has found to
be decreased between motor and limbic networks (Gotts et al., 2012). The salience network
has also shown reduced coordination with frontal-parietal areas in ASD, which are involved
in top-down inhibitory processing and include the right middle frontal, inferior frontal, and
inferior parietal gyri (Kana et al., 2007). Disrupted salience network functioning, in
particular, may provide a plausible link to impaired synchrony between networks in ASD.
The default mode network, for example, is reportedly active during ‘resting-state’ yet shows
correlations with RB (Monk et al., 2009; Weng et al., 2010). A key prefrontal DMN region,
the vmPFC, showed decreased functional connectivity for widespread regions including the
anterior and mid-cingulate cortex, premotor cortex, somatosensory cortex, intraparietal
sulcus, cerebellum, and several areas in the temporal lobe (Lombardo et al., 2010). One
explanation for the connectivity between the ventromedial prefrontal cortex and sensorimotor

8
regions suggests that embodied cognition, understanding others’ actions, emotions, and
sensations, requires a balance of higher order representations at the cognitive level and lower
order representations at the sensorimotor level (Lombardo et al., 2010). In ASD, this could
manifest as an imbalance of higher-order cognition, related to DMN or SN processing, and
lower-order cognition, related to sensorimotor functioning in the striatum. However, the
possibility that an imbalance between higher- and lower-order circuitry exists in ASD has not
been fully investigated.
OBJECTIVES AND HYPOTHESES
The purpose of the current study was to examine brain areas related to RB in ASD by
looking at functional connectivity i) for specific structures ii) between structures within two
separate networks (DMN and SN) and iii) between networks (DMN with SN). Based on
previous findings of striatal abnormalities, one seed in the right dorsal caudate nucleus (dCN)
was used to examine striatal connectivity with cortical areas involved in cognitive control. A
second striatal seed was placed in the right dorsal caudal putamen (dcP), to assess functional
connectivity with sensorimotor areas and examine possible links with RB. Attentional and
inhibition-related functioning of the salience network were investigated using a seed in the
anterior insula (aI) and another in the dorsal anterior cingulate cortex (dACC) for the right
hemisphere. Finally, in order to examine default mode network connectivity, seeds were
placed in the left hemisphere in the posterior cingulate cortex (PCC) and in the ventral
medial prefrontal cortex (vmPFC). Consistent with previous findings, ASD groups were
expected to show overconnectivity for all seeds. Reduced connectivity between seeds within
a network were hypothesized for the DMN and SN in ASD. Finally, networks were expected
to be less correlated with one another in ASD than in TD. Total RB scores were
hypothesized to correlate with overconnectivity of the putamen, reduced connectivity within
the DMN and SN, and reduced connectivity between networks. Higher-order RB scores
were hypothesized to correlate with overconnectivity of the dCN and reduced connectivity
within the SN, given the role of these areas in cognitive control. Since lower-order RB are
presumably involved in similar motor pathways as higher-order processing but do not share
the cognitive component, no prediction is specific to lower-order RB scores.

9
CHAPTER 2
METHODS
PARTICIPANTS
Participants consisted of 35 adolescents with ASD between 9 and 17 years and 31
typically developing (TD) adolescents matched on age, gender, IQ, and handedness (Table
1). ASD diagnoses were made based on the Autism Diagnostic Observation Schedule
(ADOS; Lord et al., 2000), the Autism Diagnostic Interview-Revised (ADI-R; Lord, Rutter,
& Le Couteur, 1994), and expert clinical judgment according to the DSM-IV-TR (American
Psychiatric Association [APA], 2000). The breakdown of specific diagnoses were: 18
participants with Asperger syndrome, 13 with autism spectrum disorder, and 3 participants
with Pervasive Developmental Disorder, Not Otherwise Specified (PDD-NOS). ASD
participants were without any co-morbid, autism-related disorders (i.e. epilepsy, fragile X
syndrome) and had IQs measuring greater than 70 according to the Wechsler Abbreviated
Scale of Intelligence (WASI; Wechsler, 2008), thus meeting inclusion criteria for the study.
TD participants were recruited by advertisements in the community and reported no family
history of autism, autism-related disorders, or psychiatric conditions. For all participants,
handedness was confirmed using the Edinburgh Handedness Inventory (Oldfield, 1971).
Informed assent and consent was obtained for all participants and caregivers prior to the
study in accordance with San Diego State University and University of California, San Diego
institutional review boards.
SCALES AND INSTRUMENTS
RB was assessed using the Repetitive Behavior Scale-Revised (Bodfish, Symons,
Parker, & Lewis, 2000; Bodfish, Symons, & Lewis, 1999), a caregiver-report measure
consisting of 43 items rating the presence and severity of RB occurring within the past month
from 0 (“behavior is not present”) to 3 (“behavior occurs and is a severe problem”). The
scale consists of six subscales, which include stereotyped behavior, self-injurious behavior,
compulsive behavior, ritualistic behavior, sameness
10
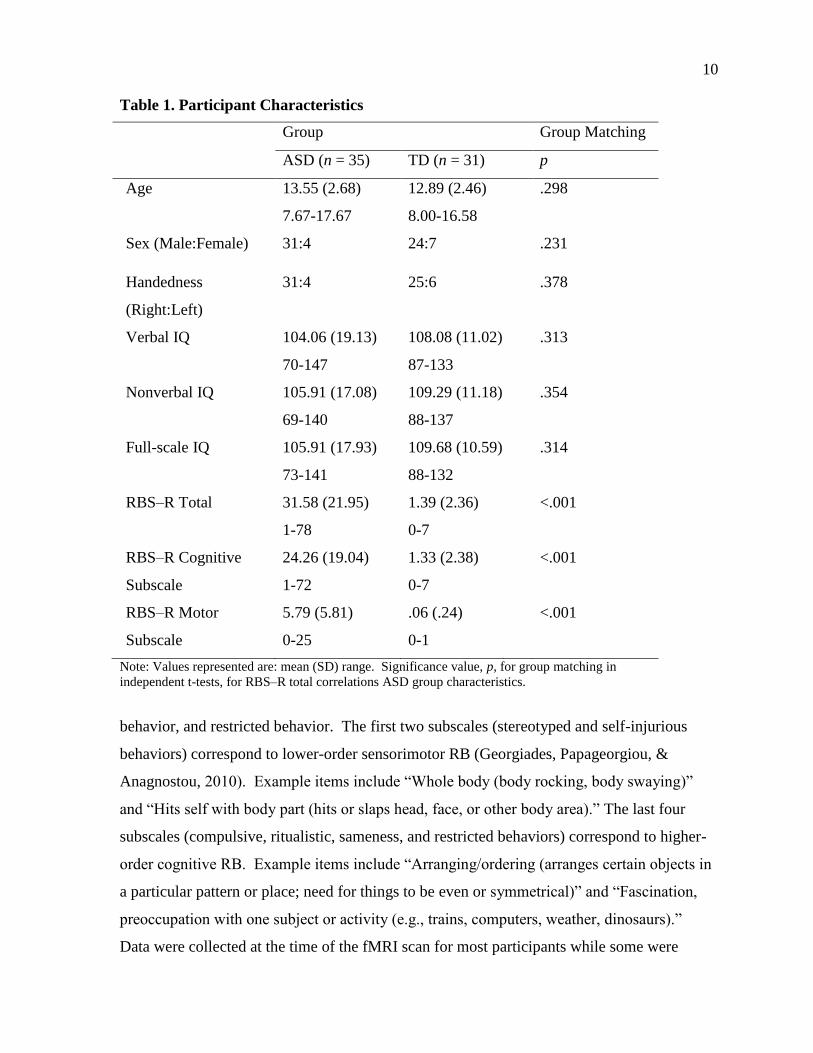
Table 1. Participant Characteristics
Group Group Matching
ASD (n = 35) TD (n = 31) p
Age 13.55 (2.68)
7.67-17.67
12.89 (2.46)
8.00-16.58
.298
Sex (Male:Female) 31:4 24:7 .231
Handedness
(Right:Left)
31:4 25:6 .378
Verbal IQ 104.06 (19.13)
70-147
108.08 (11.02)
87-133
.313
Nonverbal IQ 105.91 (17.08)
69-140
109.29 (11.18)
88-137
.354
Full-scale IQ 105.91 (17.93)
73-141
109.68 (10.59)
88-132
.314
RBS–R Total 31.58 (21.95)
1-78
1.39 (2.36)
0-7
<.001
RBS–R Cognitive
Subscale
24.26 (19.04)
1-72
1.33 (2.38)
0-7
<.001
RBS–R Motor
Subscale
5.79 (5.81)
0-25
.06 (.24)
0-1
<.001
Note: Values represented are: mean (SD) range. Significance value, p, for group matching in
independent t-tests, for RBS–R total correlations ASD group characteristics.
behavior, and restricted behavior. The first two subscales (stereotyped and self-injurious
behaviors) correspond to lower-order sensorimotor RB (Georgiades, Papageorgiou, &
Anagnostou, 2010). Example items include “Whole body (body rocking, body swaying)”
and “Hits self with body part (hits or slaps head, face, or other body area).” The last four
subscales (compulsive, ritualistic, sameness, and restricted behaviors) correspond to higher-
order cognitive RB. Example items include “Arranging/ordering (arranges certain objects in
a particular pattern or place; need for things to be even or symmetrical)” and “Fascination,
preoccupation with one subject or activity (e.g., trains, computers, weather, dinosaurs).”
Data were collected at the time of the fMRI scan for most participants while some were

11
acquired from 6 months to 3 years after the scan. A cumulative score and two subscale
scores (lower-order and higher-order) were calculated for each participant.
To more comprehensively assess ASD characteristics, specifically those most closely
associated with RB, additional parent-report measures were acquired including the Caregiver
Sensory Profile (SP; Dunn, 1994), the Social Responsiveness Scale (SRS; Constantino &
Gruber, 2002), and the Behavior Report Inventory of Executive Functioning (BRIEF; Gioia,
Isquith, Guy, & Kenworthy, 2000). The SP consisted of four subscales measuring the
frequency of behaviors related to sensory processing with higher scores reflecting more
typical behavior. The SRS used 5 subscales to measure a breadth of behavior reported to be
atypical in ASD, including social awareness, communication, motivation, cognition, and
mannerisms. Finally, the BRIEF provided an assessment of executive functioning using 8
subscales, 2 behavioral indices, and 1 global composite score, and was included to help
elucidate the relationship between RB and executive functioning.
MRI DATA ACQUISITION
Brain imaging data was be acquired on a 3T GE Scanner using an 8-channel head
coil. High resolution anatomical data was obtained using a standard T1 weighted sequence
(TR = 11.08 ms; TE = 4.3 ms; field of view [FOV] = 256 mm; 256 x 256 matrix; 180 slices;
flip angle = 45°; 1 mm3 resolution). Resting state functional data was acquired for 185 time
points using T2* weighted imaging with a single-shot gradient-recalled, echo-planar pulse
sequence (TR = 2000 ms; TE = 30ms; FOV = 220 mm; flip angle = 90°; 64 x 64 matrix;
3.438 mm2 in-plane resolution). The session lasted 6 minutes and 10 seconds, during which
participants were presented with a white fixation cross displayed on a black background and
instructed, “keep your eyes on the cross, relax, let your mind wander, and try not to fall
asleep.”
FMRI DATA PREPROCESSING
Data were preprocessed and analyzed using the Analysis of Functional Neuroimaging
suite (AFNI; Cox, 1996). The first five time points were discarded to allow for magnetic field
stabilization. The remaining 180 time points were field-map corrected to minimize error due
to magnetic field inhomogeneity, slice-time corrected for interleaved acquisition, and motion
corrected by realigning whole volume data to the first time point. Functional data were then

12
co-registered on to anatomical images, resampled to 3.0 mm isotropic voxels, standardized to
N27 Talairach space (Talairach & Tournoux, 1988), and spatially blurred with an isotropic
Gaussian filter to a full-width at half-maximum (FWHM) of 6 mm. Finally, a band-pass
filter of .008 < f < .08 Hz was be applied to restrict frequencies to an optimal range for
detecting network-specific correlations in BOLD fluctuations (Fox & Raichle, 2007).
Additional motion correction procedures were performed to reduce measurement
error associated with head motion on BOLD signal correlations. Six rigid-body motion
parameters (three rotations, three translations) including their derivative were modeled as
regressors and removed from the data. Time points of excessive head motion ( > 0.75mm
relative to the previous time point) were censored, and segments with fewer than 10
consecutive surviving time points were discarded. Additionally, the average signals for
white matter and ventricular areas along with their derivatives were obtained using Freesurfer
software (Fischl et al., 2004) and removed from the data. Physiological (heart rate,
respiration) time series were also removed through linear regression. Comparisons between
TD and ASD groups for percentage of data censored and total motion were made to evaluate
group differences in data quality.
REGIONS OF INTEREST
A meta-analysis of 126 striatal functional connectivity studies supports rostral/caudal
and dorsal/ventral connectivity gradients within the striatum (Postuma & Dagher, 2006). In
the putamen, the rostral portion shares connections with executive prefrontal regions while
the caudal portion has connections with primary motor cortical areas. Additionally, dorsal
portions of the caudate and putamen are connected with cognitive control regions and motor
systems whereas ventral portions are connected with limbic structures. Based on findings of
striatal abnormalities within ASD (Di Martino et al., 2011), a seed was placed in the dorsal
caudal putamen (dcP) to examine connectivity with primary motor areas, and a second seed,
placed in the dorsal caudate nucleus (dCN), examined connectivity with cognitive control
areas. To examine connectivity of the default mode network, seeds were placed in the
ventromedial prefrontal cortex (vmPFC) and the posterior cingulate cortex (PCC). Finally,
cognitive control functioning and network switching was examined with two seeds in the
salience network, including the anterior insula (AI) and dorsal anterior cingulate cortex

13
(dACC). The default mode network seeds were placed in the left hemisphere with all other
seeds in the right hemisphere. Notably, the striatal ROIs were the only ones not nested within
a functional network due to their connectivity with nonoverlapping areas. Spherical masks
were drawn (6mm radius) using coordinates based on previous studies (Table 2)
Table 2. Talairach Coordinates of Regions of Interest
x y z
dcPut 28 1 3
dCN 13 15 9
vmPFC -2 42 -8
PCC -5 -49 40
aIns 36 16 2
dACC 11 21 26
FCMRI DATA ANALYSIS
Once masks were drawn, the average BOLD time series was extracted from each seed
for each participant. Mean time series for each seed were then correlated with the time
courses of all other voxels in the brain in a whole-brain voxel-wise analysis using Pearson’s
correlations. Correlation coefficients were transformed to normally distributed values using
Fisher’s r-to-z transformation. One- and two-sample t-tests examined within- and between-
group effects of functional connectivity. Statistical maps were set to a cluster-corrected
threshold of p < .05 to correct for multiple comparisons (Forman et al., 1995). Correlations
between the mean time courses of each seed pair were calculated and transformed into
standardized z scores, resulting in an 8 x 8 correlation matrix . These values were entered
into a group level analysis using a t-test to detect between-group differences. Correlation
values of seeds within the salience network were correlated with correlation values of seeds
within the default mode network to assess between network coordination separately for ASD
and TD groups.
To examine the relationship between neural abnormalities and repetitive behavior
symptoms, functional connectivity was correlated with repetitive behavior scores at three
levels within ASD: individual seeds, seeds within a network, and correlations between
networks. Clusters showing significant group differences in functional connectivity were

14
correlated with cumulative RB scores for each seed. Correlations among mean time course
(z) for seeds within each respective network were correlated with cumulative RB scores.
Finally, the average between-network correlation was correlated with cumulative RB scores.

15
CHAPTER 3
RESULTS
A whole-brain functional connectivity analysis revealed similar patterns of
connectivity for ROIs in TD and ASD groups with BOLD correlations occurring among
regions of known functional networks, including frontal parietal areas with the SN, medial
and superior frontal areas with the DMN, the sensorimotor cortex with the putamen, and the
prefrontal cortex with the caudate nucleus. In a direct group comparison, however, several
clusters of significantly different connectivity emerged between groups. All seeds showed
mixed over- and underconnectivity for the ASD group relative to the TD group, except for
the SN and dCN, which were exclusively underconnected in the ASD group.
The SN mask consisted of two ROIs – the AI and the dACC- in which time series
were averaged across all voxels to assess network connectivity as well as separately for AI
and dACC to assess ROI specific connectivity. As a whole, the SN showed reduced
connectivity with a small area of the anterior prefrontal cortex, bilaterally, and with the left
cerebellum extending into the right cerebellum and brainstem (Figure 1A). AI and dACC
connectivity patterns closely corresponded to the network as a whole with the AI showing
additional underconnectivity with the left inferior temporal gyrus and left temporal pole.
Overconnectivity was also seen for individual AI and dACC seeds with the right inferior
parietal lobule and right somatosensory cortex, respectively.
The DMN mask was drawn similarly to the SN by averaging across all voxels in the
PCC and mPFC; these nodes were also examined independently. The network mask showed
decreased within-network connectivity with dissociable areas of the mPFC and PCC, the left
angular gyrus and the medial cerebellum. Analyses of each DMN region, independently,
yielded mPFC underconnectivity with the left angular gyrus, medial cerebellum, and
brainstem, and PCC underconnectivity with areas of the PCC and the left superior temporal
gyrus. Overconnectivity was also found for the network mask and its individual ROIs
(Figure 1B). In particular, connectivity differences were found for the DMN network with
the left ventral premotor cortex, the anterior insula, the bilateral frontal eye fields, the

16
Figure 1. Significant clusters of functional connectivity effects between TD and ASD
groups for: (A) Salience network (SN). (i) Anterior insula (AI). (ii) Dorsal anterior
cingulate cortex (dACC). (B) Default mode network (DMN ). (i) Medial prefrontal
cortex (mPFC). (ii) Posterior cingulate cortex (PCC). (C) Dorsal caudal putamen (dcP).
(D) Dorsal caudate nucleus (dCN). All clusters shown are significant (p < .05 corr.).
Yellow represents positive t-scores (i.e., TD < ASD); blue represents negative t-scores
(i.e., TD > ASD).
A.
SN
i. AI
ii. dACC
B.
DMN
i. mPFC
ii. PCC
C.
dcP
D.
dCN
LEFT RIGHT

17
superior and inferior parietal lobules, middle occipital gyrus, precuneus, and inferior frontal
gyrus. The PCC ROI drove these results showing overconnectivity with all DMN clusters
and additional overconnectivity with lateral cerebellum, anterior prefrontal cortex, and right
ventral premotor cortex. The mPFC, meanwhile, showed overconnectivity exclusively with
the premotor cortex.
Reduced connectivity with regions involved in corticostriatal pathways was seen in
the basal ganglia ROIs. The putamen typically receives input from all areas of the
sensorimotor cortex and projects back to more localized areas of the primary and secondary
cortical motor areas (Alexander, 1986; Di Martino et al., 2008). In ASD, however,
underconnectivity was found for the left ventral premotor cortex and posterior regions of the
left middle temporal gyrus (Figure 1C). The caudate nucleus was underconnected in ASD
with the dorsolateral prefrontal cortex, the right temporo-parietal junction, and left precuneus
(Figure 1D). A sole region of overconnectivity for the putamen seed was found in the rostral
ACC.
Functional connectivity among seed regions was assessed through an 8 x 8 correlation
matrix. For both groups, the anterior insula and dorsal anterior cingulate seeds of the SN
were highly correlated, while the posterior cingulate cortex and medial prefrontal cortex
seeds of the DMN showed only minimal correlation for both groups. The putamen was
moderately connected with the AI and dACC and minimally with the mPFC and PCC,
consistent with other findings (Di Martino et al., 2008). The caudate nucleus showed only
modest correlations with other ROIs. Between-group t-tests for each ROI pair failed to
reveal any significant differences for either within-network or between-network connectivity
for the DMN and SN. However, significantly increased connectivity was found between the
putamen and caudate nucleus ROIs in the ASD group (F(1,65) = 4.70, p = .034, uncorr.).
RBS–R CORRELATION WITH SEVERITY AND
DEMOGRAPHICS
As expected, the ASD group showed greater symptom severity on the RBS–R than
the TD group (F = 33.63, p < .001). Notably, RBS—R scores were available for only a
subset of the overall sample (N = 19 ASD, 18 TD). While the distribution of TD scores
indicated a floor effect (Table 1), the ASD group showed sufficient variability and relatively
normal distribution of RBS–R scores to warrant further within-group analyses. In ASD,

18
RBS–R total scores did not correlate with age, sex, or handedness, but did correlate with full-
scale IQ (r = -.54 p = .022) and verbal IQ ( r= -.53, p = .023), with fewer RB symptoms
reported for those with higher IQs. RBS–R cognitive subscales showed similar pattern of
correlations (FSIQ: r =- .63, p = .005; VIQ: r = -.64, p = .005; NVIQ: r = -.53, p = .018),
whereas RBS–R motor subscales did not (p > .90). Therefore, full-scale IQ was entered as a
covariate into all correlations for RBS–R total and cognitive scores.
Further, correlations were calculated between the RBS–R and diagnostic measures:
the ADI and ADOS, as well as related symptom severity measures: Caregiver Sensory
Profile (SP), the Social Responsiveness Scale (SRS), and the Behavior Rating Inventory of
Executive Function (BRIEF). Overall, the RBS–R showed the strongest correlations with
qualitatively similar scales, including the SRS and the SP, most notably for ‘sensation
seeking’ (Table 3). Diagnostic measures correlated with the RBS–R at significant or
marginally significant levels, except for the ADOS RB subscale, which unexpectedly did not
(p > .40). Fewer correlations were seen on the measure of executive functioning, which has
shown null findings with RB or only partial overlap of RB with various aspects of executive
functioning (Boyd et al., 2009; Lopez, Lincoln, Ozonoff, & Lai, 2005).
FC CORRELATES OF RB
Several ROI pairs were significantly correlated with RBS–R scores within ASD. In
particular, as connectivity between the dcP and DMN increased, RBS–R cognitive scores
decreased (r= -.48, p = .009) (Figure 2). Individual DMN seeds contributed relatively equally
to this effect (mPFC: r = -.46, p = .013; PCC: r = -.39, p = .043). Negative correlations were
also found with RBS–R cognitive scores being associated with increased connectivity
between the AI and dCN (r = -.40, p = .035) and marginally for connectivity between the AI
and dcP (r = -.37, p = .055). RB motor scores showed no correlation with ROI pairs. There
was also a marginally significant correlation, in the predicted direction, for lower RBS–R
total scores to correspond with higher connectivity between the SN and DMN (p = .13).
When this network pair was correlated with SRS Cognition scores using a larger sample size,
a significant negative correlation emerged (r(33) = -.567, p <. 001; Figure 3).

19
Table 3. RBS–R Correlations with Diagnostic and Behavioral Measures
Measure r(18) p Measure r(18) p
ADI SRS (cont.)
Soc .48 .043 Motivation .62 .006
Com .45 .059 Autistic mannerisms .81 <.001
RB .57 .013 Total .67 .003
ADOS BRIEF
Soc .42 .070 Inhibit .56 .025
Com .80 <.001 Shift .64 .007
RB .20 .42 Emotional control .42 .104
SP Initiate .32 .224
Low regulation -.56 .016 Working memory .40 .120
Sensory sensitivity -.67 .003 Plan/Organize .31 .250
Sensation seeking -.85 <.001 Organization of materials .19 .48
Sensory avoidance -.62 .006 Monitor .54 .032
SRS Behavioral regulation index .67 .005
Awareness .57 .014 Metacognition index .33 .208
Communication .50 .036 Global executive composite .55 .027
Cognition .66 .003
Note: Significance values are uncorrected. Items on the SP are reverse scored relative to other scales. ADI
(Autism Diagnostic Interview); ADOS (Autism Diagnostic Observation Schedule; SP (Caregiver Sensory
Profile); SRS (Social Responsiveness Scale); BRIEF (Behavior Rating Inventory of Executive Function).
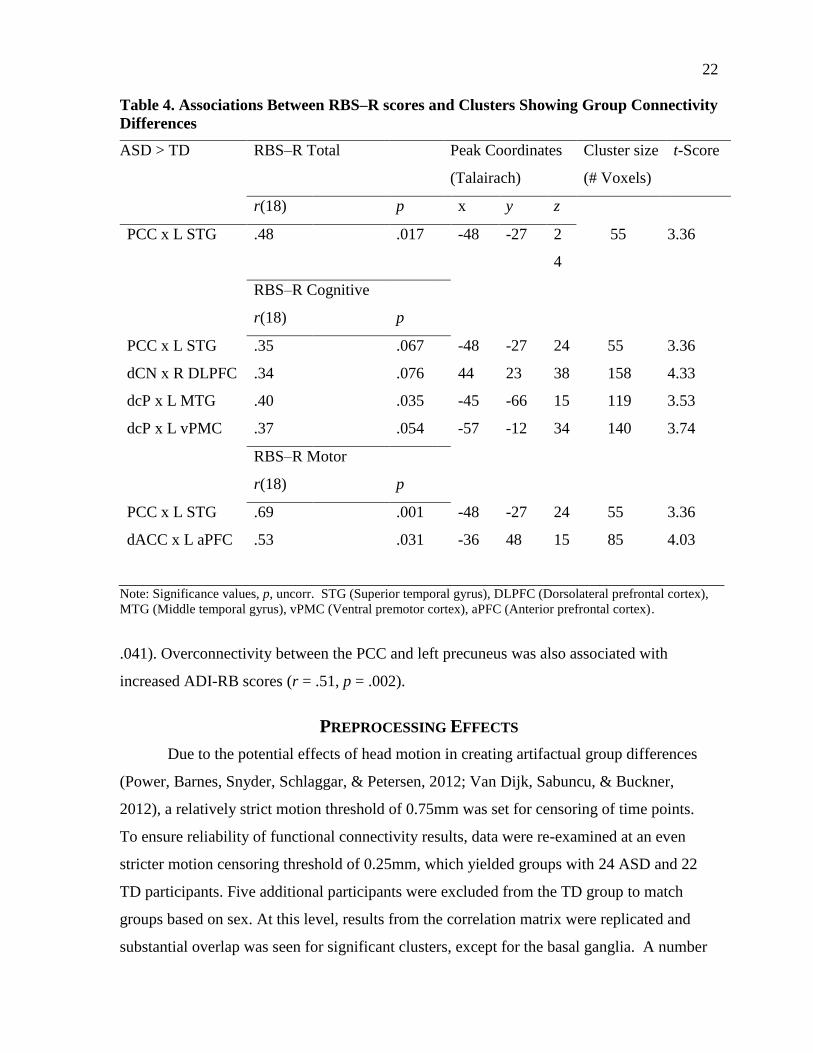
From the whole-brain connectivity analysis, increased RBS–R scores (Table 4) were
largely associated with: (1) underconnectivity between functionally related regions and (2)
overconnectivity with outside-network regions. PCC underconnectivity with the left superior
temporal gyrus, an area implicated in default mode function and social cognition, was
correlated with RBS—R total scores (r =-.48, p=.017). This effect was driven by RB motor
scores (r =-.69, p=.001) rather than RB cognitive scores (r=-.35, p=.07). RB motor scores
were also marginally associated with underconnectivity between the dACC and the left
anterior prefrontal cortex (r = -.45, p = .052). RB cognitive scores were correlated with
underconnectivity of the dcP with the left middle temporal gyrus (r = -.40, p = .035).

20
Figure 2. Relationship between RBS–R Cognitive subscale and connectivity (z’) for:
(A) dcP x DMN (r(18)=-.48, p=.009), (B) dcP x mPFC (r(18)=-.46, p=.013), and (C)
dcP x PCC (r(18)= -.39, p=.043).
0
10
20
30
40
50
60
70
80
-0.5 -0.4 -0.3 -0.2 -0.1 0 0.1 0.2 0.3 0.4 0.5
RB
S-R
Co
gnit
ive
dcP x DMN
0
10
20
30
40
50
60
70
80
-0.5 0 0.5
RB
S-R
Co
gnit
ive
dcP x PCC
0
10
20
30
40
50
60
70
80
-0.3 0.2 0.7
RB
S-R
Co
gnit
ive
dcP x mPFC

21
Figure 3. Relationship between SN x DMN connectivity (z’) and SRS
Cognition subscales within ASD (r(33)=-.567, p<.001).
Additionally, underconnectivity of the dcP with the left ventral premotor cortex (r = -.37, p =
.054) approached significance with RBS–R cognitive scores as well as for dCN
underconnectivity with the right DLPFC (r = -.34, p = .076). Related behavioral measures
were consistent with many of these findings and showed additional correlations. Increased
symptom severity was related to underconnectivity for the dACC with the right temporo-
parietal junction for SRS Cognition (r = -.42, p= .014) and Autistic mannerisms (r = -.40, p
= .019) scores. This effect was also present within the TD group: SRS Cognition (r = -.49, p
= .006), Autistic Mannerisms (r = -.41, p = .023). Underconnectivity between the mPFC and
brainstem also correlated with all four measures of the SP, most significantly for sensory
avoidance (r = .56, p = .004). More impaired functioning corresponded to greater
overconnectivity of the PCC with executive control areas. This was found, in particular, for
areas of left lateral cerebellum, implicated in error-processing, and was correlated with
increased severity on SP sensory seeking (r = -.42, p = .035) and ADI RB scores (r = .36, p =
50
60
70
80
90
100
110
-0.6 -0.4 -0.2 0 0.2 0.4 0.6
SRS-
Co
gnit
ive
sco
re
SN x DMN
22
Table 4. Associations Between RBS–R scores and Clusters Showing Group Connectivity
Differences
ASD > TD RBS–R Total Peak Coordinates
(Talairach)
Cluster size
(# Voxels)
t-Score
r(18) p x y z
PCC x L STG .48 .017 -48 -27 2
4
55 3.36
RBS–R Cognitive
r(18) p
PCC x L STG .35 .067 -48 -27 24 55 3.36
dCN x R DLPFC .34 .076 44 23 38 158 4.33
dcP x L MTG .40 .035 -45 -66 15 119 3.53
dcP x L vPMC .37 .054 -57 -12 34 140 3.74
RBS–R Motor
r(18) p
PCC x L STG .69 .001 -48 -27 24 55 3.36
dACC x L aPFC .53 .031 -36 48 15 85 4.03
Note: Significance values, p, uncorr. STG (Superior temporal gyrus), DLPFC (Dorsolateral prefrontal cortex),
MTG (Middle temporal gyrus), vPMC (Ventral premotor cortex), aPFC (Anterior prefrontal cortex).
.041). Overconnectivity between the PCC and left precuneus was also associated with
increased ADI-RB scores (r = .51, p = .002).
PREPROCESSING EFFECTS
Due to the potential effects of head motion in creating artifactual group differences
(Power, Barnes, Snyder, Schlaggar, & Petersen, 2012; Van Dijk, Sabuncu, & Buckner,
2012), a relatively strict motion threshold of 0.75mm was set for censoring of time points.
To ensure reliability of functional connectivity results, data were re-examined at an even
stricter motion censoring threshold of 0.25mm, which yielded groups with 24 ASD and 22
TD participants. Five additional participants were excluded from the TD group to match
groups based on sex. At this level, results from the correlation matrix were replicated and
substantial overlap was seen for significant clusters, except for the basal ganglia. A number

23
of additional clusters were also found for the AI, which was underconnected with prefrontal
and sensorimotor areas, and the PCC, which showed exclusive overconnectivity, most
extensively in the bilateral occipital cortex. However, these additional clusters did not
substantially alter the trend for overconnectivity to occur between networks, as with the
DMN, and underconnectivity to occur between nodes of a network, as with the AI. Although
fewer correlations between functional connectivity and symptom measures emerged as
significant, the trends in the correlations appeared consistent. This may partly be due to a
loss of statistical power with a smaller sample size.
Data were also re-analyzed using global signal regression (GSR) and its derivative.
This variable is thought to allow for the detection of inverse correlations by extracting the
global signal as a nuisance variable. However, GSR has also been shown to introduce a risk
of distorting group differences (Saad et al., 2012). Nevertheless, findings from a GSR
analysis overlapped closely with those from the original analysis, but with many more
significant clusters, particularly with the dACC, which was overconnected with sensory areas
and the mPFC, which was overconnected with sensorimotor and frontal parietal inhibition
areas. Additionally, the RBS–R correlations with underconnectivity between the dACC and
the anterior prefrontal cortex and between the PCC and superior temporal gyrus were
replicated.
Finally, potential confounding effects of demographic variables and remaining head
motion were controlled for when correlating between behavior and functional connectivity.
Age-dependent variables, which are inherent to developmental research, may be particularly
problematic due to their associations with measures of connectivity as well as behavior. In
the functional connectivity and subsequent analyses, group comparisons were made to ensure
that differences that arose between ASD and TD were not likely due to demographics (age,
sex, handedness, nonverbal IQ) or head motion during the scan (root mean square of
displacement, 6 rigid-body motion parameters). Following group comparisons, data for one
participant was excluded to create a more balanced male:female ratio. In correlation
analyses, symptom severity measures were individually correlated with the same
demographic and motion variables in two separate analyses. Verbal and non-verbal IQ were
positively correlated with total RBS–R scores and cognitive RBS–R scores, therefore, full-
scale IQ was used as a covariate in all RBS–R correlations. The same steps were taken for

24
other behavioral measures used, including ADI, ADOS, SP, SRS, BRIEF, although these
showed no correlation with demographics and no consistent differences in motion.

25
CHAPTER 4
DISCUSSION
Functional connectivity was assessed from resting-state data using eight ROIs
previously associated with RBs in ASD. At a higher level of complexity, we examined two
complex network ROIs, i.e. the SN and DMN, each consisting of spatially distinct regions
belonging to a common functional network. At a lower level of complexity, we also
investigated individual ROIs participating in their respective networks, i.e. the AI and dACC,
and for regions not involved in a network, i.e. the dCN and dcP. In accordance with the aims
of the study, functional connectivity was examined: (i) within each network, (ii) between one
network and the other, and (iii) with regions outside both networks.
WITHIN NETWORK
Regions within a functional network, i.e., SN and DMN, were expected to show
decreased correlations with one another in the ASD compared to the TD group. Although the
correlation matrix did not show underconnectivity between the AI and dACC seeds nor
between the mPFC and PCC seeds, the whole brain analysis yielded underconnectivity
within both networks. For the SN, underconnectivity was seen in an area of the right anterior
prefrontal cortex, an area which is thought to be a domain-specific extension of the SN,
contributing to stable task maintenance, the formation of a core task-set system, and network
“switching” (Dosenbach et al., 2006; Seeley et al., 2007). This effect was driven by the
dACC, for which underconnectivity was found with the anterior prefrontal cortex, bilaterally,
and was, in turn, correlated with RBS—R motor scores for the left hemisphere cluster.
Correlations with the RBS—R, however, were expected for the cognitive scores rather than
the motor scores. One potential explanation may be the inclusion of varying ASD diagnosis
in our sample. Previous findings of reduced connectivity in the SN were reported
specifically for individuals diagnosed as having ASD compared to both those with Asperger
syndrome and those who were typically developing (Ebisch et al., 2010). Therefore, reduced

26
connectivity may have been driven by lower-functioning ASD participants within our
sample, who in turn, may be expected to show more lower-order RB.
In accordance with previous findings in adolescents with ASD (Assaf et al., 2010;
Weng et al., 2010), underconnectivity was also found for the DMN seeds with functionally
related areas, including the left angular gyrus and areas of the mPFC and PCC, which were
proximal but not overlapping with ROIs comprising the DMN. Likewise, the PCC, when
examined individually, showed reduced connectivity with an additional cluster implicated in
the DMN, namely the left superior temporal gyrus (Kennedy & Courchesne, 2008).
Underconnectivity between the PCC and this cluster, furthermore, correlated with RBS—R
total and motor scores, and marginally with RBS—R cognitive scores. This suggests reduced
integrity of the network, as a whole, and for the PCC seed, specifically.
Altered DMN connectivity may have implications for the network’s ability to
modulate activation between resting state and task activation. In typical development,
activity is suppressed in the DMN when goal-oriented behavior is initiated (Kennedy &
Courchesne, 2008). Frontal parietal areas of the executive control network (ECN), on the
other hand, activate in response to task initiation and are typically inversely correlated with
the DMN (Sridharan, Levitin, & Menon, 2008). In ASD, the DMN deactivation response is
impaired, implying that network activity remains relatively constant regardless of situational
demands (Kennedy, Redcay, & Courchesne, 2006) and that the balance between the
opposing DMN and ECN may be disrupted (Uddin & Menon, 2009). In the current study,
overconnectivity of the DMN occurred with regions outside this network, primarily with
those implicated in the ECN, including the inferior parietal lobule, superior parietal lobule,
bilateral frontal eye fields, and inferior frontal gyri (Dosenbach et al., 2006; Fox et al., 2005).
This suggests that the DMN and ECN, are not differentially activated in ASD. To a lesser
extent, overconnectivity in the DMN was also seen with sensorimotor regions, including the
bilateral ventral premotor cortex. Intrinsic correlation patterns show that sensory and motor
areas, in typical development, are functionally segregated from the DMN (Fox et al., 2005),
which is hypothesized to be a critical feature for optimal functioning of systems involved in
unrelated domains (Posner & Peterson, 1990).
Taken together, our results suggest that impairment in ASD extends to large-scale
functional networks both in terms of reduced integration within networks and reduced
27
segregation between networks, which has been shown to characterize ASD neurological
profiles more accurately than general underconnectivity (Shih et al., 2011; Rudie et al.,
2012). To some extent, this pattern in ASD reflects immature brain functioning in typical
development, in which anatomically neighboring regions are highly connected. Gradually,
this local connectivity is reduced as connectivity among long-distance, functionally related
regions is strengthened (Fair et al., 2007; Stevens, Pearlson, & Calhoun, 2009). The resulting
functional specialization, according to the interactive specialization view, arises from genetic
influences and environmental interaction, which causes the brain to adapt increasingly more
efficient processing styles (Johnson, 2003). However, some evidence in ASD suggests that
brain organization does not merely reflect developmental delay, but rather qualitatively
altered structure (Langen et al., 2009; Schumann et al., 2010) and function (Di Martino et al.,
2011). The same interactive specialization view posits that abnormality in early childhood, as
is seen in ASD, consists of a core impairment which compromises subsequent processing of
the environment and, ultimately, leads to different patterns of organization (Johnson et al.,
2003).
BETWEEN NETWORK
The interaction between the DMN and SN and its relationship to symptom severity
was of particular interest given the paucity of research linking ASD symptoms to
connectivity between large-scale networks. Previous findings have shown reduced
connectivity between the SN and an executive control system in ASD (Kana et al., 2007).
Due to the putative role of the SN in shifting attentional resources between large-scale
networks (Seeley et al., 2007), reduced connectivity of the SN with large-scale networks is
thought to indicate disrupted processing of network functions and, consequently, impaired
synchronization of functional networks. Although no group difference in connectivity
between the SN and DMN emerged in our sample, which consisted predominantly of high-
functioning individuals with ASD, a significant relationship within ASD was found for
between-network connectivity with symptom severity. This occurred in the predicted
direction with greater connectivity between the SN and DMN being associated with fewer
symptoms on the SRS cognition score. We also found a marginal correlation for the RBS–R
cognitive score with connectivity between the SN and mPFC, a canonical DMN node, which

28
was, however, only marginally significant, possibly due to the smaller sample size for RBS
analyses. Taken together, these findings are consistent with a systems-level model
emphasizing the importance of the SN in facilitating synchronous network interaction (Uddin
& Menon, 2009). Notably, resting state data have yielded similar findings of spontaneous
shifts occurring between the internally-directed DMN and the externally-oriented ECN
(Sridharan et al., 2008). Results, therefore, suggest that increased symptom severity in ASD
may be associated with impaired synchronization between the SN and DMN.
OUTSIDE NETWORK
Finally, connectivity between basal ganglia and large-scale functional networks has
not, as yet, been studied systematically although it may have important implications for RB
symptoms. The relationship between severity scores and connectivity patterns in the
putamen and caudate nucleus were characterized by two general findings, in which increased
symptom severity corresponded to: (1) reduced connectivity between basal ganglia ROIs and
regions involved in corticostriatal pathways, and (2) reduced connectivity between basal
ganglia ROIs and DMN regions. The putamen and the caudate nucleus have been shown to
belong to anatomically and functionally segregated corticostriatal loops projecting to
sensorimotor areas and prefrontal cortical areas, respectively (Alexander et al., 1986; Di
Martino et al., 2008). Underconnectivity in the sensorimotor pathway, specifically between
the dcP and left middle temporal gyrus as well as the putamen and left ventral premotor
cortex (marginally), was correlated with RBS–R cognitive scores. In the prefrontal
associative pathway, the caudate nucleus has been shown to correlate with frontal parietal
regions supporting cognitive control, including the DLPFC and right temporo-parietal
junction (Di Martino et al., 2008; Dosenbach et al., 2006), both of which were
underconnected with the dCN in ASD; underconnectivity for both regions was, in turn,
marginally correlated with RBS–R cognitive scores. Previously, the same striatal ROIs have
shown connectivity in ASD with areas lacking connectivity or inversely correlated in TD,
such as those involved in sensory integration, including the supramarginal gyrus, fusiform
gyrus, and cuneus (Di Martino et al., 2011). Although the present study did not reproduce
these findings of aberrant striatal connectivity, overconnectivity with functionally-disparate
regions, as previously reported, is not at odds with the current findings of underconnectivity
29
with functionally related areas comprising corticostriatal loops. Immature or abnormal brain
development can be characterized both by reduced connectivity of long-distance functional
networks and by increased connectivity with regions outside a functional network.
Therefore, the current findings may complement previous findings by implicating the
striatum in additional patterns of impaired network-related functional connectivity (Di
Martino et al., 2011). Additionally, increased connectivity of the putamen with the DMN as a
whole and individual PCC and mPFC seeds was associated with fewer RB symptoms. This,
again, suggests that increased BOLD correlation between the basal ganglia and cortical
regions is associated with more adaptive functioning in ASD.
Overall, results suggest that both overconnectivity and underconnectivity contribute
to RB symptoms. This partially aligns with previous findings; however, a greater degree of
underconnectivity in the basal ganglia and overconnectivity in the DMN were found
compared to other recent, similar studies. Inconsistencies in the literature may be due, in
part, to methodological factors. In particular, underconnectivity is most commonly reported
for studies whose designs include task effects, whereas those using task regression or resting-
state data have tended to show mixed results (Müller et al., 2011). Similarly,
underconnectivity tends to predominate in the absence of low-pass or band-pass filtering and
may also receive more focus than overconnectivity when the field of view is limited to ROIs
rather than the whole brain (Nair, in press). Current findings appear most consistent with
other studies using whole-brain analyses to measure intrinsic connectivity. Additionally,
patterns of connectivity could be characterized, in large part, by the differentiation of
functional networks. Useful indices of network connectivity include network integrity and
network segregation, both of which appeared to be related to ASD symptoms. Therefore,
investigating brain networks and their interactions on a systems-level may facilitate a more
comprehensive understanding of altered brain processing in ASD and associated behaviors.
LIMITATIONS
Several steps throughout the data collection and analyses could be refined in future
studies to allow greater sensitivity to between-group differences. For the current study, there
was a variable lag between participants’ fMRI data acquisition and RBS–R administration
with the longest time difference being two years for three participants; however, for most,

30
imaging data and questionnaires were completed at the same time. This is important because
RB has been shown to decrease with age while developmental changes occurring during
childhood and adolescence create a rapidly changing brain landscape. Data, therefore, may
have incurred some loss in sensitivity, particularly to the correlation between behavioral and
brain imaging measures.
Taking into consideration the subtypes of diagnoses may also improve the sensitivity
of data analyses. In particular, an area in the SN has been shown to differ between those with
Asperger syndrome and those with ASD. Controlling for diagnoses or symptom severity
may reveal additional differences in connectivity between subgroups. Likewise, future
studies may take into account more qualitative components of repetitive behavior, including
the context in which they occur (i.e. negative vs. positive situations). The RBS–R showed
high correlations with the diagnostic and other behavioral measures, yet it proved to be the
most sensitive in correlating with functional connectivity measures, even with a smaller
sample size than related behavioral measures, which had a larger sample size. This increased
sensitivity may be due to the breadth of behaviors assessed with the RBS–R. When tested
using a larger sample size, the RBS–R may be particularly instrumental in discerning
between types of RB (motor vs. cognitive) and moving toward characterizing individual
ASD subtypes.
The current study is the first to explore abnormal functional connectivity in ASD in
relation to RB symptoms using a psychometrically validated scale specifically designed to do
so. RB continues to be a prevalent symptom of ASD though its link with
sociocommunicative symptoms remains largely unknown. Identifying this link and
understanding the role of RB in ASD will be important for characterizing the disorder
neurologically, especially as recent changes in diagnostic criteria place increased emphasis
on RB symptoms, giving both breadth and depth of RB symptoms greater weight among the
three core characteristics of ASD (APA, 2013).

31
REFERENCES
Agam, Y., Joseph, R. M., Barton, J. J. S., & Manoach, D. S. (2010). Reduced cognitive
control of response inhibition by the anterior cingulate cortex in autism spectrum
disorders. NeuroImage, 52(1), 336–347.
Alexander, G. E., DeLong, M. R., & Strick, P. L. (1986). Parallel organization of
functionally segregated circuits linking basal ganglia and cortex. Annual review of
neuroscience, 9(1), 357–381.
American Psychiatric Association [APA]. (2013). Diagnostic and statistical manual of
mental disorders. Washington, D.C.: American Psychiatric Publishing.
Arnott, B., McConachie, H., Meins, E., Fernyhough, C., Couteur, A. L., Turner, M., …
Leekam, S. (2010). The frequency of restricted and repetitive behaviors in a
community sample of 15-month-old Infants. Journal of Developmental & Behavioral
Pediatrics, 31(3), 223.
Assaf, M., Jagannathan, K., Calhoun, V. D., Miller, L., Stevens, M. C., Sahl, R., … Pearlson,
G. D. (2010). Abnormal functional connectivity of default mode sub-networks in
autism spectrum disorder patients. NeuroImage, 53(1), 247–256.
Badre, D., Hoffman, J., Cooney, J. W., & D'Esposito, M. (2009). Hierarchical cognitive
control deficits following damage to the human frontal lobe. Nature Neuroscience,
12(4), 515–522.
Bodfish, J. W., Symons, F. J., Parker, D. E., & Lewis, M. H. (2000). Varieties of repetitive
behavior in autism: Comparisons to mental retardation. Journal of Autism and
Developmental Disorders, 30(3), 237–243.
Bodfish, J. W., Symons, F. J., Lewis, M. H. (1999). The repetitive behavior scale.
Cullowhee, NC: Western Carolina Center Research Reports.
Boyd, B. A., McBee, M., Holtzclaw, T., Baranek, G. T., & Bodfish, J. W. (2009).
Relationships among repetitive behaviors, sensory features, and executive functions
in high functioning autism. Research in Autism Spectrum Disorders, 3(4), 959–966.
Centers for Disease Control and Prevention [CDC]. (2012). Autism spectrum disorders: Data
& statistics. Retrieved from http://www.cdc.gov/ncbddd/autism/data.html
Colman, R. S., Frankel, F., Ritvo, E., & Freeman, B. J. (1976). The effects of fluorescent and
incandescent illumination upon repetitive behaviors in autistic children. Journal of
Autism and Childhood Schizophrenia, 6(2), 157–162.
Constantino, J. N., & Gruber, C. P. (2002). The social responsiveness scale. Los Angeles,
CA: Western Psychological Services.
Cox, R. W. (1996). AFNI: Software for analysis and visualization of functional magnetic
resonance neuroimages. Computers and Biomedical Research, 29(3) 162–173.
32
Di Martino, A., Kelly, C., Grzadzinski, R., Zuo, X. N., Mennes, M., Mairena, M. A., …
Milham, M. P. (2011). Aberrant striatal functional connectivity in children with
autism. Biological Psychiatry, 69(9), 847–856.
Di Martino, A., Scheres, A., Margulies, D., Kelly, A., Uddin, L., Shehzad, Z., … Milham, M.
(2008). Functional connectivity of human striatum: A resting state FMRI study.
Cerebral Cortex, 18(12), 2735–2747.
Dichter, G. S., & Belger, A. (2008). Atypical modulation of cognitive control by arousal in
autism. Psychiatry Research: Neuroimaging, 164(3), 185–197.
Dichter, G. S., Felder, J. N., & Bodfish, J. W. (2009). Autism is characterized by dorsal
anterior cingulate hyperactivation during social target detection. Social Cognitive &
Affective Neuroscience, 4(3), 215–226.
Dichter, G. S., Sikich, L., Mahorney, S., Felder, J. N., Lam, K. S. L., Turner-Brown, L., &
Bodfish, J. (2010). fMRI tracks reductions in repetitive behaviors in autism: Two case
studies. Neurocase, 16(4), 307–316.
Dosenbach, N. U., Visscher, K. M., Palmer, E. D., Miezin, F. M., Wenger, K. K., Kang, H.
C., … Petersen, S. E. (2006). A core system for the implementation of task sets.
Neuron, 50(5), 799–812.
Dunn, W. (1994). Performance of typical children on the sensory profile: An item analysis.
The American Journal of Occupational Therapy, 48(11), 967–974.
Ebisch, S. J. H., Gallese, V., Willems, R. M., Mantini, D., Groen, W. B., Romani, G. L., …
Bekkering, H. (2010). Altered intrinsic functional connectivity of anterior and
posterior insula regions in high‐functioning participants with autism spectrum
disorder. Human Brain Mapping, 32(7), 1013–1028.
Estes, A., Shaw, D. W., Sparks, B. F., Friedman, S., Giedd, J. N., Dawson, G., … Dager, S.
R. (2011). Basal ganglia morphometry and repetitive behavior in young children with
autism spectrum disorder. Autism Research, 4(3), 212–220.
Fair, D. A., Dosenbach, N. U., Church, J. A., Cohen, A. L., Brahmbhatt, S., Miezin, F. M., …
Schlaggar, B. L. (2007). Development of distinct control networks through
segregation and integration. Proceedings of the National Academy of Sciences,
104(33), 13507–13512.
Fischl, B., van der Kouwe, A., Destrieux, C., Halgren, E., Ségonne, F., Salat, D. H., … Dale,
A. M. (2004). Automatically parcellating the human cerebral cortex. Cerebral Cortex,
14(1), 11–22.
Forman, S. D., Cohen, J. D., Fitzgerald, M., Eddy, W. F., Mintun, M. A., & Noll, D. C.
(1995). Improved assessment of significant activation in functional magnetic
resonance imaging (fMRI): Use of a cluster‐size threshold. Magnetic Resonance in
Medicine, 33(5), 636–647.
Fox, M. D., & Raichle, M. E. (2007). Spontaneous fluctuations in brain activity observed
with functional magnetic resonance imaging. Nature Reviews Neuroscience, 8(9),
700–711.
33
Fox, M. D., Snyder, A. Z., Vincent, J. L., Corbetta, M., Van Essen, D. C., & Raichle, M. E.
(2005). The human brain is intrinsically organized into dynamic, anticorrelated
functional networks. Proceedings of the National Academy of Sciences of the United
States of America, 102(27), 9673–9678.
Gabriels, R. L., Agnew, J. A., Miller, L. J., Gralla, J., Pan, Z., Goldson, E., … Hooks, E.
(2008). Is there a relationship between restricted, repetitive, stereotyped behaviors
and interests and abnormal sensory response in children with autism spectrum
disorders? Research in Autism Spectrum Disorders, 2(4), 660–670.
Georgiades, S., Papageorgiou, B., & Anagnostou, E. (2010). Brief report: Repetitive
behaviours in Greek individuals with autism spectrum disorder. Journal of Autism &
Dewvelopmental Disorders, 40(7), 903–906.
Gioia, G. A., Isquith, P. K., Guy, S. C., & Kenworthy, L. (2000). Test review behavior rating
inventory of executive function. Child Neuropsychology, 6(3), 235–238.
Gotts, S. J., Simmons, W. K., Milbury, L. A., Wallace, G. L., Cox, R. W., & Martin, A.
(2012). Fractionation of social brain circuits in autism spectrum disorders. Brain,
135(9), 2711-2725.
Hollander, E., Anagnostou, E., Chaplin, W., Esposito, K., Haznedar, M. M., Licalzi, E., …
Buchsbaum, M. (2005). Striatal volume on magnetic resonance imaging and
repetitive behaviors in autism. Biological Psychiatry, 58(3), 226.
Huettel, S. S., Song, A. W., & McCarthy, G. (2009). Functional magnetic resonance
imaging. Sunderland, MA: Sinauer Associates.
Johnson, M. H. (2003). Development of human brain functions. Biological Psychiatry,
54(12), 1312–1316.
Kana, R. K., Keller, T. A., Minshew, N. J., & Just, M. A. (2007). Inhibitory control in high-
functioning autism: Decreased activation and underconnectivity in inhibition
networks. Biological Psychiatry, 62(3), 198-206.
Kennedy, D. P., & Courchesne, E. (2008). Functional abnormalities of the default network
during self- and other-reflection in autism. Social Cognitive and Affective
Neuroscience, 3(2), 177–190.
Kennedy, D. P., Redcay, E., & Courchesne, E. (2006). Failing to deactivate: resting
functional abnormalities in autism. Proceedings of the National Academy of Sciences,
103(21), 8275–8280.
Langen, M., Schnack, H. G., Nederveen, H., Bos, D., Lahuis, B. E., de Jonge, M. V., …
Durston, S. (2009). Changes in the developmental trajectories of striatum in autism.
Biological Psychiatry, 66(4), 327–333.
Liss, M., Saulnier, C., Fein, D., & Kinsbourne, M. (2006). Sensory and attention
abnormalities in autistic spectrum disorders. Autism, 10(2), 155–172.

34
Loh, A., Soman, T., Brian, J., Bryson, S. E., Roberts, W., Szatmari, P., … Zwaigenbaum, L.
(2007). Stereotyped motor behaviors associated with autism in high-risk infants: A
pilot videotape analysis of a sibling sample. Journal of Autism and Developmental
Disorders, 37(1), 25–36.
Lombardo, M. V., Chakrabarti, B., Bullmore, E. T., Sadek, S. A., Pasco, G., Wheelwright, S.
J., … Baron-Cohen, S. (2010). Atypical neural self-representation in autism. Brain,
133(2), 611–624.
Lord, C., Risi, S., Lambrecht, L., Cook E. H., Leventhal, B. L., DiLavore, P. C., … Rutter,
M. (2000). The autism diagnostic observation schedule-generic: A standard measure
of social and communication deficits associated with the spectrum of autism. Journal
of Autism and Developmental Disorders, 30(3), 205–223.
Lord, C., Rutter, M., & Couteur, A. (1994). Autism diagnostic interview-revised: A revised
version of a diagnostic interview for caregivers of individuals with possible pervasive
developmental disorders. Journal of Autism and Developmental Disorderds, 24(5),
659–685.
Lopez, B. R., Lincoln, A. J., Ozonoff, S., & Lai, Z. (2005). Examining the relationship
between executive functions and restricted, repetitive symptoms of autistic disorder.
Journal of Autism and Developmental Disorders, 35(4), 445–460.
Monk, C. S., Peltier, S. J., Wiggins, J. L., Weng, S. J., Carrasco, M., Risi, S., & Lord, C.
(2009). Abnormalities of intrinsic functional connectivity in autism spectrum
disorders. NeuroImage, 47(2), 764.
Mosconi, M., Kay, M., D'Cruz, A. M., Seidenfeld, A., Guter, S., Stanford, L., & Sweeney, J.
(2009). Impaired inhibitory control is associated with higher-order repetitive
behaviors in autism spectrum disorders. Psychological Medicine, 39(9), 1559–1566.
Mostofsky, S. H., Powell, S. K., Simmonds, D. J., Goldberg, M. C., Caffo, B., & Pekar, J. J.
(2009). Decreased connectivity and cerebellar activity in autism during motor task
performance. Brain, 132(9), 2413–2425.
Müller, R. A., Shih, P., Keehn, B., Deyoe, J. R., Leyden, K. M., & Shukla, D. K. (2011).
Underconnected, but how? A survey of functional connectivity MRI studies in autism
spectrum disorders. Cerebral Cortex, 21(10), 2233–2243.
Müller, R. A. (2007). The study of autism as a distributed disorder. Mental Retardation and
Developmental Disabilities Research Reviews, 13(1), 85–95.
Nair, A., Keown, C. L., Datko, M., Shih, P., Keehn, B., Müller, R. A. (2013). Impact of
methodological variables on functional connectivity findings in Autism Spectrum
Disorders. Manuscript submitted for publication.
Ohta, H., Yamada, T., Watanabe, H., Kanai, C., Tanaka, E., Ohno, T., … Hashimoto, R.
(2012). An fMRI study of reduced perceptual load-dependent modulation of task-
irrelevant activity in adults with autism spectrum conditions. NeuroImage, 61(4),
1176–1187.

35
Oldfield, R. C. (1971). The assessment and analysis of handedness: The Edinburgh
inventory. Neuropsychologia, 9(1), 97–113.
Posner, M. I., & Peterson, S. E. (1990). The attention network system of the human brain.
Annual Review of Neuroscience, 13, 25–42.
Postuma, R. B., & Dagher, A. (2006). Basal ganglia functional connectivity based on a meta-
analysis of 126 positron emission tomography and functional magnetic resonance
imaging publications. Cerebral Cortex, 16(10), 1508–1521.
Power, J. D., Barnes, K. A., Snyder, A. Z., Schlaggar, B. L., & Petersen, S. E. (2012).
Spurious but systematic correlations in functional connectivity MRI networks arise
from subject motion. NeuroImage, 59(3), 2142–2154.
Rodgers, J., Glod, M., Connolly, B., & McConachie, H. (2012). The relationship between
anxiety and repetitive behaviours in autism spectrum disorder. Journal of Autism and
Developmental Disorders, 42(11), 2404–2409.
Rudie, J. D., Shehzad, Z., Hernandez, L. M., Colich, N. L., Bookheimer, S. Y., Iacoboni, M.,
& Dapretto, M. (2012). Reduced functional integration and segregation of distributed
neural systems underlying social and emotional information processing in autism
spectrum disorders. Cerebral Cortex, 22(5), 1025–1037.
Saad, Z. S., Gotts, S. J., Murphy, K., Chen, G., Jo, H. J., Martin, A., & Cox, R. W. (2012).
Trouble at rest: How correlation patterns and group differences become distorted after
global signal regression. Brain Connectivity, 2(1), 25–32.
Schumann, C. M., Bloss, C. S., Barnes, C. C., Wideman, G. M., Carper, R. A., Akshoomoff,
N., … Lord, C. (2010). Longitudinal magnetic resonance imaging study of cortical
development through early childhood in autism. The Journal of Neuroscience, 30(12),
4419–4427.
Sears, L. L., Vest, C., Mohamed, S., Bailey, J., Ranson, B. J., & Piven, J. (1999). An MRI
study of the basal ganglia in autism. Progress in Neuro-Psychopharmacology and
Biological Psychiatry, 23(4), 613–624.
Seeley, W. W., Menon, V., Schatzberg, A. F., Keller, J., Glover, G. H., Kenna, H., …
Greicius, M. D. (2007). Dissociable intrinsic connectivity networks for salience
processing and executive control. The Journal of Neuroscience, 27(9), 2349–2356.
Shafritz, K. M., Dichter, G. S., Baranek, G. T., & Belger, A. (2008). The neural circuitry
mediating shifts in behavioral response and cognitive set in autism. Biological
Psychiatry, 63(10), 974–980.
Shih, P., Keehn, B., Oram, J. K., Leyden, K. M., Deown, C. L., & Müller, R. A. (2011).
Functional differentiation of posterior superior temporal sulcus in autism: A
functional connectivity magnetic resonance imaging study. Biological Psychiatry,
70(3), 270–277.
Sridharan, D., Levitin, D. J., & Menon, V. (2008). A critical role for the right fronto-insular
cortex in switching between central-executive and default-mode networks.
Proceedings of the National Academy of Sciences, 105(34), 12569–12574.
36
Stevens, M. C., Pearlson, G. D., & Calhoun, V. D. (2009). Changes in the interaction of
resting‐state neural networks from adolescence to adulthood. Human Brain Mapping,
30(8), 2356–2366.
Talairach, J., & Tournoux, P. (1988). Co-planar stereotaxic atlas of the human brain. 3-
Dimensional proportional system: An approach to cerebral imaging. New York, NY:
Thieme.
Thakkar, K. N., Polli, F. E., Joseph, R. M., Tuch, D. S., Hadjikhani, N., Barton, J. J. S., &
Manoach, D. S. (2008). Response monitoring, repetitive behaviour and anterior
cingulate abnormalities in autism spectrum disorders (ASD). Brain, 131(9), 2464–78.
Turner, K. C., Frost, L., Linsenbardt, D., McIlroy, J. R., & Müller, R. A. (2006). Atypically
diffuse functional connectivity between caudate nuclei and cerebral cortex in autism.
Behavioal Brain Function, 2, 34.
Turner, M. (1999). Repetitive behaviour in autism: A review of psychological research.
Journal of Child Psychology and Psychiatry, 40(6), 839–849.
Uddin, L. Q., & Menon, V. (2009). The anterior insula in autism: Under-connected and
under-examined. Neuroscience and Biobehavioral Reviews, 33(8), 1198.
Van Dijk, K. R., Hedden, T., Venkataraman, A., Evans, K. C., Lazar, S. W., & Buckner, R.
L. (2010). Intrinsic functional connectivity as a tool for human connectomics: Theory,
properties, and optimization. Journal of Neurophysiology, 103(1), 297–321.
Van Dijk, K. R., Sabuncu, M. R., & Buckner, R. L. (2012). The influence of head motion on
intrinsic functional connectivity MRI. NeuroImage, 59(1), 431–438.
Vissers, M. E., Cohen, M. X., & Geurts, H. M. (2012). Brain connectivity and high
functioning autism: A promising path of research that needs refined models,
methodological convergence, and stronger behavioral links. Neuroscience &
Biobehavioral Reviews, 36(1), 604–625.
Wechsler, D. (2008). Wechsler Adult Intelligence Scale. San Antonio, TX: Harcourt
Assessment.
Weng, S. J., Wiggins, J. L., Peltier, S. J., Carrasco, M., Risi, S., Lord, C., & Monk, C. S.
(2010). Alterations of resting state functional connectivity in the default network in
adolescents with autism spectrum disorders. Brain Research, 1313, 202–214.
Willemsen-Swinkels, S. H. N., Buitelaar, J. K., Dekker, M., & van Engeland, H. (1998).
Subtyping stereotypic behavior in children: The association between stereotypic
behavior, mood, and heart rate. Journal of Autism and Developmental Disorders,
28(6), 547–557.
Zielinski, B. A., Anderson, J. S., Froehlich, A. L., Prigge, M. B. D., Nielsen, J. A.,
Cooperrider, J. R., … Lange, N. (2012). scMRI reveals large-scale brain network
abnormalities in autism. PloS one, 7(11), e49172. doi:10.1371/journal.pone.0049172


![Review Article ...downloads.hindawi.com/journals/ijped/2009/198736.pdf · repetitive behaviors [1]. Autism Disorder (AD) comorbidy with seizures and mental retardation occurs in up](https://img.pdfslide.net/doc/110x75/5fb96d0d49cc9976aa3ce665/review-article-repetitive-behaviors-1-autism-disorder-ad-comorbidy-with.jpg)