Embed Size (px)
Citation preview

NEURAL RESPONSES TO INJURY: PREVENTION, PROTECTION, AND REPAIR Annual Technical Report 1996
SOU ffj
Submitted by
Nicolas G. Bazan, M.D., Ph.D. Project Director
Period Covered: 20 September, 1995, through 19 September, 1996
Cooperative Agreement DAMD17-93-V-3013
between
United States Army Medical Research and Development Command (Walter Reed Army Institute of Research)
and
Louisiana State University Medical Center Neuroscience Center of Excellence
Volume 8 of 9
D-jlG ^üJkiEfX L^-ö^^.
\v0& \#
Vision, Laser Eye Injury, and Infectious Diseases
Project Directors: Herbert E. Kaufman, M.D. Roger W. Beuerman, Ph.D.

ANIMAL USE SEPTEMBER 20,1995 THROUGH JULY, 1996
DAMD17-93-V-3013
The experimental animals used during this period for the project, Neural Responses to Injury: Prevention, Protection, and Repair, Subproject: Vision, Laser Eye Injury and Infectious Diseases, are as follows:
Species Number Allowed Number Used LSUIACUC#
Cynomolgus monkey 28 16 #1015
squirrel monkey 20 20 #671/1218
rabbit 250 35 #1049
squirrel monkey 11 0 #1049
~ZUdr& Investigator Signatur
ii
Volume 8 Vision, Laser Eye Injury, and Infectious Diseases Project Director: Herbert E. Kaufman, M.D.
Roger Beuerman, Ph.D.
Participating Scientists: Claude A. Burgoyne, M.D. Emily Varnell Mandi Conway, M.D.
Cover Page i Foreword ii Animal Use iii Table of Contents iv Specific Aims 1 Studies and Results 1 Confocal Microscopy 1
Development of the Confocal Microscope 1 Three-dimensional reconstruction of images using real-time confocal microscopy 1
Methods 4 Model 1: Posterior stroma and endothelium 5 Model 2: Stroma 6 Model 3: Full-thickness corneal reconstruction 6 Model 4: Illustration of object enclosed within volume 7 Model 5: Reconstruction from cross-sections 7
Results 8 Model 1 8 Model 2 9 Model 3 9 Model 4 9 Model 5 10
Development of a rugged, protable model of the confocal microscope 10 References 12 Appendix I 15
Corneal damage after exposure to ultraviolet and short wave lasers and ultraviolet light 50
References 51 Glaucoma, Traumatic and Non-Traumatic 51
Pathogenesis of optic nerve damage in glaucoma 51 Methods and Results 52
Study 01 52 Study 04 55
References 56 Appendix II 58
1X1

Herpes: The Prevention of Recurrences of Viral Disease 75 Beta blocker modulation of viral reactivation 75 References 80
Kaufman SC, Beuerman RW, Greer DL (1995) Confocal microscopy: A new tool for the study of nail unit. J Am Acad Dermatol 32:668-670.
Kaufman SC, Laird J, Beuerman RW (1996) In vivo immunofluorescence confocal microscopy of herpes simplex virus type 1 keratitis. SPIE 2673:2-5.
Laird JA, Beuerman RW, Kaufman SC (1996) Quantification of confocal images of human corneal endothelium. SPIE 2673:224-227.
Kaufman SC, Hamano H, Beuerman RW, Laird JA, Thompson HW (1996) Transient corneal stromal and endothelial changes following soft contact lens wear: A study with confocal microscopy. CLAO 22:127-132.
iv

I. SPECIFIC AIMS
1. Study a new confocal microscope that can be used in living eyes to understand the earliest
stages of trauma, laser injuries and diseases.
2. Evaluate drugs to prevent retinal damage after laser injury
3. Study traumatic and non-traumatic glaucoma to determine its pathogenesis
4. Study drugs that will prevent the recurrences of ocular herpes
II. STUDIES AND RESULTS
A. Confocal Microscopy
1. Development of the confocal microscope
a. Three-dimensional reconstruction of images using real-time confocal
microscopy
Confocal microscopy is an imaging technique that allows non-invasive optical sectioning of
semi-transparent biological specimens (1-16). It offers improved lateral and axial resolution, as well
as superior out-of-focus noise rejection.
The cornea, which is a transparent structure contiguous with the sclera at the anterior pole
of the eye, is particularly well suited for examination by confocal microscopy. It is approximately
0.52 mm thick and is composed of five layers: the corneal epithelium, which is the outside layer that
is in contact with the tear film; Bowman's layer; the stroma; Descemet's layer; and the corneal
endothelium. By far the largest component is the stroma, which constitutes about 90% of the
thickness of the cornea. Although corneas of experimental animals and humans have been

successfully imaged in vivo by confocal microscopy, a full three-dimensional reconstruction of the
living human cornea has never before been accomplished.
Over the past year, we have developed the ability to produce full-thickness, three-
dimensional reconstructions from multiple optical sections of the normal in vivo human cornea. The
position on the z axis of each of the 77 optical sections was determined by noting which stromal
nuclei were shared between adjacent sections. An important finding was that the three-dimensional
reconstruction allowed visualization of structures that were not apparent in conventional optical
sections or in single confocal sections because of the limited density of the object in any one section.
Because the processing techniques make it possible to take arbitrary sections through any plane of
the volume, structures coursing through several optical sections, such as nerves, could be viewed in
their entirety by viewing an oblique section of the reconstruction.
Additional goals of this study were to determine whether potential problems of the
reconstruction process, such as variable light intensity, uneven lighting across the field of view in
quantification of the z-axis, and unwanted movement of the eye, could be successfully addressed.
The problem of differences in light intensity, which may vary considerably with the depth
of the plane of focus, was solved by normalizing the light conditions during preprocessing of the
images before reconstruction. When biological specimens are examined, the relationship between
light levels and the z-axis is not always linear; previous investigators have attempted to compensate
by manually adjusting the gain during acquisition. In our study, the images that we obtained
appeared to have generally similar contrast in terms of signal-to-noise ratios throughout the depth
of the scan, so compensating for that aspect was not a major problem.
In the examination of patients with the confocal microscope, it has been possible to scan
2

rapidly through the cornea from the epithelial to the endothelial surface. However, this type of scan
is difficult to carry out because of movement artifacts, including the saccadic movements of the eye,
which are about 100 |^m in amplitude, as well as involuntary movements by the patient whose eye
is being examined. These movements make it difficult to locate a precise point along the z-axis,
because the contact point for the objective of the confocal microscope on the corneal surface may
shift by several microns during the time period of the pursuit of the change of the focal plane from
the anterior to the posterior surfaces of the cornea. This is also a major limitation in our ability to
develop three-dimensional reconstructions from real-time images.
In future studies, it may be possible to use a digitally controlled motor to rapidly scan the z-
axis, thereby minimizing the opportunities for eye movement. To be practical, such a scan would
need to be accomplished in 2 to 3 seconds. Digital control of the scan would not only allow for rapid
scan times, but also permit automation of the digitization processing reconstruction steps. Coupled
with digital image analysis, this would allow scrutiny of the shutter with the digital scan and provide
a series of confocal images taken at specified steps through the z-axis.
Current efforts to develop approaches to in vivo, real-time three-dimensional reconstruction
are timely in terms of available computer resources. Expansion of electronic memory for personal
computers and the development of the 1 gigabyte memory chip will allow manipulation of these
image rapidly in electronic, volatile memory, and soon (within 3-5 years at the most), it will be
possible to perform on-line three-dimensional reconstructions of images in reasonable amounts of
time for clinical use.
This capability would be invaluable for the diagnosis of corneal diseases such as dystrophies
and infectious keratitis, and for the evaluation of trauma and foreign bodies in the cornea. Thus, the

techniques we have developed to create these three-dimensional reconstructions may provide a
foundation for an imaging modality that could be used to diagnose corneal pathology and evaluate
corneal injury, as well as to follow the progress of treatment in the living eye.
Methods:
The human cornea was examined in vivo using a single-sided confocal microscope system.
All confocal images were obtained from human volunteers who signed an Informed Consent
document that had been approved by our Institutional Review Board (IRB). In addition, tissue from
a rabbit cornea provided physical sections that were used to create one model. Use of animals
adhered to the ARVO Resolution on the Use of Animals in Research.
The tandem scanning confocal microscope used in this study employed a single-sided
Nipkow disc with 2% transmission of light. Illumination was provided by a 100 W mercury lamp
and a silica-clad, silica core 1.00 mm fiber optic cable. The objective lens was a modified specular
microscope objective (BioOptics) fitted with a smooth glass dipping cone with a slightly concave
front surface to match the curvature of the eye.
Volunteers were seated in front of the microscope with their chin and forehead resting against
the microscope frame to immobilize the head. The eye was treated with a drop of a topical anesthetic
(proparacaine hydrochloride). Methyl cellulose solution (Goniosol) placed on the cornea served to
reduce surface reflections from the cornea. The objective was brought into contact with the layer of
Methyl cellulose. The focusing mechanism on the objective lens was then adjusted to vary the plane
of focus, enabling the viewing of the cornea at every depth.
Images obtained with the microscope were collected with a high sensitivity, grey scale CCD
4

video camera (VideoScope, Inc.) and viewed on an external video monitor. Examinations were
simultaneously archived on S-VHS videotape. These images were later digitized using a desktop
computer equipped with video capture hardware. The Epix 4Meg capture card (Epix, Inc.) is capable
of capturing a stream of 54 images at full size (640 x 480 pixels) and full frame rate (30
frames/second) with no compression, which is approximately 2 seconds worth of video data. The
images were stored as 8-bit grey scale TIFF files.
All image processing and enhancement routines performed on individual images were
accomplished with the Optimas software package (Optimas, Inc.). Optimas allows for completely
customizable routines and convenient scripting of routines. Three-dimensional reconstructions were
carried out with Analyze (CNSoftware, Ltd.), running on a Silicon Graphics Indigo workstation
(SGI, Inc.). Analyze permits three-dimensional visualization of volumetric image data by rendering
algorithms and also quantitative measurements within volume data.
Model 1: Posterior stroma and endothelium
We obtained and digitized 43 consecutive confocal microscopic images of a normal cornea,
beginning in the middle of the stromal layer and extending through the back of the endothelial layer.
To account for uneven light illumination (a characteristic of this confocal system), each image was
sampled to suggest a two-dimensional second order equation to describe the light disparity, which
was subsequently subtracted from each image. This procedure altered the histogram of the images
such that the most reflective bodies, endothelial and stromal nuclei, all had pixel values greater than
a specific threshold grey level, while all other pixels (background pixels) had luminance values
below the threshold level.

The corrected images were then assembled into a volume and rendered using a voxel value
approach. Rays were cast through the volume from the viewpoint surface. The value of the each
pixel displayed in the rendered image was that of the first voxel (volume element) encountered
(within the specified range) along the ray.
Model 2: Stroma
This volume was made up of the same set of corneal sections. The images were processed,
however, such that the background was completely zeroed out. Each individual image was binarized
against the threshold value, such that the background pixels were of luminance value 0 (black) and
reflective bodies were of value 255 (white). The binarized images were then logically ORed against
the background corrected images. This resulted in a set of grey scale images with even black
backgrounds.
Additional steps were taken to eliminate signal noise and image artifacts, which fall into the
foreground range of luminance. Binary erosions followed by dilations and median convolutions
eliminated all undesirable artifacts from the image while preserving the shapes of cellular bodies.
These images were converted into an Analyze volume and rendered in the same manner as
described above.
Model 3: Full-thickness corneal reconstruction
This was an attempt to model the entire thickness of the human cornea. The volume was
composed of 177 sections. Because the video capture card can hold only 54 frames before requiring
purging to disk, acquiring images from the full volume required digitizing the videotaped
6

examination in four passes: 1) the epithelium from the most anterior layer, through the basal lamina,
to where stroma first becomes visible, 2) the anterior half of the stroma, 3) the posterior half of the
stroma, and 4) the endothelium. Individual stromal keratocytes were marked and used as reference
points to register the digitized portions.
Model 4: Illustration of object enclosed within volume
This reconstruction was composed of 46 sections of normal human corneal stroma. Visible
within several adjacent sections was a segment of corneal nerve tissue. The nerve traverses the
volume obliquely, with only subsegments visible in a given two-dimensional slice.
In each two-dimensional section in which nerve tissue was visible, that portion of the image
was manually traced using Analyze's Define Objects module. As object definitions spanned multiple
sections, tracing the nerve segment in all the objects created a separate volume that included only
the nerve segment, while removing the nerve segment from the original volume.
Model 5: Reconstruction from cross-sections
A rabbit cornea was removed and treated with gold chloride solution to stain nerve fibers
throughout the intraepithelial, subepithelial, and stromal levels. Prior to fixation, the tissue was
pierced with a microthin nylon suture. The tissue was then embedded in plastic and sectioned
perpendicular to the surface into 30 urn thick sections, which were mounted on slides.
Each section was viewed under an ordinary light microscope (Nikon Optiphot) using a 20x
water immersion objective lens. The cross section of the microsuture, which was visible in each
section, served as a landmark for registering sequential sections. The sections were imaged at five
7

levels of focus to achieve a higher degree of z-axis resolution. At each level, images were captured
and digitized. Eight images were captured and averaged to eliminate random signal noise. Averaged
images were stored digitally for later processing. In addition, a portion of each slide adjacent to the
tissue was also captured. This served as a background image for the correction of uneven fields of
light intensity. Four slides (20 images of 600 |am x 500 urn), representing a total thickness of 120
|o.m, were used to create the model.
Before the three-dimensional model was constructed from the digitized sections, each section
was processed so as to force the areas of interest to fall within a prescribed range of luminance
values. For each image, the corresponding background image was inverted and the values shifted
down to a zero intensity baseline. This adjusted background image was then added to each captured
image, yielding images with an even distribution of light. Next, the image was inverted to produce
an image in which nerve segments appeared as light bodies against a dark background. Typically,
portions that lie outside the particular plane of focus are less bright than those that are in focus.
The sequence of processed images was stacked using the Analyze software package.
Ray-casting reconstruction methods resulted in a volume that could be rendered from any point of
view and clipped from any side. In order to isolate nerve fibers from the rest of the tissue, the volume
was rendered on the basis of an adjustable threshold range, which optimally included only the range
of luminance values that correspond to nerve fibers. Keratocytes, which also take up gold chloride,
fall into this range and were visible in the volume.
Results:
Model 1: This initial reconstruction of the volume included objects that were difficult to observe,

so this was not pursued but rather transformed into Model 2 (see below).
Model 2: With the background completely zeroed out, the voxel value rendering algorithm
generated an image that appeared translucent, with only endothelial and stromal keratocyte nuclei
falling into the foreground range. As can be seen in Figure 1, the shapes, sizes, and relative positions
of reflective bodies can be appreciated from any angle.
Model 3: The three-dimensional reconstruction in Figure 2 represents a cubic portion of the cornea
encompassing the full corneal thickness from the epithelium to the endothelium. The size of the
reconstruction is 384 urn x 288 um x 525 \xm. The thickness of the reconstruction varies from the
known average thickness of the cornea (520 urn) by only a fraction of a percent. The epithelial cells
and the stromal nuclei can be clearly seen. The lighter areas toward the edge of the epithelium and
the dark area in the stroma are artifacts resulting from incomplete correction of uneven lighting
across the field of view. The smaller nuclei of the endothelium are partially visible on the bottom
surface of the volume. The apparently incomplete coverage of the endothelial cell layer is the result
of the plane of optical section being slightly oblique to the posterior surface of the cornea.
Model 4: The reconstruction in Figure 3 showcases the ability of Analyze to render multiple objects
simultaneously. In this case, the additional object is the segment of corneal nerve tissue, the length
of which spans several two-dimensional sections obliquely. The other object is the remainder of the
volume, the stromal keratocyte nuclei, less the binary mask of the first specified object (the nerve).
Analyze is able to render multiple objects superimposed, with varying degrees of intensity applied
9
to different objects. This enables the user to, for example, fade out the keratocyte nuclei while
highlighting the nerve, perhaps rendering the defined object in a unique color to make it stand out
from the grey scale volume. Also, each object can be rendered independently, facilitating
quantitative measurements of structures.
Model 5: By adjusting clipping and rotational parameters, continuous nerve segments can be traced
throughout their course within the volume (Figure 4). Analyze's Tree Trace module allows tracings
to be recorded. It assigns indices to each nerve (profile seen within brackets) end point or branch
point. In this reconstruction, as stromal nerve is seen in profile; as it approaches the epithelium (at
the upper edge), it divides into two branches. Data relating the connectivity between these points,
as well as distances and angle measurements between segments, are logged as each segment is
traced.
Within the limited range of the volume, a number of disjointed branching nerve segments
were described by this method. For purposes of describing a given segment's level of branching, a
point was termed a branch point if the segment underwent an acute change in direction, not
necessarily whether the segment actually branched. As branching generally proceeded in the anterior
direction, the most posterior branch in each segment was classified as primary, with successive
branches classified as secondary, tertiary, etc. The majority of segments exhibited three levels of
branching, but all ranged between two and five.
b. Development of a rugged, portable model of the confocal microscope
The confocal microscope offers a new approach to rapid, non-invasive diagnosis of infectious
10

and other eye diseases and to the immediate evaluation of the type and extent of injury in ocular
tissue. In the past, however, the confocal microscope has been a somewhat delicate instrument due
to the necessity of accurately locating the position of the disk through which light passes on its way
to the eye being examined and back to the viewer. In fact, some confocal microscopes that are
currently in use are so delicate that they require daily adjustments.
We have been aware of the difficulties associated with this aspect of confocal microscopy,
not only in clinical instruments, but also in broader applications such as mobile units that could be
used in the field. The ability to use the confocal microscope in the field would be an enormous
advantage, as images could be relayed through a satellite uplink to a centrally located eye specialist,
who could make a rapid diagnosis, while only a technician-level individual would be required to
operate the instrument at the other end where the patient is located.
In order to meet the need for a more rugged confocal microscope, the tandem scanning
confocal microscope design was reappraised this past year, and a new design for a rugged
microscope of small size was developed. The new instrument is a cube about 4 inches on a side.
With the addition of a small CCD camera to relay images, the entire instrument is about 6 inches
long and can be carried in a small hand-held container. Also, the optical design has been made
sufficiently stable that daily adjustments are unnecessary; the only absolute requirement for care is
that the microscope not be dropped.
Further work on the design of this microscope is directed toward making the input optics,
as well as the camera optics, as rugged as the internal aspects of the microscope. Also under
development is a device for supporting the microscope that is more mobile than the slit lamp table
in present use. Goals for the coming year are 1) to make the design hand-held, 2) to make the optics
11
accessible for both white light and fluorescence use, and 3) to make the camera and the light input
sections more compact so that the entire microscope will be small enough to be portable in a simple
briefcase-size carrier.
References:
1. Beuerman RW: Editorial: Confocal microscopy: into the clinic. Cornea 14:1-2, 1995.
2. Chew SJ, Lam DSC, Beuerman RW, Kaufman SC, Kaufman HE: Evaluation of giant
papillary conjunctivitis and allergic conjunctivitis with in vivo confocal microscopy.
Ophthalmic Practice 13(1):11-14, 1995.
3. Kaufman SC, Beuerman RW, Greer DL: Confocal microscopy: a new tool for the study of
the nail unit. J Am Acad Dermatol 32:668-670, 1995.
4. Cohen RA, Chew SJ, Gebhardt BM, Beuerman RW, Kaufman HE, Kaufman SC: Confocal
microscopy of corneal graft rejection. Cornea 14:467-472, 1995.
5. Chew SJ, Beuerman RW, Kaufman HE, McDonald MB: In vivo confocal microscopy of
corneal wound healing following excimer laser photorefractive keratectomy. CLAO J
21:273-280,1995.
6. Lam DSC, Chew SJ, Beuerman RW, Kaufman SC, Kaufman HE: Low power telescopic
confocal microscopy of the eye. ARVO Abstract #2327. Invest Ophthalmol Vis Sei Suppl
36:502,1995.
7. Beuerman RW, Kaufman SC, Laird J, Kaufman HE: In vivo, real-time, immunofluorescence
examination of corneal epithelium with the confocal microscope. ARVO Abstract #3211.
Invest Ophthalmol Vis Sei Suppl 36:698, 1995.
12

8. Chu E, Chan TK, Chew SJ, Beuerman RW, Kaufman SC, Kaufman HE: In vivo confocal
microscopy of the human eye in contact lens wear. ARVO Abstract #4737. Invest
Ophthalmol Vis Sei Suppl 36:1022,1995.
9. Kaufman SC, Beuerman RW, Laird J: In vivo real time confocal microscopy of fungal,
bacterial, and acanthamoeba keratitis. ARVO Abstract #4738. Invest Ophthalmol Vis Sei
Suppl 36:1022,1995
10. Zhang DM, Beuerman RW, Zhao S, Tran H, Kline D, Gould H: Cellular factors involved in
neuroma formation. Soc Neurosci Abstr, Vol 21, Part 3, p. 1798, 1995.
11. Kaufman SC, Hamano H, Beuerman RW, Laird JA, Thompson HW : Transient corneal
stromal and endothelial changes following soft contact lens wear: a study with confocal
microscopy. CLAO J 22:127-132,1996.
12. Kaufman SC, Laird JA, Beuerman RW: In vivo immunofluorescent confocal microscopy of
herpes simplex keratitis. SPIE, San Jose, CA, January, 1996. Proceedings of Ophthalmic
Technologies VI, Volume 2673, pp. 2-5,1996.
13. Laird JA, Beuerman RW, Kaufman SC: Quantification of confocal images of human corneal
endothelium. SPIE, San Jose, CA, January, 1996. Proceedings of Ophthalmic Technologies
VI, Volume 2673, pp. 224-227, 1996.
14. Kaufman SC, Laird JA, Beuerman RW: Human corneal endothelial cell quantification using
white light confocal microscope images. ARVO Abstract #392. Invest Ophthalmol Vis Sei
Suppl 37:83,1996.
15. Kaufman SC, Beuerman RW, Goldberg D: A new form of primary localized corneal
amyloidosis: a case report with confocal microscopy. Metabolic, Pediatric and Systemic
13

Ophthalmology, in press.
16. Kaufman SC, Laird JA, Cooper R, Beuerman RW: Diagnosis of bacterial contact lens-related
keratitis with the white-light confocal microscope. CLAO J, in press.
Appendix I:
A. Reference 3
B. Reference 11
C. Reference 12
D. Reference 13
E. Figure 1
F. Figure 2
G. Figure 3
H. Figure 4
14

APPENDIX I
15

A. REFERENCE 3
16

REPRINT ■Jä§7 SPIE—The International Society for Optical Engineering
Reprinted from
Proceedings of
Ophthalmic Technologies VI
27-28 January 1996 San Jose California
P Volume 2673
©1996 by the Society of Photo-Optical Instrumentation Engineers Box 10, Bellingham, Washington 98227 USA. Telephone 360/676-3290.

Quantification of confocal images of human corneal endothelium
Jeffrey A. Laird, Roger W. Beuerman, and Stephen G. Kaufman
LSU Eye Center, Louisiana State University Medical Center School of Medicine, 2020 Gravier Street, Suite B, New Orleans, Louisiana 70112
ABSTRACT
Real-time, in vivo, confocal microscopic examination permits visualization of human corneal endothelium cells as bright bodies organized into a densely packed hexagonal arrangement. Quantification of endothelial cell number would be useful in assessing the condition of this cell layer in various disease states. In this study, we sought to use an image analysis method developed in this laboratory that utilizes digital filtering techniques and morphological operations to determine the boundaries of each cell. Images were corrected to establish a uniform luminance level, and then convolved by various matrices until distinct peaks in luminance value were identified. These peaks were used as seed points from which cell boundaries were recursively expanded until they collided with other cell boundaries. This method automatically counts the number of cells and determines the size and position of each cell. The resulting histograms of cell size are readily indicative of changes in cellular density, cell loss, and deviation from uniform arrangement. The numbers of cells counted by this method are consistently within 3% of the numbers counted manually. Results relating cell counts obtained by manual and computerized methods are as follows: 200/184; 276/262; 87/87; 234/232; 236/232; 299/297; 145/147; 119/122; 237/243; 119/119; 245/253; 189/193. Thus, confocal microscopy coupled with these image analysis and statistical procedures provides an accurate quantitative approach to monitoring the endothelium under normal, pathological, and experimental conditions, such as those following surgery and trauma or in the evaluation of the efficacy of topical therapeutic agents.
Keywords: corneal endothelium, confocal microscopy, image processing
1. INTRODUCTION
White light confocal microscopy facilitates real-time in vivo imaging of the human cornea and has been routinely applied to diagnostic evaluation of the cornea in normal and pathological states.1 The instrument's high- magnification, increased contrast, and optical sectioning capability provide advantages not afforded by other microscopes used in the ophthalmology clinic. As human corneal endothelial cells are amitotic, understanding of endothelial morphology is critical in assessingthe viability of the endothelium in normal and pathological conditions.
In this study, the cells that make up the endothelial layer of the cornea were examined to develop a method of quantifying their two-dimensional organization. The endothelium consists of a single cell layer that forms a mosaic of polygonal cells; individual cells appear as closely packed bright objects with darker junctions where the cells interface. Earlier methods of assessment of endothelial arrangement were carried out by tedious planimetric methods, i.e, manually tracing cell boundaries.2 Wide-field visualization, such as that provided by confocal imaging (Fig. 1), demands that hundreds of cells be identified and quantified. Our method employs computer technology to quickly and accurately determine cell boundaries from confocal micrographs.
224 ISPIE Vol. 26 73 0-8194-2047-6/96/$6.00

2. METHODS
Corneas were examined with a prototype real-time confocal microscope designed for exami- nation of the eye. The subject was seated with the chin and forehead on rests in order to stabilize the head. One eye was examined while the other was fixated on a target to stabilize the position of the eye. The examined eye was treated with a drop of proparacaine hydrochloride, a topical anesthetic, to prevent the blinking in response to physical contact with the objective lens of the microscope.
The confocal microscope employed a single-sided pinhole disk with 2% light transmission and was illuminated by a 100 W mercury lamp and solid core fiber optic cable. The objective lens was a 20x water immersion lens with a conical tip that is shaped to match the curvature of the eye. A few drops of hydroxypropyl methylcellulose were placed on the tip of the lens in order to maintain consistent refractive properties between the eye and lens. Figure 1. Real-time confocal micrograph of human corneal
endothelium. The cells, which are organized in hexagonal arrangement, appear as bright bodies with dark junctions. An 8-bit grey scale CCD video camera
(VideoScope, Washington, DC) was mounted on the microscope. The camera's gain and pedestal were set to allow imaging within the maximum grey range. Clinical examinations were archived via S-VHS tape recording. From these, 12 images were selected which afforded full views of the normal corneal endothelium. Short-duration streams of video data were captured and digitized using a PC-based video capture board (Epix, Buffalo Grove, Illinois) with a resolution of 752 x 480. Frames were assessed individually to determine the clearest and most stationary view of the endothelium. Four successive frames were averaged to eliminate signal noise. The averaged images were saved (with no compression) to disk as TIFF files.
The digitized images were first processed to correct for the unevenness of the illumination field introduced by the fiber optic illumination system. Uneven backgrounds frustrate the ability to isolate foreground objects across the entire region of interest by means of thresholding. An image obtained with this system is characteristically brightest at a point near the center, with brightness dissipating radially. To account for this, the image was sampled to suggest a two-dimensional second-order polynomial contour, which served as a background image. The back- ground image was then subtracted from the original to render an image with a uniform variation across the surface.
As endothelial tissue is comprised of a confluent mosaic of packed cells, the edges between them must be accentuated before object detection algorithms are able to determine the position of each cell. The junctions between cells were not sufficiently clear enough to allow segmentation on the basis of thresholding alone. A watershed segmentation algorithm, as implemented by the Optimas (Optimas Corp, Bothell, Washington) software package, was used to generate images which show clear distinction between cells and junctions. The watershed algorithm works by finding a set of local luminance minima across the region of interest.3 These minima serve as seeds from which areas are grown outward until they encounter neighboring areas.
SPIE Vol. 2673/225
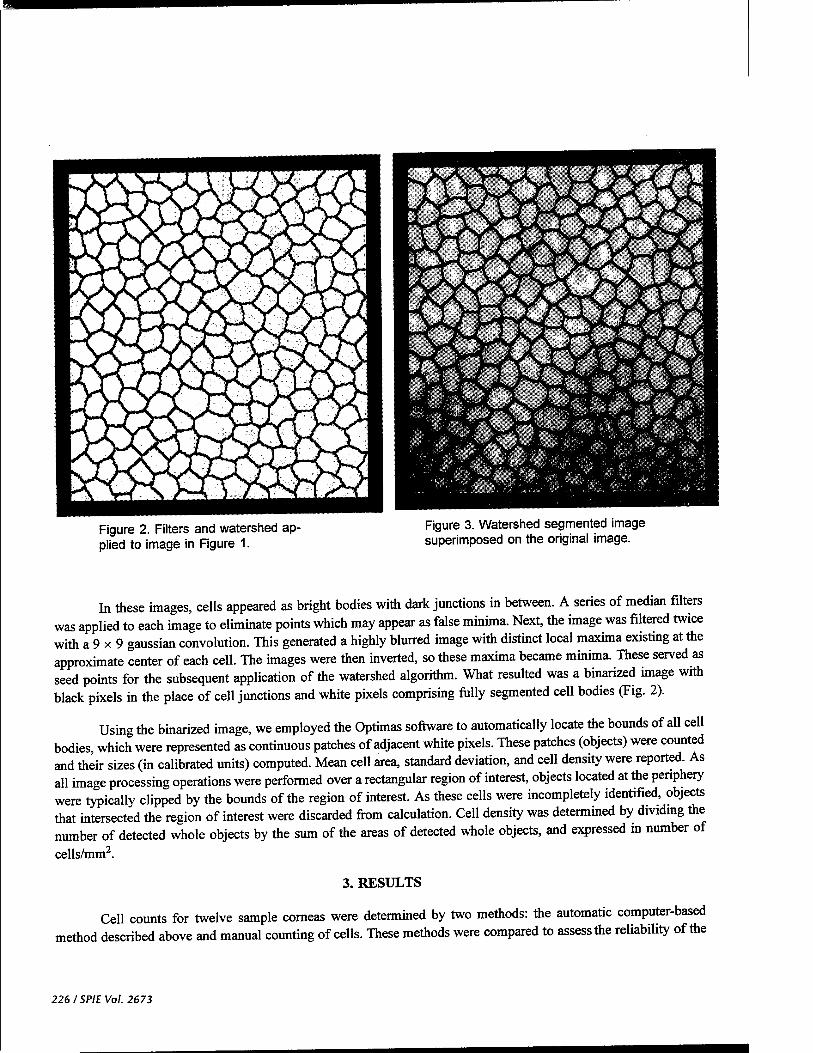
Figure 2. Filters and watershed ap- plied to image in Figure 1.
Figure 3. Watershed segmented image superimposed on the original image.
In these images, cells appeared as bright bodies with dark junctions in between. A series of median filters was applied to each image to eliminate points which may appear as false minima. Next, the image was filtered twice with a 9 x 9 gaussian convolution. This generated a highly blurred image with distinct local maxima existing at the approximate center of each cell. The images were then inverted, so these maxima became minima. These served as seed points for the subsequent application of the watershed algorithm. What resulted was a binarized image with black pixels in the place of cell junctions and white pixels comprising fully segmented cell bodies (Fig. 2).
Using the binarized image, we employed the Optimas software to automatically locate the bounds of all cell bodies, which were represented as continuous patches of adjacent white pixels. These patches (objects) were counted and their sizes (in calibrated units) computed. Mean cell area, standard deviation, and cell density were reported. As all image processing operations were performed over a rectangular region of interest, objects located at the periphery were typically clipped by the bounds of the region of interest. As these cells were incompletely identified, objects that intersected the region of interest were discarded from calculation. Cell density was determined by dividing the number of detected whole objects by the sum of the areas of detected whole objects, and expressed in number of
cells/mm2.
3. RESULTS
Cell counts for twelve sample corneas were determined by two methods: the automatic computer-based method described above and manual counting of cells. These methods were compared to assess the reliability of the
226 ISPIE Vol. 2673
. computer-based method. It was found that cell counts were typically within 3% of the actual number as determined by manual counting (Table 1).
The accuracy of the method was easily appreciated by superimposing the segmented image upon the original (Fig. 3). The discrep- ancy between the manual and automatic meth- ods arose where seed points were incorrectly identified. Multiple seed points within the boundaries of one cell resulted in a cell being split. If no seed point was found, then two or three cells were counted as one. In the sample images where some error occurred, the num- bers of split cells and the numbers of grouped cells were similar, resulting in a minimized count error.
Table 1. Cell counts and computed cellular densities obtained by manual and computer-based counting methods
Sample No.
Manual Counting No. of Cells
Density (cells/mm2)
Automated Counting No. of Density Cells (cells/mm2)
1 200 3981 184 3662 2 276 4238 262 4023 3 87 2554 87 2554 4 234 3025 232 2999 5 236 3074 232 3022 6 299 3143 297 3122 7 145 2798 147 2836 8 119 2933 122 3007 9 237 2802 243 2873
10 119 2719 119 2719 11 245 2734 253 2824 12 189 2940 193 3002
4. CONCLUSION
Image analysis methods were used to develop a method of quantifying the morphological properties of the human corneal endothelium. Confocal microscopy coupled with these image analysis and statistical procedures provides an accurate quantitative approach to monitoring the corneal endothelium under normal, pathological, and experimental conditions, such as those following surgery and trauma or in the evaluation of the efficacy of topical therapeutic agents. Furthermore, these results show the clinical confocal microscope to be an alternative to the use of specular microscope. While the latter is found in ophthalmology clinics solely to examine the endothelium, confocal microscopy has been used to image the epithelial layer4 and stroma5 as well.
5. ACKNOWLEDGEMENTS
This work was supported in part by Department of the Army, Cooperative Agreement DAMD17-93-V-3013 (This does not necessarily reflect the position or the policy of the government, and no official endorsement should be inferred.); EY02377, National Eye Institute, N.I.H.. Bethesda, Maryland; and funds from the Visionary Gala.
6. REFERENCES
1. R. W. Beuerman, J. A. Laird, S. C. Kaufman, and H. E. Kaufman, "Quantification of real-time confocal images of the human cornea," J. Neurosci. Meth, Vol. 54, pp. 197-203, 1994.
2. M. Landesz, J. V. Siertsema, and G. Van Rij, "Comparative study of three semiautomated specular microscopes,"./ Cataract Refract. Surg., Vol. 21, pp. 409-416, 1994.
3. J. C. Russ, The Image Processing Handbook, 2nd Ed. CRC Press, Boca Raton, Florida, pp. 433-438, 1995. 4. S. J. Chew, R. W. Beuerman, and H. E. Kaufman, "The tandem scanning confocal microscope as a clinical
diagnostic tool in ophthalmology," Scanning, Vol. 14, Supplement 2, pp. 45-46, 1992. 5. S. J. Chew, R. W. Beuerman, and H. E. Kaufman, "In vivo assessment of corneal stromal toxicify by
tandem scanning microscopy," Lens Eye Toxicity Res., Vol. 9, pp. 275-292, 1993.
SPIEVol. 2673/227

JOaiilUi Ul U1V JtiilWliCUU i IWiUVUij Ui .>*
668 fir/e/ comm unications April 1995
Confocal microscopy: A new tool for the study of the nail unit
Stephen C. Kaufman, MD,a Roger W. Beuerman, PhD,a and Donald L. Greer, PhDb
New Orleans, Louisiana
Reflected light biomicroscopy has several limita- tions at magnifications sufficient for discerning cel- lular details in biologic materials. At least two prob- lems are common: (1) the surface of the specimen may reflect large amounts of available light and (2) the important subsurface structures may be poorly reflective. For these reasons light microscopy is not useful to examine the nails; transillumination is not possible, and reflected light iUumination results largely in reflection from the nail pliPjiurface. We employed a new instrument, the real-time confocal microscope, which uses reflected light to section liv- ing tissue optically at various depths, to examine and image layers of the nail unit in vivo without stains or dyes.
MATERIAL AND METHODS
This study was approved by the Louisiana State Uni- versity Medical Center Institutional Review Board. All subjects were unpaid volunteers. To view the nail plate and nail bed structure with the confocal microscope, the subjects' hands were placed on a platform so that the fin- gernails could be stabilized and viewed through the con- tact objective. Hydroxypropyl methylcellulose (IOLAB Pharmaceuticals, Claremont, Calif.) was used as the op- tical coupler to reduce interface reflections.
In the confocal microscope a membrane mirror is used to direct light through a set of holes in a fenestrated disk. As the disk spins, the holes that are illuminated produce a scanning pattern similar to that produced by the elec- tron gun of a television tube. The result is a virtually seamless real-time field. Optically the holes act as true pinholes and permit only parallel rays of light to pass. The light that exits the pinholes passes through the contact objective of the microscope and into the tissue. Light re-
From the Department of Ophthalmology," and the Departments of Dermatology and Pathology,b Louisiana State University Medical Center, School of Medicine, New Orleans.
Supported in part by an institutional National Research Service Award T32EY07100 (S. C. K.) and the Louisiana State University Eye Center Visionary Gala Fund, New Orleans.
Reprint requests: Stephen C. Kaufman, MD, Louisiana State Univer- sity Eye Center, 2020 Gravier St., Suite B, New Orleans, LA 70112.
J AM ACAD DERMATOL 1995;32:668-70.
Copyright ® 1995 by the American Academy of Dermatology, Inc.
0190-9622/95 $3.00 + 0 16/54/61527
Video Camera
Objective
^
Nipkow Disk
Membrane VMirror ^r
> ^Mirror
Light Source
Fig. 1. Optical light path of confocal microscope. Light produced by mercury lamp passes through fiber-optic ca- ble to membrane mirror, where it is reflected forward to Nipkow disk. This disk, which is fenestrated with thou- sands of holes arranged in Archimedes spiral pattern, transmits 2% of incident light through pinholes and then through 20X microscope objective. Light reflected from specimen passes back through microscope objective, Nipkow disk, and mirror system, and image is captured by camera.
fleeted from the tissue passes back through the objective, the pinholes of the disk, and the membrane mirror, and is collected by a video camera. The basic optical path is illustrated in Fig. 1. The depth to which the confocal mi- croscope can optically penetrate to permit in vivo obser- vation in real time is limited only by the light penetration into the tissue and the reflectivity of the structures being observed. Obviously the structures must reflect some light to be visible.
Only the light reflected from the biologic structures at the selected plane is allowed to pass into the image plane and to contribute to image formation. Because both the light and the microscope objective are focused at the same specific focal plane, objects and structures above and be- low the plane do not interfere with the formed image. Keratinized skin and nails present a particular problem because of their reflectivity; however, the viscous optical coupler helps to reduce these effects.
The confocal microscope used in this study is a proto-

B. REFERENCE 11
Journal of the American Academy of Dermatology Volume 32, Number 4 Brief communications 669
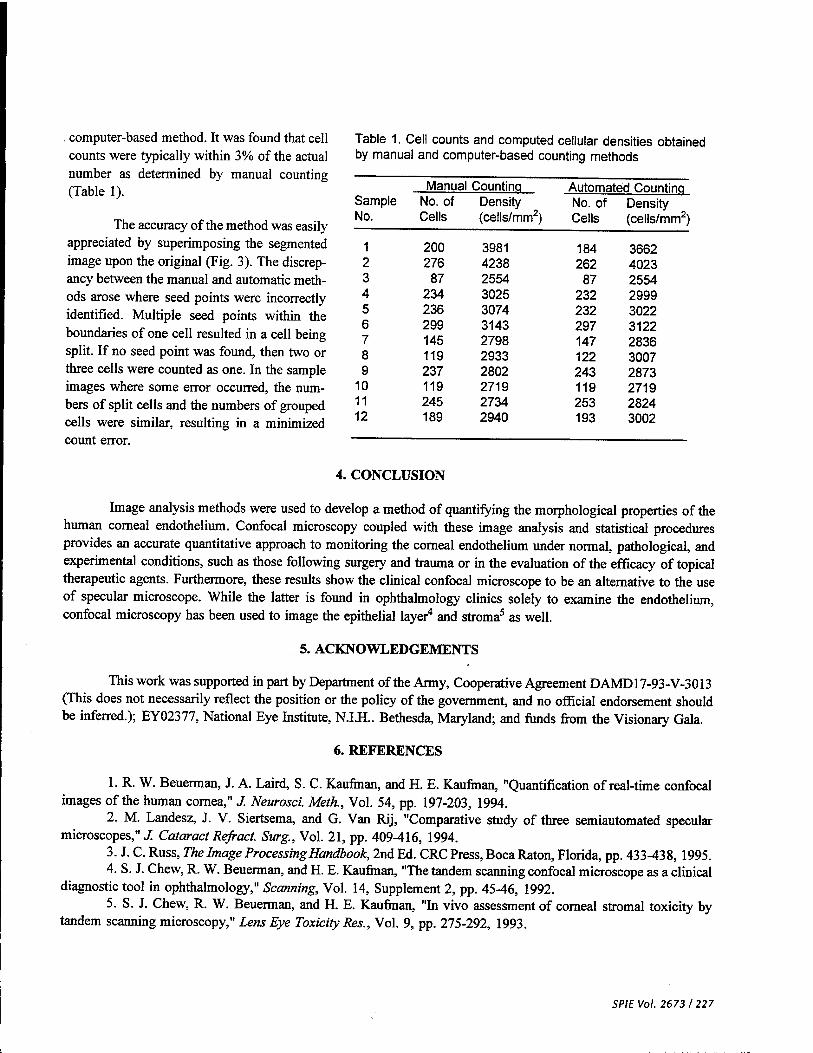
Fig 2 A, Lower nail plate shows discrete onychocytes (arrowheads), some with nuclear fragments, which are visible as bright spots (arrows). (X230.) B, Underlying epithelial ridge in nail bed reveals keratogenous zone and underlying rootlike epidermal rete. Nuclei of cells are visible as bright objects (arrow). (X230.)
type with a single-sided Nipkow disk. The illumination from a 100 W mercury lamp (Nikon, Tokyo, Japan) is brought to the microscope by a fiber-optic bundle (Dolan- Jenner, Lawrence, Mass.). The spectrum of light has the greatest intensity through the visible range. Illumination of the nails is limited to only 2% of the incoming light by the spinning disk. The contact tip of the microscope is a modified special objective (BioOptics, Boston, Mass.). There is no direct contact between the objective and the nail, because the objective actually rides on a layer of the coupling medium. The incident beam does not produce any sensation of warming on the nail; in this study the procedure was accomplished with no reported sensation caused by the beam.
The high-resolution images thus formed are directed to a high-resolution, low-light video camera (Video Scope, Washington, D.C.) and stored on super-VHS videotape. The images can also be directed to an IBM-compatible 486 computer for processing with image analysis software (Optimas, Bioscan Inc., Seattle, Wash.) and viewing on a high-resolution Sony monitor.
RESULTS
The keratinized surface was easily seen (Fig. 2, A). When a deep plane of focus was selected, the flattened sparse nuclei within the keratinous, differ- entiating basal cells were observed. The numbers of

670 Brief communications Journal of the American Academy of Dermatology
April 1995
nuclei were found to increase with increasing depth of the focal plane. At the greatest depth the rootlike epithelial ridges of the nail bed became visible (Fig. 2, B).
DISCUSSION
Many articles have described the use of the con- focal microscope to study the eye.1"4 The clear cor- nea offers an ideal subject for in vivo research with this unique tool. We have used our confocal micro- scope to identify fungal invasion of the cornea in vivo and to differentiate a degenerative change from an infectious disease in the treatment of a patient with equivocal symptoms.5 Recently Corcuff and Leve- que,6 and Pierard,7 have used the confocal micro- scope to study the ultrastructure of the skin. They found that it was possible to view structures below the keratinized epithelium with this instrument.
Standard light microscopy is of little value for viewing the nail unit because of the high reflectivity of the keratinized surface of the nail plate. However, the unique properties of the confocal microscope make it possible to eliminate the spurious reflections and to focus on the deeper layers of the nail plate and lail bed in vivo.
Although the nail unit is largely inaccessible by standard light microscopy, the arterial loops of the nailfold have been visualized in this fashion. The skin of the proximal nailfold is thin. This has allowed di- rect in vivo visualization of the capillary loops in this region. Abnormalities in the nailfold capillaries have been described in many diseases, such as Raynaud's phenomenon,8'9 scleroderma, schizophrenia,10 and Down syndrome.11 Maricq8"10 obtained her obser- vations by applying immersion oil to the skin of the nailfold and using a light microscope to photograph the capillary loops. The microscope can be tilted slightly to reduce the light reflex from the immersion oil. A 12X to lOOX objective is usually used. Our confocal microscope uses a 20X objective with internal magnification of 10.15X. This degree of magnification permits visualization of fine cellular and structural detail. When capillary loops are ob- served with the confocal microscope, individual red blood cells can be seen as they pass through the cap- illary lumen. Therefore the confocal microscope also has the potential to perform similar nailfold studies.
The use of a low-power objective permits wide-field, high-resolution examination of the capillary loops in the nailfold region. We use methylcellulose or min- eral oil as the optical coupler. Both viscous sub- stances work well, but we have found that methyl- cellulose is slightly more viscous than mineral oil and is easier to use.
Our specific confocal microscope permits chang- ing from confocal microscopy to standard light mi- croscopy. Thus our microscope shows the changes seen in the capillary nailfold and also permits obser- vation of the nail plate and nail bed. The nailfold capillary loops are more easily visualized in the standard light microscopic mode. This allows a view of a length of capillary with the loop at its apex. The confocal microscope permits a view of a single point in the length of the capillary. Although the capillary is not as easy to identify, the confocal view could of- fer unique glimpses into the characteristics of these capillaries that the light microscope cannot accom- plish.
REFERENCES
1. Amos AB, White JG, Fordham M. Use of confocal imag- ing in the study of biological structures. Appl Optics 1987;26:3239-43.
2. Dilly PN. Tandem scanning reflected light microscopy of the cornea. Scanning 1988;10:153-6.
3. Jester JV, Petroll WM, Garana RMR, et al. Comparison of in vivo and ex vivo cellular structure in rabbit eyes detected by tandem scanning microscopy. J Microsc 1992;165:169-81.
4. Chew SJ, Beuerman RW, Assouline M, et al. Early diag- nosis of infectious keratitis with in vivo real time confocal microscopy. CLAO J 1992;18:197-201.
5. Kaufman SC, Beuerman RW, Kaufman HE. Diagnosis of advanced Fuchs' endothelial dystrophy with the confocal microscope. Am J Ophthalmol 1993;116:652-3.
6. Corcuff P, Leveque JL. In vivo vision of the human skin with the tandem scanning confocal microscope. Dermatol- ogy 1993;186:50-4.
7. Pierard GE. In vivo confocal microscopy: a new paradigm in dermatology. Dermatology 1993;186:4-5.
8. Maricq HR. Capillary abnormalities, Raynaud's phenom- enon, and systemic sclerosis in patients with localized scle- roderma. Arch Dermatol 1992;128:630-2.
9. Carpentier PH, Maricq HR. Microvasculature in systemic sclerosis. Rheum Dis Clin North Am 1990;16:75-91.
10. Poole JH, Maricq HR, Alson E, et al. Negative symptoms in schizophrenia and nailfold plexus visibility. Biol Psychol 1991;29:757-73.
11. Higashino SM, Moss AJ. Capillary microscopy. Am J Dis Child 1967;113:439-43.

C. REFERENCE 12

REPRINT $w SPIE—The International Society for Optical Engineering
Reprinted from
Proceedings of
Ophthalmic Technologies VI
27-28 January 1996 San Jose California
P Volume 2673
©1996 by the Society of Photo-Optical Instrumentation Engineers Box 10, Bellingham, Washington 98227 USA. Telephone 360/676-3290.

In vivo immunofluorescence confocal microscopy of herpes simplex virus type 1 keratitis
Stephen C. Kaufman, Jeffery Laird, and Roger W. Beuerman
LSU Eye Center, Louisiana State University Medical Center School of Medicine, 2020 Gravier Street, Suite B, New Orleans, Louisiana 70112
ABSTRACT
The white-light confocal microscope offers an in vivo, cellular-level resolution view of the cornea. This instrument has proven to be a valuable research and diagnostic tool for the study of infectious keratitis. In this study, we investigated the direct visualization of herpes simplex virus type 1 (HSV-l)-infected comeal epithelium, with in vivo confocal microscopy, using HSV-1 immunofluorescent antibodies. New Zealand white rabbits were infected with McKrae strain of HSV-1 in one eye; the other eye of each rabbit was used as an uninfected control. Four days later, the rabbits were anesthetized and a cellulose sponge was applied to each cornea, and a drop of direct HSV fluorescein-tagged antibody was placed on each sponge every 3 to 5 minutes for 1 hour. Fluorescence confocal microscopy was then performed. The HSV-infected corneas showed broad regions of hyperfluorescent epithelial cells. The uninfected corneas revealed no background fluorescence. Thus, using the confocal microscope with a fluorescent cube, we were able to visualize HSV-infected corneal epithelial cells tagged with a direct fluorescent antibody. This process may prove to be a useful clinical tool for the in vivo diagnosis of HSV keratitis.
Keywords: confocal microscopy, fluorescence microscopy, herpes simplex virus, immunofluorescence, cornea, keratitis
1. INTRODUCTION
Herpes simplex virus type 1 (HSV-1) is a leading cause of blindness resulting from infectious disease in the United States.1 The methods currently used to diagnose ocular herpes simplex viral infections of the eye include recognition of the gross appearance of the corneal lesion, viral culture, and the polymerase chain reaction (PCR). Recognition of the viral lesions is a subjective decision that cannot always be depended on for an accurate diagnosis. PCR is a specific, objective test but its sensitivity has not been proven. Finally, herpes simplex viral cultures frequently require one or more weeks to obtain results, during which time the virus can severely damage the cornea. Additionally, the latter two methods depend on analysis of material obtained by corneal scraping or corneal biopsy, both of which are tissue destructive. In this study, we investigated the feasibility of using white-light confocal microscopy with direct anti-HSV-1 fluorescent antibodies to view HSV-infected corneal cells in vivo.
Laser confocal microscopes, which have become widely available, have the ability to perform fluorescence microscopy. However, the focused beam generated by the lasers precludes their repeated use in vivo. The slit lamp is the most common type of biomicroscope used in vivo by the clinical ophthalmologist. Unfortunately, the optical system and the low magnification (2 to 40x) do not provide the degree of cellular-level resolution necessary for the diagnosis of infectious corneal disease on a microscopic level. Only the white-light confocal microscope is able to provide real-time, noninvasive, in vivo, cellular-level resolution of the cornea.
2/SP1E Vol. 2673 0-8194-2047-6l96l$6.00

Our microscope incorporates several features that enabled us to perform what was, to our knowledge, the first instance of white-light confocal fluorescence microscopy. The instrument uses a single-sided Nipkow disk, which eliminates disk alignment difficulties while providing superior resolution. Furthermore, the Nipkow disk permits 2% light transmission, which is significantly higher than that provided by most other disks. We also use a 100-watt mercury or a 300-watt xenon lamp linked to the microscope via a solid silica core, fiber optic cable. This arrangement isolates the vibration and heat generated by the lamp from the microscope. Finally, the modular design of our microscope makes it possible to remove the standard semi-silvered mirror and replace it with a mirror cube with an incorporated fluorescence filter set. The unique construction of our microscope provides a simple means to perform fluorescence confocal microscopy in vivo.
2. METHODS
2.1 Modifications to confocal microscope
Modifications to permit fluorescence confocal microscopy included removing the standard semi-silvered mirror and inserting a Nikon BA 52 with DM 510, B-2A, and BA 520 fluorescence filter set (Nikon, Japan) in the confocal microscope (LSU Eye Center, New Orleans, Louisiana). Illumination was provided by a 100-watt mercury lamp and transmitted to the microscope via a solid core, silica-clad fiber optic. The images were captured with a CCD video camera (Video Scope, Washington, DC) that provided 700 lines of resolution. The video signal was stored on super VHS (S-VHS) video tape and viewed simultaneously on a high-resolution monitor (Sony, Japan).
The internal optics of the confocal microscope included a Nipkow disk with a 2% transmittance value. The microscope objective provided 20x magnification with a .38 NA. Internal magnification in the system provided a final magnification of 230x.
2.2 In vivo fluorescence confocal microscopy
We disrupted the corneal epithelium in both eyes of two New Zealand white rabbits by gently passing a 21- gauge needle over the surface to create three linear epithelial defects in each cornea. For each rabbit, one cornea was infected with a single drop of McKrae strain herpes simplex virus type 1 (HSV-1) placed on the epithelial surface, and the other cornea served as an uninfected control.
Five days later, the rabbits were anesthetized, and the eyes were examined by slit lamp biomicroscopy to confirm that one eye of each rabbit was infected and the other was clear. A 3-mm diameter sterile cellulose sponge was applied to the surface of each of the four corneas. A solution of direct fluorescein-tagged HSV antibody (Microbiological Associates, Walkersville, Maryland) was diluted to a concentration of 1:100. One drop of the solution was placed on the cellulose sponge on the surface of each of the four corneas every 3 to 5 minutes for 1 hour. At the end of the hour, the cellulose sponges were removed from the four corneas, each cornea was washed with balanced saline, and fluorescence confocal microscopy was performed on each eye.
3. RESULTS
Fluorescence confocal microscopy of the control, uninfected eyes revealed no background staining of the cornea with the direct HSV fluorescein-tagged antibody. Therefore, no image was visible on examination of the control eyes. By contrast, the infected corneas showed large fields of fluorescent epithelial cells by confocal microscopy. The epithelial cell surfaces were clearly visible. However, the nuclei of the epithelial cells, which are usually visible, could not be seen.
SPIE Vol. 2673/3
4. DISCUSSION
Infectious keratitis caused by HSV can result in ocular scarring, pain, and blindness. The current laboratory methods used by the clinical ophthalmologist to diagnose herpetic keratitis are tissue destructive and generally require 3 to 14 days to obtain results. During this time, treatment may be delayed, which worsens the effects of the disease.
We have previously reported using the white-light confocal microscope to differentiate between a stromal HSV infection and Fuchs' endothelial dystrophy.2 In that case, the different morphologic features of the two disorders that were observed by confocal microscopy were used to make a clinical diagnosis, which was later confirmed by electron microscopy of a tissue specimen.
HSV infections, which affect the corneal epithelium, may resemble infections caused by bacteria, fungi, and acanthamoebae. When fluorescein staining and slit lamp examination demonstrate the typical branching, dendritic pattern, the clinical diagnosis of HSV keratitis is usually accurate. However, atypical HSV epithelial infections cause a diagnostic dilemma. Because the prognosis and treatment are different for each type of infection, the correct
diagnosis is imperative.
Cavanagh et al.3 described confocal microscopic observation of enlarged nuclei in epithelial cells that had previous herpetic involvement. They suggested that the viral infection produced the enlarged nuclei, but did not corroborate their observations with other molecular or electron microscopic studies. Because we have seen variation in epithelial cell nuclear size, we believe that this finding eannot be used as a diagnostic marker for HSV epithelial infection.
Previously, we described the use of the white-light confocal microscope in diagnosing bacterial, fungal, and acanthamoeba keratitis.4 This was accomplished in vivo, in human subjects, without the need for stains or dyes. Unfortunately, HSV keratitis cannot be a diagnosis of exclusion. Therefore, we sought to develop .a specific method to detect HSV in vivo.
We used a direct fluorescein-tagged HSV antibody that binds to the surface of HSV-infected cells. Although the antibody was not specific for the McKrae strain of the virus, we obtained good fluorescein labeling of the infected cells with a 1:100 dilution of the stock antibody. We applied the antibody to a sponge on the corneal surface to maximize the time that the antibody was in contact with the epithelium. A pilot study indicated that 30 minutes was inadequate for antibody binding, so we increased the period of frequent application of antibody to 1 hour. It may be possible to decrease the period of application by using a more concentrated antibody mixture, although this would probably increase the likelihood of background staining (noise). As indicated in the results, no background fluorescence was detected using our present protocol.
In this study, we applied goat HSV antibody to rabbit eyes. We did not examine the rabbit eyes for inflammation or other immune reactions that could have been elicited in the host by the foreign antibody. The use of rabbit or human HSV antibodies, which can be created, would reduce the risk of inciting an inflammatory reaction. Certainly, this is an important aspect of this procedure that must be investigated in future studies.
Our results show that, in this rabbit model, the fluorescein-tagged HSV antibody binds to the HSV-infected corneal epithelial cells. The binding was selective and no background fluorescence was observed on the control, uninfected epithelial cells. Finally, the epithelial cells with bound fluorescein-tagged HSV antibodies could be observed in vivo with our modified white-light confocal microscope.
4/SPIEVol.2673

In conclusion, we were able to view HSV-infected corneal epithelial cells in vivo using a direct fluorescein- tagged HSV antibody and our white-light confocal microscope. This procedure may permit in vivo, real-time, diagnosis of HSV keratitis, without the tissue destructive, time-consuming diagnostic procedures currently required. Furthermore, we believe that the confocal microscope will prove to be a useful tool in the diagnosis of infectious keratitis.
5. ACKNOWLEDGMENTS
This work was supported in part by the Department of the Army, Cooperative Agreement DAMD17-93-V- 3013. This does not necessarily reflect the position or the policy of the government, and no official endorsement should be inferred. Other support includes U.S. Public Health Service Core grant EY02377 from the National Eye Institute, National Institutes of Health, Bethesda, Maryland, and funds from the Visionary Gala.
6. REFERENCES
1. H. E. Kaufman and M. A. Rayfield, "Viral conjunctivitis and keratitis," In: H. E. Kaufman, B. A. Barron, M. B. McDonald, and S. R. Waltman, eds. The Cornea, Churchill Livingstone, New York, 1988, p. 304.
2. S. C. Kaufman, R. W. Beuerman, and H. E. Kaufman, "Diagnosis of advanced Fuchs' endothelial dystrophy with the confocal microscope," Am. J. Ophthalmol, Vol. 116, pp. 652-653, 1993.
3. H. D. Cavanagh, W. M. Petroll, H. Alizadeh, Y. G. He, J. P. McCulley, and J. V. Jester, "Clinical and diagnostic use of in vivo confocal microscopy in patients with corneal disease," Ophthalmology, Vol. 100, pp. 1444- 1454, 1993.
4. S. C. Kaufman, J. Laird, and R. W. Beuerman, "In vivo, real-time confocal microscopy of fungal, bacterial, and acanthamoeba keratitis," Association for Research in Vision and Ophthalmology, abstract #4738, Invest. Ophthalmol. Vis. Sei., Supplement to Vol. 36, p. S1022, 1995.
SPIE Vol. 2673/5

D. REFERENCE 13

CORNEA/EXTERNAL DISEASE
Transient Corneal Stromal and Endothelial Changes Following Soft Contact Lens Wean A Study
with Conf ocal Microscopy
Stephen C. Kaufman, MD Hikaru Hamano, MD Roger W. Beuerman, PhD Jeffery A. Laird, BSME Hilary W. Thompson, PhD
Purpose: Previous studies have described transient corneal endothelial changes in non-contact lens wearers after a short period of soft contact lens wear by means of contact and noncontact specular microscopy and modified slit lamp biomicroscopy, which provide magnifications from 60 to 100x. In this investigation, we documented and characterized these contact lens-related corneal changes using the white light, real-time confocal microscope, which is capable of cellular resolution imaging of all layers within the cornea at magnif ica- tionsof 100to500x.
Methods: We used a clinical confocal microscope to study corneal changes in three patients wearing a high water content soft contact lens for the first time.
Results: In one patient, endothelial changes consisting of irregularly shaped, round or oval, dark regions were observed within the endot- helial mosaic. Scattered hyper-reflective keratocyte nuclei were seen in the posterior stroma. The keratocytic and endothelial changes were most evident 20 minutes after placement of the lens. By 30 minutes, the changes were fewer and less prominent, and the brightness of the highly reflective keratocyte nuclei had decreased.
Conclusions: These studies show, for the first time, that the transient changes associated with contact lens wear occur not only in the endothelium, but also in the corneal stroma. It has been suggested that the changes result from an increase in C02 and lactic acid, which causes a transient reduction in the corneal pH. We hypothesize that the resulting acidic environment may induce gene expression that causes changes in the involved nuclei, which in the keratocytes become hyper-reflective, and in theendotheliumbecomeenlarged, resulting in posterior displacement of the cell membrane and producing the dark "blebs" and irregular lines observed at this level of the posterior cornea.
Introduction In 1977, Zantos and Holden1 reported the observation of
transient endothelial changes associated with soft contact lens wear in individuals who had not previously worn contact lenses. Within minutes after placement of the contact lens, dark irregu- larly shaped regions were seen within the endothelial cell
mosaic. The authors referred to these newly observed lesions as "blebs."
Since the first description of this phenomenon, others have documented the existence of observable changes within the endothelium in patients wearing hard lenses, high water content soft lenses, and low water content soft lenses.2,3 These studies
Copyright 1996 Contact Lens Association of Ophthalmologists All rights reserved.
the CLAO journal • April 1996 • Volume 22, Number 2
127
Wi: V"
^^^^^^^^^^^KPI^' '^'■'^HIBH
K=^"-r
R*r -■Jjal
Bppi«? :i^:^3iBl
-s^sjB^H
■Lr ^c^n^H
■KpN*^ «^üH^^I HMt.
Hl^<i
**""*" *?MI^^^^^^^^^^^^^^^^^^^I
^^^^^^^^^^^^^^^HH? «f? ^m^^^^i ^^^^^^^Brw<"} v
^^^^^EF* ; ■•• r3
Hfcf "" '^i^^^^^H
'^äfflnH^^^^^I
' i
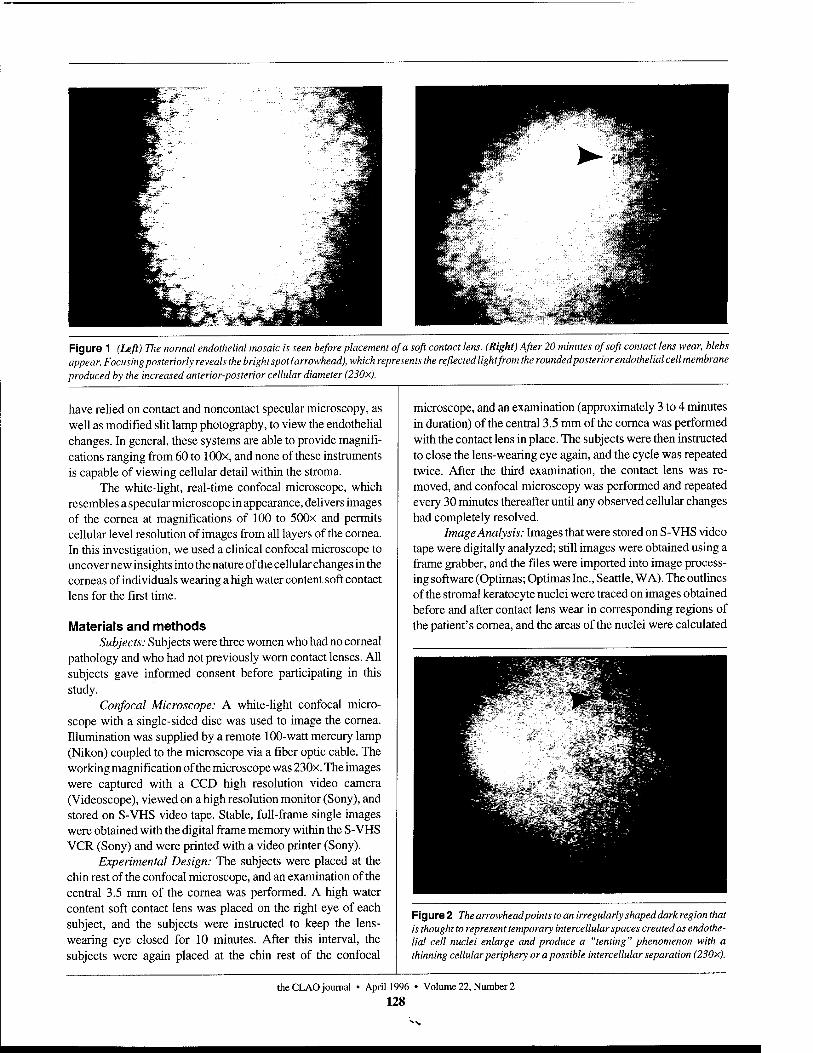
Figure 1 (L«#> 77ie «orma/ endothelial mosaic is seen before placement of a soft contact lens. (Right) After 20 minutes of soft contact lens wear, blebs appear. Focusing posteriorly reveals the bright spot (arrowhead), which represents the reflected lightfrom the roundedposterior endothelial cell membrane produced by the increased anterior-posterior cellular diameter (230x).
have relied on contact and noncontact specular microscopy, as well as modified slit lamp photography, to view the endothelial changes. In general, these systems are able to provide magnifi- cations ranging from 60 to lOOx, and none of these instruments is capable of viewing cellular detail within the stroma.
The white-light, real-time confocal microscope, which resembles a specular microscope in appearance, delivers images of the cornea at magnifications of 100 to 500x and permits cellular level resolution of images from all layers of the cornea. In this investigation, we used a clinical confocal microscope to uncover new insights into the nature of the cellular changes in the corneas of individuals wearing a high water content soft contact lens for the first time.
Materials and methods Subjects: Subjects were three women who had no corneal
pathology and who had not previously worn contact lenses. All subjects gave informed consent before participating in this study.
Confocal Microscope: A white-light confocal micro- scope with a single-sided disc was used to image the cornea. Illumination was supplied by a remote 100-watt mercury lamp (Nikon) coupled to the microscope via a fiber optic cable. The working magnification of the microscope was 230x. The images were captured with a CCD high resolution video camera (Videoscope), viewed on a high resolution monitor (Sony), and stored on S-VHS video tape. Stable, full-frame single images were obtained with the digital frame memory within the S-VHS VCR (Sony) and were printed with a video printer (Sony).
Experimental Design: The subjects were placed at the chin rest of the confocal microscope, and an examination of the central 3.5 mm of the cornea was performed. A high water content soft contact lens was placed on the right eye of each subject, and the subjects were instructed to keep the lens- wearing eye closed for 10 minutes. After this interval, the subjects were again placed at the chin rest of the confocal
microscope, and an examination (approximately 3 to 4 minutes in duration) of the central 3.5 mm of the cornea was performed with the contact lens in place. The subjects were then instructed to close the lens-wearing eye again, and the cycle was repeated twice. After the third examination, the contact lens was re- moved, and confocal microscopy was performed and repeated every 30 minutes thereafter until any observed cellular changes had completely resolved.
Image Analysis: Images that were stored on S-VHS video tape were digitally analyzed; still images were obtained using a frame grabber, and the files were imported into image process- ing software (Optimas; Optimas Inc., Seattle, WA). The outlines of the stromal keratocyte nuclei were traced on images obtained before and after contact lens wear in corresponding regions of the patient's cornea, and the areas of the nuclei were calculated
Figure 2 The arrowhead points to an irregularly shaped dark region that is thought to represent temporary intercellular spaces created as endothe- lial cell nuclei enlarge and produce a "tenting" phenomenon with a thinning cellular periphery or a possible intercellular separation (230x).
the CLAO journal • April 1996 • Volume 22, Number 2
128

Figure 3 The confocal microscope is focused on the anterior-most aspect of the corneal endothelium. Visible within the overlying stroma are contact lens-induced changes characterized by the very bright posterior stromal keratocyte nuclei (arrowheads). Note that there are no endothelial blebs over these regions of stromal change (230x).
using the area morphology tool in the image analysis software. The operator performing the image analysis was masked as to the status of the images being analyzed. For statistical analysis, five keratocyte nuclei from an image obtained before contact lens wear were compared with five nuclei from the anterior stroma and five nuclei from the posterior stroma from images obtained immediately after the contact lens was removed after 30 minutes of lens wear.
Statistical Analysis: Measurements of the area of keratocyte nuclei before and after contact lens wear were compared by analysis of variance (ANOVA) with subsequent Mests between least square comparison group means.
Results Ten minutes after placement of the contact lens, one
subject developed endothelial changes consisting of five irregu- larly shaped, round or oval, dark regions within the endothelial mosaic. Focusing the confocal microscope anterior to these dark regions revealed no change in the normal appearance of the posterior stroma; however, focusing posteriorly to the endothe- lial dark regions revealed a small bright spot of reflected light
TABLE 1 Area of stromal keratocyte nuclei before and after contact lens wear
Area (um2) of stromal keratocyte nuclei
Group Mean SE P*
Figure 4 View of the anterior stroma revealing multiple hyper-reflective keratocyte nuclei. This new finding demonstrates that soft contact lens wear also induces transient changes in anterior and posterior stromal keratocytes (230x).
located centrally (Figure 1). Three long, narrow, irregularly shaped dark regions were seen in other areas. Shifting the focus anteriorly and posteriorly revealed no other changes associated with this type of dark area (Figure 2).
Confocal microscopy of the stroma also revealed changes. In the posterior stroma, five highly reflective keratocyte nuclei were visible when the confocal microscope was focused on the anterior-most aspect of the endothelial cell mosaic (Figure 3). Similarly, 22 highly reflective stromal keratocyte nuclei were seen in the anterior stroma (Figure 4).
The stromal and endothelial changes appeared at the 10- minute observation interval and were most evident at the 20- minute observation interval. At the 30-minute observation inter- val, the corneal endothelial changes were fewer and less promi- nent, and the number and brightness of the highly reflective corneal keratocyte nuclei had also decreased. Thirty minutes after removing the contact lens, no stromal or endothelial changes were observable.
Statistical comparison revealed no significant difference between the area of the keratocyte nuclei before contact lens wear and the area of the corresponding post-contact lens wear, hyper-reflective nuclei of the anterior (P=0.83) and posterior
(P = 0.88) stromal keratocytes (Table I).
No changes were ob- served in the other two subjects.
Keratocyte nuclei before contact lens wear
Keratocyte nuclei after contact lens wear
In the anterior stroma
In the posterior stroma
67.2
69.26
70.0
9.02
10.09
9.02
0.88+
0.83+
"Analysis of variance (ANOVA) with subsequentt-tests between least square comparison group means; n - tCompared with stromal keratocyte nuclei before contact lens wear. Difference not significant. SE=standard error
Discussion Zantos and Holden used a
modified slit lamp to observe the endothelial black spots seen after soft contact lens wear.' The specular microscope has also been used to view these endot- helial changes.2 However, nei-
theCLAO journal April 1996
129 Volume 22, Number 2

ther the slit lamp nor the specular microscope permits visualiza- tion of structures beyond the plane of the endothelium. These instruments also are limited to 60 to lOOx magnification. There- fore, the study of these endothelial changes has been limited by the diagnostic instruments available. We used the white-light confocal microscope to observe these endothelial changes and characterize them in a way that was not previously possible.
A high water content soft contact lens was used with closure of the eyelids. Hamano and Watanabe2 showed this to be an effective means of producing endothelial changes. They noted that this same procedure could be used with disposable soft lenses and that, with low water content soft contact lenses, bleb formation was observed even without closure of the eyelids.
Our study was limited to three subjects, and, of these three, only one developed endothelial changes. The changes first appeared after 10 minutes of lens wear, and were most evident after 20 minutes. Others have studied the time-course and extent of endothelial changes associated with new contact lens wear, and their results confirm that the peak response occurs between 20 and 30 minutes after placement of the contact lens.13-5
The fact that only one of three subjects was found to have developed stromal or endothelial changes is attributed to the small sample size in our study. However, the purpose of this investigation was not to determine the incidence of endothelial changes but rather to characterize them. Barr and Schoessler3
found that after 10 minutes, seven of 12 subjects had only one or zero endothelial mosaic changes, and, after 30 minutes, five of the 12 subjects still had three or fewer areas of endothelial change. The confocal microscope works at a significantly higher level of magnification and the resulting working field of view is less than half that available with the lower power specular microscope or modified slit lamp. With such a small number of endothelial changes present at 10- and 30-minute intervals, as indicated in Barr and Schoessler's study,3 it is possible that the small field of our high magnification confocal microscope missed areas of change that might have been present in the two subjects for whom we report no response, although we did systematically scan the central 3.5 mm of each cornea.
The endothelial cell changes that were observed in our subject were consistent with those described by others. Holden and Zantos1 described the endothelial changes as black lines between cells and black spots occurring between or displacing cells. These same types of lesions were observed in our subject. With the confocal microscope, we were able to focus anteriorly and posteriorly to the circular black spots. When the confocal microscope was focused posterior to a black spot, a small central bright region was detected (Figure 1). Although this observation was not mentioned in any other paper on this subject, the bright central spots can be seen in some of the photographs of Holden, Zantos, Hamano, Watanabe, and others.126'7 We hypothesized that this bright central dot is produced by the reflection of the confocal light or specular illumination from the posteriorly displaced endothelial cell membrane. The black lines present between cells were also seen in our study. Focusing posteriorly with the confocal microscope did not reveal the same highly reflective region as was seen in the blebs (Figure 2). For this
reason, we believe the irregularly shaped lines represent a separation of cellular boundaries or thinning of the cellular periphery produced by tenting of the endothelial cell caused by the enlarged nucleus.
Of particular interest in this study is the new observation of stromal keratocyte changes associated with soft contact lens wear. In the confocal micrograph of the anterior aspect of the endothelium (Figure 3), bright keratocyte nuclei can be seen. The positions of the bright keratocyte nuclei and the endothelial dark spots do not coincide. Therefore, there appears to be no direct relationship between the location of the hyper-reflective keratocyte nuclei and the endothelial blebs. The stromal keratocyte changes, which were visible in the most posterior stromal keratocytes, can also be seen in the nuclei of the anterior keratocytes in Figure 4. The abnormally bright, highly reflective nuclei of these anterior keratocytes denote a reaction to contact lens wear, however transient. Just as the endothelial blebs disappeared by 1 hour, so did the hyper-reflective keratocyte nuclei.
Vannas and colleagues6 investigated the source of the ultrastructural changes induced by contact lens wear. The unique methods employed in their study involved human subjects who wore soft contact lenses just prior to enucleation of the globe. The corneas were photographed with a specular microscope prior to enucleation and then examined with a transmission electron microscope and scanning electron microscope post- enucleation. Although no cell-to-cell separation was seen with electron microscopy, enlarged endothelial cell nuclei were pho- tographed in the region of the endothelial blebs.
The confocal microscope, under normal conditions, per- mits the visualization of stromal keratocyte nuclei but not their cell bodies. Conversely, only the endothelial cell bodies are visible and not their nuclei. This characteristic of confocal imaging explains why the stromal changes were observed as nuclear variation, and why the endothelial differences involved an observable change in the cell bodies. Although the keratocyte nuclei appeared to be enlarged, statistical analysis of digitized images revealed no significant differences in nuclear area be- tween the groups before and after contact lens wear.
Unfortunately, we were not able to accurately access nuclear volume because of patient movement. Even the small degree of movement present during an in vivo examination contributes an unacceptable amount of error to Z-axis measure- ments that are necessary for nuclear volume quantification. Therefore, keratocyte nuclear volume may have changed, but it is not presently possible to evaluate this theory with reliable in vivo measurements.
The cause of the observed transient corneal changes remains unclear. A thorough study was performed by Holden and colleagues in 1985,7 in which they evaluated the effect of five sets of conditions on the endothelium: 1) a silicone contact lens; 2) a silicone contact lens in combination with an anoxic precorneal environment; 3) an anoxic corneal environment alone; 4) a precorneal atmosphere of 9.8% carbon dioxide and 20.5% oxygen; 5) a hydroxyethyl methacrylate (HEMA) con- tact lens. The silicone lens alone produced no changes; however,
the CLAO journal • April 1996 • Volume 22, Number 2
130

when the silicone lens was coupled with an anoxic environment (nitrogen gas), endothelial black spots were observed. The gas mixture containing 9.8% carbon dioxide with 20.5% oxygen also produced a bleb response, as did the HEMA lens. This study illustrates the interesting and complex nature of these transient corneal changes. Both the anoxic environment and the gas mixture with a high C02 and normal oxygen content produced endothelial changes. The authors postulated that the corneal endothelial changes appeared to be related to a decreased pH within the cornea, resulting from increased carbon dioxide and lactic acid levels. Decreases in corneal pH have been shown to occur with contact lens wear.8 Thus, this explanation appears plausible given the transient nature of the endothelial changes, which result from the cellular changes that occur during the lag time required by the cell to buffer the pH change resulting from the increased C02 and lactic acid.
We believe this first report of the alterations in the stromal keratocyte population associated with soft contact lens wear illustrates that contact lens-related changes take place through- out the cornea and not just within the endothelial cell layer. Additionally, our findings suggest that the endothelial black blebs are probably endothelial cells that have increased their anterior-to-posterior diameter such that their posterior cell mem- brane surface lies behind the plane of the normal endothelium, rather than the black spots representing "holes" in the endothe- lial mosaic. In fact, a true hole in the endothelial mosaic would be unlikely in light of the transient nature of the endothelial changes.
McNamara and coworkers9 reported that corneal swelling associated with an anoxic corneal environment can be modu- lated by low-pH conditions within the cornea. In their studies, acidic conditions appeared to slow corneal swelling. They hypothesized that decreased corneal pH reduces the conductiv- ity of fluid across the endothelium, thereby decreasing corneal swelling in an anoxic environment.
Alternatively, Vannas and associates6 suggested that the regional increase in endothelial cell thickness may be the result of enlargement of the nuclei in the involved cells. Because the endothelial cell nuclei are not visible by confocal microscopy, we were not able to evaluate this possibility by objective measurement. However, we hypothesize that such a nuclear change could be the result of gene activation induced by the lower pH produced by the increase in C02 and lactic acid. Olson10 showed that bacteria respond to pH variation by increas- ing protein synthesis, protein activity, and adaption to the acidic conditions. Mouse kidney cell cultures have also been shown to modify gene expression, with the production of specific pro- teins, in response to an acidic environment (pH 5.5).11 Gene expression is characterized by the uncoiling of regions of chromosomes and the concomitant enlargement of the nucleus. The time-course of the endothelial changes is consistent with that of gene expression secondary to environmental alterations. It may be this increase in size of the endothelial nuclei secondary to gene activation that causes the appearance of the endothelial blebs, and the associated irregular dark lines could result from the tenting effect in the periphery of the cells produced by the
enlarged nuclei. This is a plausible explanation for the transient contact lens-induced corneal changes reported in the endothe- lium, but certainly additional research is needed in this area.
The hyper-reflectivity seen in the stromal keratocytes may also be part of this process. Here, the increased refractility may be an indication of chromosomal condensation, the first step in the activation of these cells leading to the induction of the expression of specific genes in response to the stress. Unfortu- nately, we are not able to accurately measure nuclear volume. Additionally, although our statistical analysis does not demon- strate significantly increased area in the keratocyte nuclei after contact lens wear, it may be that our method is not sensitive enough to detect such small changes. One other possible expla- nation for the hyper-reflective stromal nuclei may be that there is an increase in cytoplasmic hydration from the reduced corneal pH, which increases the difference in the index of refraction between the cytoplasm and nucleus of the keratocytes. Although this explanation is possible, it is unlikely since confocal imaging of patients with stromal corneal edema does not demonstrate hyper-reflective stromal nuclei.
In summary, we have shown for the first time that the transient changes associated with contact lens wear involve not only the endothelium but also the stromal cells of the cornea. With the confocal microscope, we characterized and docu- mented these changes in vivo in the human eye. The keratocyte nuclei appeared hyper-reflective and the involved endothelial cells appeared to have an increased anterior-to-posterior diam- eter as documented by the bright reflection of the posterior cell membrane within the dark region of the bleb. These transient corneal changes are hypothesized to result from an increase in C02 and lactic acid, which causes a transient reduction in the corneal pH. The resulting acidic environment may induce gene expression that causes enlargement of the involved endothelial cell nuclei and results in the dark blebs observed in the endothe- lium and the nuclear changes that produce the hyper-reflective keratocyte nuclei observed with the confocal microscope. Fur- ther research is necessary to fully understand the pathophysiol- ogy and scope of these contact lens-induced corneal changes.
Acknowledgment Supported in part by U.S. Public Health Service grants EY04074 (RWB), EY02580 (HEK), and EY02377 (HEK) from the National Eye Institute, National Institutes of Health, Bethesda, Maryland; a departmental grant from Research to Prevent Blindness, Inc., New York, NY; the Department of the Army, Cooperative Agreement DAMD17-93-V-3013 (this does not necessar- ily reflect the position or the policy of the government, and no official endorsement should be inferred); and funds from the Visionary Gala.
References 1. Zantos SG, Holden B A: Transient endothelial changes soon after wearing
soft contact lenses. Am J Optom Physiol Opt 1977;54:856-858. 2. Hamano H, Watanabe K: Observation of corneal endothelial response to
hydrogel lenses by noncontact specular microscope. J Jpn C L Soc 1993;35:140-145.
3. Barr JT, Schoessler JP: Corneal endothelial response to contact lenses. Am J Optom Physiol Opt 1980;57:267-274.
4. Schoessler JP, Woloschak MJ, Mauger TF: Transient endothelial changes produced by hydrophilic contact lenses. Am J Optom Physiol Opt 1982;59:764-765.
5. Efron N, Kotow M, Martin DK, et al: Physiological response of the
the CLAO journal April 1996 • Volume 22, Number 2
131

contralateral cornea to monocular hydrogel contact lens wear. Am J Optom Physiol Opt 1984;66:517-522.
6. Vannas A, Holden BA, Makitie J: The ultrastructure of contact lens- induced changes. Ada Ophthalmol 1984;62:320-333.
7. Holden BA, Williams L, Zantos SG: The etiology of transient endothelial changes in the human cornea. Invest Ophthalmol Vis Sei 1985;26:1354- 1359.
8. Giasson C, Bonanno JA: Corneal epithelial and aqueous humor acidifica- tion during in vivo contact lens wear in rabbits. Invest Ophthalmol Vis Sei 1994;35:851-861.
9. McNamara NA, Poise KA, Bonanno JA: Stromal acidosis modulates corneal swelling. Invest Ophthalmol Vis Sei 1994;35:846-850.
10. Olson ER: Influence of pH on bacterial gene expression. Mol Microbiol 1993;8:5-14.
11. Khandjian EW: Acidic extracellular environment induces only a subset of
heat-shock proteins in primary mouse kidney cell cultures. Biochem Cell Biol 1990;68:804-807.
From the Lions Eye Research Laboratories (S. Kaufman, H. Hamano, R. Beuerman, J. Laird, H. Thompson) and the Clinical Trials and Biometry Unit (H. Thompson), LSU Eye Center, Louisiana State University Medical Center School of Medicine, New Orleans, LA, and the Department of Ophthalmology (H. Hamano), Osaka University Medical School, Osaka, Japan.
This work was presented in part at the 1995 CLAO Annual Meeting, January 14,1995,Las Vegas, NV. Support forthe presentation ofthisworkwas provided by a grant from Allergan, Inc.
Correspondence and reprint requests to: Stephen C. Kaufman, MD, LSU Eye Center, 2020 Gravier Street, Suite B, New Orleans, LA 70112-2234.
Accepted for publication September 22, 1995.
the CLAO journal April 1996 • Volume 22, Number 2
132

E. FIGURE 1


F. FIGURE 2
44


G. FIGURE 3
46


H. FIGURE 4
48


2. Corneal damage after exposure to ultraviolet and short wave lasers and
ultraviolet light
We have continued to study the haze that follows corneal exposure to the 193-nm argon-
fluoride excimer laser. Last year, we studied the effect of a PAF inhibitor on preventing the
formation of the haze in rabbits and found that the inhibitor we tested was not effective whereas
treatment with a mild steroid was effective for treating the established haze. Our next study was to
determine if the haze was being caused by something produced in the tears rather than as a direct
result of the laser itself. Seventeen adult New Zealand white rabbits were treated bilaterally with a
6 mm diameter, 146 fm deep keratectomy. Immediately after laser treatment and before the eyelids
could be blinked, one eye of each animal had a polymethylmethacrylate contact lens glued to the
ablation area using tissue adhesive, to prevent tears from reaching the wounded area. The other eye
served as a control. Lenses were removed from the corneas at varying times, from one day to six
weeks. We found that when the contact lens was allowed to remain on the cornea for only one day,
both corneas developed minimal but similar haze in both eyes. When lenses were left glued to the
cornea for 3 days or longer, there was more haze but there was no difference in the amount of
corneal haze between the treated and non-treated eyes. Leaving the contact lenses on for more than
six weeks promoted neovascularization and corneal opacity.
We still believe that the tears are involved in the process of producing the haze seen after
even very superficial and short-term laser beam impingement on the cornea. To this end, we have
been assessing methods for analyzing the tears from individual humans or animals without the
necessity of pooling tears in order to obtain sufficient quantities for analyses, including capillary
electrophoresis and matrix-assisted laser desorption/ionization mass spectrometry (MALDI).
50

Analyzing tear samples smaller than 1 JJ.1, we have found differences in the tears of individuals
before and after laser treatment of the cornea. Some of the peaks are unique to pre-laser tears and
others are unique to post-laser treatment tears. We are in the process of identifying the different
peaks to determine whether they are growth factors etc. Studies will be presented at the upcoming
Pittsburgh Conference in 1997 (1).
References:
1. Varnell RJ, Maitchouk DY, Rucker VC, Beuerman RW: The clinical potential of laser
desorption mass spectrometry of tears. Pittsburgh Conference, 1997.
B. Glaucoma, Traumatic and Non-Traumatic
1. Pathogenesis of optic nerve damage in glaucoma
Glaucoma is a disease that involves two separate pathologic processes. In those forms of the
disease in which intraocular pressure is elevated, damage to the trabecular meshwork of the eye has
occurred. For active duty military the most important etiologies for this damage are related to ocular
trauma and its primary and secondary effects on the trabecular meshwork. Within the retired military
population, the separate etiologies contributing to trabecular meshwork damage in chronic open
angle glaucoma (the most common form of glaucoma, particularly in the elderly) are most important.
Separate from the pathophysiology of elevated intraocular pressure, the progressive loss of
vision that occurs in untreated glaucoma results from damage to the retinal ganglion cell axons and
eventual ganglion cell death. Although it is possible that damage to the retinal ganglion cells occurs
51

primarily, followed by secondary degeneration of the axons, our best evidence to date suggests that
glaucoma or exposure to elevated intraocular pressure causes a progressive optic neuropathy, i.e.,
the primary site of damage is the ganglion cell axon as it passes through the connective tissue
trabeculae of the lamina cribrosa.
The primary focus of this portion of the grant is to study the mechanism of glaucomatous
damage to the axons within the tissues of the optic nerve head. Our goal is to use scanning laser
ophthalmoscopy of the optic disc surface as well as confocal microscopy of the lamina cribrosa to
study the force distributions, strength and mechanical behavior of the structural tissues. Our
underlying hypothesis is that damage to the structural tissues of the optic nerve head occurs early
in the pathophysiology of glaucomatous optic disc damage and may precede damage to neuronal
tissues. Early detection of structural damage may allow intervention to preserve structural tissues,
prior to actual loss of axons.
Since the last progress report, I have begun analyzing the preliminary results from two large
experiments in which the confocal scanning laser ophthalmoscope has been used to study the onset
of glaucomatous damage to the tissues of the optic nerve head. The following is an account of our
progress.
Methods and Results:
1) Study 01 (our laboratory numbering system): Previously entitled: Characterization of
early, middle, and late changes in the surface of the optic nerve head in experimental glaucoma
by confocal scanning laser ophthalmoscopy; now referred to as the LSU Experimental
Glaucoma Study (LEGS). The first study our laboratory has embarked upon is the characterization
52

of the progressive changes in the optic nerve head surface that occur throughout the course of typical
"glaucomatous" damage. Our goal in this study is to develop an extensive library of confocal
scanning laser ophthalmoscopic images in which normal variation as well as early, middle and late
glaucomatous changes are well catalogued. These images will then become the data base from which
statistical strategies for the detection of optic nerve head change will be constructed. Finally, once
we have decided on the proper way to detect change, these images will allow us to definitively
describe the observed phenomena. That is, we hope to provide the first extensive description of the
pattern of optic nerve head surface change that occurs in glaucomatous damage using images
acquired with a confocal scanning laser ophthalmoscope (CSLO).
^^^^""^^^■■^^^—■■^^^^^™"^^^^^^— In the LEG Table 1. Schedule of LEGS Imaging Sessions
Pre-laser Post-Laser Monkey 1 2 3 1 2 3 4 5 6 7 8 9 10 11 12 13 14 15 16 17 18 19 20 study (Table 1),
1D •••■■■■■■■■■■■■■ 1E •••■■■■■■■■■■■■■■■■■■■■ both normal eyes I F •••■■■■■■■■■■■■■■■■ 1G •••■■■■■■■■ of 12 monkeys II •••■■■■■■■■■■■■■■■■■■■■ 1J»»»BBBBBBBBBBBBBBBBBOBü 1 K «««BBBBBBBB were imaged in 1 L • • • B B B B
IN • • • B B B B tnree individual 1 O •••BBBBBBBBBBO 1 P •••BBBBBBBBBBBB
imaging sessions
(performed on
three separate days), separated by at least 2 weeks (the pre-laser imaging sessions). The trabecular
meshwork of one eye (study eye) of each monkey was then treated with Argon Laser to induce
elevated IOP. The ONHs of both eyes of each monkey (the study eye and the normal contralateral
eye) were then imaged every 2 weeks (the post-laser imaging sessions) through the onset and
progression of glaucomatous damage in each monkey's study eye.
53

At each LEGS imaging session, six CSLO images of the ONH were acquired at each of a
series of eight CSLO-observation points and four standard stereoscopic photographs were acquired
at each of two additional stereo photographic-observation points (Table 2). Each imaging session
observation point of the LEG study thus represents a longitudinal library of images obtained within
one set of
Table 2. LEGS Imaging Session Observation Points experimental
Observation # Images Observation Point Experimental Conditions Conditions. The
Eve Point Acquired IOP 10/15 degree image EKG-linked Study Eye 01 6 Physiologic 10 degree EKG LEGS library is
02 6 Physiologic 15 degree EKG 03* 6 IOP 10,60 min 10 degree non-EKG 04* 6 IOP 10,60 min 15 degree non-EKG actually a Series of 05 6 IOP 10,90 min 10 degree EKG 06 6 IOP 10,90 min 15 degree EKG 07 4 ONH stereophotographs libraries which can
Contralateral 11* 6 Physiologic 10 degree non-EKG Normal Eye 12* 6 Physiologic 15 degree non-EKG each be processed
13 4 ONH stereophotographs ' Subset of images to be used in Phase 1
separately and then
compared. Overall, the LEGS libraries were designed to include 1) images that characterize the
variability inherent to imaging an unchanging eye over time (images of each study eye at each of its
three pre-laser imaging sessions and images of each contralateral normal eye at a variable number
(7 to 23) of pre- and post-laser imaging sessions) and 2) images that characterize the onset and
progression of true glaucomatous ONH surface change (images of each study eye at each of its post-
laser imaging sessions).
Strategies for image alignment and data processing have progressed through many
preliminary forms. Figure 1 demonstrates the location of reference regions within an CSLO image,
the LSU regional analysis strategy and our global summary parameter Mean Position of the Disc
(MPD). An example of the Minimum Detectable Change for a series of LSU regional parameters
54

and MPD is demonstrated in Table 3. The magnitude and location of the onset of statistically
significant glaucomatous damage are demonstrated for the same parameters in Table 4. The results
of our initial interpretation of the data have been reported in three abstracts presented at the
Association for Research in Vision and Ophthalmology (ARVO) in May of this year (see Appendix)
(1,2,3).
3) Study 04 (our laboratory numbering system): Regional Compliance of the Normal and
Glaucomatous Monkey Optic Disc. The second major study we have begun is a direct follow up
to the work on compliance testing we have just published. Our principal goals are to define the
overall tilt that occurs in the posterior pole of the eye following acute pressure elevations, as well
as the regional behavior of the surface of the optic nerve head and peripapillary retina.
This study, as well as study 01 above, utilizes the system for rapid confocal scanning laser
image acquisition and data analysis that was described in our previous progress report and is now
fully operational in our laboratory. Our system allows us to acquire 6 to 10 images of the optic nerve
head at a given observation point (any point in time at which we wish to characterize the position
and/or configuration of the surface of the nerve head). Each image is then "registered" or "aligned"
to a reference image for that eye and the elevation value for each pixel location is transferred to our
Silicon Graphics INDY, where data are automatically entered into SAS statistical software, and
mean data for each pixel value are generated for the 6 to 10 images. At present, the data for the 6
images we routinely require at an observation point are processed and available to us in 10 minutes
as an "Observation Point summary form" (example in addendum). In addition we have now built the
ability to look at the results of one complete compliance testing session with the position of the ONH
tissues at each observation point (relative to position at the BASELINE observation point) color
55

mapped (Figure 2).
This study implements a group of protocols in which the optic nerve head is imaged at a
series of observation points at low and high intraocular pressure. We have completed five repetitions
of the complete compliance test (obtained on five different days) on a total of six eyes and have
reported the results of a preliminary analysis of the data in an ARVO abstract (see Appendix) (4).
References:
1. Hunt J, Qiu L, Klyce N, Thompson HW, Burgoyne CF: Minimum detectable change (MDC)
within regions of the optic disc and peripapillary retina in a longitudinal study of
experimental glaucoma by confocal scanning laser ophthalmoscopy (CSLO). ARVO
Abstract, Invest Ophthalmol Vis Sei 37(Suppl), 1996.
2. Burgoyne CF, Hunt J, Qiu L, Klyce N, Thompson HW: Change within regions of the optic
disc precedes change within regions of the peripapillary retina in a longitudinal study of
experimental glaucoma by confocal scanning laser ophthalmoscopy (CSLO). ARVO
Abstract, Invest Ophthalmol Vis Sei 37(Suppl), 1996.
3. Thompson HW, Harlow CA, Beuerman RW, Burgoyne CF, Heickell AG: Discrete wavelet
transforms as change detectors in optic disc images. ARVO Abstract, Invest Ophthalmol Vis
Sei 37(Suppl), 1996.
4. Heickell AG, Thompson HW, Burgoyne CF: Regional compliance of the monkey optic disc
and peripapillary retina by scanning laser ophthalmoscopy. ARVO Abstract, Invest
Ophthalmol Vis Sei 37(Suppl), 1996.
56

Appendix II:
A. Reference 1
B. Reference 2
C. Reference 3
D. Reference 4
E. Table 3
F. Table 4
G. Figure 1
H. Figure 2
57

APPENDIX II
58

A. REFERENCE 1
59
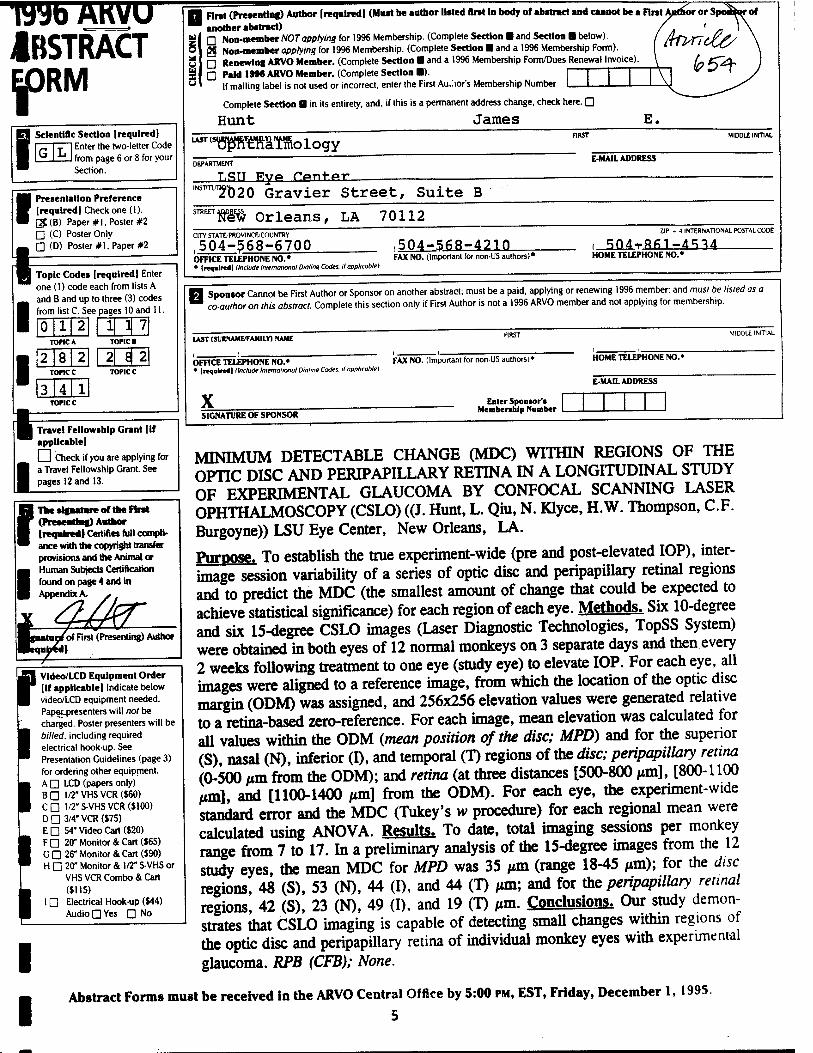
'E)% AKVU IBSTRACT
RM 1° I Scientific Section [required)
Enter the two-letter Code from page 6 or 8 for your Section.
I I I I
Presentation Preference (required) Check one (1). 3(B) Paper #1. Poster #2 □ (C) Poster Only Q (D) Poster #1, Paper #2
Topic Codes I required) Enter one (1) code each from lists A and B and up to three (3) codes from list C, See pages 10 and 11.
0 1 2 1 ] 7 TOPIC A TOPICS
2 8 2 2 o TOflCC TOPIC C
3 4 1
First (Presenting) Author (required) (Must be author listed first In body of abstract and cannot be a First Author or Sp another abstract) / ' , Q Non-member NOT applying for 1996 Membership. (Complete Section ■ and Section ■ below). / AfT/fttf/y 25 Non-memberopp/ymg for 1996 Membership. (Complete Section Band a 19% Membership Form). '-'UC/ □ Renewing ARVO Member. (Complete Section ■ and a 1996 Membership Form/Dues Renewal Invoice). \ £? fv4- □ Paid 1996 ARVO Member. (Complete Section ■). I I I I m ^ «•' '
If mailing label is not used or incorrect, enter the First Au.iior's Membership Number 3 Complete Section O in its entirety, and, if this is a permanent address change, check here. □
Hunt James E.
""'TP^ärmology DEPARTMENT
TiSTT Kyp Tpnt-pr E-MAIL ADDRESS
vv2t)20 Gravier Street, Suite B r» Orleans, LA 70112
CITY STATE/PROVINCE/COUNTRY
,504-568-6700 OFFICE TELEPHONE NO.» • \nv\rt4\ {Include IntemalionalOialinn Codes, ilapplicable!
FAX NO. (Important for non-US authors)*
ZIP * 4 INTERNATIONAL POSTAL CODE
50^861-4^4 HOME TELEPHONE NO.'
I Travel Fellowship Grant (if applicable]
I I Check if you are applying for a Travel Fellowship Grant. See pages 12 and 13.
Sponsor Cannot be First Author or Sponsor on another abstract; must be a paid, applying or renewing 1996 member: and must be listed as a co-author on this abstract. Complete this section only if First Author is not a 1996 ARVO member and not applying for membership.
LAST (SVIWAMBFAMILY) NAME
OFFICE TELEPHONE NO.* {Include International Dialing Codes, if applicable)
FAX NO. (Important for non-US authors)» HOME TELEPHONE NO.»
E-MAIL ADDRESS
SIGNATURE OF SPONSOR
Enter Sponsor'! Membership Number
f I
The Signatare of the Fir»! (Presenting) Antkor [require*! Certifies füll compli- ance witii the copyright transfer provisions and the Animal or Human Subjects Certification found on page 4 and in Appendix A.
I I
I I
MINIMUM DETECTABLE CHANGE (MDC) WITHIN REGIONS OF THE OPTIC DISC AND PERIPAPILLARY RETINA IN A LONGITUDINAL STUDY OF EXPERIMENTAL GLAUCOMA BY CONFOCAL SCANNING LASER OPHTHALMOSCOPY (CSLO) ((J. Hunt, L. Qiu, N. Klyce, H.W. Thompson, C.F. Burgoyne)) LSU Eye Center, New Orleans, LA.
Purpose. To establish the true experiment-wide (pre and post-elevated IOP), inter- image session variability of a series of optic disc and peripapillary retinal regions and to predict the MDC (the smallest amount of change that could be expected to achieve statistical significance) for each region of each eye. Methods. Six 10-degree and six 15-degree CSLO images (Laser Diagnostic Technologies, TopSS System) were obtained in both eyes of 12 normal monkeys on 3 separate days and then every 2 weeks following treatment to one eye (study eye) to elevate IOP. For each eye, all images were aligned to a reference image, from which the location of the optic disc margin (ODM) was assigned, and 256x256 elevation values were generated relative to a retina-based zero-reference. For each image, mean elevation was calculated for all values within the ODM {mean position of the disc; MPD) and for the superior (S), nasal (N), inferior (I), and temporal (T) regions of the disc; peripapillary retina (0-500 Mm from the ODM); and retina (at three distances [500-800 Mm], [800-1100 Mm], and [1100-1400 urn] from the ODM). For each eye, the experiment-wide standard error and the MDC (Tukey's w procedure) for each regional mean were calculated using ANOVA. Results. To date, total imaging sessions per monkey range from 7 to 17. In a preliminary analysis of the 15-degree images from the 12 study eyes, the mean MDC for MPD was 35 fim (range 18-45 /mi); for the disc regions, 48 (S), 53 (N), 44 (I), and 44 (T) /mi; and for the peripapillary retinal regions, 42 (S), 23 (N), 49 (I), and 19 (T) pm. Conclusions. Our study demon- strates that CSLO imaging is capable of detecting small changes within regions of the optic disc and peripapillary retina of individual monkey eyes with experimental glaucoma. RPB (CFB); None.
Abstract Forms must be received in the ARVO Central Office by 5:00 PM, EST, Friday, December 1, 1995. 5
Video/LCD Equipment Order [If applicable) Indicate below video/LCD equipment needed. Papecpresenters will not be charged. Poster presenters will be billed, including required electrical hook-up. See Presentation Guidelines (page 3) for ordering other equipment. A □ LCD (papers only) BD 1/2" VHS VCR ($60) CD 1/2"S-VHSVCR($100) DD 3/4" VCR ($75) EG 54" Video Cart ($20) F D 20" Monitor & Cart ($65) G □ 26" Monitor & Cart ($90) H D 20" Monitor & 1/2" S-VHS or
VHS VCR Combo & Cart ($115)
ID Electrical Hook-up ($44) Audio Q Yes D N°

B. REFERENCE 2
61

AIWU ABSTRACT
ORM f t Scientific Section |required!
| 1 I Enter the two-letter Code Ift lT. I from page 6 or 8 for your
Section.
IP Presentation Preference (required) Check one (1). 3(B) Paper #1, Poster #2 D (C) Poster Only □ (D) Poster #1. Paper #2
IS Topic Code* (required) Enter one (I) code each from lists A and B and up to three (3) codes from list C. See pages 10 and II.
0 1 2 1 11 7 TOPIC A TOPIC B
2 8 2 2 fl E TOPIC C TOPIC C
3 4 1
I
j Fir»* (Presenting) Author (required) (Mut be author lilted Urst la body of abstract «ad cannot be a First Author or Sponsor of another abstract) ' □ Non-nember WOT"applying for 1996 Membership. (Complete Section ■ and Section ■ below). □ Non-member applying for 1996 Membership. (Complete Section ■ and a 1996 Membership Form).
I □ Renewing ARVO Member. (Complete Section ■ and a 1996 Membership Form/Dues Renewal Invoice). H Paid 19M ARVO Member. (Complete Section ■).
If mailing label is not used or incorrect, enter the First Author's Membership Number
Complete Section ■ in its entirety, and. if this is a permanent address change, check here. □
■AST (SUINAME/FAMILY) NAME Claude F Burgoyne Ophthalmology L5U Medical Center 2020 GRAVIER STREET SUITE B NEW ORLEANS LA 70112-2234
40316 MIDOLE INITIAL
DkESS
STREET ADDRESS
CITY STATE PROVINCE/COUNTRY
,504-568-6700/316 OFFICE TELEPHONE NO.» • !r«qillft4l {Include International Dialing Codes, it applicable)
,504-568-4210 FAX NO. (Important for non-US authors)*
ZIP * 4 INTERNATIONAL POSTAL CODE
,504-897-2269 HOME TELEPHONE NO.«
J Travel Fellowship Grant (If applicable!
I I Check if you are applying for a Travel Fellowship Grant. See pages 12 and 13.
Sponsor Cannot be First Author or Sponsor on another abstract; must be a paid, applying or renewing 1996 member; and must be listed as a co-author on this abstract. Complete this section only if First Author is not a 1996 ARVO member and not applying for membership.
LAST (SUINAME/FAMILY) NAME MIDDLE INITIAL
OFFICE TELEPHONE NO.« {Include International Dialint Codes, if applicable)
FAX NO. (Important for non-US authors)* HOME TELEPHONE NO.«
E-MAIL ADDRESS
SIGNATURE OF SPONSOR Eater Spoasor'i
Mcabcnhip Number
The Signatare of the First (Presenting) Author (reqairedl Certifies full compli- ance with the copyright transfer provisions and the Animal or Human Subjects Certification found on page 4 and in
'tMCwitot^ ing) Author
I I
CHANGE WITHIN REGIONS OF THE OPTIC DISC PRECEDES CHANGE WITHIN REGIONS OF THE PERIPAPILLARY RETINA IN A LONGITUDINAL STUDY OF EXPERIMENTAL GLAUCOMA BY CONFOCAL SCANNING LASER OPHTHALMOSCOPY (CSLO) ((C.F. Burgoyne, J. Hunt, L. Qiu, N. Klyce, H.W. Thompson)) LSU Eye Center, New Orleans, LA.
Purpose. To evaluate a regional strategy for detecting the onset of damage to the optic disc and peripapillary retina in experimental glaucoma. Methods. Six 10- degree and six 15-degree CSLO images (Laser Diagnostic Technologies, TopSS System) were obtained in both eyes of 12 normal monkeys on 3 separate days and then every 2 weeks following treatment to one eye (study eye) to elevate IOP. For each eye, all images were aligned to a reference image, from which the location of the optic disc margin (ODM) was assigned, and 256x256 elevation values were generated relative to a retina-based zero-reference. For each image, mean elevation was calculated for all values within the ODM (mean position of the disc; MPD) and for the superior (S), nasal (N), inferior (I), and temporal (T) regions of the disc; peripapillary retina (0-500 pm from the ODM); and retina (at three distances [500- 800 jim], [800-1100 /im], and [1100-1400 jim] from the ODM). For each monkey, the mean elevation for each region at each imaging session was calculated using ANOVA. Results. To date, total imaging sessions per monkey range from 7 to 17, and evidence of damage has been achieved in 11 study eyes. Analysis of the 15- degree study eye images suggests that detectable change (p<.05, ANOVA) is greatest and is detected as significant earliest in MPD or in the 4 regions of the disc (10/11 glaucomatous eyes), compared to detection in the peripapillary ret ma. Conclusions. Early change in the optic disc is detectable by CSLO before ^ hange in the peripapillary retina in experimental glaucoma. While we believe this finding reflects the natural history of the disease, the regions of a CSLO image used t.» jiitin and establish reference zero may dictate the most sensitive areas for the detection of change. RPB (CFB); None.
Abstract Form« must be received in the ARVO Central Office by 5:00 PM, EST, Friday, December 1. 199*
El Video/LCD Equipment Order (if applicable) Indicate below video/LCD equipment needed. Paper presenters will nor be charged. Poster presenters will be billed, including required electrical hook-up. See Presentation Guidelines (page 3) for ordering other equipment. A □ LCD (papers only) BO 1/2'VHS VCR ($60) CD 1/2"S-VHSVCR($100) DO 3/4" VCR ($75) ED 54" Video Cart ($20) FO 20" Monitor & Cart ($65) G □ 26" Monitor & Cart ($90) H D 20" Monitor & 1/2" S-VHS or
VHS VCR Combo & Cart ($115)
ID Electrical Hook-up($44)
Audio nYe* D N°

C. REFERENCE 3
63

na% AKVü ABSTRACT
ORM f f Scientific Section [required]
Enter the two-letter Code from page 6 or 8 for your Section.
Presentation Preference [required] Check one (1).
30 (B) Paper #1. Poster #2 □ (C) Poster Only □ (D) Poster #1, Paper #2
Topic Codes [required | Enter one (1) code each from lists A and B and up to three (3) codes from list C. See pages 10 and 11.
0 1 2 1 1 7 TOflCA TOPICS
2 R 2 2 R 5 TOPIC C TOPIC C
3 4 1
First (Presenting) Author |requlred| (Must be author listed first in body of abstract and cannot be a First Author or Sponsor of another abstract) □ Non-member NOT applying for 1996 Membership. (Complete Section ■ and Section ■ below). □ Non-member applying for 1996 Membership. (Complete Section ■ and a 1996 Membership Form).
Renewing ARVO Member. (Complete Section ■ and a 1996 Membership Form/Dues Renewal Invoice). Paid 1996 ARVO Member. (Complete Section ■). If mailing label is not used or incorrect, enter the First Author's Membership Number
Complete Section B in its entirety, and. if this is a permanent address change, check here. □
LAST (SURNAME/FAMILY) NAME
Hilary W Thompson, PhD Ophthalmology LSU Eye Center 2020 GRAVIER ST SUITE B NEW ORLEANS LA 70112
29869
)RESS
STREET ADDRESS
«gJft^ggS^OO/350 OFFICE TELEPHONE NO.» • I required | (Include International Dialing Codes, it applicable)
504-568-4210 504-83?-*:™ .TIONAL POSTAL CODE
FAX NO. (Important for non-US authors)» (- . HOME TELEPHONE NO.*
-)-
Travel Fellowship Grant I If applicable]
I I Check if you are applying for a Travel Fellowship Grant. See pages 12 and 13.
Sponsor Cannot be First Author or Sponsor on another abstract; must be a paid, applying or renewing 1996 member; and must be listed as a coauthor on this abstract. Complete this section only if First Author is not a 1996 ARVO member and not applying for membership.
LAST (SUINAMETAMILY) NAME MIDDLE INITIAL
OFFICE TELEPHONE NO.« • |reqnirc4| (Include International Dialing Codes, if applicable)
FAX NO. (Important for non-US authors)* HOME TELEPHONE NO.*
E-MAIL ADDRESS
SIGNATURE OF SPONSOR Enter Sponsor'!
Membership Number
The «igaarare of the First (Presenting) Author [required) Certifies full compli- ance with the copyright transfer provisions and the Animal or Human Subjects Certification found on [
#U- (Presenting) Author
I I
DISCRETE WAVELET TRANSFORMS AS CHANGE DETECTORS IN OPTIC DISC IMAGES (H.W. Thompson1, C.A. Harlow2, R.W. Beuerman1, C.F. Burgoyne1, A.G. Heickell1) LSU Eye Center, New Orleans LA1; Remote Sensing and Image Processing Laboratory. Louisiana State University, Baton Rouge LA2.
Purpose. Wavelets are a basis function used in image compression. We use wavelet transformations to devise efficient measures from digital images that detect changes in optic disc surface topography depth related to increased IOP. Methods. Images were obtained from normal monkey eyes in which the IOP was acutely elevated using an anterior chamber cannula connected to a manometer. Elevation data files (256 x 256) were produced by the TopSS System and software (Laser Diagnostic Technologies). The Statistical Analysis System (SAS) and Splus statistical packages were used to develop 2-dimensional wavelet transforms (s8 wavelet as basis) of images from different IOP levels. Results. For each image one subset of the wavelet coefficients (the s5-s5 wavelet crystal) was found to account for >90% of the information in the image; this was not true for control (random) images. All computations were therefore carried out on this reduced set of coefficients (49 values). An analysis of variance with repeated measures (multiple images from one eye at one IOP) was applied to the wavelet coefficients. Significant differences were detected between pressures but no significance differences were evident between repeated images. Control "Images" of values drawn from a random number generator and constrained to have overall mean and variance similar to those of the original data and "images" where the order of the values in the original images was randomly shuffled showed no significant differences in similar analyses. Conclu- sions. Coefficients derived from 2-dimensional wavelet transformations pros i«Je a means of detecting acute depth changes in the optic disc. In addition to rapidity of computation of 49 numbers compressed from 65,536 depth values, the sensitiv uy of this method compared to conventional parameters for optic disc change will he assessed. RPB (CFB); None.
Abstract Forms must be received in the ARVO Central Office by 5:00 PM, EST, Friday, December 1, 1995
Video/LCD Equipment Order [if applicable) Indicate below video/LCD equipment needed. Paperjjresenters will not be charged. Poster presenters will be billed, including required electrical hook-up. See Presentation Guidelines (page 3) for ordering other equipment. A O LCD (papers only) BO 1/2" VHS VCR ($60) CD 1/2"S-VHSVCR($100) DQ 3/4" VCR ($75) ED 54" Video Cart ($20) FQ 20" Monitor & Cart ($65) G □ 26" Monitor & Cart ($90) H D 20" Monitor & 1/2" S-VHS or
VHS VCR Combo & Cart ($115)
ID Electrical Hook-up ($44) Audio □ Yes □ No

D. REFERENCE 4
65

IKWft AftVU ABSTRACT
ORM f I
Scientific Section {required] Enler the two-letter Code from page 6 or 8 for your Section.
Presentation Preference [requiredI Check one (I).
JQ (B) Paper #1. Poster #2 □ (C) Poster Only □ (D) Poster #1. Paper #2
Topic Code» [requiredl Enter one (1) code each from lists A and B and up to three (3) codes from list C. See pages 10 and 11.
0 1 2 1 0 1 Tone A TOPICS
2 R 2 3 4 1 TOPIC C Toncc
? 8 s T one c
Travel Fellowship Grant (if applicable!
I 1 Check if you are applying for a Travel Fellowship Grant. See pages 12 and 13.
I The signature of the First (Presenting) Author [requiredl Certifies full compli- ance with the copyright transfer provisions and the Animal or Human Subjects Certification found on page 4 and in AppendixA. ,*/ *
Signature of First (Presenting) Author [requiredl
Video/LCD Equipment Order (if applicable! Indicate below video/LCD equipment needed. Paperpresenlers will not be charged. Poster presenters will be. billed, including required electrical hook-up. See Presentation Guidelines (page 3) for ordering other equipment. A □ LCD (papers only) BO 1/2" VHS VCR ($60) CD 1/2"S-VHSVCR($I00) DO 3/4" VCR ($75) EO 54" Video Cart ($20) FQ 20" Monitor & Cart ($65) G D 26" Monitor & Cart ($90) H □ 20" Monitor & 1/2" S-VHS or
VHS VCR Combo & Cart ($115)
ID Electrical Hook-up ($44) Audio □ Yes □ No
First (Presenting) Author [required! (Must be author listed first in body of abstract and cannot be a First Author or Sponsor of another abstract) A » . □ Non-member NOT applying for 1996 Membership. (Complete Section ■ and Section ■ below). /rflTjC^^
3QC Non-member applying for 1996 Membership. (Complete Section ■ and a 1996 Membership Form). ' I O Renewing ARVO Member. (Complete Section ■ and a 1996 Membership Form/Dues Renewal Invoice). , /"""V? □ Paid 199« ARVO Member. (Complete Section ■). I [ 1 1 1 1 (&Z2 ( *
If mailing label is not used or incorrect, enter the First Author's Membership Number I I I I I I
Complete Section ■ in its entirety, and. if this is a permanent address change, check here. □
HeicRell . aurora G. LAST (»«NAME/FAMILY) NAME
TSb Eye Center
"«ST MIDDLE IWTIAt.
heickellflindy.ophth.lsiimc E-MAIL ADDRESS j
nfrJ20 Gravier Street, Suite B
Yew Orleans, LA 70112 USA CITY STATE PROVINCECOUNTRY
, 504-568-6700/419 OFFICE TELEPHONE NO.* • |K^ttin41 {Include International Dialing Code*, if applicable)
504-5,68-4210 FAX NO. (Important for non-US authors)*
504-8,95-2222 ZIP * 4 INTERNATIONAL POSTAL CODE
HOME TELEPHONE NO.*
Sponsor Cannot be First Author or Sponsor on another abstract: must be a paid, applying or renewing 1996 member; and must be listed as a coauthor on this abstract. Complete this section only if First Author is not a 1996 ARVO member and not applying for membership.
LAST (SURNAME/FAMILY) NAME
OFFICE TELEPHONE NO.« • |rcqttlf*4l (Include International OialintCodn.il applicable!
FAX NO. I Important for non-US authors)* HOME TELEPHONE NO-
E-MAIL ADDRESS
SIGNATURE OF SPONSOR
Enter Sponsor's Membership Numb«
REGIONAL COMPLIANCE OF THE MONKEY OPTIC DISC AND PERIPAP- ILLARY RETINA BY SCANNING LASER OPHTHALMOSCOPY ((A.G. Heickell, H.W. Thompson, C.F. Burgoyne)) LSU Eye Center, New Orleans, LA.
Purpose. To characterize the regional compliance of the optic disc and peripapillary retina in the normal monkey eye. Methods. Six eyes of 6 monkeys were compliance tested 5 times each. A 27-gauge cannula (connected to a manometer) was placed into the anterior chamber and six 15-degree images (Laser Diagnostic Technologies, TopSS System) were obtained at a series of time-points at 10, 30, and 45 mm Hg. Images were aligned to a reference image for each eye that contained the location of the optic disc margin (ODM). For each image, elevation data (256 x 256 pixels) were generated relative to a retina-based zero-reference and mean elevation was calculated at each time-point for the superior (S), nasal (N), inferior (I), and tempo- ral (T) regions of the disc; peripapillary retina (0-500 pan from the ODM); and retina (at three distances [500-800 /mi], [800-1100 /tin], and [1100-1400 pm] from the ODM). Results. In a preliminary analysis of 3 eyes, significant (p<05, ANOVA) posterior deformations (-43 to -99 /im) were detected 10 minutes after IOP elevation to 30 mm Hg in the (S), (N), (I), and (T) disc regions of monkey 1 Total deformation increased (-85 to -122 /mi) after IOP elevation to 45 mm Hg in all four disc regions of monkey 1 and Increased to achieve significance in the (S) and < N) disc regions of monkey 2 (-67 to -103 /xm) and the (T) disc region of monkey 3 ( 48 /tm). Deformations of the peripapillary retina and retina regions compatible vnth nasal/temporal retinal tilt were detected in all three monkey eyes. Conclusions. Differences in the regional compliance of the optic disc and peripapillary retina may be detectable as early as 10 minutes after IOP elevation to 30 mm Hg in irxh\ iJual monkey eyes. Peripapillary retinal tilt is an important component of the -vcrill response of the posterior pole to acute elevation of IOP. Research to Prevent Blindness, Inc. (CFB) s ■■"*•■
Abstract Form» must be received in the ARVO Central Office by 5:00 PM, EST, Friday, December 1, 199*

E. TABLE 3
67

5 0) «5
c
O -S3
CO
E ® a
CO
. "sit 0)
CL
1 WNir)i-mcooT-
co o oi CO N O) co ^f
lO NOOrCOWOOOOO hrcococococo^^^
OCOCOCOCONOICOCO
(DO)1"OCOOO^(DCO CM^tCO^frLO^^CMCM
LOOLOCOCMCOO^OO
O CD LO CO Ö> h- ÖÖ CM: T- ^-co^t^-co^j-cM^t^t
OLOLO^tKLOCMCOOO
COrtWt^tCOOr CM CO CO CO ^ ^ ■** CO CO
IP Q LU LL CD
T- O LO r- CM T-
ft O N r- CM -«—
CO CO CO CO CO cs
^f K CO CM CO CO
CO CO CO CM LO LO
CO ^ LO CM CO CO
-r- CO O CO CO LO
O CM Ö) CO CO LO
. CM O
Z O 0L
■
ii®;IÄiÄI

F. TABLE 4
69

oe Z
"Q. CO
CM' £> CM CD co CM c\j T- + V + +
CM Cp T- CD —■ 1^ O o
CM CD 1 1 V. ./ I I 1
h- h- m <& m m ■' :i; I'.■■'■'■' .-.-• .'
CM *"" CO
r^
1
LO CD
in ^r h- co
i i
tö CM
O«JCöWOOOOOOGGO
i CO

G. FIGURE 1
71

Q Q.
C re w
"5> >. re c (0
75 c o '5) a> ■_
« «s a> i_ «s V u c o 1_ 0) »^ V l_
3 CO
2>
o (A
Q a>
°D
(A O a. c re a>
(A '55 >. re c < re c o
"5> a> cc
CO
(A re 0)
o ,_ © g
rew C_l
a> cc

H. FIGURE 2
73

*- o o
en
CO a,
°" ° •§ 's CD — o s o ® *- *- ccro 9-5.2 3
D) o E g>-ö g> «S 03 '*- ~ <fl O E-OLU §■--
"— CC I O O 03
S.|Sl|l fl>.S?cQ £.b CO ?M 03ti>t:x fe|°-§z ^*J3 CO
gS'g>3«'S
— o>-£ ^ 2 03 5
c c a>£ as ® o OEoi^l
<0_c
CD-
CO o c-
03
- £ E-i 2 »=§
n « ^ 03 03 O D) .2 O) Q> < 03 . C <gto£rö ^g-g 0) £ o Sg 03 0.^
*= S iS « 03 -!2 -° « t° ® w > Q -o w -I. m^ 0) ** o>,_ a: ro ® N o-r.2 p £- re cEg>£.o3oE ■E o>
CO E ^ J3 *- ^ s
.2 <" o Ö r is -2
= Z §.£oEi
a.£ cm a^o
nCO- Q) ^
0) o»1-" C 03": 5 j=
< > o z < U3 o V
< > o z < in o V
0 D> c (0 .c Ü
c <
(1) en c (0 .c o
jS ü5 co co
c
CO
Q CL

C. Herpes: The Prevention of Recurrences of Viral Disease
1. Beta blocker modulation of viral reactivation
In previous progress reports, we presented our results of studies designed to investigate the
role of adrenergic receptor blockade in herpesvirus reactivation in the nervous system of rabbits and
mice (1,2). Following the positive studies which showed that propranolol effectively reduced the
isolation of reactivated herpesvirus and reduced amount of herpes DNA in the cornea of mice (1)
and the reduced number of recurrences of herpetic keratitis in the rabbit (2), we proceeded to study
the effect of propranolol in reducing recurrences of herpetic keratitis in a primate model. Twenty
young adult squirrel monkeys were infected bilaterally with the Rodanus strain of HSV-1. Twenty
one days after infection, the animals were randomized to be treated with either intraperitoneal (IP)
injections of 5 mg propranolol every eight hours or BSS control. Using our model of temperature
stress to induce more ocular recurrences, we treated the monkeys for one full day of TID treatments
plus two additional treatments before lowering the room temperature. Treatment was continued an
additional two times and the room temperature was raised to its normal 78 ° C. We were not able to
show any statistical effect of the propranolol treatment, mainly, we believe, due to very few ocular
recurrences in both groups. It is possible that the group of animals used had very limited HSV
infection of the central nervous system (they had very mild initial ocular infections), and therefore
did not show very many clinical recurrences. This study will be repeated with another group of
monkeys which will be infected with a fresh, more virulent passage of virus.
The beta adrenergic receptor blocker, propranolol, a receptor active drug with mixed activity
on beta 1 and beta 2 adrenergic receptors efficiently blocks heat stress-induced viral reactivation in
mice. We have proposed that this compound, propranolol, allows us an entry into the
75

chemicobiological sequence of events which take place during stress-induced viral reactivation. In
order to further dissect this effect, we propose to test other beta adrenergic receptor active
compounds including those with mixed beta 1 and beta 2 receptor binding activity, those which are
beta 1 receptor selective, and those which are beta 2 receptor selective. During the past year of
support, we have made significant progress in such studies.
To date, the following beta adrenergic receptor blocking agents have been tested: 1)
propranolol, 2) timolol, 3) penbutolol, 4) betaxolol, 5) metoprolol, and 6) ICI 118,551. Each of these
selective or nonselective beta adrenergic agents, except penbutolol, has shown some significant
activity in inhibiting stress-induced viral reactivation (Table 1).
TABLE 1: SUMMARY OF BETA ADRENERGIC BLOCKING AGENTS AFFECTING VIRAL REACTIVATION
Beta Blockers and HSV Reactivation
Drug Action
Effect on Reactivation (+, blocks;—, no effect) Betal Beta 2 Mixed
Propranolol + +
Timolol + +
Penbutolol + —
Betaxolol + +
Metoprolol + +
ICI 118,551 + +
In each experimental series, a group of mice which had been previously infected with herpes
simplex virus type 1 (HSV-1) was treated with a mixed or beta 1 and beta 2 adrenergic receptor
blocking agent, a beta 1 or beta 2 selective compound, or treated with a placebo solution and then
stressed and the frequency of viral reactivation determined. Tables 2 through 7 below indicate the
76

detailed results obtained with each group of mice that were tested for viral reactivation by
determining the presence of infectious virus appearing on the ocular surface.
TABLE 2: INFECTIOUS VIRUS ON THE OCULAR SURFACE*
Treatment Experiment
Propranolol 4/22J
Saline 12/24
*Fifty days after infection mice were treated with propranolol (1.0 mg/0.1 ml) daily for three days. On the third day the animals were heat stressed and their corneas swabbed for infectious virus 24 hours later.
JThe numbers represent the swabs which exhibited cytopathic effect (CPE) over the total number of eye swabs performed. There is statistically significant difference between the frequency of infectious virus between the treated and untreated animals, p < 0.005.
TABLE 3: INFECTIOUS VIRUS ON THE OCULAR SURFACE*
Treatment Experiment
Timolol 4/18 %
Saline 9/17
*Fifty days after infection mice were treated with timolol maleate (0.6 mg/0.1 ml) daily for three days. On the third day the animals were heat stressed and their corneas swabbed for infectious virus 24 hours later.
JThe numbers represent the swabs which exhibited cytopathic effect (CPE) over the total number of eye swabs performed. There is statistically significant difference between the frequency of infectious virus between the treated and untreated animals, p < 0.005.
77
I

TABLE 4: INFECTIOUS VIRUS ON THE OCULAR SURFACE*
Treatment Experiment
Penbutolol 14/25$
Saline 15/23
*Fifty days after infection mice were treated with penbutolol sulfate (2.0 mg/0.1 ml) daily for three days. On the third day the animals were heat stressed and their corneas swabbed for infectious virus 24 hours later.
JThe numbers represent the swabs which exhibited cytopathic effect (CPE) over the total number of eye swabs performed. There was no statistically significant difference between the frequency of infectious virus between the treated and untreated animals, p< 0.100.
TABLE 5: INFECTIOUS VIRUS ON THE OCULAR SURFACE*
Treatment Experiment
Betaxolol 5/16$
Saline 10/15
*Fifty days after infection mice were treated with betaxolol (1.0 mg/0.1 ml) daily for three days. On the third day the animals were heat stressed and their corneas swabbed for infectious virus 24 hours later.
$The numbers represent the swabs which exhibited cytopathic effect (CPE) over the total number of eye swabs performed. There is statistically significant difference between the frequency of infectious virus between the treated and untreated animals, p < 0.005.
78

TABLE 6: INFECTIOUS VIRUS ON THE OCULAR SURFACE*
Treatment Experiment
Metoprolol 7/25$
Saline 16/24
* Fifty days after infection mice were treated with metoprolol (1.0 mg/0.1 ml) daily for three days. On the third day the animals were heat stressed and their corneas swabbed for infectious virus 24 hours later.
JThe numbers represent the swabs which exhibited cytopathic effect (CPE) over the total number of eye swabs performed. There is statistically significant difference between the frequency of infectious virus between the treated and untreated animals, p < 0.005.
TABLE 7: INFECTIOUS VIRUS ON THE OCULAR SURFACE*
Treatment Experiment
ICI 118,551 8/24$
Saline 15/19
*Fifty days after infection mice were treated with ICI 118,551 (1.0 mg/0.1 ml) daily for three days. On the third day the animals were heat stressed and their corneas swabbed for infectious virus 24 hours later.
JThe numbers represent the swabs which exhibited cytopathic effect (CPE) over the total number of eye swabs performed. There is statistically significant difference between the frequency of infectious virus between the treated and untreated animals, p < 0.005.
As can be seen from the results above, each of the beta 1 or beta 2 selective or mixed activity
beta adrenergic receptor blockers, except penbutolol sulfate, had some specific activity in terms of
inhibiting viral reactivation. We are very encouraged by these results and hope to progress into
clinical trials and further studies in primates in the near future.
New studies also conducted during the past grant year have involved the use of beta
adrenergic receptor agonists to determine if such compounds could replace thermal stress as an
79

initiator of viral reactivation. To this end, groups of mice latent for HSV-1 were treated with
norepinephrine at a dose of 0.01 mg/animal/day for 3 days and then each animal tested for viral
reactivation on a daily basis for 5 days. As can be seen in the data presented in Table 8 below,
norepinephrine given intraperitoneally in the concentration tested has not shown any activity as a
stimulator of viral reactivation. Further studies are in progress using other agonists having both
mixed and beta adrenergic selective activity, as well as a long acting agonist, ephedrine. The results
of these studies will provide us with additional information regarding the mechanism of action of
stress-induced viral reactivation and the pharmacologic intervention in this reactivation process.
TABLE 8: EFFECT OF THE BETA ADRENERGIC RECEPTOR AGONIST, NOREPINEPHRINE, ON VIRAL REACTIVATION
Treatment
Experiment
1 2 3
Norepinephrine 1/11 2/9 0/14
Placebo 2/12 1/12 0/12
References:
1. Gebhardt BM, Kaufman HE: Propranolol suppresses reactivation of herpesvirus. Antiviral Res 27:255-261, 1995.
2. Kaufman HE, Varnell ED, Gebhardt BM, Thompson HW, Hill JM: Propranolol suppression of ocular HSV-1 recurrence and associated corneal lesions following spontaneous reactivation in the rabbit. Curr Eye Res 15:680-684, 1996.
80