Embed Size (px)
Citation preview
Neuro-Cognitive Assessment, Symptoms of Attention Deficit
and Hyperactivity Disorder, and Soldier Performance during 68W Advanced Individual Training
by Valerie J. Rice, Diane Marra, and Jenny Butler
ARL-TR-4292 October 2007 Approved for public release; distribution is unlimited.

NOTICES
Disclaimers The findings in this report are not to be construed as an official Department of the Army position unless so designated by other authorized documents. Citation of manufacturer’s or trade names does not constitute an official endorsement or approval of the use thereof. DESTRUCTION NOTICE⎯Destroy this report when it is no longer needed. Do not return it to the originator.
Army Research Laboratory Aberdeen Proving Ground, MD 21005-5425
ARL-TR-4292 October 2007 Neuro-Cognitive Assessment, Symptoms of Attention Deficit
and Hyperactivity Disorder, and Soldier Performance during 68W Advanced Individual Training
Valerie J. Rice
Human Research and Engineering Directorate, ARL
Diane Marra and Jenny Butler Karta Technologies, Inc.
Approved for public release; distribution is unlimited.
ii
REPORT DOCUMENTATION PAGE Form Approved OMB No. 0704-0188
Public reporting burden for this collection of information is estimated to average 1 hour per response, including the time for reviewing instructions, searching existing data sources, gathering and maintaining the data needed, and completing and reviewing the collection information. Send comments regarding this burden estimate or any other aspect of this collection of information, including suggestions for reducing the burden, to Department of Defense, Washington Headquarters Services, Directorate for Information Operations and Reports (0704-0188), 1215 Jefferson Davis Highway, Suite 1204, Arlington, VA 22202-4302. Respondents should be aware that notwithstanding any other provision of law, no person shall be subject to any penalty for failing to comply with a collection of information if it does not display a currently valid OMB control number. PLEASE DO NOT RETURN YOUR FORM TO THE ABOVE ADDRESS. 1. REPORT DATE (DD-MM-YYYY)
October 2007 2. REPORT TYPE
Final 3. DATES COVERED (From - To)
March 2006 to March 2007 5a. CONTRACT NUMBER
5b. GRANT NUMBER
4. TITLE AND SUBTITLE
Neuro-Cognitive Assessment, Symptoms of Attention Deficit and Hyper- activity Disorder, and Soldier Performance during 68W Advanced Individual Training 5c. PROGRAM ELEMENT NUMBER
5d. PROJECT NUMBER
62716AH70
5e. TASK NUMBER
6. AUTHOR(S)
Valerie J. Rice (ARL); Diane Marra and Jenny Butler (KTI)
5f. WORK UNIT NUMBER
7. PERFORMING ORGANIZATION NAME(S) AND ADDRESS(ES)
U.S. Army Research Laboratory Human Research and Engineering Directorate Aberdeen Proving Ground, MD 21005-5425
8. PERFORMING ORGANIZATION REPORT NUMBER
ARL-TR-4292
10. SPONSOR/MONITOR'S ACRONYM(S)
9. SPONSORING/MONITORING AGENCY NAME(S) AND ADDRESS(ES)
11. SPONSOR/MONITOR'S REPORT NUMBER(S)
12. DISTRIBUTION/AVAILABILITY STATEMENT
Approved for public release; distribution is unlimited. 13. SUPPLEMENTARY NOTES
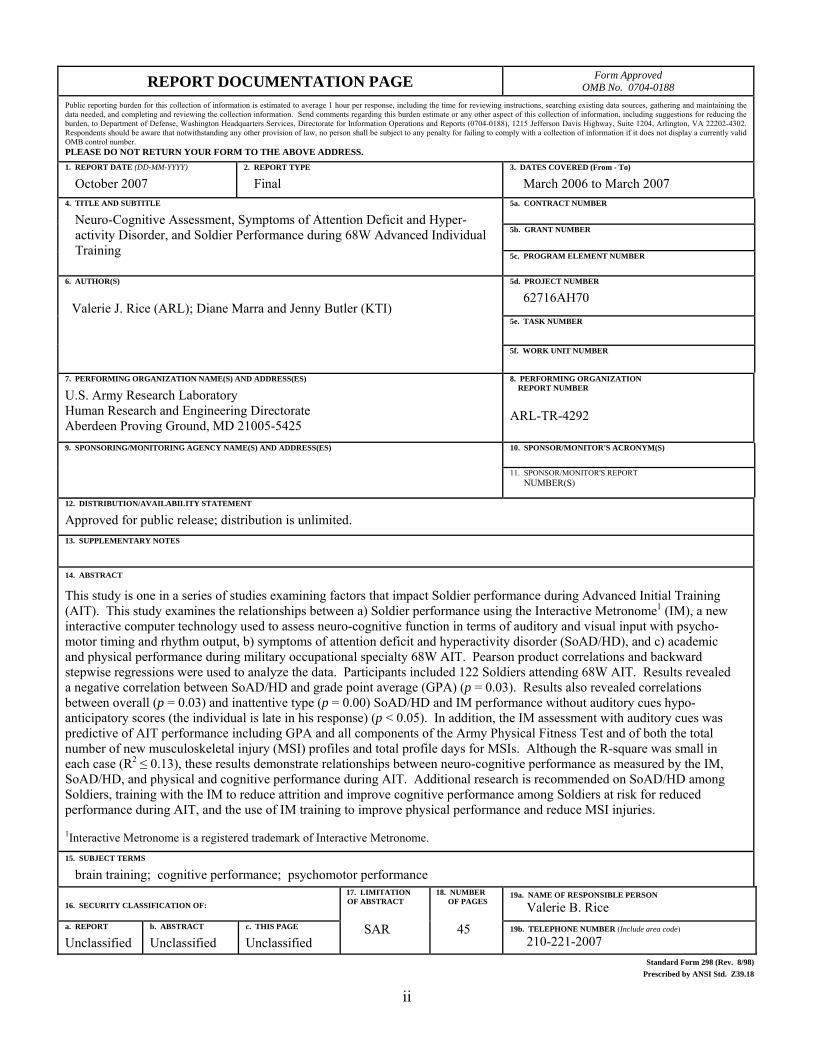
14. ABSTRACT
This study is one in a series of studies examining factors that impact Soldier performance during Advanced Initial Training (AIT). This study examines the relationships between a) Soldier performance using the Interactive Metronome1 (IM), a new interactive computer technology used to assess neuro-cognitive function in terms of auditory and visual input with psycho-motor timing and rhythm output, b) symptoms of attention deficit and hyperactivity disorder (SoAD/HD), and c) academic and physical performance during military occupational specialty 68W AIT. Pearson product correlations and backward stepwise regressions were used to analyze the data. Participants included 122 Soldiers attending 68W AIT. Results revealed a negative correlation between SoAD/HD and grade point average (GPA) (p = 0.03). Results also revealed correlations between overall (p = 0.03) and inattentive type (p = 0.00) SoAD/HD and IM performance without auditory cues hypo-anticipatory scores (the individual is late in his response) (p < 0.05). In addition, the IM assessment with auditory cues was predictive of AIT performance including GPA and all components of the Army Physical Fitness Test and of both the total number of new musculoskeletal injury (MSI) profiles and total profile days for MSIs. Although the R-square was small in each case (R2 ≤ 0.13), these results demonstrate relationships between neuro-cognitive performance as measured by the IM, SoAD/HD, and physical and cognitive performance during AIT. Additional research is recommended on SoAD/HD among Soldiers, training with the IM to reduce attrition and improve cognitive performance among Soldiers at risk for reduced performance during AIT, and the use of IM training to improve physical performance and reduce MSI injuries. 1Interactive Metronome is a registered trademark of Interactive Metronome. 15. SUBJECT TERMS
brain training; cognitive performance; psychomotor performance
16. SECURITY CLASSIFICATION OF: 19a. NAME OF RESPONSIBLE PERSON
Valerie B. Rice a. REPORT
Unclassified b. ABSTRACT
Unclassified c. THIS PAGE
Unclassified
17. LIMITATION OF ABSTRACT
SAR
18. NUMBER OF PAGES
45 19b. TELEPHONE NUMBER (Include area code)
210-221-2007 Standard Form 298 (Rev. 8/98) Prescribed by ANSI Std. Z39.18
iii
Contents
List of Figures v
List of Tables vi
Acknowledgments vii
1. Introduction 1
2. Background 1 2.1 MOS 68W Health Care Specialist AIT ...........................................................................1
2.2 Symptoms of Attention Deficit and Hyperactivity Disorder (SoAD/HD) ......................3
2.3 Interactive Metronome ....................................................................................................5
3. Purpose 7
4. Methods 7 4.1 Self-Assessment Questionnaires .....................................................................................8
4.1.1 General Information Questionnaire.....................................................................8 4.1.2 Barkley and Murphy’s Attention Deficit and Hyperactivity (AD/HD) Scale.....8
4.2 Interactive Metronome ....................................................................................................9
4.3 AIT Performance Measures...........................................................................................10 4.3.1 Grade Point Average (GPA)..............................................................................10 4.3.2 Army Physical Fitness Tests (APFT) Scores ....................................................10 4.3.3 Musculoskeletal Injury Profiles.........................................................................10
4.4 Data Analysis ................................................................................................................11
5. Results 11 5.1 Descriptive Statistics .....................................................................................................11
5.1.1 Barkley and Murphy’s Attention Deficit and Hyperactivity (AD/HD) Scale...12 5.1.2 IM Scores and Definitions of Subscores ...........................................................12 5.1.3 GPA ...................................................................................................................14 5.1.4 APFT Scores......................................................................................................14 5.1.5 Profile Data........................................................................................................15
iv
5.2 Correlations ...................................................................................................................15 5.2.1 Barkley’s SoAD/HD with IM, GPA, APFT, and Injury Data...........................15 5.2.2 IM with GPA and Physical Performance (APFT and Musculoskeletal Profiles
and Profile Days) .............................................................................................16
5.3 Regression Analysis ......................................................................................................17 5.3.1 IM Prediction of SoAD/HD ..............................................................................17 5.3.2 IM Prediction of GPA .......................................................................................17 5.3.3 IM Prediction of APFT......................................................................................18 5.3.4 IM and Profile Data...........................................................................................18 5.3.5 IM and SoAD/HD Scores to Predict GPA ........................................................19 5.3.6 IM and SoAD/HD Scores to Predict APFT.......................................................19 5.3.7 IM and SoAD/HD Scores to Predict Profiles ....................................................20
6. Discussion 21 6.1 SoAD/HD ......................................................................................................................21
6.1.1 SoAD/HD and GPA ..........................................................................................21 6.1.2 SoAD/HD and APFT.........................................................................................22 6.1.3 SoAD/HD and IM Scores..................................................................................23
6.2 IM ..................................................................................................................................24 6.2.1 IM and GPA ......................................................................................................24 6.2.2 IM and APFT.....................................................................................................24 6.2.3 IM and Profile Data...........................................................................................26
6.3 IM and SoAD/HD Combined Predictions.....................................................................27 6.3.1 GPA ...................................................................................................................27 6.3.2 APFT .................................................................................................................27 6.3.3 Profiles...............................................................................................................28
7. Limitations 28
8. Conclusions 29
9. Further Research 30
10. References 32
Acronyms 35
Distribution List 36
v
List of Figures
Figure 1. Health care specialist (courtesy of AMEDDC&S 68W web site)................................. 2 Figure 2. FY 2005 attrition among 68W trainees (Hansen, 2006)................................................. 3 Figure 3. Soldiers performing hand motions during IM assessment. ........................................... 5 Figure 4. Soldiers performing upper extremity clapping timing task with the IM. ....................... 9
vi
List of Tables
Table 1. Symptoms of attention deficit and hyperactivity disorder............................................... 4 Table 2. Symptoms within each category associated with Barkley & Murphy’s attention
deficit and hyperactivity scale. ............................................................................................... 8 Table 3. IM terms and definitions................................................................................................ 10 Table 4. Demographics. ............................................................................................................... 12 Table 5. SoAD/HD descriptive statistics. .................................................................................... 12 Table 6. Task average scores supplied by interactive metronome............................................... 13 Table 7. Task averages of 68W trainees. ..................................................................................... 13 Table 8. Overall APFT scores for men and women (maximum = 300, maximum per
event = 100). ......................................................................................................................... 14 Table 9. Push-up scores for men and women (raw score = number of push-ups in 2 minutes). 14 Table 10. Sit-up scores for men and women (raw score = number of sit-ups in 2 minutes). ..... 14 Table 11. Running times for men and women (raw score = 2-mile run time)............................. 15 Table 12. Correlations between SoAD/HD and IM clapping task without auditory cues
(without C). ........................................................................................................................... 15 Table 13. Correlations between SoAD/HD and final GPA. ........................................................ 16 Table 14. Correlations between scores on the IM clapping task without auditory cues
(without C) and APFT performance (n = 118). .................................................................... 16 Table 15. Correlations between scores on the IM clapping task with auditory cues (with C)
and APFT performance (n = 118). ........................................................................................ 17 Table 16. Correlations between scores on the IM clapping task with auditory cues (with C)
and total profile days during AIT.......................................................................................... 17 Table 17. Regression analysis using IM scores on the clapping task with auditory cues
(with C) to predict GPA. ....................................................................................................... 18 Table 18. Regression analysis using IM scores on the clapping task without auditory cues
(without C) to predict APFT components............................................................................. 18 Table 19. Regression analysis using IM scores on the clapping task with auditory feedback
(CTAF) to predict APFT components. ................................................................................. 19 Table 20. Regression analysis using IM scores on the clapping task with auditory feedback
(CTAF) and SoAD/HD to predict APFT components.......................................................... 20 Table 21. Regression analysis using IM scores on the clapping task with auditory feedback
(CTAF) and SoAD/HD to predict profile components......................................................... 20 Table 22. Number of profiles per Soldier, along with percentages. ............................................ 27
vii
Acknowledgments
The authors express their appreciation to 1SG Edward Oswald, SFC John Haynes, SFC James Harter, Mr. Erwin Kaplan, and the staff of the Noncommissioned Officer Academy for their enthusiastic assistance in the effort to evaluate and improve Soldiers’ academic success. Their offering of technical support, computer use, a testing location, and responsive communication were all essential elements to the execution and completion of this project.
We are also extremely grateful to the 2005-2006 Commander of the 232nd Medical Battalion, LTC Brian Kueter and his Executive Officer, MAJ Roberto Cardenas, for their ongoing support of this research and communication of its importance to their company commanders and first sergeants. Because of the timing and specific data collection requirements, C Company Commander, CPT Eric Swiger and his Company felt the greatest impact and graciously and reliably assisted us. Senior Drill Sergeant, SFC Alan Cotton, and his team of Drill Sergeants “made it happen” by coordinating our access to groups of C Company Soldiers on numerous occasions.
We are indebted to COL Brian Lukey, the previous Chief of Military Operational Medicine, Military Research and Materiel Command for understanding the importance of this research to our medics and those they treat and for acting on his understanding by providing additional funds to expand our original project. Without this funding, we could not have evaluated this new tech-nology or the symptoms associated with attention deficit and hyperactivity disorder among our Soldiers. Many thanks also to COL Richard Agee, former Chief of Staff, U.S. Army Medical Department Center & School (AMEDDC&S) for his vision in recognizing the significance of conducting research to improve the chances for each and every Soldier attending Advanced Initial Training (AIT) at Ft. Sam Houston to succeed. Our gratitude is also extended to the current AMEDDC&S Chief of Staff, COL Joseph Harmon and to the Dean, COL David Maness, for continuing to champion our research. We appreciate the financial and personal support of our multifaceted approach to improving Soldier performance and their dedication to academic excellence.
Finally, we thank the Soldiers who chose to donate their time to this research. They exemplify the Army’s values and exhibited selfless service, especially since this research is not going to help them personally; however, it will help future Soldiers attending Health Care Specialist AIT. Our volunteers knowingly dedicated their time to improve future training of their fellow Soldiers.

viii
INTENTIONALLY LEFT BLANK
1
1. Introduction
This research is part of a series of studies designed to examine factors that impact Soldier per-formance during military occupational specialty (MOS) 68W, Health Care Specialist, Advanced Initial Training (AIT). Specifically, this report is part of a larger project identifying predictors of academic and physical performance in order to design individualized intervention tools to help Soldiers improve their performance while attending AIT1. The portion of the project described in this report examines the relationships between (a) Soldier performance using the Interactive Metronome2 (IM), a new interactive computer technology used to assess neuro cognitive function in terms of auditory and visual input with psycho-motor timing and rhythm output, (b) symptoms of attention deficit and hyperactivity disorder (SoAD/HD)3, and (c) academic and physical performance during MOS 68W AIT.
2. Background
2.1 MOS 68W Health Care Specialist AIT
The Health Care Specialist Program, MOS 68W, is designed
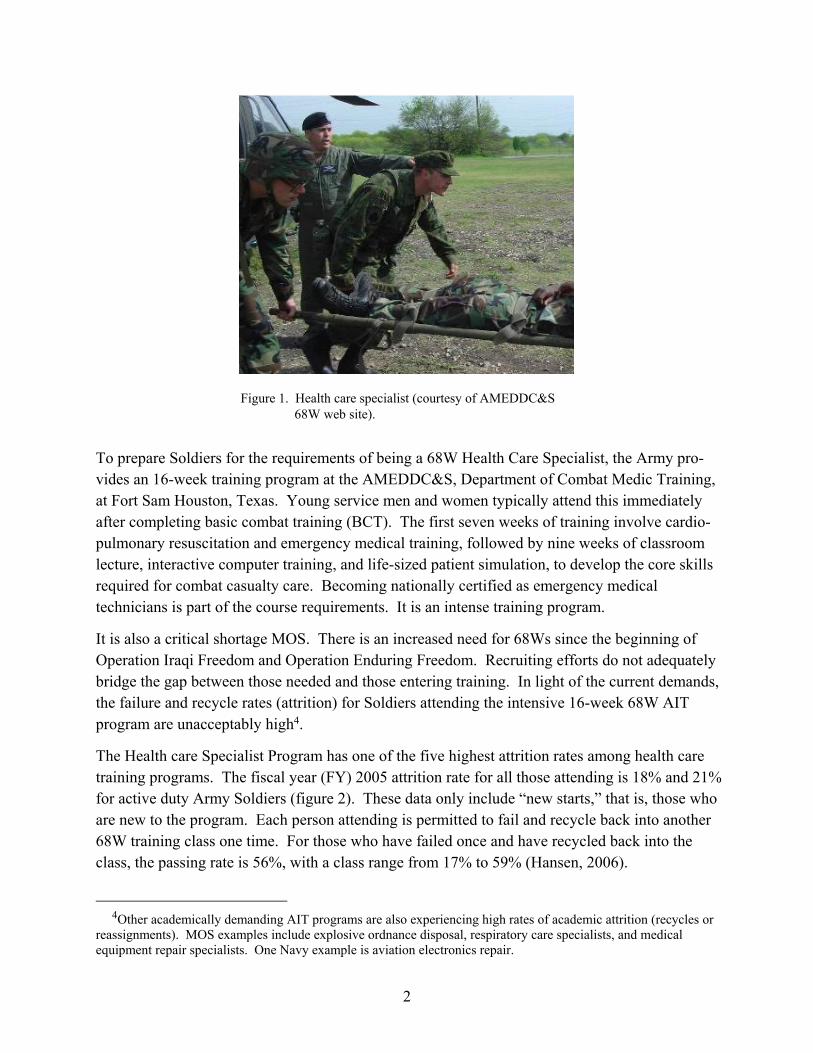
To prepare enlisted personnel to become Soldier medics and (to) provide emergency medical treatment, limited primary care, force health protection and evacuation in a variety of operational and clinical settings from point of injury or illness through the continuum of military health care. The trainee receives specific training in combat and military operations other-than-war casualty care, medical care for patients exposed to weapons of mass destruction, deployable medical systems, aircraft and ground evacuation, and casualty triage and processing. The course trains the requirements of the National Registry certified as an EMT-B. (Courtesy of the U.S. Army Medical Department Center & School [AMEDDC&S] 68W web site.) See figure 1.
1The full research proposal is available upon request. 2Interactive Metronome is a registered trademark of Interactive Metronome. 3In this report, the term Symptoms of Attention Deficit and Hyperactivity Disorder (SoAD/HD) is used to refer
to symptoms of both Attention Deficit Disorder (ADD) and Attention Deficit and Hyperactivity Disorder (ADHD). When distinctions are made, they are clearly identified by type: inattentive or hyperactive-impulsive. A third grouping of symptoms for oppositional defiant disorder (ODD) is also clearly identified, as is the grouping for an overall score for SoAD/HD.
2
Figure 1. Health care specialist (courtesy of AMEDDC&S 68W web site).
To prepare Soldiers for the requirements of being a 68W Health Care Specialist, the Army pro-vides an 16-week training program at the AMEDDC&S, Department of Combat Medic Training, at Fort Sam Houston, Texas. Young service men and women typically attend this immediately after completing basic combat training (BCT). The first seven weeks of training involve cardio-pulmonary resuscitation and emergency medical training, followed by nine weeks of classroom lecture, interactive computer training, and life-sized patient simulation, to develop the core skills required for combat casualty care. Becoming nationally certified as emergency medical technicians is part of the course requirements. It is an intense training program.
It is also a critical shortage MOS. There is an increased need for 68Ws since the beginning of Operation Iraqi Freedom and Operation Enduring Freedom. Recruiting efforts do not adequately bridge the gap between those needed and those entering training. In light of the current demands, the failure and recycle rates (attrition) for Soldiers attending the intensive 16-week 68W AIT program are unacceptably high4.
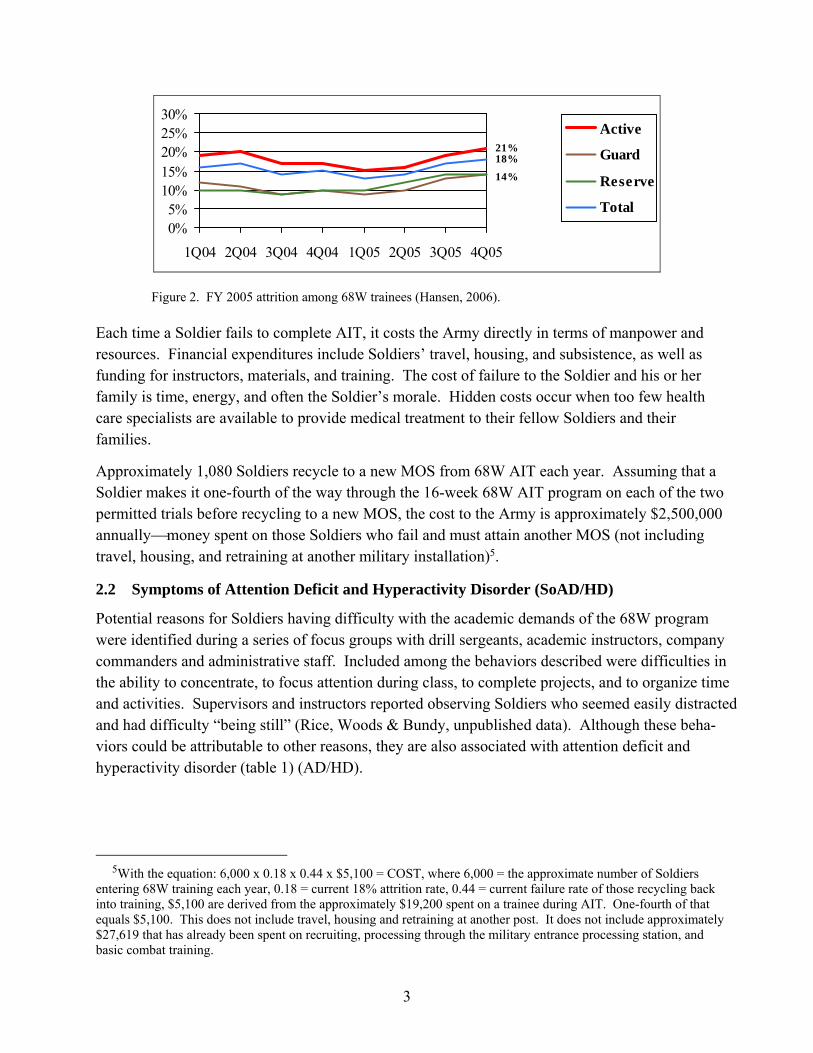
The Health care Specialist Program has one of the five highest attrition rates among health care training programs. The fiscal year (FY) 2005 attrition rate for all those attending is 18% and 21% for active duty Army Soldiers (figure 2). These data only include “new starts,” that is, those who are new to the program. Each person attending is permitted to fail and recycle back into another 68W training class one time. For those who have failed once and have recycled back into the class, the passing rate is 56%, with a class range from 17% to 59% (Hansen, 2006).
4Other academically demanding AIT programs are also experiencing high rates of academic attrition (recycles or
reassignments). MOS examples include explosive ordnance disposal, respiratory care specialists, and medical equipment repair specialists. One Navy example is aviation electronics repair.
3
21%
14%
18%
0%5%
10%15%20%25%30%
1Q04 2Q04 3Q04 4Q04 1Q05 2Q05 3Q05 4Q05
Active
Guard
Reserve
Total
Figure 2. FY 2005 attrition among 68W trainees (Hansen, 2006).
Each time a Soldier fails to complete AIT, it costs the Army directly in terms of manpower and resources. Financial expenditures include Soldiers’ travel, housing, and subsistence, as well as funding for instructors, materials, and training. The cost of failure to the Soldier and his or her family is time, energy, and often the Soldier’s morale. Hidden costs occur when too few health care specialists are available to provide medical treatment to their fellow Soldiers and their families.
Approximately 1,080 Soldiers recycle to a new MOS from 68W AIT each year. Assuming that a Soldier makes it one-fourth of the way through the 16-week 68W AIT program on each of the two permitted trials before recycling to a new MOS, the cost to the Army is approximately $2,500,000 annually⎯money spent on those Soldiers who fail and must attain another MOS (not including travel, housing, and retraining at another military installation)5.
2.2 Symptoms of Attention Deficit and Hyperactivity Disorder (SoAD/HD)
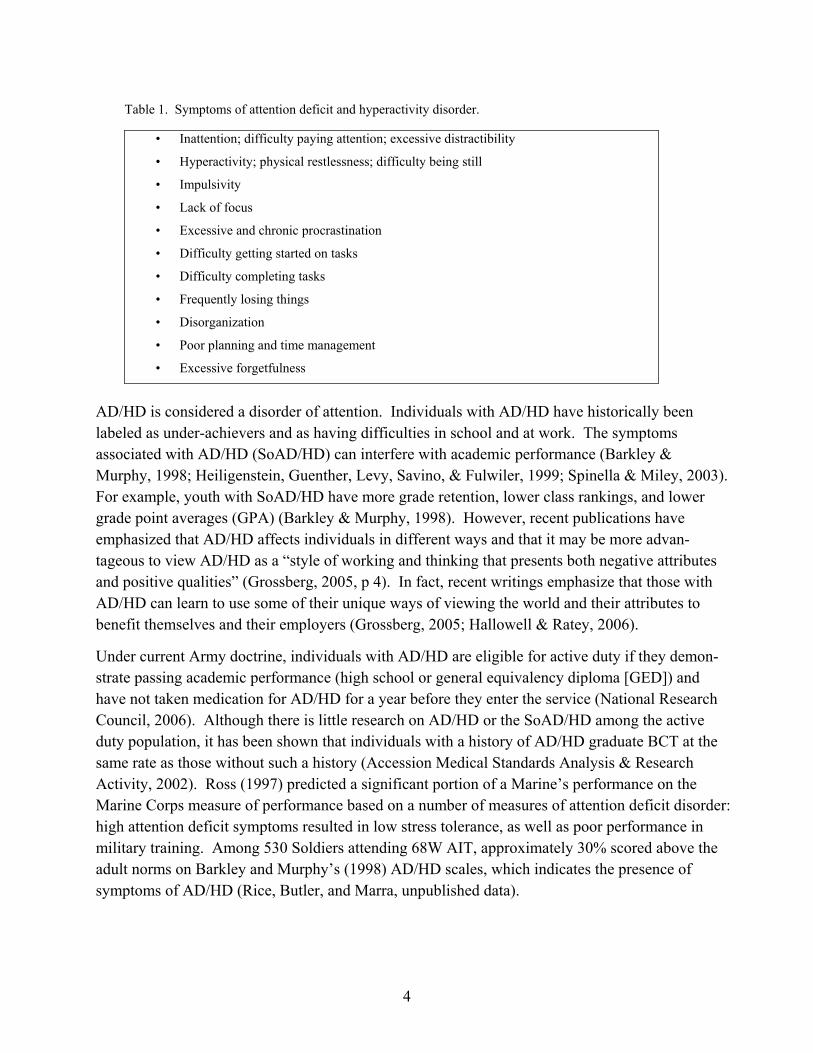
Potential reasons for Soldiers having difficulty with the academic demands of the 68W program were identified during a series of focus groups with drill sergeants, academic instructors, company commanders and administrative staff. Included among the behaviors described were difficulties in the ability to concentrate, to focus attention during class, to complete projects, and to organize time and activities. Supervisors and instructors reported observing Soldiers who seemed easily distracted and had difficulty “being still” (Rice, Woods & Bundy, unpublished data). Although these beha-viors could be attributable to other reasons, they are also associated with attention deficit and hyperactivity disorder (table 1) (AD/HD).
5With the equation: 6,000 x 0.18 x 0.44 x $5,100 = COST, where 6,000 = the approximate number of Soldiers
entering 68W training each year, 0.18 = current 18% attrition rate, 0.44 = current failure rate of those recycling back into training, $5,100 are derived from the approximately $19,200 spent on a trainee during AIT. One-fourth of that equals $5,100. This does not include travel, housing and retraining at another post. It does not include approximately $27,619 that has already been spent on recruiting, processing through the military entrance processing station, and basic combat training.
4
Table 1. Symptoms of attention deficit and hyperactivity disorder.
• Inattention; difficulty paying attention; excessive distractibility
• Hyperactivity; physical restlessness; difficulty being still
• Impulsivity
• Lack of focus
• Excessive and chronic procrastination
• Difficulty getting started on tasks
• Difficulty completing tasks
• Frequently losing things
• Disorganization
• Poor planning and time management
• Excessive forgetfulness
AD/HD is considered a disorder of attention. Individuals with AD/HD have historically been labeled as under-achievers and as having difficulties in school and at work. The symptoms associated with AD/HD (SoAD/HD) can interfere with academic performance (Barkley & Murphy, 1998; Heiligenstein, Guenther, Levy, Savino, & Fulwiler, 1999; Spinella & Miley, 2003). For example, youth with SoAD/HD have more grade retention, lower class rankings, and lower grade point averages (GPA) (Barkley & Murphy, 1998). However, recent publications have emphasized that AD/HD affects individuals in different ways and that it may be more advan-tageous to view AD/HD as a “style of working and thinking that presents both negative attributes and positive qualities” (Grossberg, 2005, p 4). In fact, recent writings emphasize that those with AD/HD can learn to use some of their unique ways of viewing the world and their attributes to benefit themselves and their employers (Grossberg, 2005; Hallowell & Ratey, 2006).
Under current Army doctrine, individuals with AD/HD are eligible for active duty if they demon-strate passing academic performance (high school or general equivalency diploma [GED]) and have not taken medication for AD/HD for a year before they enter the service (National Research Council, 2006). Although there is little research on AD/HD or the SoAD/HD among the active duty population, it has been shown that individuals with a history of AD/HD graduate BCT at the same rate as those without such a history (Accession Medical Standards Analysis & Research Activity, 2002). Ross (1997) predicted a significant portion of a Marine’s performance on the Marine Corps measure of performance based on a number of measures of attention deficit disorder: high attention deficit symptoms resulted in low stress tolerance, as well as poor performance in military training. Among 530 Soldiers attending 68W AIT, approximately 30% scored above the adult norms on Barkley and Murphy’s (1998) AD/HD scales, which indicates the presence of symptoms of AD/HD (Rice, Butler, and Marra, unpublished data).
5
2.3 Interactive Metronome
The IM is an interactive computer technology designed to help individuals develop their internal sense of timing and rhythm. While simple practice of rhythmic movements may improve an individual’s timing and rhythm, it is also thought that training particular areas of the brain can strengthen those neural networks. This “strengthening” would then generalize to other tasks that use those same neural networks in much the same way that strengthening a person’s arms will improve his or her ability to lift, row, and carry.
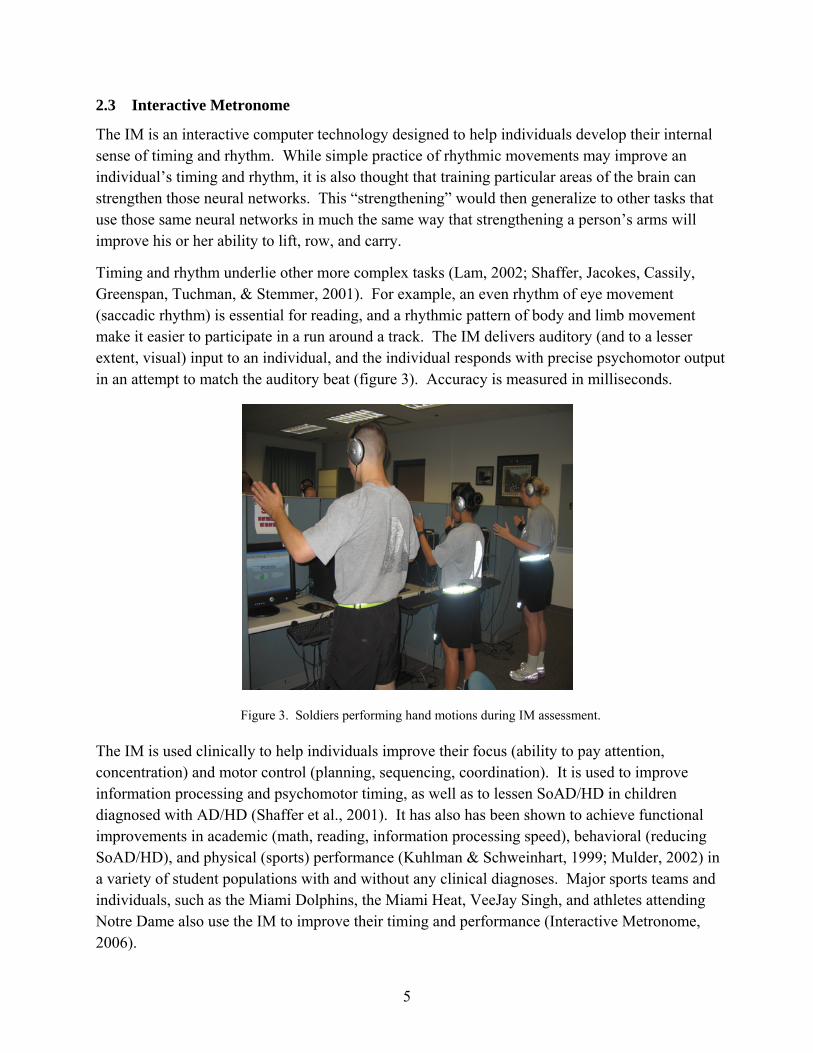
Timing and rhythm underlie other more complex tasks (Lam, 2002; Shaffer, Jacokes, Cassily, Greenspan, Tuchman, & Stemmer, 2001). For example, an even rhythm of eye movement (saccadic rhythm) is essential for reading, and a rhythmic pattern of body and limb movement make it easier to participate in a run around a track. The IM delivers auditory (and to a lesser extent, visual) input to an individual, and the individual responds with precise psychomotor output in an attempt to match the auditory beat (figure 3). Accuracy is measured in milliseconds.
Figure 3. Soldiers performing hand motions during IM assessment.
The IM is used clinically to help individuals improve their focus (ability to pay attention, concentration) and motor control (planning, sequencing, coordination). It is used to improve information processing and psychomotor timing, as well as to lessen SoAD/HD in children diagnosed with AD/HD (Shaffer et al., 2001). It has also has been shown to achieve functional improvements in academic (math, reading, information processing speed), behavioral (reducing SoAD/HD), and physical (sports) performance (Kuhlman & Schweinhart, 1999; Mulder, 2002) in a variety of student populations with and without any clinical diagnoses. Major sports teams and individuals, such as the Miami Dolphins, the Miami Heat, VeeJay Singh, and athletes attending Notre Dame also use the IM to improve their timing and performance (Interactive Metronome, 2006).
6
The theoretical basis for IM training is as follows:
1. Higher level processes, such as organizing and sequencing, depend on an internal sense of timing and rhythm.
2. Exercise of regions of the brain can strengthen the neural networks within those regions, thus leading to improvements in brain function which generalize to other tasks performed by that neural network.
This training also requires an individual to focus attention (both auditory and visual) on a specific task. Each training session slowly increases the time required for a task, thus giving the person feedback (auditory and visual) about accuracy which is only maintained through attentiveness. That is, negative feedback is also given each time the person’s attention wanes. This sequentially increases an individual’s ability to focus attention over time.
The areas of the brain activated during IM use include the pre-frontal region, the cingulated gyrus, basal ganglia, and the medial brain stem. The pre-frontal region of the brain is responsible for planning, sequencing, analysis, decision making, and high-order motor control. The cingulate gyrus allows shifting of attention, the basal ganglia integrates thought and movement, and the medial brain stem is involved in neuro-motor control (Guerra, 2006). Therefore, in theory, specific exercise of those portions of the brain could improve the functions associated with those areas.
It is now known that brain activity can be influenced and improved throughout the life span, that is, a certain level of plasticity remains. It has also been shown that neural networks can be strengthened, and training certain areas of the brain results in generalized improvements when that portion of the brain is used for other tasks (Posner, 2006).
A study conducted at the Naval Aerospace Medical Research Laboratory compared pre- and post-training IM scores by enlisted students on cognitive performance and neural efficiency, as evidenced by factors such as auditory sequencing performance, psychomotor skills, problem solving, visual sequencing, decoding, and divided attention. Although all students did not achieve significant improvement, the researchers found that students with the lowest Armed Services Vocational Aptitude Battery (ASVAB) scores showed significant improvements in the area of visual association memory after 10 sessions of training. Since the greatest achievements were sustained by those individuals with the lowest initial scores, they concluded that students with the lowest aptitudes (those at greatest risk) may benefit most from IM training (Fatolitis, Ekenna-Kalu, & Momen, unpublished).
7
3. Purpose
In order to graduate from AIT, Soldiers must achieve passing scores on their academic class work, skills tests, and the Army Physical Fitness Test. Required underlying capabilities (among others) include the ability to concentrate and focus attention, to organize and prioritize, and to perform complex motor skills. Since IM training has been found to improve academic and physical per-formance (for those with and without disabilities) and to assist in improving attention among youth with AD/HD, it was felt that similar training might assist Soldiers attending demanding AIT. However, since no research has examined IM performance among young adults, more information was necessary before such a training effort was initiated. Therefore, the focus of this research effort was to identify the presence or absence of SoAD/HD among a population of Soldiers attending 68W AIT and to examine the relationship between SoAD/HD, scores on the IM screening assessment, and AIT performance (GPA and physical fitness).
4. Methods
All participants were Soldiers in the 232nd Medical Brigade, C Company, attending 68W AIT. Since this study was a subsidiary of a larger study, all participants read and completed a consent form for entire study before their participation. The consent form included information about this portion of the study, specifically describing IM testing.
A random sample of 68W Soldiers (n = 108) who volunteered for all portions of the study were selected for IM testing. Although a sufficient n was obtained for the IM portion of the study, 15 additional Soldiers who were part of the overall study and had scores above the adult norm on Barkley and Murphy’s Attention Deficit and Hyperactivity Scale6 were invited to perform the IM testing (see section 4.1.2 for a description of this scale). These Soldiers were invited to join the IM sample in order to match the 30% incidence of higher–than-adult-norm SoAD/HD occurring in the larger study population (n = 560). The final number of soldiers who completed this study was n = 107+15 = 122.
Participants completed two self-assessment questionnaires during the first two weeks of the 68W course, which included information about demographics and SoAD/HD. IM testing occurred approximately 5 weeks into the course during time normally dedicated to physical training. Each Soldier spent approximately 2 hours participating in the evaluations, 1 hour for the questionnaire and 1 hour for the IM evaluation.
6An individual who scores above the adult norm has more symptoms associated with AD/HD than the “average” adult.
8
Participating Soldiers’ GPA, physical fitness scores, and information about musculoskeletal injuries were obtained from unit records upon completion of the course. Only two Soldiers participating in this study failed the course.
4.1 Self-Assessment Questionnaires
4.1.1 General Information Questionnaire
This self-report questionnaire includes demographic and general information. It contains gender, age, marital status, race, military component, level of education, overall high school GPA, and GPA for high-school science courses. All responses were by self-report.
4.1.2 Barkley and Murphy’s Attention Deficit and Hyperactivity (AD/HD) Scale
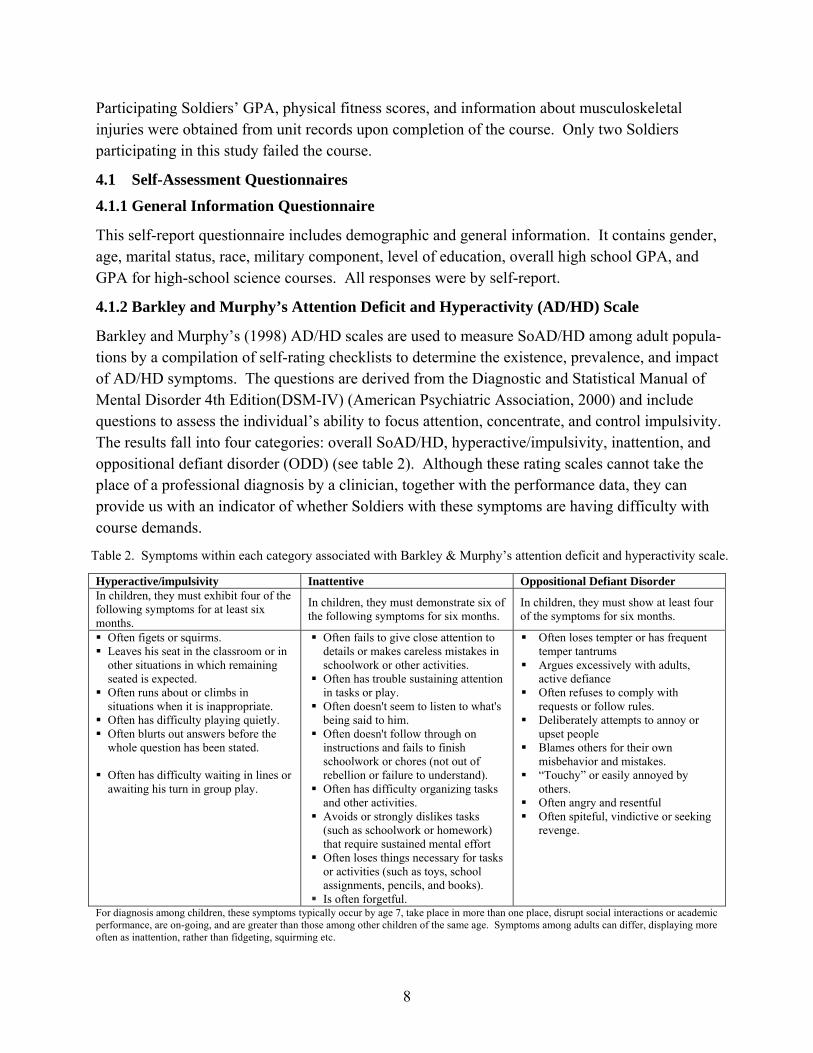
Barkley and Murphy’s (1998) AD/HD scales are used to measure SoAD/HD among adult popula-tions by a compilation of self-rating checklists to determine the existence, prevalence, and impact of AD/HD symptoms. The questions are derived from the Diagnostic and Statistical Manual of Mental Disorder 4th Edition(DSM-IV) (American Psychiatric Association, 2000) and include questions to assess the individual’s ability to focus attention, concentrate, and control impulsivity. The results fall into four categories: overall SoAD/HD, hyperactive/impulsivity, inattention, and oppositional defiant disorder (ODD) (see table 2). Although these rating scales cannot take the place of a professional diagnosis by a clinician, together with the performance data, they can provide us with an indicator of whether Soldiers with these symptoms are having difficulty with course demands.
Table 2. Symptoms within each category associated with Barkley & Murphy’s attention deficit and hyperactivity scale.
Hyperactive/impulsivity Inattentive Oppositional Defiant Disorder In children, they must exhibit four of the following symptoms for at least six months.
In children, they must demonstrate six of the following symptoms for six months.
In children, they must show at least four of the symptoms for six months.
Often figets or squirms. Leaves his seat in the classroom or in
other situations in which remaining seated is expected.
Often runs about or climbs in situations when it is inappropriate.
Often has difficulty playing quietly. Often blurts out answers before the
whole question has been stated. Often has difficulty waiting in lines or
awaiting his turn in group play.
Often fails to give close attention to details or makes careless mistakes in schoolwork or other activities.
Often has trouble sustaining attention in tasks or play.
Often doesn't seem to listen to what's being said to him.
Often doesn't follow through on instructions and fails to finish schoolwork or chores (not out of rebellion or failure to understand).
Often has difficulty organizing tasks and other activities.
Avoids or strongly dislikes tasks (such as schoolwork or homework) that require sustained mental effort
Often loses things necessary for tasks or activities (such as toys, school assignments, pencils, and books).
Is often forgetful.
Often loses tempter or has frequent temper tantrums
Argues excessively with adults, active defiance
Often refuses to comply with requests or follow rules.
Deliberately attempts to annoy or upset people
Blames others for their own misbehavior and mistakes.
“Touchy” or easily annoyed by others.
Often angry and resentful Often spiteful, vindictive or seeking
revenge.
For diagnosis among children, these symptoms typically occur by age 7, take place in more than one place, disrupt social interactions or academic performance, are on-going, and are greater than those among other children of the same age. Symptoms among adults can differ, displaying more often as inattention, rather than fidgeting, squirming etc.
9
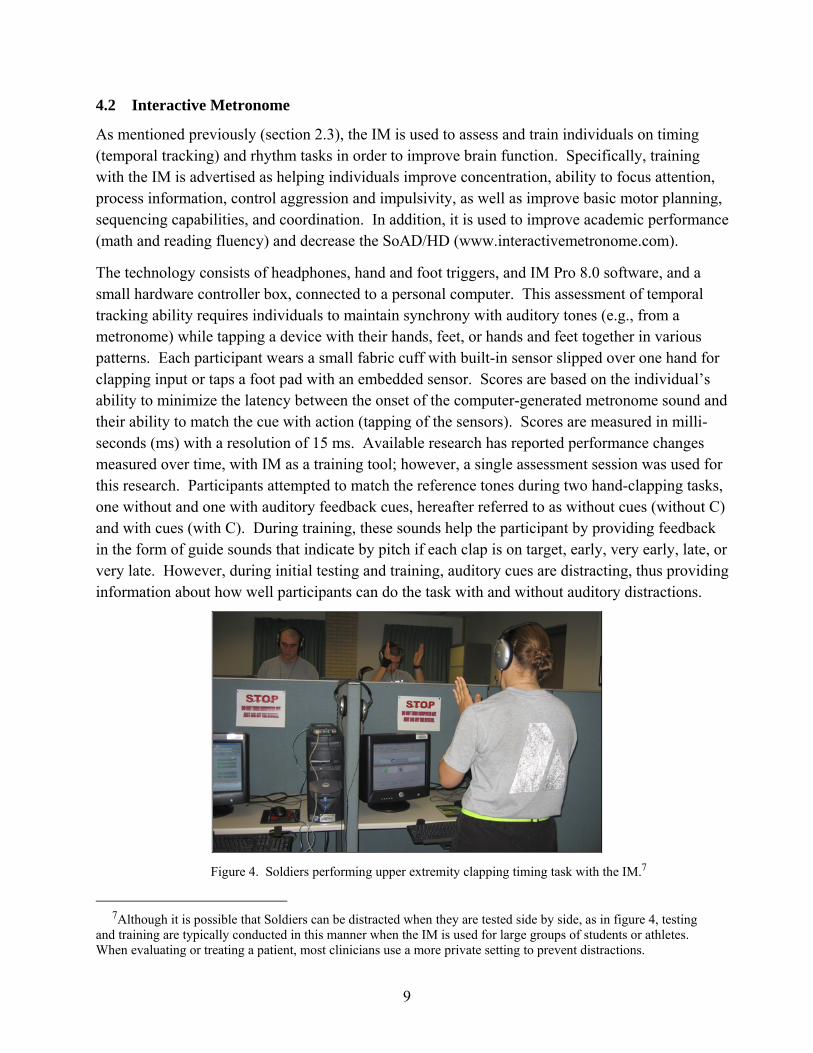
4.2 Interactive Metronome
As mentioned previously (section 2.3), the IM is used to assess and train individuals on timing (temporal tracking) and rhythm tasks in order to improve brain function. Specifically, training with the IM is advertised as helping individuals improve concentration, ability to focus attention, process information, control aggression and impulsivity, as well as improve basic motor planning, sequencing capabilities, and coordination. In addition, it is used to improve academic performance (math and reading fluency) and decrease the SoAD/HD (www.interactivemetronome.com).
The technology consists of headphones, hand and foot triggers, and IM Pro 8.0 software, and a small hardware controller box, connected to a personal computer. This assessment of temporal tracking ability requires individuals to maintain synchrony with auditory tones (e.g., from a metronome) while tapping a device with their hands, feet, or hands and feet together in various patterns. Each participant wears a small fabric cuff with built-in sensor slipped over one hand for clapping input or taps a foot pad with an embedded sensor. Scores are based on the individual’s ability to minimize the latency between the onset of the computer-generated metronome sound and their ability to match the cue with action (tapping of the sensors). Scores are measured in milli-seconds (ms) with a resolution of 15 ms. Available research has reported performance changes measured over time, with IM as a training tool; however, a single assessment session was used for this research. Participants attempted to match the reference tones during two hand-clapping tasks, one without and one with auditory feedback cues, hereafter referred to as without cues (without C) and with cues (with C). During training, these sounds help the participant by providing feedback in the form of guide sounds that indicate by pitch if each clap is on target, early, very early, late, or very late. However, during initial testing and training, auditory cues are distracting, thus providing information about how well participants can do the task with and without auditory distractions.
Figure 4. Soldiers performing upper extremity clapping timing task with the IM.7
7Although it is possible that Soldiers can be distracted when they are tested side by side, as in figure 4, testing
and training are typically conducted in this manner when the IM is used for large groups of students or athletes. When evaluating or treating a patient, most clinicians use a more private setting to prevent distractions.
10
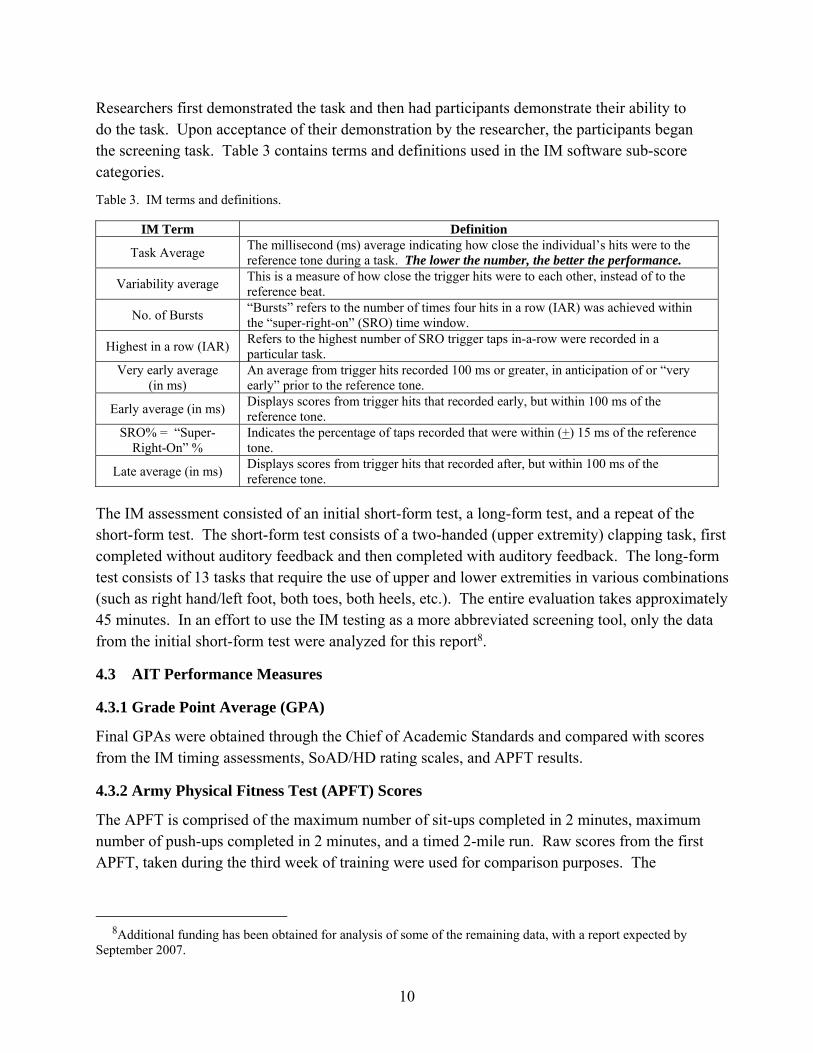
Researchers first demonstrated the task and then had participants demonstrate their ability to do the task. Upon acceptance of their demonstration by the researcher, the participants began the screening task. Table 3 contains terms and definitions used in the IM software sub-score categories.
Table 3. IM terms and definitions.
IM Term Definition
Task Average The millisecond (ms) average indicating how close the individual’s hits were to the reference tone during a task. The lower the number, the better the performance.
Variability average This is a measure of how close the trigger hits were to each other, instead of to the reference beat.
No. of Bursts “Bursts” refers to the number of times four hits in a row (IAR) was achieved within the “super-right-on” (SRO) time window.
Highest in a row (IAR) Refers to the highest number of SRO trigger taps in-a-row were recorded in a particular task.
Very early average (in ms)
An average from trigger hits recorded 100 ms or greater, in anticipation of or “very early” prior to the reference tone.
Early average (in ms) Displays scores from trigger hits that recorded early, but within 100 ms of the reference tone.
SRO% = “Super-Right-On” %
Indicates the percentage of taps recorded that were within (+) 15 ms of the reference tone.
Late average (in ms) Displays scores from trigger hits that recorded after, but within 100 ms of the reference tone.
The IM assessment consisted of an initial short-form test, a long-form test, and a repeat of the short-form test. The short-form test consists of a two-handed (upper extremity) clapping task, first completed without auditory feedback and then completed with auditory feedback. The long-form test consists of 13 tasks that require the use of upper and lower extremities in various combinations (such as right hand/left foot, both toes, both heels, etc.). The entire evaluation takes approximately 45 minutes. In an effort to use the IM testing as a more abbreviated screening tool, only the data from the initial short-form test were analyzed for this report8.
4.3 AIT Performance Measures
4.3.1 Grade Point Average (GPA)
Final GPAs were obtained through the Chief of Academic Standards and compared with scores from the IM timing assessments, SoAD/HD rating scales, and APFT results.
4.3.2 Army Physical Fitness Test (APFT) Scores
The APFT is comprised of the maximum number of sit-ups completed in 2 minutes, maximum number of push-ups completed in 2 minutes, and a timed 2-mile run. Raw scores from the first APFT, taken during the third week of training were used for comparison purposes. The
8Additional funding has been obtained for analysis of some of the remaining data, with a report expected by
September 2007.
11
maximum possible score for all three events is 300. This score was used for the “overall” APFT score.
4.3.3 Musculoskeletal Injury Profiles
As a second measure of physical performance, we decided to measure musculoskeletal injuries in terms of “profiles”. Musculoskeletal injury profiles are limited duty assignments that restrict a Soldiers’ physical performance in order to allow for healing of an existing injury, such as a sprain or strain. Musculoskeletal profile data were recorded, tracked, and supplied by company command staff. These data were recorded in the number of new profiles per Soldier, as well as the total number of days on profile. As defined for this study, “new” profiles refer to musculoskeletal injuries that have occurred for the first time during 68W AIT and for which a Soldier sought medical care.
4.4 Data Analysis
The Statistical Package for Social Sciences (SPSS9 for Windows, Rel. 12.0.0. 2003) was used for all data analysis. Analysis included basic descriptive data of the population and their test scores. Pearson correlation coefficients (Levin, 1977) were used to examine the relationships between SoAD/HD and IM screening scores, SoAD/HD and performance measures (GPA, APFT, and musculoskeletal profiles), and IM screening scores and performance measures (GPA, APFT, and musculoskeletal profiles). A step-wise (backwards) regression (Hair, Anderson, Tatham, & Black, 1998) was used to examine the IM as a screening tool to predict SoAD/HD. A step-wise (back-wards) regression was also used to examine the ability of the SoAD/HD and IM screening scores to predict 68W AIT performance (GPA, APFT, and musculoskeletal profiles). A p-value of 0.05 was used to determine significance levels. However, since the IM is a new technology and only task average (TA) has been reported in the open literature, all scoring categories were reported and those findings that were deemed “marginal” (p = 0.05 to 0.06) were also reported (table 3 contains a description of each score).
5. Results
5.1 Descriptive Statistics
Table 4 describes the group of 68W Soldiers who participated in the IM evaluation (n = 122).
9SPSS is a registered trademark of SPSS, Inc., Chicago, IL.
12
Table 4. Demographics*.
Marital Status No. Percent Military Component No. Percent Married 11 9.0 Active Army 81 66.4 Divorced 2 1.6 Army Reserve 17 13.9 Living with Partner 4 3.3 Army National Guard 24 19.7 Single 103 84.4 Total 122 100 Separated 2 1.6 Education Total 122 100 GED 3 2.5 Gender High School Diploma 80 65.6 Male 67 54.9 Some college, no degree 29 23.8 Female 55 45.1 Associate's degree 3 2.5 Total 122 100 Bachelor's degree 7 5.7 Ethnicity/Race Total 122 100 Hispanic 13 10.7 High School (HS) Science Grades Caucasian 85 69.7 Above Average 62 50.8 Asian 7 5.7 Average 47 38.5 African American 9 7.4 Below Average 12 9.8 Native American 1 0.8 Failing 0 0 Other 1 0.8 Did Not Report 1 0.8 Did not report race 6 4.9 Total 122 100 Total 122 100 HS Final Grades Age Group Above Average 60 49.2 17-19 71 58.2 Average 51 41.8 20-24 23 18.9 Below Average 9 7.4 25-29 8 6.6 Failing 1 0.8 >=30 3 2.5 Did Not Report 1 0.8 Did not report age 17 13.9 Total 122 100 Total 122 100 *Totals (%) not reaching exactly 100 are attributable to rounding.
5.1.1 Barkley and Murphy’s Attention Deficit and Hyperactivity (AD/HD) Scale
Scores on Barkley and Murphy’s AD/HD scale that are above the adult norm indicate SoAD/HD but not a diagnosis of AD/HD. Those who score above the norm may benefit from further self-evaluation or referral to a medical professional for additional screening (table 5).
5.1.2 IM Scores and Definitions of Subscores
TA is the subscore most commonly assessed and reported in existing IM research. The norms below have been supplied by IM according to their Certified Provider Basic Training Course and Resource Binder (2004) (table 6). These results are not limited to the short, two-part test (clapping with and without auditory feedback) but are a compilation of both the short, two-part test and a longer multiple construct assessment. However, representatives from the company that created and maintain the IM recommend using these TAs for comparison purposes with other populations since no other comparison scores are available. The TA results for the 68W trainees are shown in table 7. At this time, IM does not publish percentages achieved by the population, such as the percentage achieving superior, exceptional, etc.
13
Table 5. SoAD/HD descriptive statistics*.
Overall SoAD/HD Scores No. Percent Below Adult Norm 77 63.1 Above Adult Norm 43 35.2 Missing 2 1.6 Total 122 100
Inattention Sub score Below Adult Norm 108 88.5 Above Adult Norm 12 9.8 Missing 2 1.6 Total 122 100
Hyperactive-Impulsive Sub score Below Adult Norm 105 86.1 Above Adult Norm 15 12.3 Missing 2 1.6 Total 122 100
ODD Sub score Below Adult Norm 102 82.8 Above Adult Norm 18 15.6 Missing 2 1.6 Total 122 100
*Totals (%) not reaching exactly 100 are attributable to rounding.
Table 6. Task average scores supplied by interactive metronome.
Task Average Levels Score (in ms)
Superior Under 22 Exceptional 22 to 29 Above Average 30 to 40 Average 41 to 69 Below Average 70 to 146 Severe Deficiency 147 to 199
Table 7. Task averages of 68W trainees.
Without Auditory Cues No. Percent Superior 2 1.6 Exceptional 9 7.4 Above Average 22 18 Average 49 40.2 Below Average 30 24.6 Severe Deficiency 10 8.2
With Auditory Cues Superior 2 1.6 Exceptional 8 6.6 Above Average 14 11.5 Average 32 26.2 Below Average 50 41 Severe Deficiency 16 13.1
14
5.1.3 GPA
The GPA mean was 85.77% (+5.41 standard deviation (SD); range 64 to 97). For men, it was 86.25% (+4.74 SD; range 76 to 97) and for women 85.18% (+6.11 SD; range 64 to 97).
5.1.4 APFT Scores
APFT scores are shown in tables 8 through ll.
Table 8. Overall APFT scores for men and women (maximum = 300, maximum per event = 100).
Men Mean SD Range Ages 17-19 229.03 29.23 167-277
20-24 231.62 25.95 196-285 25-29 226.60 8.76 213-237 >=30 192 8.48 186-198
Women Mean SD Range Ages 17-19 232.38 38.02 141-295
20-24 238.44 33.68 175-281 25-29 252.67 30.00 223-283 >=30 245.00 n = 1 245-245
Table 9. Push-up scores for men and women (raw score = number of push-ups in 2 minutes).
Men Mean SD Range Ages 17-19 51.60 8.04 25-66
20-24 52.15 7.52 42-64 25-29 47.80 3.83 43-52 >=30 36.50 6.36 32-41
Women Mean SD Range Ages 17-19 34.32 11.28 15-71
20-24 34.56 13.90 20-62 25-29 33.67 13.86 22-49 >=30 40.00 n = 1 40-40
Table 10. Sit-up scores for men and women (raw score = number of sit-ups in 2 minutes).
Men Mean SD Range Ages 17-19 67.80 8.94 52-87
20-24 67.23 7.54 56-78 25-29 64.60 9.09 57-79 >=30 49.50 3.53 47-52
Women Mean SD Range Ages 17-19 63.26 9.86 39-84
20-24 66.78 9.37 52-80 25-29 66.33 6.02 60-72 >=30 59.00 n = 1 59-59
15
Table 11. Running times for men and women (raw score = 2-mile run time).
Men Mean SD Range Ages 17-19 14.67 1.52 12.10-19.37
20-24 14.67 1.04 12.55-19.37 25-29 15.11 .745 14.26-16.20 >=30 17.23 .134 17.14-17.33
Women Mean SD Range Ages 17-19 17.65 2.32 13.59-27.10
20-24 17.71 1.11 15.46-19.42 25-29 15.86 2.16 13.36-17.18 >=30 17.49 n = 1 17.49-17.49
5.1.5 Profile Data
The mean number of new musculoskeletal profiles per person was 1.85 ±1.54, range: 1 to 7. The mean number of days on profile, per profile, was 21.94 ±25.00, range: 3 to 125.
5.2 Correlations
Only significant findings are included in the correlation data.10
5.2.1 Barkley’s SoAD/HD with IM, GPA, APFT, and Injury Data
Soldiers with higher self-rated SoAD/HD, both overall and in the area of inattention, attained IM scores that fell into the category of very late average (VLA) on the IM clapping task without auditory cues (p < 0.05, table 12).
Table 12. Correlations between SoAD/HD and IM clapping task without auditory cues (without C).
Overall Score r p value DF Very Late Average 0.188 0.039 121
Inattention r p value DF Very Late Average 0.327 0.000 121
Only one of the four categories of SoAD/HD was correlated with AIT performance. Soldiers with higher self-rated SoAD/HD in the area of ODD had lower GPAs (p < 0.05, table 13)11. No corre-lations were found between SoAD/HD and physical performance, either on the APFT or for sustaining musculoskeletal injuries.
10No data are presented for the relationships between GPA and APFT since this was not relevant to the hypotheses. 11Consequential analysis of data with 579 AIT Soldiers (in a separate study) revealed correlations between GPA
and SoAD/HD overall (r = -0.11, p = 0.008), subtype inattentive (r = -0.13, p = 0.002), and ODD (r = 0.10, p = 0.016) (Rice et al., unpublished data).
16
Table 13. Correlations between SoAD/HD and final GPA.
SoAD/HD r p value DF
ODD -0.199 0.029 119
5.2.2 IM with GPA and Physical Performance (APFT and Musculoskeletal Profiles and Profile Days)
No significant correlations were found between Soldiers IM screening results and final GPA. A number of correlations were found between IM scores and physical performance on the APFT (table 14; see table 3 for acronyms and explanations of evaluative measures). For the IM without C, Soldiers with higher very early (VE) averages performed fewer push-ups. Those with high TAs, high variability, higher VE and VLAs performed fewer sit-ups. There was a positive correlation between highest IAR and sit-ups, as well as between SRO% and sit-ups. That is, those with higher IAR and SRO% scores also achieved a higher numbers of sit-ups.
Table 14. Correlations between scores on the IM clapping task without auditory cues (without C) and APFT performance (n = 118).12
Push-ups r p value Very Early Average -1.84 0.46
Sit-ups Task Average -0.187 0.04 Variability -0.185 0.045 Highest IAR 0.244 0.008 Very Early Average -0.206 0.025 SRO % 0.193 0.036 Very Late Average -0.217 0.018
The IM with auditory cues (with C) scores showed that Soldiers with higher TAs and VE averages performed fewer push-ups, while a higher number of bursts, highest IAR and SRO% were asso-ciated with performing a greater number of push-ups (table 15). A higher TA was also associated with performance of fewer sit-ups, and a higher SRO% was associated with performing a greater number of sit-ups (table 15).
No significant findings were seen between the IM clapping task without C and the number of profiles or total profiles days experienced by Soldiers during AIT. Soldiers with a higher SRO% score for the IM clapping task with C spent fewer days on profile (table 16).
12All rows in tables with IM data are sequenced in accordance with the description of IM scores seen in table 16.
17
Table 15. Correlations between scores on the IM clapping task with auditory cues (with C) and APFT performance (n = 118).
Push-ups r p-value Task Average -0.259 0.005 No. of Bursts 0.189 0.040 Highest IAR 0.246 0.007 Very Early Average -0.194 0.036 SRO % 0.297 0.001
Sit-ups r p-value Task Average -0.233 0.011 SRO % 0.188 0.041
Run Time r p-value Highest IAR -0.222 0.016 SRO% -0.217 0.018
Overall Score r p-value SRO% 0.211 0.022
Table 16. Correlations between scores on the IM clapping task with auditory cues (with C) and total profile days during AIT.
Total Days in Profile r p-value DF
SRO% -0.183 0.044 121
5.3 Regression Analysis
5.3.1 IM Prediction of SoAD/HD
Two IM sub scores on the clapping task without C predicted 13.3% of the variance (R2 = 0.133) on SoAD/HD Inattention: VLA (β = 0.34, t(109) = 3.94, p < .01) and Number of Bursts (β = 0.16, t(109) = 1.89, p >.05). With only the sub-score that reached statistical significance, this means that for every one point increase in VLA, there was a 0.02 increase in SoAD/HD Inattention score.
VLA on the IM without C was also predictive of overall SoAD/HD, accounting for 3.6% of the variance (R2 = 0.036; β = 0.188, t(109) = 2.085, p < .05). This means that for every one point increase in VLA, the increase in overall SoAD/HD is 0.02.
None of the IM with C scores was a significant predictor of SoAD/HD scores.
5.3.2 IM Prediction of GPA
The IM scores on the clapping task without C were not predictive of GPA. However, IM scores with Cs were predictive of GPA, with four sub-score items accounting for 10.7% of the variance (R2 = .107, table 17).
18
Table 17. Regression analysis using IM scores on the clapping task with auditory cues (with C) to predict GPA.
Un-standardized coefficients
Standardized coefficients
Predictive Variable
B Standard Error
Beta
t
sig
Constant 92.543 1.933 47.874 0.000 Task Average -.039 0.013 -0.399 -3.047 0.003 Highest IAR -.934 0.309 -0.344 -3.024 0.003 Late Average -.083 0.033 -0.252 -2.491 0.014 Very Late Average 0.013 0.007 0.225 1.976 0.051
5.3.3 IM Prediction of APFT
IM sub-scores on both the clapping task without C and the clapping task with Cs were predictive of components of the APFT. On the clapping task without C, two IM sub-scores, average of early and average of late beats, were negative predictors of the number of push-ups and number of sit-ups achieved, accounting for 6.3% and 10.1% of the variance, respectively (table 18).
Table 18. Regression analysis using IM scores on the clapping task without auditory cues (without C) to predict APFT components.
Un-standardized coefficients
Standardized coefficients
Predictive Variable
B Standard Error
Beta
t
sig
Push-ups Constant 59.578 5.588 10.662 0.000 Early Average -0.238 0.098 -0.225 -2.424 0.017 Late Average -0.177 0.094 -0.175 -1.883 0.06* Sit-ups Constant 78.915 4.064 19.420 0.000 Early Average -0.188 0.071 -0.239 -2.634 0.010 Late Average -0.206 0.068 -0.273 -3.005 0.003
*marginal
SRO% on the clapping task with C was found to be a positive predictor of number of push-ups, accounting for 8.8% of the variance. TA, VE average, and LA were negative predictors, while variability was a positive predictor for sit-ups, accounting for 12.6% of the variance. Early average and SRO% were both negative predictors of run time, accounting for 7.3% of the variance. SRO% was a positive predictor of overall APFT score, accounting for 4.5% of the variance (table 19).
5.3.4 IM and Profile Data
Four sub-scale items on the IM clapping task with C predicted the number of profiles per person, accounting for 9.9% of the variance (R2 = 0.099); however, only three reached statistical signifi-cance. All four were negative predictors of profile days: TA (ß = -0.229, t(111) = -1.7, p > .05), SRO% (ß = -0.571, t(111) = -3.028, p < .01), early average (ß = -0.342, t(111) = -2.350, p < .05),
19
and LA (ß = -0.266, t(111) = -2.775, p < .01). For every one-point increase in early average, there is a decrease of 0.02 total number of profiles during AIT. The results are similar for SRO% (-0.04) and LA (-0.02).
Table 19. Regression analysis using IM scores on the clapping task with auditory feedback (CTAF) to predict APFT components.
Un-standardized coefficients
Standardized coefficients
Predictive Variable
B Standard Error
Beta
t
sig
Push-ups Constant 40.111 1.787 22.446 0.000 SRO % 0.290 0.087 0.297 3.347 0.001 Sit-ups Constant 73.339 2.720 26.967 0.000 Task Average -0.084 0.025 -0.466 -3.329 0.001 Variability 0.195 0.073 0.524 2.656 0.009 Very Early Average -0.054 0.027 -0.303 -1.973 0.051* Late Average -0.121 0.056 -0.201 -2.163 0.033 Run Time Constant 18.661 1.257 14.848 0.000 Early Average -0.034 0.019 -0.243 -1.805 0.074 SRO % -0.065 0.022 -0.398 -2.960 0.004 APFT Score Constant 225.068 4.670 48.194 0.000 SRO % 0.528 0.227 0.211 2.327 0.022
SRO% with C was correlated with the total number of profile days (-0.18, p = 0.04). Two scores on the IM clapping task with C were negatively predictive of total days on profile, accounting for 5.7% of the variance (R2 = 0.057): SRO% (ß = -0.189, t(111) = -2.118, p < .05) and LA (ß = -0.153, t(111) = -1.72, p > .01).
5.3.5 IM and SoAD/HD Scores to Predict GPA
When combining IM and SoAD/HD to predict performance, only ODD was a significant predictor, accounting for only about 4% of the variance (R2 = 0.037, ß = -0.217, t(114) = -2.091, p = .039).
5.3.6 IM and SoAD/HD Scores to Predict APFT
Table 20 shows the results for the combination of IM scores and SoAD/HD that were predictive of the APFT scores. ODD and LA with Cs were predictive of push-ups (R2 = 0.073) and sit-ups (R2 = 0.096). The overall SoAD/HD score was predictive of run time (R2 = 0.074), and no predictors were significant for predicting the overall APFT score.
20
Table 20. Regression analysis using IM scores on the clapping task with auditory feedback (CTAF) and SoAD/HD to predict APFT components.
Un-standardized coefficients
Standardized coefficients
Predictive Variable
B Standard Error
Beta
t
sig
Push-ups Constant 76.097 4.019 22.166 0.000 ODD - 0.880 0.349 -0.232 3.347 0.013 Late Average 0.282 0.141 0.183 1.997 0.048 Sit-ups Constant 79.863 3.712 21.515 0.000 ODD -0.902 0.336 -0.241 -2.689 0.008 Late Average 0.425 0.213 0.179 2.000 0.048 Run Time Constant 83.586 4.516 18.508 0.000 Overall SoAD/HD -0.537 0.178 -0.272 -3.015 0.003 APFT Score
No Significant Predictors
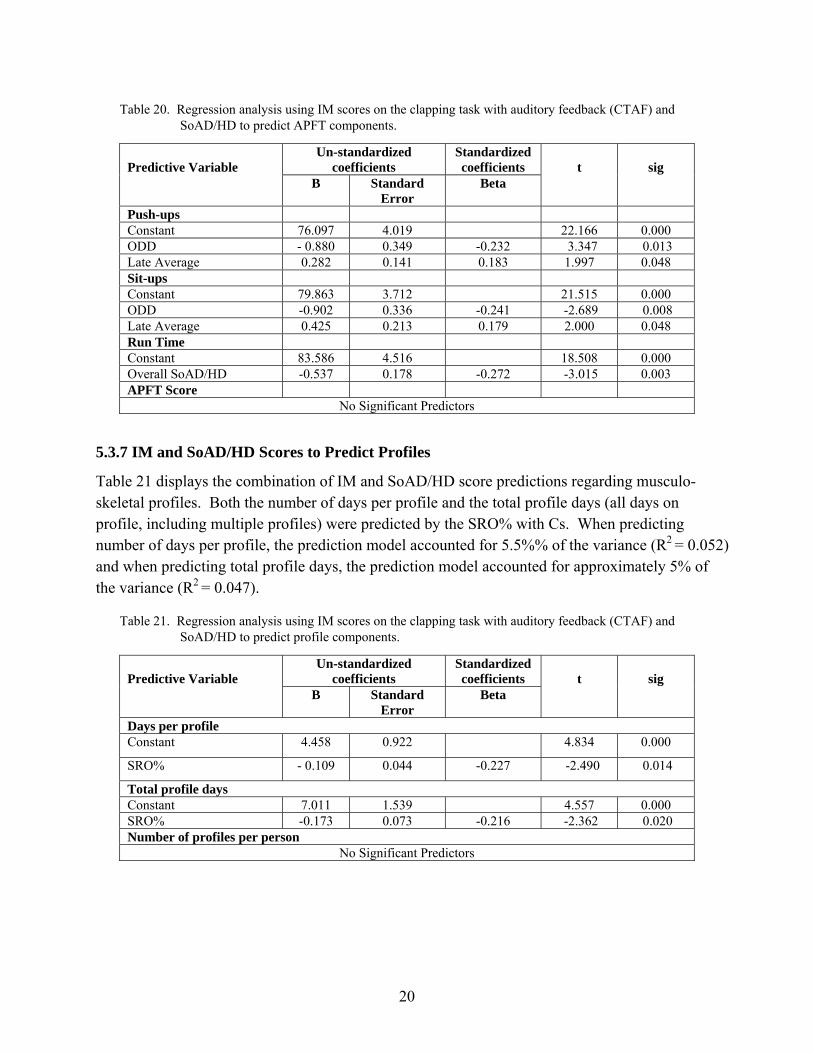
5.3.7 IM and SoAD/HD Scores to Predict Profiles
Table 21 displays the combination of IM and SoAD/HD score predictions regarding musculo-skeletal profiles. Both the number of days per profile and the total profile days (all days on profile, including multiple profiles) were predicted by the SRO% with Cs. When predicting number of days per profile, the prediction model accounted for 5.5%% of the variance (R2 = 0.052) and when predicting total profile days, the prediction model accounted for approximately 5% of the variance (R2 = 0.047).
Table 21. Regression analysis using IM scores on the clapping task with auditory feedback (CTAF) and SoAD/HD to predict profile components.
Un-standardized coefficients
Standardized coefficients
Predictive Variable
B Standard Error
Beta
t
sig
Days per profile Constant 4.458 0.922 4.834 0.000
SRO% - 0.109 0.044 -0.227 -2.490 0.014
Total profile days Constant 7.011 1.539 4.557 0.000 SRO% -0.173 0.073 -0.216 -2.362 0.020 Number of profiles per person
No Significant Predictors
21
6. Discussion
As seen in the results section, Soldiers participating in this study were primarily single, Caucasian, between the ages of 17 and 19, and active duty Army. The majority reported average or above average science and overall final grades in high school.
The results of this study support the idea that the SoAD/HD can interfere with academic performance during AIT. They also support the premise that timing and rhythm play an important role in both cognitive and motor task performance.
6.1 SoAD/HD
Most of the participating Soldiers scored below the adult norm on SoAD/HD, but just over a third scored above the adult norm (this percentage was artificially created to match the 30% found in the larger scale study; see section 4.0). A greater percentage of Soldiers self-reported symptoms of AD/HD were above adult norms on ODD (15.6%), compared with hyperactive-impulsive (12.3%) and inattentive (9.8%) types.
6.1.1 SoAD/HD and GPA
Of four potential scores associated with SoAD/HD, only ODD was found to be associated with GPA. Soldiers with high symptoms of ODD had lower GPAs. In this case of self-report, the individuals do not necessarily have the clinical disorder of ODD, but they rated themselves as having symptoms commensurate with the following: tending to be negative, hostile, or defiant and to have exhibited a pattern of behavior lasting at least 6 months during which they have at least four of the following (DSM-IV text revision, 2000):
1. often loses temper,
2. often argues with adults,
3. often actively defies or refuses to comply with adults' requests or rules,
4. often deliberately annoys people,
5. often blames others for their own mistakes or misbehavior,
6. is often touchy or easily annoyed by others,
7. is often angry and resentful,
8. is often spiteful and vindictive.
Typically, a person with ODD demonstrates impairment in his or her social, academic, or occu-pational functioning, caused by behavior. In this case, those who rated themselves high in terms
22
of ODD had lower GPA. That is, those who rated themselves as being less cooperative had lower GPAs.
Prevalence rates for ODD are estimated to be between 6% and 10% in general parental surveys (non-referred, nonclinical) and less when information is obtained from parents and teachers (Tynan, 2006). Our rates were higher than these (15.6%), but no data were available for self-assessment prevalence rates among young adults. After adolescence, rates are nearly equal in men and women.
ODD is not the same as a conduct disorder (CD), nor is the presence of ODD during childhood necessarily a precursor for development of a CD (Biederman et al., 1996). Comorbidity of ODD with AD/HD occurs in 50% to 65% of affected children (Tynan, 2006).
Barkley and Murphy (1998) found that students with AD/HD not only have lower class rankings and GPAs, but they are also suspended more often. However, they did not differentiate between types of SoAD/HD and ODD in that study. Other studies have found that executive functioning skills deficits are found among AD/HD children, but they are independent of comorbidity with ODD (Barkley, Edwards, Lanera, Fletcher, & Metevia, 2001; Klorman et al., 1999) or reading disorders (Klorman et al., 1999)13. Barkley’s work extended the findings to adolescents to age 19 (Barkely et al., 2001). Yet this issue is not without debate, since other researchers have found cognitive skill deficits among children with ODD in executive functional skills as well as emotion regulation, language processing, and social information processing skills (Greene, Biederman, Zerwas, Monuteaux, Goring, & Faraone, 2002a). Tynan (2006) reports high rates of comorbidity between ODD, learning disorders, and academic difficulties.
Not all experts assume that those with SoAD/HD will perform poorly in academic settings. Greene and his colleagues (Greene, Ablon, & Goring, 2002b; Greene & Ablon, 2003) suggest using a teaching model for children with ODD, which incrementally progresses, thus reducing demands for flexibility and frustration tolerance during the acquisition of new cognitive skills. Hallowell and Ratey (2006) believe that students with AD/HD can succeed, given that teaching methods, self-monitoring, and organizational structure are grounded in a system that augments strengths. They further teach that AD/HD is not necessarily a disorder (only becoming a disorder when it impairs a person’s life) but a trait, and that there are distinctive advantageous characteris-tics of those with AD/HD, such as originality, creativity, persistence, and resilience.
6.1.2 SoAD/HD and APFT
No relationships were found between scores associated with SoAD/HD (four types) and physical performance (four scores) during 68W AIT. This differs from the open literature in which children
13Some of the executive skill tests used were the Wisconsin Card-Sorting Test and Tower of Hanoi (Klorman et al., 1999) and Continuous Performance Test (CPT) inattention, working memory and CPT inhibition (Barkley et al., 2001). Differences in temporal discounting and time reproduction between those with AD/HD and without AD/HD were also not a function ODD (Barkley et al., 2001).
23
with AD/HD also have motor coordination difficulties (Kadejso & Gillberg, 1998; Pick, Pitcher, & Hay, 1999). The difference in these findings may be attributable to the ages of the test subjects (young adults as opposed to children), the small sample population, or the level severity of AD/HD symptomatology found in studies with children (more severe symptoms equating with more coordination difficulties). The latter explanation could also be the result of our study only examining self-reported symptoms of AD/HD, rather than examining characteristics of those with a clinical diagnosis.
In addition to not identifying relationships between SoAD/HD and physical performance on the APFT, no relationships were found between SoAD/HD and the number of new profiles or total days on profile because of musculoskeletal injury.
6.1.3 SoAD/HD and IM Scores
Relationships were found between the SoAD/HD and scores on the IM. However, of 72 possible correlations, only two were significant for correlations and three measures were significant on regressions. Although this is less than 5% and could be attributable to chance, these correlations do fit within a pattern. The VLA on the clapping task without C was significantly associated with SoAD/HD, in both overall and inattentive categories, with the use of correlations and regression models. Reports in the open literature on the IM use the measure of TA for their statistical analysis (Libkuman, Otani, & Steger, 2002; Mulder, 2002; Shaffer et al., 2001; Toplak & Tannock, 2005) rather than other scores. Scores such as VLA are used to assist patients or clients in understanding their responses and working to improve their TAs. For example, an individual with high scores in the very late category would know that s/he should accelerate responses in order to attain a lower, more desirable TA.
There are several possible reasons why TA did not appear sufficiently sensitive to be associated with SoAD/HD. One is that this study involved using the IM as a screening tool with self-reported symptoms by young adults. Examining IM as a screening tool takes this research project into uncharted territory. In addition, neither self-reported symptoms of AD/HD nor young adults have previously been investigated with the IM. Although it is unknown whether those who reported symptoms have AD/HD (since they were not required to report prior clinical diagnosis), it is not known whether young adults with SoAD/HD score differently than others using TA as a measure. It may be that adults with SoAD/HD, especially those with inattentive (or overall) symptoms, react more slowly than those without SoAD/HD. That is, young adults with inattentive SoAD/HD may be hypo-anticipatory in their reactions and may first hear the beat before they initiate their reac-tions, rather than establishing their own sequential rhythm to match the beat. VLA may be a better measure for identifying young adults with SoAD/HD or with specific patterns of AD/HD symptoms.
Although this study did not investigate IM training and SoAD/HD, it has been reported that IM training improves attention, motor control, language processing, reading, and regulation of aggression among boys with AD/HD (Shaffer et al., 2001). Doctors Hallowell and Ratey, who
24
specialize in the evaluation and treatment of AD/HD among children and adults, suggest cerebellar training (including the IM, Dores, and the Brain Gym14) as possible complementary treatment for individuals with AD/HD (Hallowel & Ratey, 2006).
6.2 IM
TA levels for initial screenings for young adults are not currently available. Additionally, it is routine for new IM users to perform better without auditory feedback, as seen among the 68W trainees.
6.2.1 IM and GPA
Although none of the 18 IM measures were correlated with GPA, four scores with auditory feedback were predictive of GPA: TA, LA, and VLA were negatively predictive and IAR scores were positively predictive of GPA (4 of 18 or 22.22% is greater than the 5% expected by chance). A higher IM TA indicates poorer performance; therefore, a negative prediction (higher TA pre-dicting a lower GPA) is reasonable. For every one point increase in TA, there was a 0.04 decrease in GPA. Likewise, higher LA and VLA scores predicting a lower GPA are understandable. VLA did not reach statistical significance, however. Interestingly, VLA was the only measure associated with SoAD/HD, although without auditory feedback.
The higher IAR predicting a lower GPA is less easily understood. In an effort to further investi-gate this, as well as explain the direction of the IAR prediction (higher IAR predicted lower GPA), each variable was run separately to determine if it predicted GPA, and descriptive statistics were examined. None of the measures alone were predictive of GPA (TA: ß = -0.006, t(117) = -.717, p > .05; LA: ß = -0.039, t(117) = -1.313, p > .05; IAR: ß = -0.365, t(117) = -1.48, p > .05). In addition, the Soldier who attained the lowest GPA (64) also achieved one of the highest SRO trigger taps IAR (7), which skewed the results.
Since this is the first study examining the relationships between IM scores and GPA, it may be that TA and LA are more sensitive measures for associations with GPA. Even with research using the IM as a training tool, GPA has not been used as an outcome measure. Instead, grade equivalent achievement scores have been used. For example, IM training has produced significant improve-ments of 7% to 20% in reading and math achievement grade equivalency scores among elementary school and high school children, compared with control groups (Taub & McGrew, 2005).
6.2.2 IM and APFT
Soldiers’ IM scores were related to their physical performance, as measured by the scores on their first APFT taken during AIT. Seventeen of 72 possible correlations showed a relationship
14The Dore Programme is based on the text, Dyslexia: The Miracle Cure by Wynford Dore. Although originally
developed for use with people who have dyslexia, it is also used (with reported success) for persons with attention deficit and hyperactivity disorder, dyspraxia, and Asperger’s syndrome. Brain Gym is a program of physical movements said to enhance learning and performance through developing the brain’s neural pathways through movement. Both the Dores program and Brain Gym are purported to improve concentration, memory, reading, writing, organizing, and listening, as well as other performance measures.
25
(23.61%) and 12 of 72 (16.67%) measures were predictive with the use of regression analysis, both of which are greater than the 5% which might be expected by chance. Both screening tests, with and without auditory cues, were related to push-ups and sit-ups performed in the requisite 2 minutes.
For push-ups, Soldiers with a high VE average without Cs performed fewer push-ups (correlation), while both higher early and LAs predicted fewer push-ups (without auditory feedback). These results show that Soldiers who either anticipated the beat and clapped before the actual beat (hyper-anticipatory) or responded more slowly than expected (hypo-anticipatory) performed fewer push-ups. These Soldiers had a difficult time matching the reference tone, even without interfering auditory cues. This difficulty in synchronizing the auditory input and motor output and matching a set rhythm would seem to indicate an underlying difficulty with sensorimotor rhythmicity that influences more complex motor behavior, such as the ability to do push-ups. When auditory feedback was added, a higher VE average remained and a higher TA was added in an association with fewer push-ups. In addition, with auditory feedback (distraction), a higher number of bursts IAR and SRO% were associated with a higher number of push-ups, and a higher SRO% was predictive of the number of push-ups achieved. That is, when auditory distractions were added, a stronger set of associations resulted, including TA. The IM scores predicting push-ups without auditory distractions were early and late scores with an R2 of 6.3, but with auditory cues, SRO% became more predictive with an R2 of 8.8. This demonstrates that although IM scores are associated with and are predictive of the number of push-ups that Soldiers achieve, adding auditory distractions strengthens the associations and predictions. It also demonstrates that TA is not a sensitive measure for push-ups in this population, unless auditory distractions are present. It would appear that Soldiers anticipated the beat even more with auditory distraction, thus increas-ing their VE score and negatively impacting overall TA. This supports the idea that for those individuals who anticipated the beat, their underlying sensorimotor rhythmicity is not as well developed as it could be to support the more complex timed physical task. It also demonstrates that without the additional stress of auditory distraction, TA is not of sufficient sensitivity to identify those individuals with potential difficulties.
Fewer sit-ups were associated with IM scores without auditory cues, as indicated by higher TA, variability, VE and VLAs on clapping without auditory feedback, while more sit-ups were associated with higher bursts, IAR and SRO%. High early and LAs without auditory feedback were predictive of the number of sit-ups completed in 2 minutes. Once again, Soldiers who anticipated the beat and clapped (tapping the indicator) early and those who were slower than expected (tapping the indicator late) performed fewer sit-ups. In this case, a higher variability in responses was also associated with fewer sit-ups. Matching the beat more frequently (bursts, IAR and SRO%) was associated with performing more sit-ups. As with push-ups, these findings seem to indicate that Soldiers who demonstrate hyper-anticipatory and hypo-anticipatory responses did not perform as well in a timed, complex physical assessment. In this case (sit-ups), a higher TA and response variability were also of sufficient sensitivity to be associated with poorer perform-
26
ance. When auditory sounds were added, TA remained associated with fewer sit-ups and higher SRO% remained associated a higher number of sit-ups. Adding auditory distractions increased the number of predictors, adding TA and VE average. Once again, this appears to demonstrate that TA is not a sensitive measure unless auditory distractions are added to the task and that stronger predictions result with auditory distractions (R2 changing from 10.1 to 12.6). It also supports the concept that a sense of sensorimotor rhythmicity is essential for complex physical tasks, such as sit-ups15.
IM test scores without auditory feedback were not associated with run time or overall APFT performance. However, when auditory feedbacks (distractions) were added, early average and SRO% were predictive of run time and SRO% was predictive of the overall APFT score. Again, this seems to indicate that the addition of distracting sounds makes the IM task even more difficult for those with underlying timing and rhythmicity difficulties. In turn, the addition of distracting sounds creates a more sensitive set of IM measures to predict a Soldier’s ability to perform physical tasks. However, TA is not sufficiently sensitive, even with the addition of auditory distractions, to predict run time or overall APFT achievement.
These data appear to support the supposition that there is a relationship between motor performance (as indicated by APFT scores) with timing and rhythmicity (as measured by the IM). IM training has been shown to improve motor control among AD/HD children (Shaffer et al., 2001) and coor-dination and visual motor control among special education children (Stemmer, 1997). IM training also improves golf ball placement accuracy among experienced golfers (Libkuman, Otani, & Steger, 2002). Assessments with the IM have not been compared with other physical or perceptual motor-based tasks of Soldiers, such as weapon firing or obstacle course performance.
6.2.3 IM and Profile Data
None of the nine IM measures without auditory feedback were correlated with or predictive of number of profiles or total number of profile days. When auditory distractions were added, a higher TA, SRO%, early and LAs were predictive of fewer profiles per Solider. These predictions do not make intuitive sense, except in the case of the SRO%. These findings may be the result of few Soldiers having had more than one injury (only 15% had three or more profiles; table 22). Only one profile per injury was counted, that is, if a Soldier received a 2-week profile for an injury and then a subsequent profile for another length of time for the same injury, only one profile was documented. Since there were no correlations of 18 potential correlations, the regression findings for the same data may be spurious.
SRO% was both correlated with and predictive of total profile days (LA was also predictive of total profile days). Soldiers with higher SRO% scores spent fewer days on limited duty profile because
15Although there may be alternate definitions, a “complex” task in this report is a task that involves multiple
facets, such as multiple muscle groups and multi-part movements. This is opposed to a simple motor task such as single finger tapping.
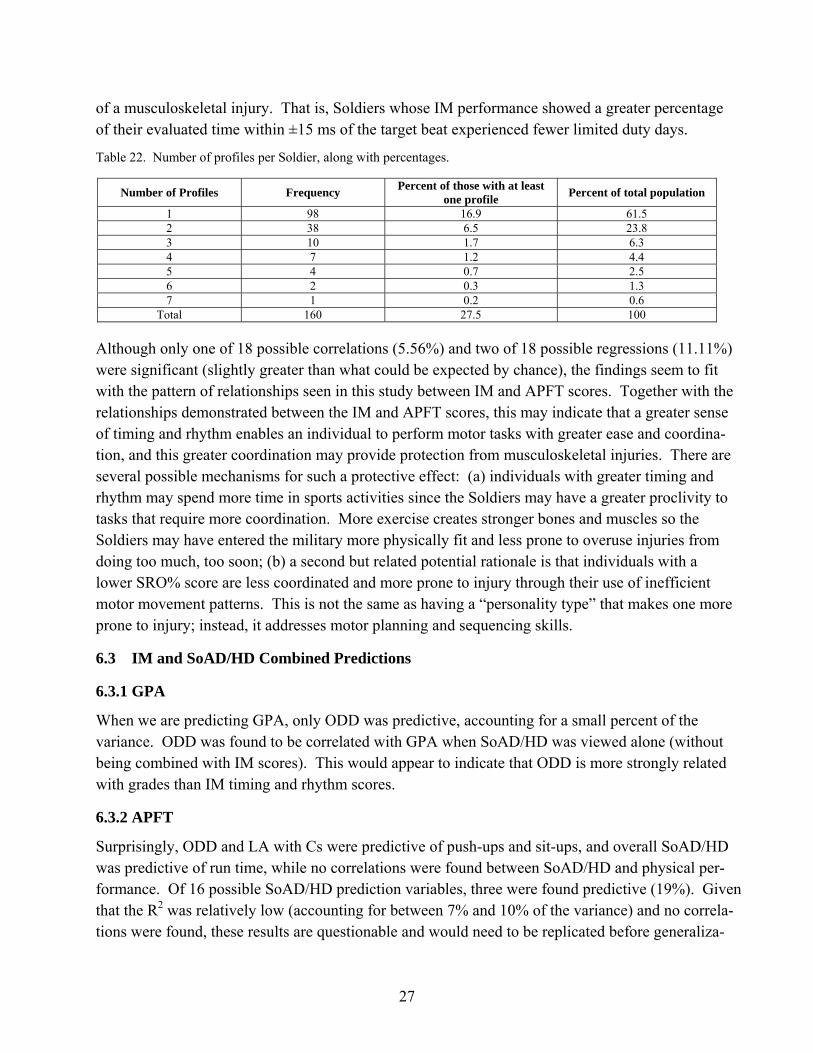
27
of a musculoskeletal injury. That is, Soldiers whose IM performance showed a greater percentage of their evaluated time within ±15 ms of the target beat experienced fewer limited duty days.
Table 22. Number of profiles per Soldier, along with percentages.
Number of Profiles Frequency Percent of those with at least one profile Percent of total population
1 98 16.9 61.5 2 38 6.5 23.8 3 10 1.7 6.3 4 7 1.2 4.4 5 4 0.7 2.5 6 2 0.3 1.3 7 1 0.2 0.6
Total 160 27.5 100
Although only one of 18 possible correlations (5.56%) and two of 18 possible regressions (11.11%) were significant (slightly greater than what could be expected by chance), the findings seem to fit with the pattern of relationships seen in this study between IM and APFT scores. Together with the relationships demonstrated between the IM and APFT scores, this may indicate that a greater sense of timing and rhythm enables an individual to perform motor tasks with greater ease and coordina-tion, and this greater coordination may provide protection from musculoskeletal injuries. There are several possible mechanisms for such a protective effect: (a) individuals with greater timing and rhythm may spend more time in sports activities since the Soldiers may have a greater proclivity to tasks that require more coordination. More exercise creates stronger bones and muscles so the Soldiers may have entered the military more physically fit and less prone to overuse injuries from doing too much, too soon; (b) a second but related potential rationale is that individuals with a lower SRO% score are less coordinated and more prone to injury through their use of inefficient motor movement patterns. This is not the same as having a “personality type” that makes one more prone to injury; instead, it addresses motor planning and sequencing skills.
6.3 IM and SoAD/HD Combined Predictions
6.3.1 GPA
When we are predicting GPA, only ODD was predictive, accounting for a small percent of the variance. ODD was found to be correlated with GPA when SoAD/HD was viewed alone (without being combined with IM scores). This would appear to indicate that ODD is more strongly related with grades than IM timing and rhythm scores.
6.3.2 APFT
Surprisingly, ODD and LA with Cs were predictive of push-ups and sit-ups, and overall SoAD/HD was predictive of run time, while no correlations were found between SoAD/HD and physical per-formance. Of 16 possible SoAD/HD prediction variables, three were found predictive (19%). Given that the R2 was relatively low (accounting for between 7% and 10% of the variance) and no correla-tions were found, these results are questionable and would need to be replicated before generaliza-
28
tions are made. However, in a separate study, we have found that SoAD/HD was corre-lated with the first APFT scores attained by Soldiers attending 68W training, with both ODD and overall SoAD/HD being negatively correlated with push-ups, sit-ups, and run time (p < 0.05, n = 581) (Rice, Butler, & Marra, unpublished data). These two studies would appear to indicate that a relationship between SoAD/HD and APFT performance exists. Only two of 96 IM scores were found to be significantly predictive of APFT scores (2%). This is less than the 5% expected by chance and albeit consistent (LA predicting both push-ups and sit-ups), the findings do not match the findings of TA and SRO% when IM alone was used to predict APFT scores. Therefore, this result appears to be spurious.
6.3.3 Profiles
In the prediction of profiles, the more accurate the Soldier was at keeping his or her tapping response within +15 ms of the reference tone (SRO%), the fewer profile days per profile and total profile days they had. These findings mirror the findings when IM alone was used to predict profiles and SoAD/HD was correlated with profile data. That is, none of the SoAD/HD scores were correlated with profile data, and several IM measures were correlated with and predicted profile data, including SRO% being negatively associated with profile days. Two of 24 potential IM predictors (8.3%) were predictive and these followed a similar pattern as when IM was viewed alone. As previously noted, these findings suggest that a greater sense of timing and rhythm may provide mechanism of protection from musculoskeletal injuries. Once again, only the task with auditory feedback was predictive.
7. Limitations
Potential limitations of this research include self-selection (using volunteers versus having all students participate), self-reporting, using one group of AIT attendees, and evaluating only the beginning short form of the IM assessment for analysis. Even as it is possible that self-selection resulted in a bias, the fact that more than 90% of the students volunteered for the overall study, from which a random sample was drawn for this study, lends support to the belief that a normal sample was drawn. Although 100% participation can be required for research involving educa-tional effectiveness studies, giving students who have little control over their time and activities the ability to choose whether they wanted to participate potentially offered a greater chance of active, honest participation.
Self-reports of SoAD/HD do not equate with a clinical diagnosis of AD/HD. In this case, we were particularly interested in identifying symptoms that currently exist and may interfere with performance rather than a clinical diagnosis based on a childhood history. This was because of the intended use of research findings, that is, to use the research findings to design training and training interventions to assist students attending 68W AIT. Generalization of these findings to
29
other populations should be done with caution since this sample, drawn from military combat medic trainees, may not be representative of other populations. This report addresses only those findings on the initial short form assessment of the IM. There is also a long form assessment and a second short form assessment, which is given after the long form assessment.
8. Conclusions
The purpose of this study was to investigate the relationships between (a) SoAD/HD, (b) results from a new interactive computer technology used to assess neuro-cognitive function in terms of auditory and visual input with psycho-motor timing and rhythm output, and (c) Soldier performance during 68W AIT. Significant relationships were found among the three. In addition, the following conclusions can be drawn from these research findings:
1. Self-reported SoAD/HD scores are associated with final 68W AIT GPA but not with APFT or musculoskeletal injuries.
2. Soldiers with higher self-reported ODD SoAD/HD received lower academic grades during 68W AIT16.
3. Neuro-cognitive function, as measured by an IM assessment, is associated with self-reported SoAD/HD, GPA, APFT scores and musculoskeletal injury profile days among Soldiers attending 68W AIT.
4. TA may not be the most sensitive IM assessment measure for all situations and circum-stances. Others, such as SRO% or VLA may also be useful for screening purposes and may be sensitive to particular issues or difficulties (VLA was associated with SoAD/HD, for example).
5. IM assessment measures with and without auditory feedback appear to be sensitive to different situations and circumstances. For example, IM assessments with auditory feedback appear more sensitive in screening for complex physical performance.
The findings from this study are extremely important to the military and the U.S. Army. SoAD/HD can interfere with learning and retaining information, but feedback to Soldiers with these symptoms can help them discover how they best absorb and remember information. Many individuals with SoAD/HD or even with diagnosed AD/HD have been extremely successful in their lives and careers. Understanding themselves and their symptoms enables them to structure their lives to make the best of their abilities and mitigate negative effects. Thus, Soldiers can begin
16Note earlier footnote in which additional studies have revealed relationships between overall SoAD/HD and
GPA and inattentive type SoAD/HD and GPA.
30
to format their own methods of learning early in their military career, thus enabling them to gain the necessary knowledge for competence in their MOS.
Feedback to instructors about the Soldiers attending their classes, including how they think, function and learn, can guide instructors in organizing their teaching so that students can learn and retain information more effectively. Without this information, a number of bright, creative young men and women will experience frustration and undue difficulty during training, in organiz-ng their time, and reaching the level of achievement within the military that matches their potential.
The IM evaluation appears to offer promise as a training tool for Soldiers identified as being at risk for having difficulties during AIT. Additionally, if this type of “brain training” works to improve Soldiers’ ability to focus, concentrate, and learn, it could be of great use in other situations (for example, in other training situations).
In light of the strong relationship with Soldiers’ physical performance (APFT) shown in this study and its use by elite athletes, it may be of great benefit for training to improve perceptual-motor Soldiering skills. Possibilities include training to improve weapon firing and motor skills for quick agility to overcome physical obstacles. Such training might improve the biomechanics and tech-niques used during fitness training and reduce musculoskeletal injuries.
9. Further Research
The results of this research are far-reaching for the Army Medical Department and the Army as a whole. Potentially, AMEDD will (a) decrease the cost of health care by improving the passing rate in an academically challenging medical MOS experiencing a severe personnel shortage, and (b) improve the quality of health care by increasing AIT trainees’ ability to focus their attention and learn the material. For the Army, results will potentially identify whether (a) there is a population of Soldiers who need to be screened from entering the Army or who are potentially good Soldiers in need of an alternate from of education and (b) a new technology can assist Soldiers who are having difficulty passing a challenging AIT program.
The following recommendations are made, in light of findings from this research:
1. There is a need to conduct further assessments of the presence or absence of SoAD/HD among Soldiers, as well as the relationship between SoAD/HD and Soldier performance. These studies should involve a larger and more diverse population (other MOSs) and should include additional assessment techniques for identifying AD/HD.
2. This study investigated only one of three initial IM assessments: a clapping task with and without auditory feedback, given without any training or practice on the IM device. The other two assessments, a long form involving 13 tasks and the same short version used in
31
this study but following IM practice with both the short and long form assessments, should also be investigated for their potential use as screening tools.
3. There is sufficient information from this study to warrant investigation into the potential benefit of neuro-cognitive training to Soldier performance. These studies should involve cognitive as well as physical performance during training and post-initial training. One such study is scheduled at Fort Sam Houston among 68W Soldiers attending AIT.
4. Research on the potential mechanisms of action, generalizing of training results, and identifying benefits of IM training for specific populations (healthy and injured) would expand the current literature and make this a more useful tool for therapists selecting interventions for Soldiers.
5. Further research on the IM as a screening tool is necessary to shed light on which measures are most sensitive as correlates or predictors and whether sensitivity differs for alternate conditions or circumstances.
6. Research using the IM as a training tool to improve physical performance appears warranted; this could include
a. Training before BCT to determine if injuries and/or profile days are reduced.
b. Training to improve psychomotor performance and agility, such as weapon firing or obstacle course performance.
c. Training of injured Soldiers to assist with cognitive and psychomotor performance, such as with Soldiers who have experienced traumatic brain injuries or amputations.
In light of the positive findings with this form of “brain training,” other devices, training mechanisms, and times for training may warrant investigation.
32
10. References
APA (American Psychiatric Association). Diagnostic and Statistical Manual of Mental Disorders IV – Text Version (DS-IV-TR). Published by the American Psychiatric Association, Washington, DC, 2000.
Accession Medical Standards Analysis & Research Activity (AMSARA). Annual report. Silver Spring, MD: Walter Reed Army Institute of Research, 2002.
Barkley, R. A.; Edwards, G.; Lanera, M.; Fletcher, K.; Metevia, L. Executive Functioning, Temporal Discounting, and Sense of Time in Adolescents With Attention Deficit Hyperactivity Disorder (ADHD) and Oppositional Defiant Disorder (ODD) (1). Journal of Abnormal Child Psychology 2001, 29 (i6), 541-557.
Barkley R.; Murphy, K. Attention-Deficit/Hyperactivity Disorder: A Clinical Workbook; 2nd ed. New York, NY: Guilford Press, 1998.
Biederman, J.; Farone, S. V.; Milberger, S.; Jetton, J. G.; Chen, L.; Mick, E.; Greene, R. W.; Russell, R. L. Is Childhood Oppositional Defiant Disorder a Precursor to Adolescent Conduct Disorder? Findings From a Four-Year Follow-Up Study of Children With AD/HD. Journal of the American Academy of Child and Adolescent Psychiatry 1996, 35 (9), 1193-1204.
Fatolitis, P.; Ekenna-Kalu, C.; Momen, N. (n.d.) A Cognitive Neuropsychological Assessment of the Effects of Interactive Metronome training on Naval Aviation Technical Training Center students (unpublished data from 2002).
Greene, R. W.; Ablon, J. S. Disruptive Behavior Disorders. In Breen MJ, Fiedler, CR (Eds). Behavioral Approach to Assessment of Youth with Emotional/Behavioral Disorders (2nd Ed). Austin, TX: Pro-Ed, 2003.
Greene, R. W.; Ablon, S. A.; Goring, J. C. Journal of Psychosomatic Research 2002b, 1, 1-9.
Greene, R. W.; Biederman, J.; Zerwas, S.; Monuteaux, M. C.; Goring, J. C.; Faraone, S. V. American Journal of Psychiatry 2002a, 159, 1214-1224.
Grossberg, B. Making ADD work: On-the-Job Strategies for Coping with Attention Deficit Disorder; NY, NY: Berkley Publishing, 2005.
Guerra, A. As Presented in Lecture Entitled A Comprehensive Introduction To the Interactive Metronome (IM): History, Research and Application. IM Professional Conference, Austin, Texas. Originally presented at the Preventive Medicine and Rehabilitation Conference in Boston, 2004, 2006.
33
Hair, J.; Anderson, R.; Tatham, R.; Black, W. Multivariate Data Analysis (5th ed); Upper Saddle River, NJ. Prentice-Hall, Inc., pp.142, 147, 1998.
Hallowell, E. M.; Ratey, J. J. Delivered from Distraction: Getting the Most out of Life with Attention Deficit Disorder; New York: Ballantine, 2006.
Hansen, M. Personal Communication, Chief, Academic Standards Department of Combat Medic Training email, Dec 21, 2005, 2006.
Heiligenstein, E.; Guenther, G.; Levy, A.; Savino, F.; Fulwiler, J. Psychological and Academic Functioning in College Students with Attention Deficit Hyperactivity Disorder. Journal of American College Health 1999, 47 (4), 181-185.
Interactive Metronome. Certified Provider Basic Training Course and Resource Binder; Weston, FL, 2004.
Interactive Metronome. Web site http://www.interactivemetronome.com/home/index.asp, 2006.
Kadejso, B.; Gillberg, I. C. Attention Deficits and Clumsiness in Swedish 7-year old Children. Developmental Medicine and Child Neurology 1998, 40, 796-804.
Klorman, R.; Hazel-Fernandez, L. A.; Shaywitz, S. E.; Fletcher, J. M.; Marchione, K. E.; Holahan, J. M.; Stuebing, K. K.; Shaywitz, B. A. Executive functioning deficits in attention-deficit/hyperactivity disorder are independent of oppositional defiant or reading disorder. J Am Acad Child Adolesc Psychiatry 1999, 38 (9), 1148-1155.
Kuhlman, K.; Schweinhart, L. J. Timing in child development. Ypsilanti, MI: High/Scope Educational Research Foundation. In press: http://www.highscope.org/Research/TimingPaper/timingstudy.htm, 1999.
Lam, L. T. (). Attention Deficit Disorder and Hospitalization Due to Injury Among Older Adolescents in New South Wales, Australia. Journal of Attention Disorders 2002, 6 (2), 77-82.
Levin, J. Elementary Statistics in Social Research (2nd ed.); New York, NY. Harper @ Row, Publishers, Inc. pp. 197-207, 1977.
Libkuman, T.; Otani, H.; Steger, N. Training in Timing Improves Accuracy in Golf. Journal of General Psychology 2002, 129 (1), 77-96.
Mulder, R. ‘Training for the Brain’ Technology Yields Gains at St. Thomas Aquinas High School. Technological Horizons in Education, 30 (October), 2002.
NRC (National Research Council). Assessing Fitness for Military Enlistment: Physical, Medical and Mental Health Status; Washington, DC: National Academies Press, 2006.
34
Pick, J.; Pitcher, T.; Hay, D. Motor Coordination and Kinaesthesis in Boys With Attention Deficit-Hyperactivity Disorder. Developmental Medicine & Child Neurology 1999, 41, 159-165.
Posner, M. I. Verbal Presentation at the Annual Human Factors and Ergonomics Conference, Oct 2006, specific response during question and answer session, 2006.
Rice, V. J.; Woods, Y.; Bundy, M. Unpublished data, U.S. Army Research Laboratory, 2005.
Rice, V. J.; Butler, J.; Marra, D. Unpublished data, U.S. Army Research Laboratory, 2006.
Ross, K.L. Attentional Symptoms as a Predictor of Marine Corps Performance. Unpublished masters thesis, California School of Professional Psychology, San Diego, CA, 1997.
Shaffer, R. J.; Jacokes, L. E.; Cassily, J. F.; Greenspan, S. I.; Tuchman, R. F.; Stemmer, P. J. Effect of Interactive Metronome Training on Children with AD/HD. American Journal of Occupational Therapy 2001, 55, 155-162.
Spinella, M.; Miley, Impulsivity and Academic Achievement in College Students. College Student Journal, (Dec 2003). Retrieved June 17, 2005, from: (http://www.findarticles.com/p/articles/mi_m0FCR/is_4_37/ai_112720418, 2003.
Stemmer, P. Improving Student Motor Integration by Use of an Interactive Metronome. Presented at the March 1997 American Education Research Association Annual Conference, Chicago, IL. Abstract available at http://interactivemetronome.com, 1997.
Taub, G.; McGrew, K. The Impact of Synchronized Metronome Tapping Treatments on School Achievement: A Report of Two Preliminary Investigations. Paper presented at: Learning & the Brain Conference 2005, Harvard University, Cambridge, MA, 2005.
Toplak, M.; Tannock, R. Tapping and Anticipation Performance in Attention. Perceptual and Motor Skills 2005, 100 (3 pt 1), 659-675.
Tynan, W. E. Defining Oppositional Defiant Disorder. Available at http://www.emedicine, 2006.
35
Acronyms
ADD attention deficit disorder
ADHD attention deficit and hyperactivity disorder
AIT Advanced Initial Training
AMEDDC&S U.S. Army Medical Department Center & School
APFT Army Physical Fitness Test
ASVAB Armed Services Vocational Aptitude Battery
BCT basic combat training
CD conduct disorder
CPT
CTAF clapping task with auditory feedback
DSM-IV Diagnostic and Statistical Manual of Mental Disorders 4th Edition
FY fiscal year
GED general equivalency diploma
GPA grade point average
HS high school
IAR in a row
IM Interactive Metronome
LA late average
MOS military occupational specialty
ms milliseconds
ODD oppositional defiant disorder
SD standard deviation
SoAD/HD attention deficit and hyperactivity disorder
SRO% super right on percent
TA task average
VE very early
VLA very late average
36
NO. OF COPIES ORGANIZATION 1 DEFENSE TECHNICAL (PDF INFORMATION CTR ONLY) DTIC OCA 8725 JOHN J KINGMAN RD STE 0944 FORT BELVOIR VA 22060-6218 1 US ARMY RSRCH DEV & ENGRG CMD SYSTEMS OF SYSTEMS INTEGRATION AMSRD SS T 6000 6TH ST STE 100 FORT BELVOIR VA 22060-5608 1 DIRECTOR US ARMY RESEARCH LAB IMNE ALC IMS 2800 POWDER MILL RD ADELPHI MD 20783-1197 1 DIRECTOR US ARMY RESEARCH LAB AMSRD ARL CI OK TL 2800 POWDER MILL RD ADELPHI MD 20783-1197 2 DIRECTOR US ARMY RESEARCH LAB AMSRD ARL CS OK T 2800 POWDER MILL RD ADELPHI MD 20783-1197 1 ARMY RSCH LABORATORY - HRED ATTN AMSRD ARL HR ML J MARTIN MYER CENTER RM 2D311 FT MONMOUTH NJ 07703-5601 1 ARMY RSCH LABORATORY - HRED ATTN AMSRD ARL HR MC A D DAVISON 320 MANSCEN LOOP STE 115 FT LEONARD WOOD MO 65473 1 ARMY RSCH LABORATORY - HRED ATTN AMSRD ARL HR MD T COOK BLDG 5400 RM C242 REDSTONE ARSENAL AL 35898-7290 1 COMMANDANT USAADASCH ATTN AMSRD ARL HR ME J HAWLEY 5800 CARTER RD FT BLISS TX 79916-3802
NO. OF COPIES ORGANIZATION 5 ARMY RSCH LABORATORY - HRED ATTN AMSRD ARL HR MM DR V B RICE BLDG 4011 RM 217 1750 GREELEY RD FT SAM HOUSTON TX 78234-5002 1 ARMY RSCH LABORATORY - HRED ATTN AMSRD ARL HR MG R SPINE BUILDING 333 PICATINNY ARSENAL NJ 07806-5000 1 ARL HRED ARMC FLD ELMT ATTN AMSRD ARL HR MH C BURNS BLDG 1467B ROOM 336 THIRD AVENUE FT KNOX KY 40121 1 ARMY RSCH LABORATORY - HRED AWC FIELD ELEMENT ATTN AMSRD ARL HR MJ D DURBIN BLDG 4506 (DCD) RM 107 FT RUCKER AL 36362-5000 1 ARMY RSCH LABORATORY - HRED ATTN AMSRD ARL HR MK MR J REINHART 10125 KINGMAN RD FT BELVOIR VA 22060-5828 1 ARMY RSCH LABORATORY - HRED ATTN AMSRD ARL HR MV HQ USAOTC S MIDDLEBROOKS 91012 STATION AVE ROOM 348 FT HOOD TX 76544-5073 1 ARMY RSCH LABORATORY - HRED ATTN AMSRD ARL HR MY M BARNES 2520 HEALY AVE STE 1172 BLDG 51005 FT HUACHUCA AZ 85613-7069 1 ARMY RSCH LABORATORY - HRED ATTN AMSRD ARL HR MP D UNGVARSKY BATTLE CMD BATTLE LAB 415 SHERMAN AVE UNIT 3 FT LEAVENWORTH KS 66027-2326 1 ARMY RSCH LABORATORY - HRED ATTN AMSRD ARL HR MJF J HANSBERGER JFCOM JOINT EXPERIMENTATION J9 JOINT FUTURES LAB 115 LAKEVIEW PARKWAY SUITE B SUFFOLK VA 23435
37
NO. OF COPIES ORGANIZATION 1 ARMY RSCH LABORATORY - HRED ATTN AMSRD ARL HR MQ M R FLETCHER US ARMY SBCCOM NATICK SOLDIER CTR AMSRD NSC WS E BLDG 3 RM 343 NATICK MA 01760-5020 1 ARMY RSCH LABORATORY-HRED ATTN AMSRD ARL HR MT J CHEN 12423 RESEARCH PARKWAY ORLANDO FL 32826 1 ARMY RSCH LABORATORY-HRED ATTN AMSRD ARL HR MT C KORTENHAUS 12350 RESEARCH PARKWAY ORLANDO FL 32826 1 ARMY RSCH LABORATORY - HRED ATTN AMSRD ARL HR MS MR C MANASCO SIGNAL TOWERS ROOM 303 FORT GORDON GA 30905-5233 1 ARMY RSCH LABORATORY - HRED ATTN AMSRD ARL HR MU M SINGAPORE 6501 E 11 MILE RD MAIL STOP 284 BLDG 200A 2ND FL RM 2104 WARREN MI 48397-5000 1 ARMY RSCH LABORATORY - HRED ATTN AMSRD ARL HR MF C HERNANDEZ 2421 NW AUSTIN RD STE 220 FORT SILL OK 73503-9042 1 ARMY RSCH LABORATORY - HRED ATTN AMSRD ARL HR MW E REDDEN BLDG 4 ROOM 332 FT BENNING GA 31905-5400 1 ARMY RSCH LABORATORY - HRED ATTN AMSRD ARL HR MN R SPENCER DCSFDI HF HQ USASOC BLDG E2929 FORT BRAGG NC 28310-5000 1 ARMY G1 ATTN DAPE MR B KNAPP 300 ARMY PENTAGON ROOM 2C489 WASHINGTON DC 20310-0300
NO. OF COPIES ORGANIZATION ABERDEEN PROVING GROUND 1 DIRECTOR US ARMY RSCH LABORATORY ATTN AMSRD ARL CI OK (TECH LIB) BLDG 4600 1 DIRECTOR US ARMY RSCH LABORATORY ATTN AMSRD ARL CI OK TP S FOPPIANO BLDG 459 1 DIRECTOR US ARMY RSCH LABORATORY ATTN AMSRD ARL HR MR F PARAGALLO BLDG 459 1 DIRECTOR US ARMY RSCH LABORATORY ATTN AMSRD ARL HR M BLDG 459