Embed Size (px)
Citation preview
1
Neuro-computational account of arbitration between imitation and
emulation during human observational learning
Caroline C. Charpentier1*, Kiyohito Iigaya1, John P. O’Doherty1
1Division of Humanities and Social Sciences, California Institute of Technology, Pasadena, CA,
USA
Abstract
In observational learning (OL), organisms learn from observing the behavior of others. There are
at least two distinct strategies for OL. Imitation involves learning to repeat the previous actions of
other agents, while in emulation, learning proceeds from inferring the goals and intentions of
others. While putative neural correlates for these forms of learning have been identified, a
fundamental question remains unaddressed: how does the brain decides which strategy to use in a
given situation? Here we developed a novel computational model in which arbitration between the
strategies is determined by the predictive reliability, such that control over behavior is adaptively
weighted toward the strategy with the most reliable prediction. To test the theory, we designed a
novel behavioral task in which our experimental manipulations produced dissociable effects on
the reliability of the two strategies. Participants performed this task while undergoing fMRI in two
independent studies (the second a pre-registered replication of the first). Behavior manifested
patterns consistent with both emulation and imitation and flexibly changed between the two
strategies as expected from the theory. Computational modelling revealed that behavior was best
described by an arbitration model, in which the reliability of the emulation strategy determined the
relative weights allocated to behavior for each strategy. Emulation reliability - the model’s
arbitration signal - was encoded in the ventrolateral prefrontal cortex, temporoparietal junction and
rostral cingulate cortex. Being replicated across two fMRI studies, these findings suggest a neuro-
computational mechanism for allocating control between emulation and imitation during
observational learning.
.CC-BY-NC-ND 4.0 International licenseIt is made available under a was not peer-reviewed) is the author/funder, who has granted bioRxiv a license to display the preprint in perpetuity.
The copyright holder for this preprint (which. http://dx.doi.org/10.1101/828723doi: bioRxiv preprint first posted online Nov. 4, 2019;

2
Introduction
Learning from observing others is key to any social species. Whether it is learning a new skill by
observing an expert or parent perform it, learning to seek positive outcomes or avoid negative
outcomes, or making complex strategic decisions, observational learning (OL) is prevalent in our
daily lives and presents adaptive advantages over experiential learning. Indeed, any species able
to learn the consequences of actions available in their environment from observing their
conspecifics possesses an evolutionary advantage, as it endows an individual with the ability to
learn about the world without exposing oneself to the risks associated with having to directly
sample those actions.
Two distinct strategies for observational learning have been proposed 1–3: action imitation and
emulation. In action imitation, individuals learn by repeating actions that were most frequently
performed by the other agent in the recent past, and in emulation learning, individuals learn by
inferring the other agent’s goals, beliefs, intentions and/or hidden mental states (see 4,5 for
reviews). Computationally, action imitation has been proposed to be accounted for in a
reinforcement learning framework, whereby the actions performed by the other agent are
reinforced via the computation of an action prediction error (APE) – the difference between the
other agent’s action and how expected this action was. Evidence for a representation of APEs in
the brain during imitation learning was found in dorsomedial and dorsolateral prefrontal cortex
(dmPFC, dlPFC) and inferior parietal cortex 6,7, with the hypothesis that action imitation could be
implemented in part through involvement of the mirror neuron system, active both when an action
is observed and performed 8–12. In contrast, emulation learning consists of a more complex and
flexible inference process. Several computational accounts of emulation have been provided 13–15,
which can be collectively approximated as a form of Bayesian inference, whereby prior beliefs
about the other agents are computed and combined with the evidence received from observation
to produce posterior updated beliefs. These inference processes were found to recruit regions of
the mentalizing network 16, specifically dmPFC, temporoparietal junction (TPJ) and posterior
superior temporal sulcus (pSTS) 15,17–21.
However, if these two distinct OL strategies exist alongside each other in the brain, a fundamental
open question remains: how does the brain decide which of these two strategies should be deployed
in a given situation, and under what conditions does one or other strategy guide behavior? One
possibility is that both strategies are simultaneously deployed and that behavior is a constant, static
mix of the two. Alternatively, the brain might deploy an arbitration process whereby the influence
over behavior of these strategies is dynamically modulated as a function of which strategy is
deemed most suitable to guide behavior at a particular moment in time. The goal of the present
study is to develop a computational model of arbitration between the two OL strategies, and to test
this model against both behavioral and neural data obtained from human participants in order to
understand how control is allocated between emulation and imitation strategies at behavioral,
computational and neural levels.
.CC-BY-NC-ND 4.0 International licenseIt is made available under a was not peer-reviewed) is the author/funder, who has granted bioRxiv a license to display the preprint in perpetuity.
The copyright holder for this preprint (which. http://dx.doi.org/10.1101/828723doi: bioRxiv preprint first posted online Nov. 4, 2019;
3
In the domain of experiential learning, there is clear evidence that behavior is controlled by
multiple competing systems, such as habits versus goal-directed actions 22,23 or model-free (MF)
versus model-based (MB) learning 24,25. In order to allocate control to each system over behavior
and to ensure control flexibly adapts to changes the environment, an arbitration mechanism has
been proposed 26. A specific computational implementation of such an arbitration mechanism was
suggested for MB and MF experiential learning 27, in which the reliability of the predictions of the
two systems is dynamically computed by leveraging prediction errors generated from the two
systems. In the brain, the ventrolateral prefrontal cortex (vlPFC) and frontopolar cortex (FPC)
were found to encode the output of a comparison between the reliability of MF learning and MB
learning. This suggests that in the experiential domain, depending on which learning strategy is
more reliable at a given time point, the brain can allocate control over behavior to the most reliable
system.
Whether a similar arbitration mechanism exists in the domain of observational learning remains
unknown. Using similar principles to the reliability-mediated arbitration found in the experiential
domain, we hypothesized that the allocation of control in OL between emulation and imitation
strategies might also be related to the degree of uncertainty inherent in the predictions of the two
systems. We therefore constructed a computational model of OL arbitration that utilized the degree
of uncertainty in the predictions of the imitation and emulation systems in order to allocate
behavioral control over these systems, so that across time, one or other system can come to
dominate control over behavior depending on the relative uncertainties in the two system’s
predictions. Concretely, given that the imitation system is aiming to keep track of predictions about
which actions an observed agent will perform, we hypothesized that if the observed agent’s actions
were to become more stochastic from trial-to-trial, the uncertainty in the imitation model
predictions would decrease, thereby resulting in emulation becoming more favored. Conversely,
we hypothesized that if the goal inference process were to become more uncertain because of task
conditions (and also more difficult), then the predictions of the emulation system would become
more uncertain, thereby favoring the imitation system.
With these strong theoretical motivations in mind, we designed a completely novel observational
learning task (Fig. 1), in which we induced changes in the experimental conditions in order to
maximize differential engagement of the two strategies depending on the environment, as
hypothesized by our model. Two groups of 30 participants, referred to as Study 1 (initial sample)
and Study 2 (replication sample) completed the task while undergoing fMRI scanning. The
methods, computational modelling, behavioral analyses, fMRI pipeline, and results of Study 1
were pre-registered on OSF (project: https://osf.io/49ws3/; pre-registration: https://osf.io/37xyq)
before Study 2 data collection. The use of pre-registration in this context allowed us to evaluate
the extent to which our findings are susceptible to potential concerns about considerable modeler
and experimenter degrees of freedom that can exist in either computational modeling and
neuroimaging studies. The analytical flexibility that can apply in both types of studies has been
suggested to lead to potential pitfalls of overfitting, thereby compromising the generalizability and
reproducibility of findings 28–30. Here, by indulging in pre-registration of our computational
.CC-BY-NC-ND 4.0 International licenseIt is made available under a was not peer-reviewed) is the author/funder, who has granted bioRxiv a license to display the preprint in perpetuity.
The copyright holder for this preprint (which. http://dx.doi.org/10.1101/828723doi: bioRxiv preprint first posted online Nov. 4, 2019;
4
models, and our full model-fitting procedures, fMRI pre-processing and fMRI statistical analysis
pipeline, we reduce both modeler and experimenter degrees of freedom markedly. In our 2nd
experiment, we are able to report a full out-of-sample validation of both our computational
modeling findings on behavior as well as on neuroimaging results. Thus, this study has important
implications for the fields of both computational modeling and neuroimaging above and beyond
the specific implications for the study of OL and arbitration. Ultimately, we show how a
combination of pre-registered confirmatory analyses, supplemented by further (transparently
reported) exploratory analyses, can facilitate substantial insight into the underlying mechanisms
of observational learning and its arbitration.
We predicted that participants’ observational learning behavior would be best explained by a mix
of emulation and imitation, and that they would preferentially rely on one strategy over the other
depending on the volatility and uncertainty in the environment. We also hypothesized that distinct
neural signatures of imitation learning and emulation learning should be observed in the brain.
Imitation was expected to recruit the fronto-parietal regions of the mirror neuron system involved
in action observation, namely pre-motor cortex, inferior parietal cortex, and dlPFC 8,10,12,31.
Because emulation involves inferring another agent’s goals and hidden mental state, it was
therefore predicted to recruit regions of the mentalizing system 16,32,33. Finally, we hypothesized
that the arbitration mechanism involved in tracking the relative reliability of the two strategies
might depend on at least partially overlapping neural mechanisms as that used for arbitration in
the experiential domain. Specifically, we hypothesized that the vlPFC and FPC would drive trial-
by-trial variations in the arbitration controller 27, with the possible additional involvement of
regions of the social brain, such as the TPJ.
Results
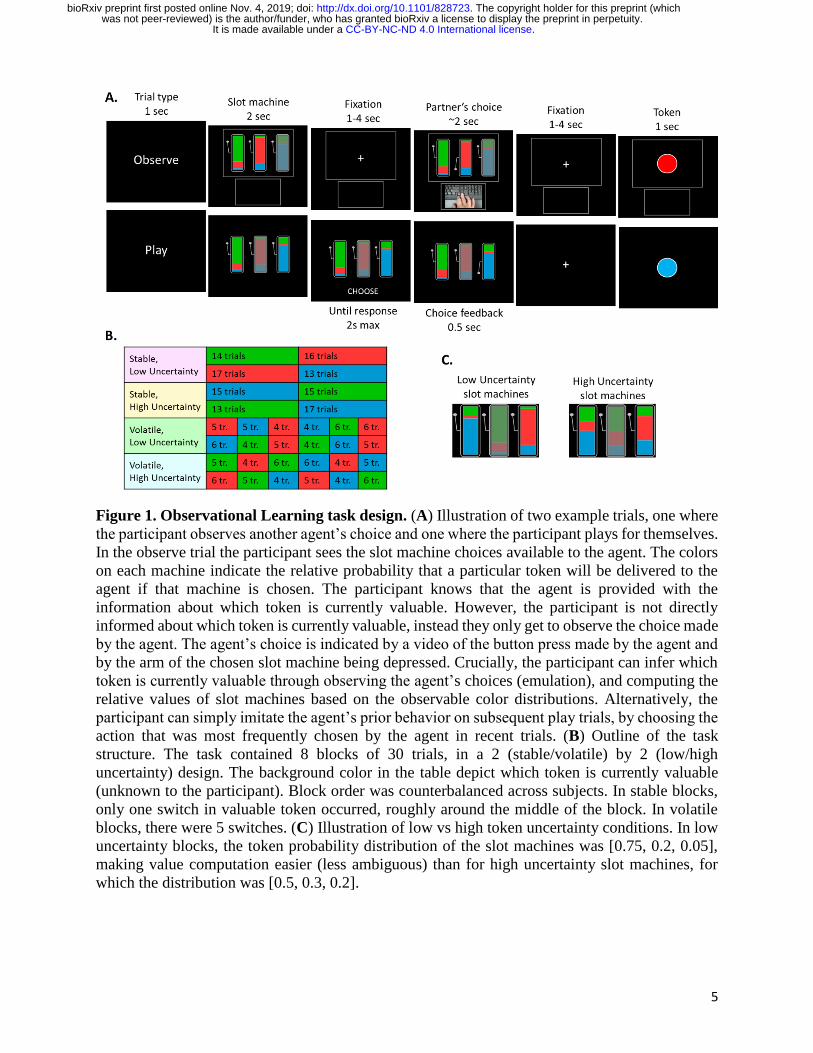
In the task (Fig. 1A, see Methods for more details), participants learned to identify which of 3
tokens (green, blue or red) is valuable by observing another agent choose between explicit slot
machines. The proportion of green, blue and red colors on each slot machine represents the
probability of obtaining each token should that slot machine be chosen. Participants were
instructed that the valuable token would switch many times throughout the task but weren’t told
when the switches occurred. On 2/3 of trials (‘observe’ trials), they observed another agent play
(through video) and knew that this other agent had full information about the valuable token and
was therefore performing optimally. On 1/3 of trials (‘play’ trials), participants played for
themselves. On each trial, one slot machine was unavailable – i.e. could not be chosen. Crucially,
participants in this task can learn by inferring which token is currently valuable and computing the
relative values of slot machines based on the observable color distributions (emulation).
Alternatively, they can simply imitate the agent’s prior behavior by choosing the action that was
most frequently performed by the agent in recent trials (imitation). By varying the position of the
unavailable slot machine across trials, and particularly between observe trials and subsequent play
trials, we were able to differentiate the two strategies behaviorally.
.CC-BY-NC-ND 4.0 International licenseIt is made available under a was not peer-reviewed) is the author/funder, who has granted bioRxiv a license to display the preprint in perpetuity.
The copyright holder for this preprint (which. http://dx.doi.org/10.1101/828723doi: bioRxiv preprint first posted online Nov. 4, 2019;
5
Figure 1. Observational Learning task design. (A) Illustration of two example trials, one where
the participant observes another agent’s choice and one where the participant plays for themselves.
In the observe trial the participant sees the slot machine choices available to the agent. The colors
on each machine indicate the relative probability that a particular token will be delivered to the
agent if that machine is chosen. The participant knows that the agent is provided with the
information about which token is currently valuable. However, the participant is not directly
informed about which token is currently valuable, instead they only get to observe the choice made
by the agent. The agent’s choice is indicated by a video of the button press made by the agent and
by the arm of the chosen slot machine being depressed. Crucially, the participant can infer which
token is currently valuable through observing the agent’s choices (emulation), and computing the
relative values of slot machines based on the observable color distributions. Alternatively, the
participant can simply imitate the agent’s prior behavior on subsequent play trials, by choosing the
action that was most frequently chosen by the agent in recent trials. (B) Outline of the task
structure. The task contained 8 blocks of 30 trials, in a 2 (stable/volatile) by 2 (low/high
uncertainty) design. The background color in the table depict which token is currently valuable
(unknown to the participant). Block order was counterbalanced across subjects. In stable blocks,
only one switch in valuable token occurred, roughly around the middle of the block. In volatile
blocks, there were 5 switches. (C) Illustration of low vs high token uncertainty conditions. In low
uncertainty blocks, the token probability distribution of the slot machines was [0.75, 0.2, 0.05],
making value computation easier (less ambiguous) than for high uncertainty slot machines, for
which the distribution was [0.5, 0.3, 0.2].
.CC-BY-NC-ND 4.0 International licenseIt is made available under a was not peer-reviewed) is the author/funder, who has granted bioRxiv a license to display the preprint in perpetuity.
The copyright holder for this preprint (which. http://dx.doi.org/10.1101/828723doi: bioRxiv preprint first posted online Nov. 4, 2019;
6
Importantly, we did not reveal the monetary value of the outcomes received by the observed agents
to the participants. While the participants did see the color of the tokens obtained by the agents,
they could not tell the current value of the token just from observing the token color obtained,
ensuring that they had to utilize inference within their emulation system in order to work this out.
Furthermore, because participants could not observe the actual reward amounts obtained by the
agents, they could not utilize vicarious reward-learning, a third potential observational learning
strategy in which one treats rewards obtained by another agent as if you had obtained them yourself
and deploy a model-free reinforcement-learning strategy on those observed rewards to learn
vicarious reward predictions 4–6,34. This critical feature of the task design ensured that we could
study the effects of imitation (action learning) and emulation (goal inference) without the
confounding effects of vicarious reinforcement-learning.
Study 1
Behavioral signatures of imitation and emulation
A simple logistic regression was run to test for the presence of the two learning strategies.
Specifically, choice of left versus right slot machine on each ‘play’ trial was predicted by an action
learning regressor (signature of imitation: past left versus right actions performed by the partner)
and a token learning regressor (signature of emulation: probability to choose left over right slot
machine given inferred token information). Both regressors were found to significantly predict
choice (action learning effect mean beta=0.865 ± 0.80 (SD), T29=5.94; token learning effect mean
beta=1.174 ± 1.00 (SD), T29=6.42; all Ps<0.0001; Fig. 2A). This suggests that behavior on the task
is a combination of imitation and emulation strategies.
Computational model of arbitration between imitation and emulation
To test whether this hybrid behavior between the two strategies can be explained by an arbitration
mechanism, we performed computational modelling analyses. Specifically, we tested a set of 9
models, split into 5 classes (see Methods for details): emulation-only models (Models 1 and 2),
which rely on multiplicative inference over token values; imitation-only models (Models 3 and 4),
which use a reinforcement learning (RL) mechanism to learn about the other agent’s past actions;
emulation RL models (Models 5 and 6), implemented as an RL mechanism rather than
multiplicative inference; arbitration models (Models 7 and 8), in which the likelihood of relying
on one strategy over the other varies as a function of each strategy’s relative reliability; and an
outcome RL model (Model 9) to test the possibility that participants mistakenly learn from the
token that is presented at the end of the trial. Two approaches were used to perform model
comparison: between subjects out-of-sample predictive accuracy and group-level integrated
Bayesian Information Criteria (iBIC 35,36). Arbitration models were found to perform best (Table
1). Specifically, Model 7 exhibited the highest out-of-sample accuracy (76.5%) and the lowest
BIC. This suggests that an arbitration mechanism between imitation and emulation, based on the
relative reliability of each strategy, explained behavior on the task better than each strategy
individually or alternative models.
.CC-BY-NC-ND 4.0 International licenseIt is made available under a was not peer-reviewed) is the author/funder, who has granted bioRxiv a license to display the preprint in perpetuity.
The copyright holder for this preprint (which. http://dx.doi.org/10.1101/828723doi: bioRxiv preprint first posted online Nov. 4, 2019;
7
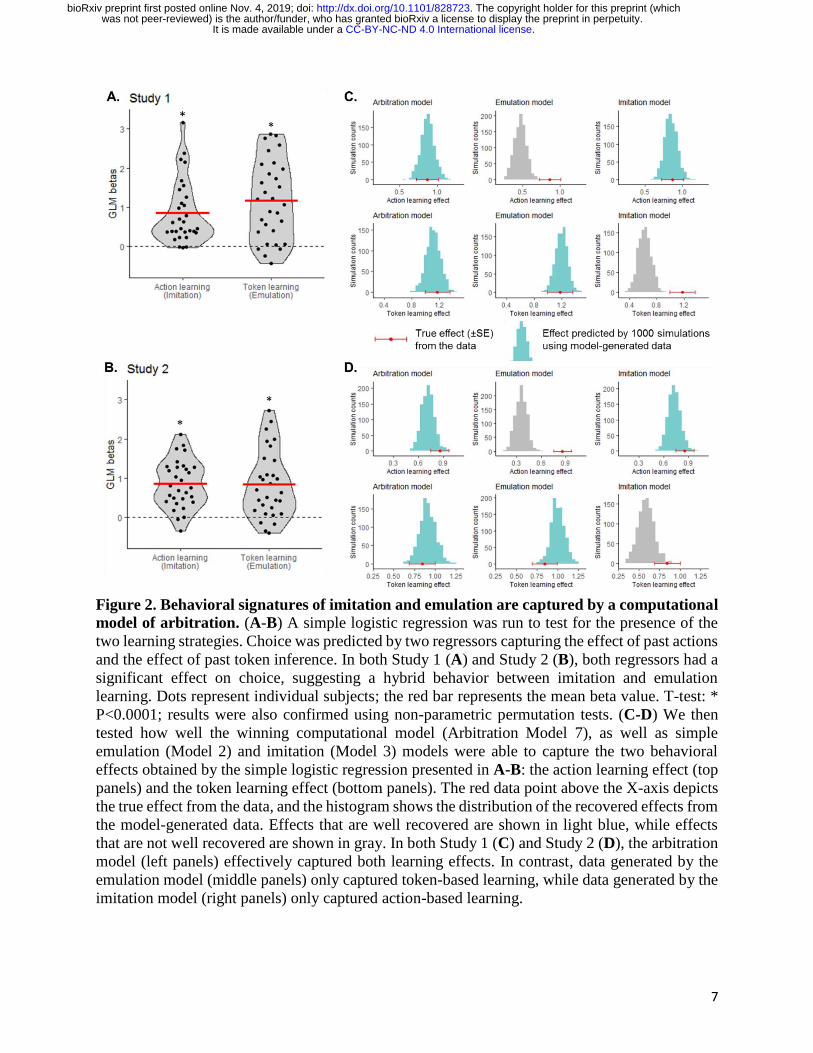
Figure 2. Behavioral signatures of imitation and emulation are captured by a computational
model of arbitration. (A-B) A simple logistic regression was run to test for the presence of the
two learning strategies. Choice was predicted by two regressors capturing the effect of past actions
and the effect of past token inference. In both Study 1 (A) and Study 2 (B), both regressors had a
significant effect on choice, suggesting a hybrid behavior between imitation and emulation
learning. Dots represent individual subjects; the red bar represents the mean beta value. T-test: *
P<0.0001; results were also confirmed using non-parametric permutation tests. (C-D) We then
tested how well the winning computational model (Arbitration Model 7), as well as simple
emulation (Model 2) and imitation (Model 3) models were able to capture the two behavioral
effects obtained by the simple logistic regression presented in A-B: the action learning effect (top
panels) and the token learning effect (bottom panels). The red data point above the X-axis depicts
the true effect from the data, and the histogram shows the distribution of the recovered effects from
the model-generated data. Effects that are well recovered are shown in light blue, while effects
that are not well recovered are shown in gray. In both Study 1 (C) and Study 2 (D), the arbitration
model (left panels) effectively captured both learning effects. In contrast, data generated by the
emulation model (middle panels) only captured token-based learning, while data generated by the
imitation model (right panels) only captured action-based learning.
.CC-BY-NC-ND 4.0 International licenseIt is made available under a was not peer-reviewed) is the author/funder, who has granted bioRxiv a license to display the preprint in perpetuity.
The copyright holder for this preprint (which. http://dx.doi.org/10.1101/828723doi: bioRxiv preprint first posted online Nov. 4, 2019;
8
Finally, we tested whether the winning arbitration model could reliably recover the behavioral
signatures of imitation and emulation identified above (i.e. the logistic regression effects shown in
Fig. 2A). To do so, we generated behavioral data for each subject using the winning arbitration
model (Model 7), as well as emulation Model 2 and imitation Model 3. Running the same logistic
regression on the model-generated data (1000 iterations), we found that the arbitration model can
reliably predict both action learning and token learning effects (Fig. 2C left panel). In contrast,
the emulation model only predicts token learning (Fig. 2C middle panel) and the imitation model
only predicts action learning (Fig. 2C right panel). These analyses show that the winning model
is able to generate the behavioral effects of interest 37 and confirm the validity and specificity of
our model.
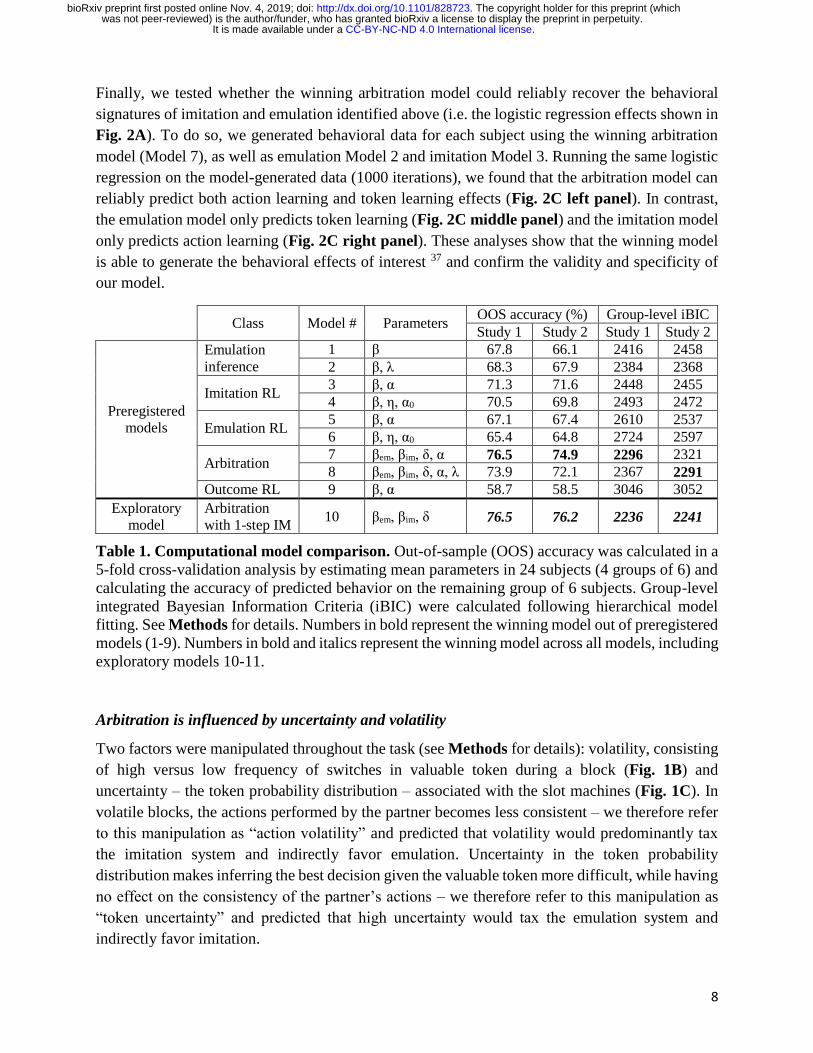
Class Model # Parameters
OOS accuracy (%) Group-level iBIC
Study 1 Study 2 Study 1 Study 2
Preregistered
models
Emulation
inference
1 β 67.8 66.1 2416 2458
2 β, λ 68.3 67.9 2384 2368
Imitation RL 3 β, α 71.3 71.6 2448 2455
4 β, η, α0 70.5 69.8 2493 2472
Emulation RL 5 β, α 67.1 67.4 2610 2537
6 β, η, α0 65.4 64.8 2724 2597
Arbitration 7 βem, βim, δ, α 76.5 74.9 2296 2321
8 βem, βim, δ, α, λ 73.9 72.1 2367 2291
Outcome RL 9 β, α 58.7 58.5 3046 3052
Exploratory
model
Arbitration
with 1-step IM 10 βem, βim, δ 76.5 76.2 2236 2241
Table 1. Computational model comparison. Out-of-sample (OOS) accuracy was calculated in a
5-fold cross-validation analysis by estimating mean parameters in 24 subjects (4 groups of 6) and
calculating the accuracy of predicted behavior on the remaining group of 6 subjects. Group-level
integrated Bayesian Information Criteria (iBIC) were calculated following hierarchical model
fitting. See Methods for details. Numbers in bold represent the winning model out of preregistered
models (1-9). Numbers in bold and italics represent the winning model across all models, including
exploratory models 10-11.
Arbitration is influenced by uncertainty and volatility
Two factors were manipulated throughout the task (see Methods for details): volatility, consisting
of high versus low frequency of switches in valuable token during a block (Fig. 1B) and
uncertainty – the token probability distribution – associated with the slot machines (Fig. 1C). In
volatile blocks, the actions performed by the partner becomes less consistent – we therefore refer
to this manipulation as “action volatility” and predicted that volatility would predominantly tax
the imitation system and indirectly favor emulation. Uncertainty in the token probability
distribution makes inferring the best decision given the valuable token more difficult, while having
no effect on the consistency of the partner’s actions – we therefore refer to this manipulation as
“token uncertainty” and predicted that high uncertainty would tax the emulation system and
indirectly favor imitation.
.CC-BY-NC-ND 4.0 International licenseIt is made available under a was not peer-reviewed) is the author/funder, who has granted bioRxiv a license to display the preprint in perpetuity.
The copyright holder for this preprint (which. http://dx.doi.org/10.1101/828723doi: bioRxiv preprint first posted online Nov. 4, 2019;

9
To test these predictions, we ran two analyses. First, we extracted the arbitration weight ω(t) values
predicted using the best-fitting model parameters for each subject. These weight values,
representing the probability of emulation (over imitation) for a given trial, were averaged for the
two conditions of interest: volatile, low uncertainty trials, where we predict emulation should be
maximal, and stable, high uncertainty trials, where we predict imitation should be maximal. As
expected, the arbitration weight was higher in volatile, low uncertainty trials (mean ω=0.604 ±
0.26 (SD)) than on stable, high uncertainty trials (mean ω=0.474 ± 0.25 (SD); T29=15.22,
P<0.0001; Fig. 3A). Across all 4 conditions (analyzed in a 2-by-2 repeated-measures ANOVA),
there was also a main effect of volatility (F(1,29)=61.2, P<0.0001) and a main effect of uncertainty
(F(1,29)=267.3, P<0.0001), suggesting a moderating effect of both manipulations.
Second, we compared the performance of the imitation-only model (Model 3) and the emulation-
only model (Model 2), by calculating the mean likelihood per trial of each model and for each
subject, and plotting them against each other separately for each condition (Fig. 3C). Dots above
the diagonal represent participants who favor emulation, which is the case when token uncertainty
is low (emulation-imitation likelihood difference for stable, low uncertainty condition = 0.051 ±
0.047 T29=5.88; for volatile, low uncertainty condition = 0.059 ± 0.061, T29=5.27; all Ps<0.0001),
while dots below the diagonal mean that imitation is favored, which occurs when the partner’s
actions are stable and token uncertainty is high (emulation-imitation likelihood difference for
stable, high uncertainty condition = -0.053 ± 0.053, T29=-5.49, P<0.0001). There was no difference
between imitation and emulation performance in volatile, high uncertainty trials (emulation-
imitation difference = 0.007 ± 0.048, T29=0.74, P=0.46).
Taken together, these analyses suggest that emulation is preferred when action volatility is high
(making action imitation learning more difficult) and when token uncertainty is low (making
emulation value computation easier); while imitation is preferred in the opposite situation.
fMRI analyses of Study 1
Two fMRI models were utilized in the analysis of the of the Study 1 fMRI data: SPM GLM1 and
SPM GLM2 (see Methods for details). Regressors were derived from each subject’s best fitting
parameters from the winning arbitration Model 7, allowing to test for the presence of three types
of signals. Emulation-related signals included trial-by-trial emulation reliability, update of token
values (KL divergence) at the time of feedback, and entropy over token values at the time of initial
slot machine presentation during observe trials. Imitation-related signals included trial-by-trial
imitation reliability, and imitation action value difference at the time of initial slot machine
presentation during observe trials. Finally, arbitration-related signals included the trial-by-trial
difference in reliability (emulation – imitation), which is assumed to drive arbitration, and the
chosen action value at the time of choice on play trials. The effect of most of these regressors were
assessed in SPM GLM1. SPM GLM2 tested for the separate effects of imitation reliability and
emulation reliability instead of the reliability difference regressor.
.CC-BY-NC-ND 4.0 International licenseIt is made available under a was not peer-reviewed) is the author/funder, who has granted bioRxiv a license to display the preprint in perpetuity.
The copyright holder for this preprint (which. http://dx.doi.org/10.1101/828723doi: bioRxiv preprint first posted online Nov. 4, 2019;

10
Figure 3. Modulation of arbitration by volatility and uncertainty. (A-B) Arbitration weight
values, which represent the probability of relying on emulation over imitation on a given trial,
were extracted from the winning arbitration model for each trial and averaged for each subject and
each condition. The plots show, for Study 1 (A) and Study 2 (B), the mean and distribution of the
arbitration weight for two conditions of interest: volatile/low uncertainty trials (green), and
stable/high uncertainty trials (yellow). Dots represent individual subjects and the black bar
represents the mean arbitration weight value for each condition. T-test: * P<0.0001; results were
also confirmed using non-parametric permutation tests. (C-D) Mean per-trial emulation and
imitation likelihood, extracted from Model 2 and Model 3 respectively, are plotted against each
other separately for each of the 4 task conditions, showing that in both Study 1 (C) and Study 2
(D), most participants favor emulation (dots above the diagonal) when uncertainty is low (green
& pink plots) but switch to imitation (dots below the diagonal) when the environment is stable and
uncertainty is high (yellow plot).
Eight regions of interests (ROIs) were defined based on previous literature on observational
learning, social inference and arbitration processes during learning 15,27 (see Methods for details).
The effect of the different regressors were assessed in each ROI by extracting the mean signal
across all voxels in the ROI for each subject, then averaging across subjects (Table S1). T-tests
were performed to establish significance, and were confirmed with non-parametric permutation
tests (with 10,000 permutations) in all ROI analyses, since data were not always normally
distributed across the samples. Because the goal of this ROI analysis was to generate hypotheses
.CC-BY-NC-ND 4.0 International licenseIt is made available under a was not peer-reviewed) is the author/funder, who has granted bioRxiv a license to display the preprint in perpetuity.
The copyright holder for this preprint (which. http://dx.doi.org/10.1101/828723doi: bioRxiv preprint first posted online Nov. 4, 2019;
11
to be confirmed in Study 2, we did not correct for multiple comparisons across the different ROIs.
Instead, in our subsequent pre-registration for Study 2, we selected significant ROIs in Study 1 to
restrict the space of regions to examine in Study 2. In addition to the ROI analysis, whole-brain
group-level T-maps were evaluated, and uploaded on NeuroVault
(https://neurovault.org/collections/UBXVWSMN/), before the collection of Study 2 data.
Significant activation clusters for Study 1 are reported in Table S2. Significant clusters were
identified and saved as functional regions of interest for later examination in Study 2. Results
derived from both analyses are presented in Fig. 4 for arbitration signals, Fig. 5 for emulation
signals, and Fig. 6 for imitation signals.
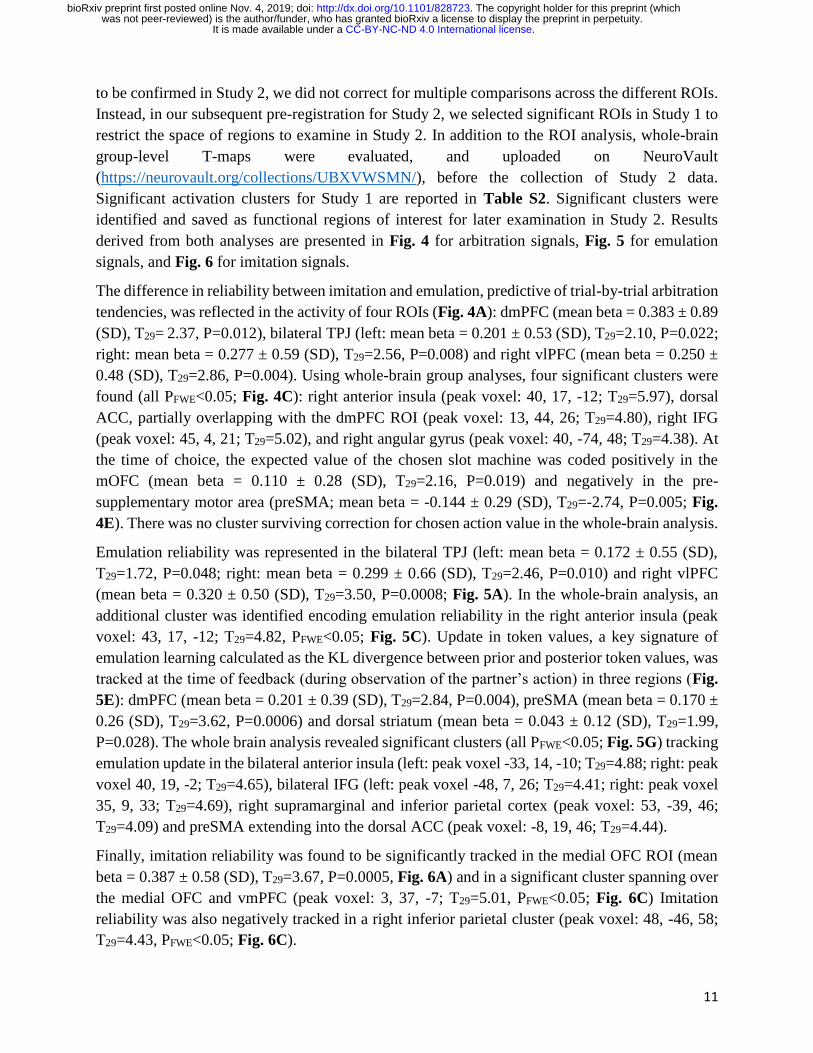
The difference in reliability between imitation and emulation, predictive of trial-by-trial arbitration
tendencies, was reflected in the activity of four ROIs (Fig. 4A): dmPFC (mean beta = 0.383 ± 0.89
(SD), T29= 2.37, P=0.012), bilateral TPJ (left: mean beta = 0.201 ± 0.53 (SD), T29=2.10, P=0.022;
right: mean beta = 0.277 ± 0.59 (SD), T29=2.56, P=0.008) and right vlPFC (mean beta = 0.250 ±
0.48 (SD), T29=2.86, P=0.004). Using whole-brain group analyses, four significant clusters were
found (all PFWE<0.05; Fig. 4C): right anterior insula (peak voxel: 40, 17, -12; T29=5.97), dorsal
ACC, partially overlapping with the dmPFC ROI (peak voxel: 13, 44, 26; T29=4.80), right IFG
(peak voxel: 45, 4, 21; T29=5.02), and right angular gyrus (peak voxel: 40, -74, 48; T29=4.38). At
the time of choice, the expected value of the chosen slot machine was coded positively in the
mOFC (mean beta = 0.110 ± 0.28 (SD), T29=2.16, P=0.019) and negatively in the pre-
supplementary motor area (preSMA; mean beta = -0.144 ± 0.29 (SD), T29=-2.74, P=0.005; Fig.
4E). There was no cluster surviving correction for chosen action value in the whole-brain analysis.
Emulation reliability was represented in the bilateral TPJ (left: mean beta = 0.172 ± 0.55 (SD),
T29=1.72, P=0.048; right: mean beta = 0.299 ± 0.66 (SD), T29=2.46, P=0.010) and right vlPFC
(mean beta = 0.320 ± 0.50 (SD), T29=3.50, P=0.0008; Fig. 5A). In the whole-brain analysis, an
additional cluster was identified encoding emulation reliability in the right anterior insula (peak
voxel: 43, 17, -12; T29=4.82, PFWE<0.05; Fig. 5C). Update in token values, a key signature of
emulation learning calculated as the KL divergence between prior and posterior token values, was
tracked at the time of feedback (during observation of the partner’s action) in three regions (Fig.
5E): dmPFC (mean beta = 0.201 ± 0.39 (SD), T29=2.84, P=0.004), preSMA (mean beta = 0.170 ±
0.26 (SD), T29=3.62, P=0.0006) and dorsal striatum (mean beta = 0.043 ± 0.12 (SD), T29=1.99,
P=0.028). The whole brain analysis revealed significant clusters (all PFWE<0.05; Fig. 5G) tracking
emulation update in the bilateral anterior insula (left: peak voxel -33, 14, -10; T29=4.88; right: peak
voxel 40, 19, -2; T29=4.65), bilateral IFG (left: peak voxel -48, 7, 26; T29=4.41; right: peak voxel
35, 9, 33; T29=4.69), right supramarginal and inferior parietal cortex (peak voxel: 53, -39, 46;
T29=4.09) and preSMA extending into the dorsal ACC (peak voxel: -8, 19, 46; T29=4.44).
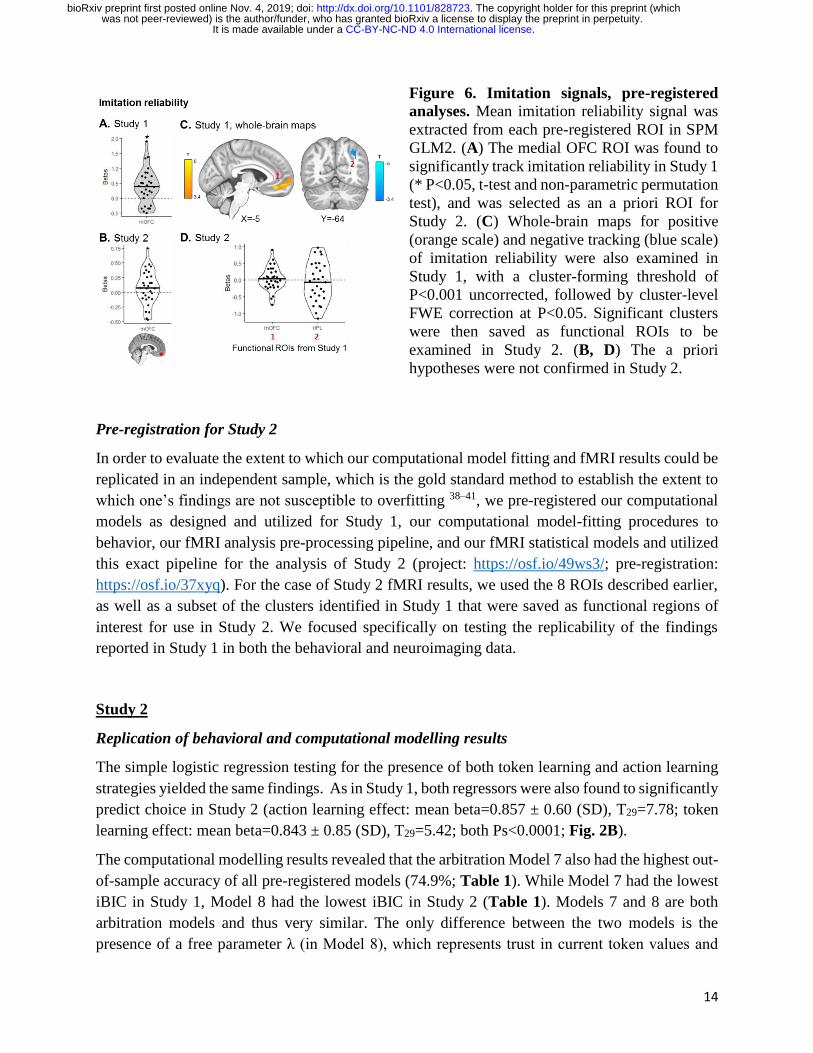
Finally, imitation reliability was found to be significantly tracked in the medial OFC ROI (mean
beta = 0.387 ± 0.58 (SD), T29=3.67, P=0.0005, Fig. 6A) and in a significant cluster spanning over
the medial OFC and vmPFC (peak voxel: 3, 37, -7; T29=5.01, PFWE<0.05; Fig. 6C) Imitation
reliability was also negatively tracked in a right inferior parietal cluster (peak voxel: 48, -46, 58;
T29=4.43, PFWE<0.05; Fig. 6C).
.CC-BY-NC-ND 4.0 International licenseIt is made available under a was not peer-reviewed) is the author/funder, who has granted bioRxiv a license to display the preprint in perpetuity.
The copyright holder for this preprint (which. http://dx.doi.org/10.1101/828723doi: bioRxiv preprint first posted online Nov. 4, 2019;
12
For completeness, all the pre-registered ROI results are reported in Table S1 and Figure S1, and
whole-brain analyses in Table S2. The statistical significance of all ROI results remained
unchanged when using non-parametric permutation tests.
Figure 4. Arbitration signals, pre-registered analyses. For each arbitration contrast of interest
in SPM GLM1 – reliability difference (A-D) and chosen action value (E-F) – mean signal was
extracted from each pre-registered ROI. (A, E) Regions with significant signals in Study 1, plotted
in grey, were selected as hypotheses and a priori ROIs for Study 2. (C) Whole-brain maps for the
reliability difference signal were also examined in Study 1, with a cluster-forming threshold of
P<0.001 uncorrected, followed by cluster-level FWE correction at P<0.05. Significant clusters
were then saved as functional ROIs to be examined in Study 2. Note that there was no cluster
surviving correction for the chosen value signal. (B, D, F) Green plots represent significant effects
in Study 2, confirming the a priori hypothesis from Study 1. White plots represent hypotheses that
were not confirmed in Study 2. Dots represent individual subjects and the black bar represents the
mean beta estimate for each effect. T-tests: * P<0.05, † P=0.052. The same results were found
using non-parametric permutation tests.
.CC-BY-NC-ND 4.0 International licenseIt is made available under a was not peer-reviewed) is the author/funder, who has granted bioRxiv a license to display the preprint in perpetuity.
The copyright holder for this preprint (which. http://dx.doi.org/10.1101/828723doi: bioRxiv preprint first posted online Nov. 4, 2019;
13
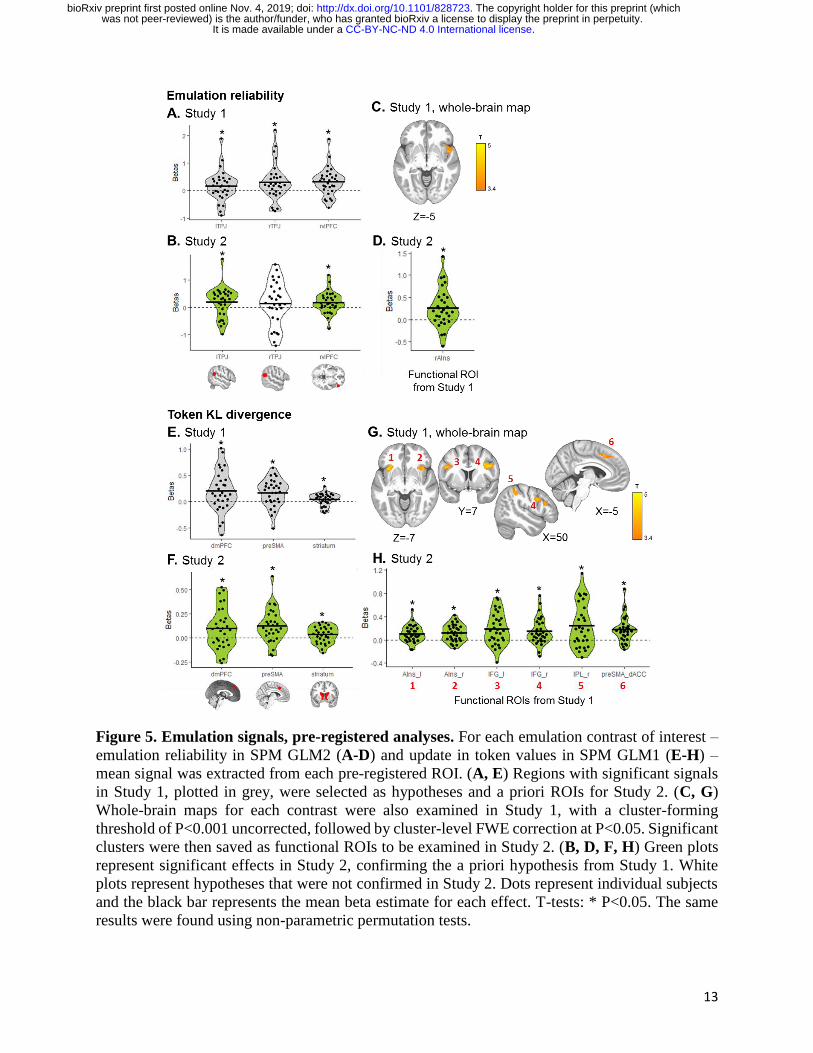
Figure 5. Emulation signals, pre-registered analyses. For each emulation contrast of interest –
emulation reliability in SPM GLM2 (A-D) and update in token values in SPM GLM1 (E-H) –
mean signal was extracted from each pre-registered ROI. (A, E) Regions with significant signals
in Study 1, plotted in grey, were selected as hypotheses and a priori ROIs for Study 2. (C, G)
Whole-brain maps for each contrast were also examined in Study 1, with a cluster-forming
threshold of P<0.001 uncorrected, followed by cluster-level FWE correction at P<0.05. Significant
clusters were then saved as functional ROIs to be examined in Study 2. (B, D, F, H) Green plots
represent significant effects in Study 2, confirming the a priori hypothesis from Study 1. White
plots represent hypotheses that were not confirmed in Study 2. Dots represent individual subjects
and the black bar represents the mean beta estimate for each effect. T-tests: * P<0.05. The same
results were found using non-parametric permutation tests.
.CC-BY-NC-ND 4.0 International licenseIt is made available under a was not peer-reviewed) is the author/funder, who has granted bioRxiv a license to display the preprint in perpetuity.
The copyright holder for this preprint (which. http://dx.doi.org/10.1101/828723doi: bioRxiv preprint first posted online Nov. 4, 2019;
14
Figure 6. Imitation signals, pre-registered
analyses. Mean imitation reliability signal was
extracted from each pre-registered ROI in SPM
GLM2. (A) The medial OFC ROI was found to
significantly track imitation reliability in Study 1
(* P<0.05, t-test and non-parametric permutation
test), and was selected as an a priori ROI for
Study 2. (C) Whole-brain maps for positive
(orange scale) and negative tracking (blue scale)
of imitation reliability were also examined in
Study 1, with a cluster-forming threshold of
P<0.001 uncorrected, followed by cluster-level
FWE correction at P<0.05. Significant clusters
were then saved as functional ROIs to be
examined in Study 2. (B, D) The a priori
hypotheses were not confirmed in Study 2.
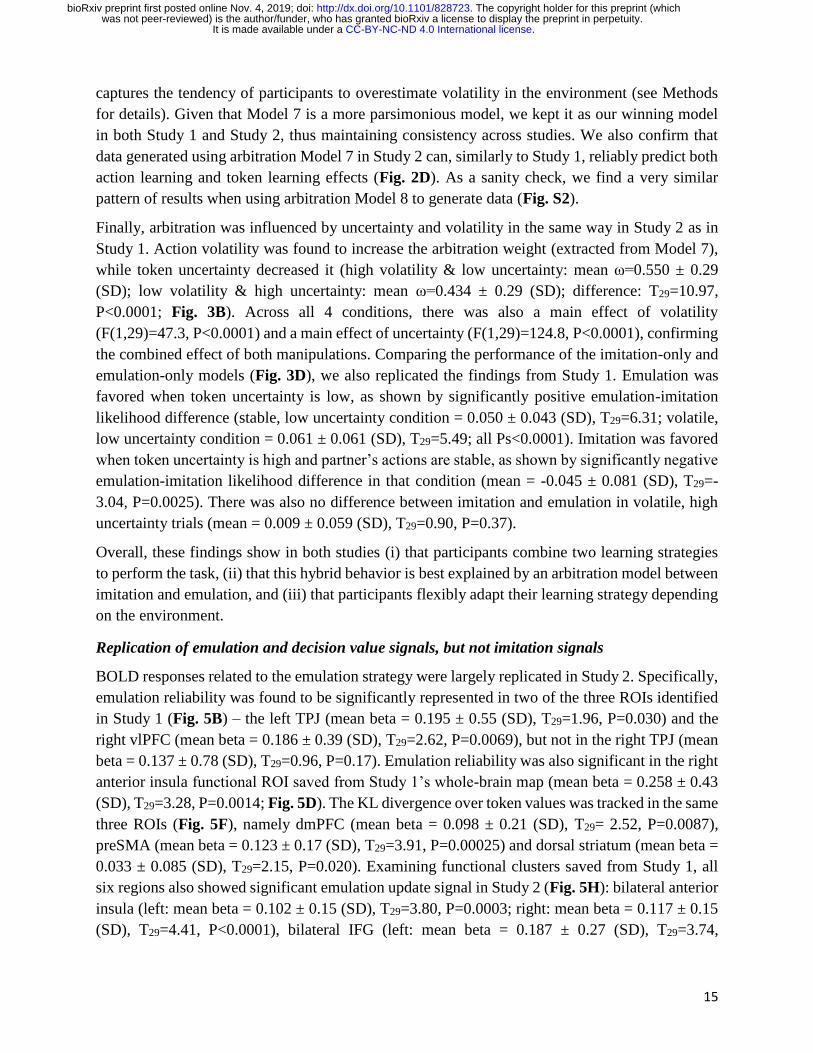
Pre-registration for Study 2
In order to evaluate the extent to which our computational model fitting and fMRI results could be
replicated in an independent sample, which is the gold standard method to establish the extent to
which one’s findings are not susceptible to overfitting 38–41, we pre-registered our computational
models as designed and utilized for Study 1, our computational model-fitting procedures to
behavior, our fMRI analysis pre-processing pipeline, and our fMRI statistical models and utilized
this exact pipeline for the analysis of Study 2 (project: https://osf.io/49ws3/; pre-registration:
https://osf.io/37xyq). For the case of Study 2 fMRI results, we used the 8 ROIs described earlier,
as well as a subset of the clusters identified in Study 1 that were saved as functional regions of
interest for use in Study 2. We focused specifically on testing the replicability of the findings
reported in Study 1 in both the behavioral and neuroimaging data.
Study 2
Replication of behavioral and computational modelling results
The simple logistic regression testing for the presence of both token learning and action learning
strategies yielded the same findings. As in Study 1, both regressors were also found to significantly
predict choice in Study 2 (action learning effect: mean beta=0.857 ± 0.60 (SD), T29=7.78; token
learning effect: mean beta=0.843 ± 0.85 (SD), T29=5.42; both Ps<0.0001; Fig. 2B).
The computational modelling results revealed that the arbitration Model 7 also had the highest out-
of-sample accuracy of all pre-registered models (74.9%; Table 1). While Model 7 had the lowest
iBIC in Study 1, Model 8 had the lowest iBIC in Study 2 (Table 1). Models 7 and 8 are both
arbitration models and thus very similar. The only difference between the two models is the
presence of a free parameter λ (in Model 8), which represents trust in current token values and
.CC-BY-NC-ND 4.0 International licenseIt is made available under a was not peer-reviewed) is the author/funder, who has granted bioRxiv a license to display the preprint in perpetuity.
The copyright holder for this preprint (which. http://dx.doi.org/10.1101/828723doi: bioRxiv preprint first posted online Nov. 4, 2019;
15
captures the tendency of participants to overestimate volatility in the environment (see Methods
for details). Given that Model 7 is a more parsimonious model, we kept it as our winning model
in both Study 1 and Study 2, thus maintaining consistency across studies. We also confirm that
data generated using arbitration Model 7 in Study 2 can, similarly to Study 1, reliably predict both
action learning and token learning effects (Fig. 2D). As a sanity check, we find a very similar
pattern of results when using arbitration Model 8 to generate data (Fig. S2).
Finally, arbitration was influenced by uncertainty and volatility in the same way in Study 2 as in
Study 1. Action volatility was found to increase the arbitration weight (extracted from Model 7),
while token uncertainty decreased it (high volatility & low uncertainty: mean ω=0.550 ± 0.29
(SD); low volatility & high uncertainty: mean ω=0.434 ± 0.29 (SD); difference: T29=10.97,
P<0.0001; Fig. 3B). Across all 4 conditions, there was also a main effect of volatility
(F(1,29)=47.3, P<0.0001) and a main effect of uncertainty (F(1,29)=124.8, P<0.0001), confirming
the combined effect of both manipulations. Comparing the performance of the imitation-only and
emulation-only models (Fig. 3D), we also replicated the findings from Study 1. Emulation was
favored when token uncertainty is low, as shown by significantly positive emulation-imitation
likelihood difference (stable, low uncertainty condition = 0.050 ± 0.043 (SD), T29=6.31; volatile,
low uncertainty condition = 0.061 ± 0.061 (SD), T29=5.49; all Ps<0.0001). Imitation was favored
when token uncertainty is high and partner’s actions are stable, as shown by significantly negative
emulation-imitation likelihood difference in that condition (mean = -0.045 ± 0.081 (SD), T29=-
3.04, P=0.0025). There was also no difference between imitation and emulation in volatile, high
uncertainty trials (mean = 0.009 ± 0.059 (SD), T29=0.90, P=0.37).
Overall, these findings show in both studies (i) that participants combine two learning strategies
to perform the task, (ii) that this hybrid behavior is best explained by an arbitration model between
imitation and emulation, and (iii) that participants flexibly adapt their learning strategy depending
on the environment.
Replication of emulation and decision value signals, but not imitation signals
BOLD responses related to the emulation strategy were largely replicated in Study 2. Specifically,
emulation reliability was found to be significantly represented in two of the three ROIs identified
in Study 1 (Fig. 5B) – the left TPJ (mean beta = 0.195 ± 0.55 (SD), T29=1.96, P=0.030) and the
right vlPFC (mean beta = 0.186 ± 0.39 (SD), T29=2.62, P=0.0069), but not in the right TPJ (mean
beta = 0.137 ± 0.78 (SD), T29=0.96, P=0.17). Emulation reliability was also significant in the right
anterior insula functional ROI saved from Study 1’s whole-brain map (mean beta = 0.258 ± 0.43
(SD), T29=3.28, P=0.0014; Fig. 5D). The KL divergence over token values was tracked in the same
three ROIs (Fig. 5F), namely dmPFC (mean beta = 0.098 ± 0.21 (SD), T29= 2.52, P=0.0087),
preSMA (mean beta = 0.123 ± 0.17 (SD), T29=3.91, P=0.00025) and dorsal striatum (mean beta =
0.033 ± 0.085 (SD), T29=2.15, P=0.020). Examining functional clusters saved from Study 1, all
six regions also showed significant emulation update signal in Study 2 (Fig. 5H): bilateral anterior
insula (left: mean beta = 0.102 ± 0.15 (SD), T29=3.80, P=0.0003; right: mean beta = 0.117 ± 0.15
(SD), T29=4.41, P<0.0001), bilateral IFG (left: mean beta = 0.187 ± 0.27 (SD), T29=3.74,
.CC-BY-NC-ND 4.0 International licenseIt is made available under a was not peer-reviewed) is the author/funder, who has granted bioRxiv a license to display the preprint in perpetuity.
The copyright holder for this preprint (which. http://dx.doi.org/10.1101/828723doi: bioRxiv preprint first posted online Nov. 4, 2019;

16
P=0.0004; right: mean beta = 0.147 ± 0.23 (SD), T29=3.49, P=0.0008), right inferior parietal
extending into supramarginal cortex (mean beta = 0.246 ± 0.38 (SD), T29=3.56, P=0.0007), and
preSMA/dorsal ACC (mean beta = 0.174 ± 0.22 (SD), T29=4.30, P<0.0001). Entropy over token
values, at the time of initial slot machine presentation on observe trials, was also found to be
negatively represented in the mOFC (Study 1: mean beta = -0.080 ± 0.25 (SD), T29=-1.73,
P=0.047; Study 2: mean beta = -0.107 ± 0.19 (SD), T29=-3.08, P=0.0023; Fig. S1A-B), suggesting
the mOFC is more active when token values are more certain.
Decision values signals, calculated as the expected value of the chosen slot machine on play trials,
recruited the same ROIs in Study 2 (Fig. 4F), with positive value coding in mOFC (mean beta =
0.109 ± 0.22 (SD), T29=2.70, P=0.0057) and negative value coding in preSMA (mean beta = -
0.135 ± 0.22 (SD), T29=-3.38, P=0.0011). The reliability difference between the two strategies,
assumed to drive the arbitration process, was found to replicate in two of the four ROIs identified
in Study 1 (Fig. 4B) – the left TPJ (mean beta = 0.182 ± 0.38 (SD), T29=2.63, P=0.0068) and the
dmPFC (mean beta = 0.228 ± 0.54 (SD), T29=2.31, P=0.014) – as well as in functional clusters in
the dorsal ACC (mean beta = 0.089 ± 0.23 (SD), T29=2.09, P=0.023), right anterior insula (mean
beta = 0.099 ± 0.28 (SD), T29=1.95, P=0.031), IFG (mean beta = 0.173 ± 0.51 (SD), T29=1.87,
P=0.036) and angular gyrus, at trend level (mean beta = 0.225 ± 0.74 (SD), T29=1.67, P=0.052;
Fig. 4D).
However, when examining more closely whether this signal was a true difference signal, by
separately extracting emulation and imitation reliabilities from these ROIs, we did not find robust
evidence for negative tracking of imitation reliability or significant representation of the two
reliability signals in opposite directions in either Study 1 or 2 (Fig. S3). Instead, reliability
difference signals were mainly driven by positive tracking of emulation reliability, suggesting that
the arbitration mechanism might rely more on emulation reliability than on imitation reliability, at
least in so far as it is implemented in the brain. In addition, all signals pertaining to the imitation
strategy, namely imitation reliability (all T29<1.49, all Ps>0.15; Fig. 6B and 6D) and the difference
in imitation action values (see Fig. S1D and Table S2 for details) did not replicate well in Study
2. Given our experimental evidence, we concluded that the component of our original model
focusing on imitation may not be as justified as the emulation component. Furthermore, the
findings also suggested to us that the arbitration mechanism may rely less on imitation reliability
than originally hypothesized. Armed with these conclusions, we decided to revisit our
computational model and to re-analyze both behavioral and neuroimaging datasets in order to test
the possibility of an alternative computational modeling strategy for imitation and for the
arbitration between the two mechanisms. This new analysis is described as exploratory since it is
distinct from the confirmatory analyses reported in Study 2. Importantly, however, because we are
still able to test our new model and analysis on two independent datasets, we can confirm the
robustness and replicability of our findings.
.CC-BY-NC-ND 4.0 International licenseIt is made available under a was not peer-reviewed) is the author/funder, who has granted bioRxiv a license to display the preprint in perpetuity.
The copyright holder for this preprint (which. http://dx.doi.org/10.1101/828723doi: bioRxiv preprint first posted online Nov. 4, 2019;
17
Exploratory analyses: arbitration between emulation and simpler (1-step) imitation strategy
Behavioral evidence
Given that imitation-related signals were not reliably found across the two studies, we
hypothesized that imitation learning may be implemented differently, both behaviorally and in the
brain. Specifically, in our pre-registered analyses, we initially modelled action imitation as an RL
model, which computes action values from multiple trials of experience, but imitation could be as
simple as just copying the most recent action, rather than slowly computing values over time. We
thus tested this possibility of a simpler imitation strategy (“1-step imitation”), whereby out of the
two available actions on a given play trial, the action that was most recently performed by the
partner is repeated (see Methods for details). Emulation action values and emulation reliability
were computed as before, and arbitration was assumed to be driven by the reliability of emulation
only. Thus, the resulting arbitration process was such that if the reliability of emulation is high,
participants will be more likely to rely on emulation, whereas if it is low, they will be more likely
to default to imitation.
In both studies, this new arbitration model (Model 10) was found to perform better than the pre-
registered winning model (Model 7), with higher out-of-sample accuracy (Study 1: 76.5%, Study
2: 76.2%) and lower iBIC values (Table 1). Given that this simpler imitation strategy does not
require a learning rate parameter, Model 10 is more parsimonious than Model 7, which could in
part account for the lower iBIC values. However, the improved out-of-sample performance for
Model 10 is a key result here, as it suggests that Model 10 affords better out-of-sample
generalization than Model 7, indicating that the difference in model performance is not just due to
model complexity alone. A possible explanation for this finding is that Model 7 was overfitting,
or that Model 10 offers a better computational distinction between the two strategies. Using data
generated by this new arbitration model, we were also able to recover both action learning and
token learning effects obtained from a simple logistic regression analysis (Fig S4), thus confirming
the validity of this new, more parsimonious model. This suggests that participants’ hybrid behavior
on the task is better explained by an arbitration process between inferring the valuable token
(emulation) and repeating the partner’s most recent action (1-step imitation) than by an arbitration
process in which imitation is implemented as a reinforcement learning mechanism over the recent
history of actions.
Neuroimaging evidence
The next question is whether neuroimaging evidence would support this proposed arbitration
process. Specifically, this new arbitration model makes the following predictions. Trial-by-trial
emulation reliability should be represented in the brain, given that it is assumed to drive the
arbitration process and the likelihood of relying on emulation or defaulting to imitation. Learning
signals specific to each strategy should be observed at the time of feedback, when the partner’s
action is shown. For emulation, this update signal takes the form of the KL divergence between
prior and posterior token value, as defined in the pre-registered analyses. For imitation, this signal
was defined as tracking whether or not the partner’s current action repeats the most recent past
.CC-BY-NC-ND 4.0 International licenseIt is made available under a was not peer-reviewed) is the author/funder, who has granted bioRxiv a license to display the preprint in perpetuity.
The copyright holder for this preprint (which. http://dx.doi.org/10.1101/828723doi: bioRxiv preprint first posted online Nov. 4, 2019;
18
action. Our prediction is that an update signal should occur when there is an action change, i.e. the
most recent action is available on the current trial but the partner chooses a different option. To
test these predictions, we defined an additional model of the fMRI BOLD signal, SPM GLM3 (see
Methods for details).
Using Bayesian model selection (BMS, see Methods for details), we first confirmed that this new
SPM model (SPM GLM3) performed better than the pre-registered model testing for neural
signatures of imitation implemented as an RL mechanism (SPM GLM2). In both studies, GLM3
was associated with the highest exceedance probability averaged across all grey matter voxels
(Study 1: 0.861; Study 2: 0.946) and with a vast majority of grey matter voxels with an exceedance
probability higher than 0.75 (Fig. S5). When examining the average exceedance probabilities in
our set of pre-registered ROIs, evidence was also overwhelmingly in favor of SPM GLM3 (Table
S3). This indicates that this new SPM GLM, based on the best performing model of behavior, also
explained trial-by-trial variations in BOLD signal best.
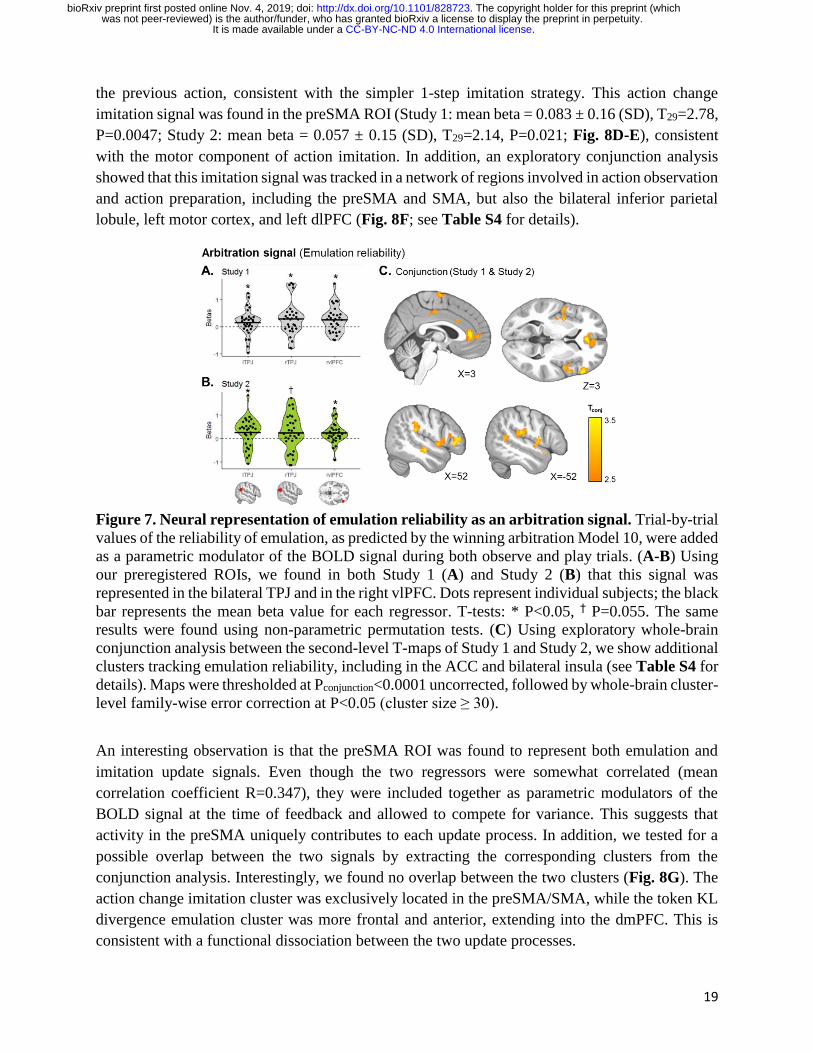
Arbitration in this new model is driven by variations in the reliability of emulation. We thus tested
whether these variations were represented in the brain. Unsurprisingly, given that the calculation
of emulation reliability did not change from the pre-registered analyses, we found very similar
results, and robust representation of this signal driving arbitration between the two strategies. In
both studies emulation reliability was found to be represented in the same three ROIs: the right
vlPFC (Study 1: mean beta = 0.253 ± 0.48 (SD), T29=2.90, P=0.0035; Study 2: mean beta = 0.232
± 0.45 (SD), T29=2.84, P=0.0041), the left TPJ (Study 1: mean beta = 0.154 ± 0.47 (SD), T29=1.80,
P=0.041; Study 2: mean beta = 0.252 ± 0.62 (SD), T29=2.23, P=0.017), and the right TPJ, albeit
only at trend level in Study 2 (Study 1: mean beta = 0.284 ± 0.62 (SD), T29=2.52, P=0.0088; Study
2: mean beta = 0.234 ± 0.78 (SD), T29=1.65, P=0.055; Fig. 7A-B). Exploratory conjunction
analysis additionally revealed significant clusters in the ACC, bilateral insula, and supramarginal
gyrus (Fig. 7C and Table S4).
We then examined update signals specific to each strategy at the time of feedback, when the
participant observes the partner’s action and can update their estimates of token values and/or of
which action is best to perform. As expected given the pre-registered analyses, the neural signature
of emulation inference, calculated as the KL divergence over inferred token values, showed a very
similar pattern to the pre-registered results, with significant effects in the dmPFC (Study 1: mean
beta = 0.164 ± 0.34 (SD), T29=2.63, P=0.0067; Study 2: mean beta = 0.112 ± 0.23 (SD), T29=2.72,
P=0.0054), preSMA (Study 1: mean beta = 0.135 ± 0.24 (SD), T29=3.09, P=0.0022; Study 2: mean
beta = 0.093 ± 0.17 (SD), T29=2.96, P=0.0031), right TPJ, albeit only at trend in Study 2 (Study 1:
mean beta = 0.062 ± 0.18 (SD), T29=1.84, P=0.038; Study 2: mean beta = 0.073 ± 0.24 (SD),
T29=1.66, P=0.054), and dorsal striatum (Study 1: mean beta = 0.043 ± 0.12 (SD), T29=2.00,
P=0.027; Study 2: mean beta = 0.028 ± 0.075 (SD), T29=2.07, P=0.024; Fig. 8A-B). Exploratory
conjunction analysis confirmed these clusters, as well as additional clusters in the bilateral insula,
inferior frontal gyrus, and other frontoparietal regions (Fig. 8C; see Table S4 for details).
However, contrary to the pre-registered findings in which imitation signals were not replicated,
here we find robust tracking of whether the partner’s current action marks a change or a repeat of
.CC-BY-NC-ND 4.0 International licenseIt is made available under a was not peer-reviewed) is the author/funder, who has granted bioRxiv a license to display the preprint in perpetuity.
The copyright holder for this preprint (which. http://dx.doi.org/10.1101/828723doi: bioRxiv preprint first posted online Nov. 4, 2019;
19
the previous action, consistent with the simpler 1-step imitation strategy. This action change
imitation signal was found in the preSMA ROI (Study 1: mean beta = 0.083 ± 0.16 (SD), T29=2.78,
P=0.0047; Study 2: mean beta = 0.057 ± 0.15 (SD), T29=2.14, P=0.021; Fig. 8D-E), consistent
with the motor component of action imitation. In addition, an exploratory conjunction analysis
showed that this imitation signal was tracked in a network of regions involved in action observation
and action preparation, including the preSMA and SMA, but also the bilateral inferior parietal
lobule, left motor cortex, and left dlPFC (Fig. 8F; see Table S4 for details).
Figure 7. Neural representation of emulation reliability as an arbitration signal. Trial-by-trial
values of the reliability of emulation, as predicted by the winning arbitration Model 10, were added
as a parametric modulator of the BOLD signal during both observe and play trials. (A-B) Using
our preregistered ROIs, we found in both Study 1 (A) and Study 2 (B) that this signal was
represented in the bilateral TPJ and in the right vlPFC. Dots represent individual subjects; the black
bar represents the mean beta value for each regressor. T-tests: * P<0.05, † P=0.055. The same
results were found using non-parametric permutation tests. (C) Using exploratory whole-brain
conjunction analysis between the second-level T-maps of Study 1 and Study 2, we show additional
clusters tracking emulation reliability, including in the ACC and bilateral insula (see Table S4 for
details). Maps were thresholded at Pconjunction<0.0001 uncorrected, followed by whole-brain cluster-
level family-wise error correction at P<0.05 (cluster size ≥ 30).
An interesting observation is that the preSMA ROI was found to represent both emulation and
imitation update signals. Even though the two regressors were somewhat correlated (mean
correlation coefficient R=0.347), they were included together as parametric modulators of the
BOLD signal at the time of feedback and allowed to compete for variance. This suggests that
activity in the preSMA uniquely contributes to each update process. In addition, we tested for a
possible overlap between the two signals by extracting the corresponding clusters from the
conjunction analysis. Interestingly, we found no overlap between the two clusters (Fig. 8G). The
action change imitation cluster was exclusively located in the preSMA/SMA, while the token KL
divergence emulation cluster was more frontal and anterior, extending into the dmPFC. This is
consistent with a functional dissociation between the two update processes.
.CC-BY-NC-ND 4.0 International licenseIt is made available under a was not peer-reviewed) is the author/funder, who has granted bioRxiv a license to display the preprint in perpetuity.
The copyright holder for this preprint (which. http://dx.doi.org/10.1101/828723doi: bioRxiv preprint first posted online Nov. 4, 2019;

20
Figure 8. Imitation and emulation update signals during observation. KL divergence over
token values (necessary for emulation learning) and changes in the partner’s action relative to the
previous trial (necessary for imitation learning) were added as parametric modulators of the BOLD
signal during feedback, when the partner’s action is shown. The two regressors competed for
variance within the same model. (A, B, D, E) Using our preregistered ROIs, we found in both
studies significant emulation update signals in the dmPFC, preSMA, right TPJ and dorsal striatum
(A-B) and significant action imitation signals in the preSMA ROI (D-E). Dots represent individual
subjects; the black bar represents the mean beta value for each regressor. T-tests: * P<0.05, †
P=0.054. The same results were found using non-parametric permutation tests. (C, F) Using
exploratory whole-brain conjunction analysis between the second-level T-maps of Study 1 and
Study 2, we show additional clusters tracking emulation (C) or imitation (F) update (see Table S4
for details). Maps were thresholded at Pconjunction<0.0001 uncorrected, followed by whole-brain
cluster-level family-wise error correction at P<0.05. (G) Given that both imitation and emulation
update signals recruited the preSMA ROI, we tested for a possible overlap between the two signals
and find that the emulation update signal (green) is more anterior and ventral than the imitation
update signal (red) with no overlap between the two.
.CC-BY-NC-ND 4.0 International licenseIt is made available under a was not peer-reviewed) is the author/funder, who has granted bioRxiv a license to display the preprint in perpetuity.
The copyright holder for this preprint (which. http://dx.doi.org/10.1101/828723doi: bioRxiv preprint first posted online Nov. 4, 2019;

21
Other signals tested in this new SPM GLM3 were also found to be significant across studies (Fig.
S6, Table S4). For example, during initial slot machine presentation on both observe and play
trials, a vast network of regions was recruited when the partner’s most recent action was no longer
available on the current trial. These included the dmPFC and preSMA ROIs (Fig. S6A), as well as
the anterior insula, IFG, caudate nucleus, occipital and parietal regions (Table S4). At the time of
choice on play trials, the propensity to choose according to imitation was negatively associated
with preSMA activity (Fig. S6B), and the propensity to choose according to emulation was
positively associated with mOFC activity (Fig. S6C). The mOFC and ACC were also found to
track the value of the token obtained at the end of each trial (Fig S6D), consistent with the typical
neural signature of value.
Discussion
Across two independent fMRI studies, we provide neuro-computational evidence for an arbitration
process between two observational learning strategies: imitation and emulation. We find that
depending on the conditions of the environment, people flexibly adapt which strategy they
preferentially rely on. Behavior was best explained by a computational model in which choice is
a hybrid combination of imitation choice propensity and emulation choice propensity, weighted
by a controller driven by the reliability of emulation. Using model comparison, we show that this
arbitration model performed better than a model implementing each strategy individually. To our
knowledge, these findings represent the first time an arbitration process between two learning
strategies has been reported in the observational domain, in which instead of learning from
experiencing outcomes, people learn from observing another agent.
Our fMRI results show that learning signals associated with each strategy were represented in
distinct brain networks, when feedback is provided (i.e. during observation of the other agent’s
action). When the observed agent chose a different action than on the previous trial, activity in the
premotor cortex and inferior parietal cortex increased, possibly reflecting an update in the now
preferred action according to imitation. Interestingly, this pattern of activity substantially overlaps
with regions of the human mirror neuron system 8,10,12, consistent with the assumption that
imitation learning relies on observing an action and repeating that same action in the future. The
update in token values, calculated as the KL divergence between prior and posterior values, was
reflected in a network of regions including the dmPFC, bilateral insula, right TPJ, IFG and dorsal
striatum. Some of these regions (dmPFC and right TPJ) likely reflect an involvement of
mentalizing abilities, in which the other agent’s goal has to be represented 16. The involvement of
additional regions such as the dorsal striatum and IFG is consistent with previous literature on
social learning, which has implicated these regions in inverse reinforcement learning 15, learning
about another agent’s expertise 20, or tracking vicarious reward prediction errors 34. The IFG and
anterior insula have also been found to play a role in attentional and executive control 42,43 and
may thus reflect the engagement of emulation as a more complex strategy requiring increased
cognitive and attentional resources. The fact that those distinct signals were identified at the same
.CC-BY-NC-ND 4.0 International licenseIt is made available under a was not peer-reviewed) is the author/funder, who has granted bioRxiv a license to display the preprint in perpetuity.
The copyright holder for this preprint (which. http://dx.doi.org/10.1101/828723doi: bioRxiv preprint first posted online Nov. 4, 2019;
22
time point in the task suggests that the brain is keeping track of the decision values associated with
each strategy in parallel, allowing individuals to deploy either strategy when needed.
The arbitration process, which in our final revised model is proposed to be driven exclusively by
trial-by-trial variations in the reliability of emulation, was found to be correlated with BOLD
responses in the right vlPFC, ACC, and bilateral TPJ. These findings suggest that these regions
may be involved in implementing the arbitration process between the two OL strategies.
Specifically, they may act as a hub in which information relevant to imitation learning (e.g. from
premotor or inferior parietal cortex) and information relevant to emulation learning (e.g. from
dmPFC or IFG) are dynamically integrated. Further evidence will need to be garnered for this
possibility in follow-up work. For instance, establishing the nature of the effective connectivity
between the arbitration regions and the brain regions involved in emulation and imitation
respectively would add insight into how the arbitration process might be implemented at the
network level. While beyond the scope of the present paper, this additional work can be conducted
using the same datasets acquired here. Furthermore, future work could help establish the causal
relevance of the structures identified in the arbitration process stimulating or inhibiting activity in
those structures and establishing the effects on behavioral markers of emulation and imitation. This
research agenda on OL, parallels a similar series of studies that has been conducted in the
experiential domain, to explore the causal role of brain structures in arbitrating between model-
based and model-free reinforcement-learning in the experiential domain 27,44. Interestingly, the
right vlPFC region identified here was also found to track reliability signals related to arbitration
between model-based (MB) and model-free (MF) RL in the experiential domain 27. However, in
addition to the vlPFC regions identified in MB vs MF RL arbitration, in the present study we found
evidence for other brain regions associated with the OL arbitration process not implicated in
experiential arbitration, including the bilateral TPJ. The involvement of the TPJ, could relate to
the fact that in order to compute the reliability of the emulation system, it is necessary to rely on
computational mechanisms related to inference about an agent’s goals or intentions.
A general arbitration mechanism for assigning control over behavior to different systems?
When compared with previous studies on the arbitration over MB and MF RL, our findings hint
at important generalities about how control over different systems might be implemented in the
brain. In both experiential and observational domains, it seems that uncertainty or reliability in the
predictions of the systems might be a general mechanism for implementing arbitration between
learning systems. Evidence for the use of reliability as a meta-control variable in at least two
different behavioral contexts could impose constraints on general theoretical implementations of
meta-control. If general purpose theories of meta-control assume arbitration is based on
considerations about the expected value of particular control strategies and/or estimates of
potential cognitive costs, they will have to take into consideration accumulating evidence that
uncertainty and/or reliability of particular cognitive strategies is utilized at the computational and
neural level to drive meta-control. That said, reliability of predictions need not be the only variable
utilized to drive arbitration, and indeed in a recent study we found that task complexity is also an
important variable in modulating the degree of engagement of MB and MF strategies in
.CC-BY-NC-ND 4.0 International licenseIt is made available under a was not peer-reviewed) is the author/funder, who has granted bioRxiv a license to display the preprint in perpetuity.
The copyright holder for this preprint (which. http://dx.doi.org/10.1101/828723doi: bioRxiv preprint first posted online Nov. 4, 2019;
23
experiential learning 45. We also note that in the present study, the emulation reliability signal is
minimal (and uncertainty maximal) when it is most difficult to compute which token is currently
valuable from inspecting the token distributions on the slot machines. Thus, in the present case,
cognitive difficulty is aligned with emulation (un)reliability.
At the neural level, the engagement of vlPFC in tracking both emulation reliability in the present
study and MB / MF reliability in a past study 27, suggests at least some degree of overlap in the
neural mechanisms of arbitration during observational and experiential learning. This could in turn
suggest that the vlPFC plays a much more general role in arbitration between different strategies.
One speculative idea is that this region could play a generic role in arbitrating between different
strategies across multiple cognitive domains, as well as within cognitive domains. So, perhaps this
same region might govern interactions between Pavlovian and instrumental control systems, as
well as competition or cooperation between observational and experiential learning (should the
two learning modalities provide different sources of information) as well as in mediating
arbitration between different experiential and observational learning systems. Furthermore, it
seems reasonable to postulate that arbitration doesn’t necessarily always have to involve
competition between only two candidate systems, rather such competition might (subject to
cognitive and attentional constraints), involve more than two systems. For instance, in
observational learning, competition and/or cooperation could arise between emulation, imitation
and (though not studied here) vicarious reinforcement-learning systems. Perhaps such three-way
interactions might also be mediated by the same arbitration circuitry. Such an arbitration process
could be generalized further to the selection between a multiplicity of strategies for behavioral
control such as between many-fold model-based strategies that depend on different assumptions
about state-space structure in the experiential domain 46. Future work will be needed to address all
of these exciting possibilities.
Distinct representations between imitation/emulation and model-based/model-free learning
One potential argument that could be made about the present findings is that we are merely
recapitulating previous findings on the representation of MB and MF RL and the arbitration
between them. In other words, could the computational processes we are labeling as emulation and
imitation be mere implementations of MB and MF RL in an observational learning situation? We
believe this argument does not hold water for the following reasons. First, by design, we have
excluded the possibility that a simple extension of MF RL into the observational domain could
explain the findings. In vicarious RL, an observer can co-opt the rewards experienced by another
agent as if she has experienced them herself, and subsequently deploy a model-free learning
strategy to acquire vicarious reward values for actions or stimuli 6,34. However, because in the
present study we do not reveal the current reward value of tokens to our participant observers, a
vicarious reward learning strategy cannot succeed in this situation. Vicarious RL is the closest to
MF RL in the experiential literature and has been ruled out in the present case. Instead, the
imitation strategy that we ultimately found to provide the best explanation for participant’s
behavioral and neural data involves copying the action that the participant last saw the agent
perform. This is distinct to MF RL, in that it involves learning about actions rather than rewards,
.CC-BY-NC-ND 4.0 International licenseIt is made available under a was not peer-reviewed) is the author/funder, who has granted bioRxiv a license to display the preprint in perpetuity.
The copyright holder for this preprint (which. http://dx.doi.org/10.1101/828723doi: bioRxiv preprint first posted online Nov. 4, 2019;
24
and it does not include value computation over a history of recent events, simply a repeat of the
most recent available action. Second, MB RL in the experiential domain is not typically assumed
to involve the capacity for reverse inference – inferring the hidden goals of an agent based on
observing that agent’s behavior in combination with observable information about the task
structure 15. Instead, this type of inference is often described as “inverse” reinforcement learning
in the machine learning literature 47, and constitutes a distinct class of algorithms to that of MB
RL. Third, at the neural level, regions of the brain known to implement “mentalizing”
computations, such as the TPJ, have been consistently implicated, in the present study and others 15,18,20,21, in tracking computations associated with the emulation system and/or the arbitration
process. Such brain regions are not typically identified in studies of MB RL, suggesting that at the
neural circuit level there is at least a partial distinction between them. Finally, brain regions
implicated in action imitation in the present study (premotor and inferior parietal cortex) also do
not cleanly map onto the areas involved in previous studies of reinforcement-learning whether MF
or MB. Taken together, at the computational and neural levels, our findings suggest that we are
not merely recapitulating the MB vs MF distinction.
Replicability of computational neuroimaging findings
Beyond shedding light on the implementation of arbitration in observational learning, the present
study is noteworthy for methodological reasons. Although replication is often recognized as the
bed-rock for validation of scientific claims 38,39,41, inclusion of within-paper replications of fMRI
studies is rare, perhaps because of how expensive data collection is for fMRI. Furthermore, for
both computational model fitting and perhaps even more so for fMRI data analysis, the
combination of a very large amount of data along with very high flexibility in data analysis
pipelines, has been suggested to lead to an increased risk that reported findings may often be
invalidated by modeler and/or experimenter degrees of freedom 28–30. Simply put, if one runs
multiple analysis pipelines and focus on the ones that give the “best” results, the risk is that those
results may depend on overfitting to noise in the data, as opposed to actual signal. Here we
addressed this overfitting concern by implementing a replication study in which we pre-registered
the full computational model specification, model-fitting and analysis pipeline for both the
behavioral and fMRI data. Thus, we obtained a fully independent out-of-sample validation of our
findings from the first study. We consider it to be an encouraging sign for typical computational
behavior and fMRI studies that many of our initial findings were well replicated in the second
study. Our computational model fitting results were closely replicated. In addition, a substantial
subset of our fMRI results were replicated, especially those pertaining to the emulation system and
the arbitration process, suggesting that some fMRI findings can be replicated even when analytical
flexibility is virtually eliminated. It is also worth noting that our MRI scanner was upgraded from
a Siemens Trio to Siemens Prisma platform between the two studies. Despite that substantial
change in scanner hardware, brain activity patterns for most contrasts of interest were highly
similar. Naturally we did try to keep the MR sequences and acquisition parameters we used as
similar as possible across platforms, which of course is easier to do given the two scanners do
come from the same manufacturer and do have many similarities. However, once one does keep
.CC-BY-NC-ND 4.0 International licenseIt is made available under a was not peer-reviewed) is the author/funder, who has granted bioRxiv a license to display the preprint in perpetuity.
The copyright holder for this preprint (which. http://dx.doi.org/10.1101/828723doi: bioRxiv preprint first posted online Nov. 4, 2019;

25
flexibility in the analysis pipeline to a minimum, our findings are encouraging for the replicability
of fMRI studies even across platforms.
Exploratory analyses: using the quality of evidence from fMRI data to inform behavioral
and computational processes
Intriguingly, those results that did not replicate well in the 2nd fMRI dataset pertained to the
imitation system, as implemented via our proposed action-based reinforcement-learning model.
This subset of poorly replicated fMRI findings motivated us to revisit our proposed computational
model for imitation. We then implemented a much simpler imitation strategy in which instead of
keeping track of action prediction errors, the imitation system merely keeps track of which action
the agent chose on the last occasion that action was available. Furthermore, our fMRI data also
suggested that the arbitration process should be modified as we found no evidence that survived
replication to suggest that imitation reliability was tracked in the brain. Indeed, the reliability
difference signal we proposed to mediate arbitration in Study 1 was only really tracking emulation
reliability and not imitation reliability when subjected to closer inspection. Thus, we implemented
a new arbitration scheme that assigned control to emulation or imitation based on emulation
reliability only. Our new combined model with revised imitation and arbitration mechanisms was
found to clearly outperform our original model in terms of fits to both behavior and BOLD
responses. Moreover, this revised model also produced findings about the neural representation of
imitation and the arbitration process that were more clearly replicated across studies. Thus, we
used knowledge about the quality of the evidence we gleaned from the brain to revisit our original
hypotheses, which is a nice example of how evidence from neural data can be used to inform
computational and psychological theory. While these additional analyses were not part of the pre-
registered confirmatory process and must thus be labeled as exploratory, we strongly believe they
are likely to reveal robust mechanisms because they generalize across two separate datasets, and
there is a direct link between the robustness of the behavioral model fits and robustness of the
fMRI results. That said, subsequent work will ideally subject this new model and findings to
further confirmatory replication.
General conclusion.
Imitation and emulation have been studied at length in comparative and developmental psychology
studies 3,48–50 and thus are of significance for many fields of research, from education to
evolutionary psychology. Here we developed and optimized a novel paradigm and associated
neuro-computational modelling approach that allowed us to adequately separate the mechanisms
of imitation and emulation as observational learning strategies. We illuminate the behavioral and
neural signature of how these two strategies compete for control over behavior in a reliability-
driven arbitration process.
.CC-BY-NC-ND 4.0 International licenseIt is made available under a was not peer-reviewed) is the author/funder, who has granted bioRxiv a license to display the preprint in perpetuity.
The copyright holder for this preprint (which. http://dx.doi.org/10.1101/828723doi: bioRxiv preprint first posted online Nov. 4, 2019;

26
Materials and Methods
Participants. Thirty healthy participants (12 females, 18 males, mean age = 31.67 ± 4.94 (SD))
took part in Study 1 between November 2017 and January 2018. For the replication study (Study
2), 33 healthy participants were recruited between October 2018 and January 2019. Three
participants were excluded for excessive head motion in the scanner (N=1), incidental finding
(N=1) and missing more than 20% of responses on the task (N=1). As preregistered, our final
sample for Study 2 included 30 participants (12 females, 18 males, mean age = 31.2 ± 8.15 (SD)).
There was no age (t58=0.27, p=0.79) or gender difference across studies. All participants met MRI
safety criteria, had normal or corrected-to-normal vision, no psychiatric/neurological conditions,
and were free of drugs for 7 days prior to the scan that might potentially interfere with the BOLD
response (cannabis, hallucinogenic drugs). They were paid $20 per hour, in addition to bonus
money earned during the task ($5 to $8) depending on their performance. The research was
approved by the Caltech Institutional Review Board, and all participants provided informed
consent prior to their participation.
Experimental design. Participants performed a task in which they have to choose between slot
machines in order to maximize their chances of winning a valuable token (worth $0.10). They
were instructed that there are 3 tokens available in the game (green, red, or blue) and that at any
given time, only one token is valuable and the other two are worth nothing. When arriving to the
lab, participants first completed an experiential version of the task (~5 minutes) in which the
computer told them at the beginning of each trials which token is valuable. They were then
presented with the 3 slot machines and instructed that the proportion of green, blue and red colors
on each slot machine corresponds to the probability of obtaining each token upon choosing that
slot machine. In addition, on each trial one of the slot machines was greyed out an unavailable;
therefore, participants had to choose between the remaining two active slot machines.
During the main task (observational learning, Fig. 1A), participants were instructed that the
valuable token would switch many times during the task, but they would not be told when the
switches occur anymore. Instead, they would have to rely on observing the performance of another
agent playing the task. On 2/3 of trials (‘observe’ trials), participants observed that other agent
play and knew that this agent had full information about the valuable token and was therefore
performing 100% correctly. On 1/3 of trials (‘play’ trials), participants played for themselves and
the sum of all play trial outcomes was added to their final bonus payment.
Participants completed a practice of the observational learning task before scanning (2 blocks of
30 trials), followed by 8 blocks of 30 trials of the task while undergoing fMRI scanning. Each
block of 30 trials contained 20 observe trials and 10 play trials. The sequence of trials within each
block was pre-determined with simulation in order to maximize learning. Block order was
counterbalanced across subjects.
Four conditions were implemented in a 2 (stable vs volatile) by 2 (low vs high slot machine
uncertainty) design across blocks. Volatility was manipulated by changing the frequency of token
switches (Fig. 1B): there was one switch in the valuable token during stable blocks, and 5 switches
.CC-BY-NC-ND 4.0 International licenseIt is made available under a was not peer-reviewed) is the author/funder, who has granted bioRxiv a license to display the preprint in perpetuity.
The copyright holder for this preprint (which. http://dx.doi.org/10.1101/828723doi: bioRxiv preprint first posted online Nov. 4, 2019;
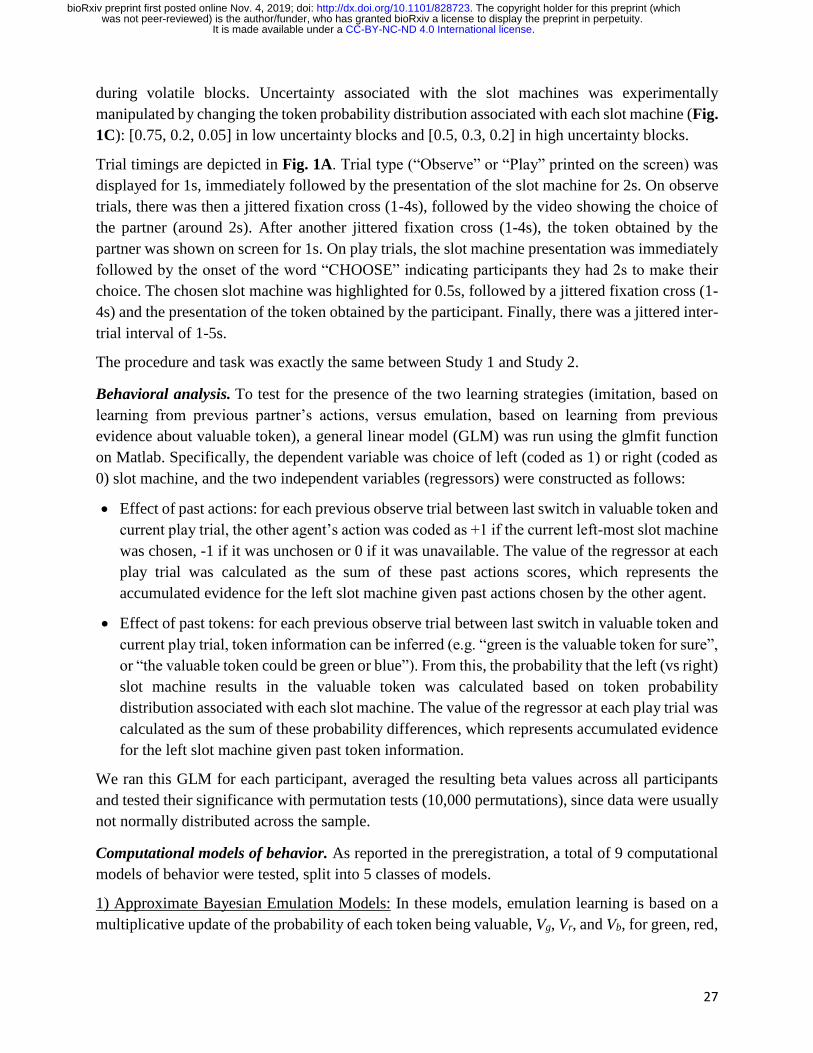
27
during volatile blocks. Uncertainty associated with the slot machines was experimentally
manipulated by changing the token probability distribution associated with each slot machine (Fig.
1C): [0.75, 0.2, 0.05] in low uncertainty blocks and [0.5, 0.3, 0.2] in high uncertainty blocks.
Trial timings are depicted in Fig. 1A. Trial type (“Observe” or “Play” printed on the screen) was
displayed for 1s, immediately followed by the presentation of the slot machine for 2s. On observe
trials, there was then a jittered fixation cross (1-4s), followed by the video showing the choice of
the partner (around 2s). After another jittered fixation cross (1-4s), the token obtained by the
partner was shown on screen for 1s. On play trials, the slot machine presentation was immediately
followed by the onset of the word “CHOOSE” indicating participants they had 2s to make their
choice. The chosen slot machine was highlighted for 0.5s, followed by a jittered fixation cross (1-
4s) and the presentation of the token obtained by the participant. Finally, there was a jittered inter-
trial interval of 1-5s.
The procedure and task was exactly the same between Study 1 and Study 2.
Behavioral analysis. To test for the presence of the two learning strategies (imitation, based on
learning from previous partner’s actions, versus emulation, based on learning from previous
evidence about valuable token), a general linear model (GLM) was run using the glmfit function
on Matlab. Specifically, the dependent variable was choice of left (coded as 1) or right (coded as
0) slot machine, and the two independent variables (regressors) were constructed as follows:
Effect of past actions: for each previous observe trial between last switch in valuable token and
current play trial, the other agent’s action was coded as +1 if the current left-most slot machine
was chosen, -1 if it was unchosen or 0 if it was unavailable. The value of the regressor at each
play trial was calculated as the sum of these past actions scores, which represents the
accumulated evidence for the left slot machine given past actions chosen by the other agent.
Effect of past tokens: for each previous observe trial between last switch in valuable token and
current play trial, token information can be inferred (e.g. “green is the valuable token for sure”,
or “the valuable token could be green or blue”). From this, the probability that the left (vs right)
slot machine results in the valuable token was calculated based on token probability
distribution associated with each slot machine. The value of the regressor at each play trial was
calculated as the sum of these probability differences, which represents accumulated evidence
for the left slot machine given past token information.
We ran this GLM for each participant, averaged the resulting beta values across all participants
and tested their significance with permutation tests (10,000 permutations), since data were usually
not normally distributed across the sample.
Computational models of behavior. As reported in the preregistration, a total of 9 computational
models of behavior were tested, split into 5 classes of models.
1) Approximate Bayesian Emulation Models: In these models, emulation learning is based on a
multiplicative update of the probability of each token being valuable, Vg, Vr, and Vb, for green, red,
.CC-BY-NC-ND 4.0 International licenseIt is made available under a was not peer-reviewed) is the author/funder, who has granted bioRxiv a license to display the preprint in perpetuity.
The copyright holder for this preprint (which. http://dx.doi.org/10.1101/828723doi: bioRxiv preprint first posted online Nov. 4, 2019;
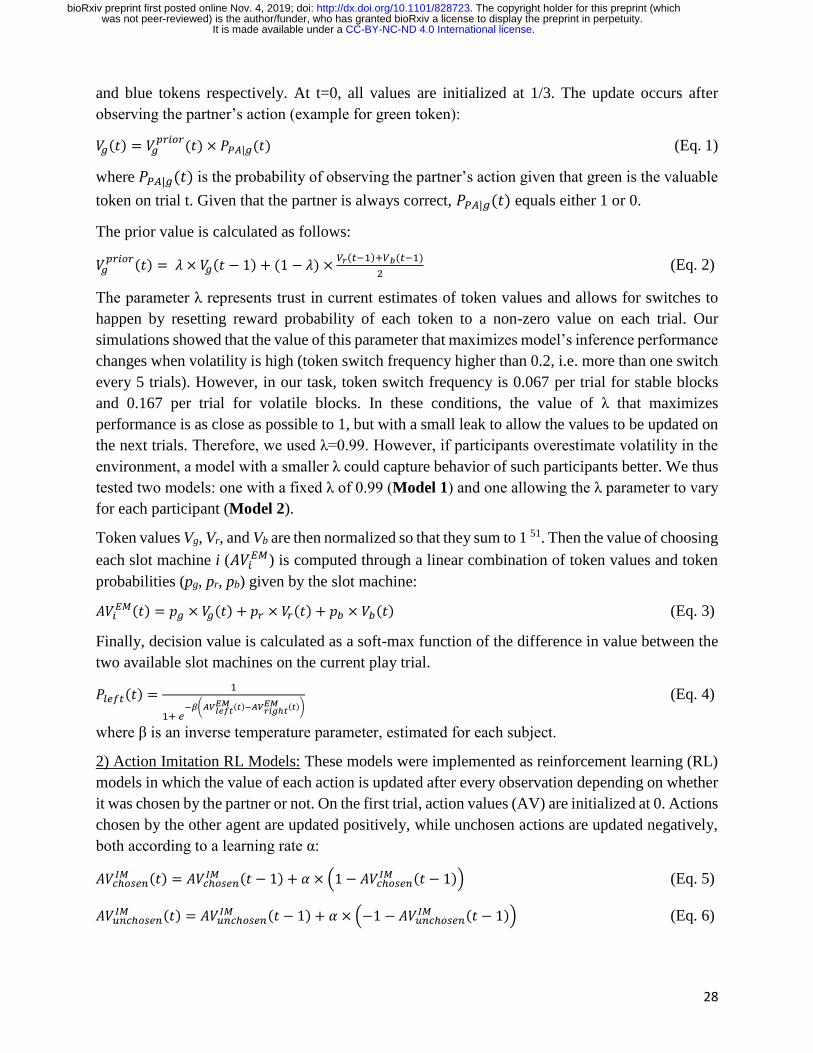
28
and blue tokens respectively. At t=0, all values are initialized at 1/3. The update occurs after
observing the partner’s action (example for green token):
𝑉𝑔(𝑡) = 𝑉𝑔𝑝𝑟𝑖𝑜𝑟
(𝑡) × 𝑃𝑃𝐴|𝑔(𝑡) (Eq. 1)
where 𝑃𝑃𝐴|𝑔(𝑡) is the probability of observing the partner’s action given that green is the valuable
token on trial t. Given that the partner is always correct, 𝑃𝑃𝐴|𝑔(𝑡) equals either 1 or 0.
The prior value is calculated as follows:
𝑉𝑔𝑝𝑟𝑖𝑜𝑟(𝑡) = 𝜆 × 𝑉𝑔(𝑡 − 1) + (1 − 𝜆) ×
𝑉𝑟(𝑡−1)+𝑉𝑏(𝑡−1)
2 (Eq. 2)
The parameter λ represents trust in current estimates of token values and allows for switches to
happen by resetting reward probability of each token to a non-zero value on each trial. Our
simulations showed that the value of this parameter that maximizes model’s inference performance
changes when volatility is high (token switch frequency higher than 0.2, i.e. more than one switch
every 5 trials). However, in our task, token switch frequency is 0.067 per trial for stable blocks
and 0.167 per trial for volatile blocks. In these conditions, the value of λ that maximizes
performance is as close as possible to 1, but with a small leak to allow the values to be updated on
the next trials. Therefore, we used λ=0.99. However, if participants overestimate volatility in the
environment, a model with a smaller λ could capture behavior of such participants better. We thus
tested two models: one with a fixed λ of 0.99 (Model 1) and one allowing the λ parameter to vary
for each participant (Model 2).
Token values Vg, Vr, and Vb are then normalized so that they sum to 1 51. Then the value of choosing
each slot machine i (𝐴𝑉𝑖𝐸𝑀) is computed through a linear combination of token values and token
probabilities (pg, pr, pb) given by the slot machine:
𝐴𝑉𝑖𝐸𝑀(𝑡) = 𝑝𝑔 × 𝑉𝑔(𝑡) + 𝑝𝑟 × 𝑉𝑟(𝑡) + 𝑝𝑏 × 𝑉𝑏(𝑡) (Eq. 3)
Finally, decision value is calculated as a soft-max function of the difference in value between the
two available slot machines on the current play trial.
𝑃𝑙𝑒𝑓𝑡(𝑡) =1
1+ 𝑒−𝛽(𝐴𝑉𝑙𝑒𝑓𝑡
𝐸𝑀 (𝑡)−𝐴𝑉𝑟𝑖𝑔ℎ𝑡𝐸𝑀 (𝑡))
(Eq. 4)
where β is an inverse temperature parameter, estimated for each subject.
2) Action Imitation RL Models: These models were implemented as reinforcement learning (RL)
models in which the value of each action is updated after every observation depending on whether
it was chosen by the partner or not. On the first trial, action values (AV) are initialized at 0. Actions
chosen by the other agent are updated positively, while unchosen actions are updated negatively,
both according to a learning rate α:
𝐴𝑉𝑐ℎ𝑜𝑠𝑒𝑛𝐼𝑀 (𝑡) = 𝐴𝑉𝑐ℎ𝑜𝑠𝑒𝑛
𝐼𝑀 (𝑡 − 1) + 𝛼 × (1 − 𝐴𝑉𝑐ℎ𝑜𝑠𝑒𝑛𝐼𝑀 (𝑡 − 1)) (Eq. 5)
𝐴𝑉𝑢𝑛𝑐ℎ𝑜𝑠𝑒𝑛𝐼𝑀 (𝑡) = 𝐴𝑉𝑢𝑛𝑐ℎ𝑜𝑠𝑒𝑛
𝐼𝑀 (𝑡 − 1) + 𝛼 × (−1 − 𝐴𝑉𝑢𝑛𝑐ℎ𝑜𝑠𝑒𝑛𝐼𝑀 (𝑡 − 1)) (Eq. 6)
.CC-BY-NC-ND 4.0 International licenseIt is made available under a was not peer-reviewed) is the author/funder, who has granted bioRxiv a license to display the preprint in perpetuity.
The copyright holder for this preprint (which. http://dx.doi.org/10.1101/828723doi: bioRxiv preprint first posted online Nov. 4, 2019;
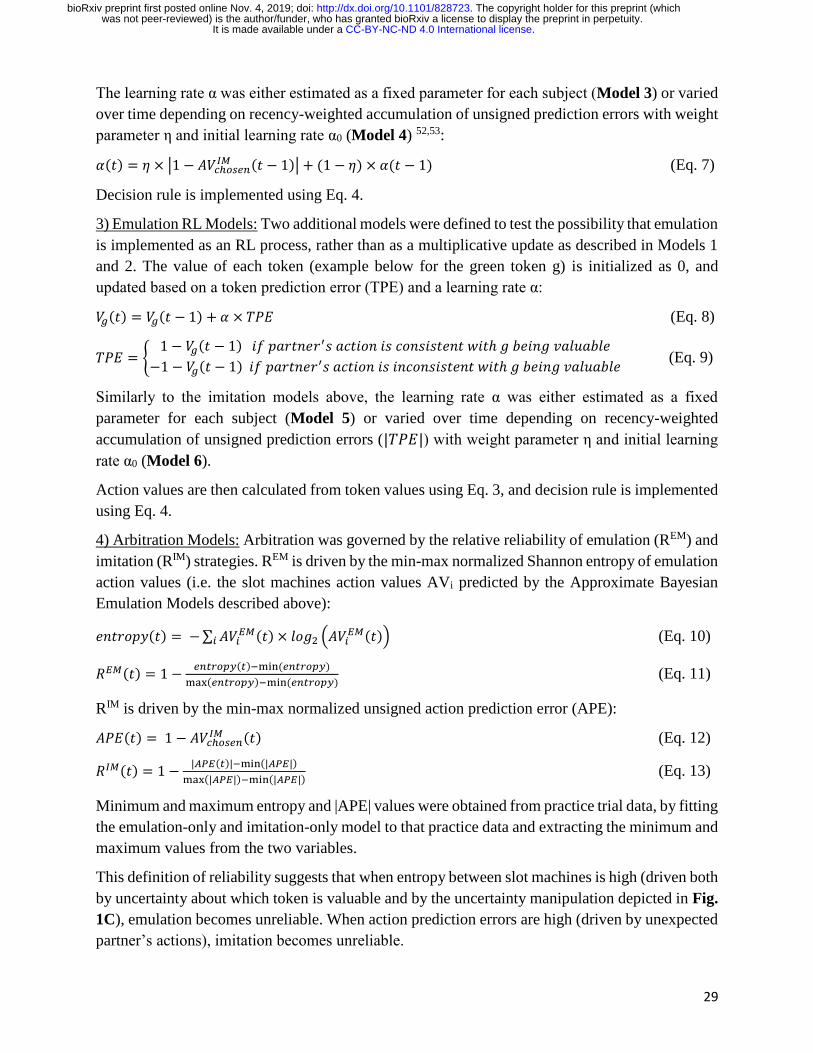
29
The learning rate α was either estimated as a fixed parameter for each subject (Model 3) or varied
over time depending on recency-weighted accumulation of unsigned prediction errors with weight
parameter η and initial learning rate α0 (Model 4) 52,53:
𝛼(𝑡) = 𝜂 × |1 − 𝐴𝑉𝑐ℎ𝑜𝑠𝑒𝑛𝐼𝑀 (𝑡 − 1)| + (1 − 𝜂) × 𝛼(𝑡 − 1) (Eq. 7)
Decision rule is implemented using Eq. 4.
3) Emulation RL Models: Two additional models were defined to test the possibility that emulation
is implemented as an RL process, rather than as a multiplicative update as described in Models 1
and 2. The value of each token (example below for the green token g) is initialized as 0, and
updated based on a token prediction error (TPE) and a learning rate α:
𝑉𝑔(𝑡) = 𝑉𝑔(𝑡 − 1) + 𝛼 × 𝑇𝑃𝐸 (Eq. 8)
𝑇𝑃𝐸 = {1 − 𝑉𝑔(𝑡 − 1) 𝑖𝑓 𝑝𝑎𝑟𝑡𝑛𝑒𝑟′𝑠 𝑎𝑐𝑡𝑖𝑜𝑛 𝑖𝑠 𝑐𝑜𝑛𝑠𝑖𝑠𝑡𝑒𝑛𝑡 𝑤𝑖𝑡ℎ 𝑔 𝑏𝑒𝑖𝑛𝑔 𝑣𝑎𝑙𝑢𝑎𝑏𝑙𝑒
−1 − 𝑉𝑔(𝑡 − 1) 𝑖𝑓 𝑝𝑎𝑟𝑡𝑛𝑒𝑟′𝑠 𝑎𝑐𝑡𝑖𝑜𝑛 𝑖𝑠 𝑖𝑛𝑐𝑜𝑛𝑠𝑖𝑠𝑡𝑒𝑛𝑡 𝑤𝑖𝑡ℎ 𝑔 𝑏𝑒𝑖𝑛𝑔 𝑣𝑎𝑙𝑢𝑎𝑏𝑙𝑒 (Eq. 9)
Similarly to the imitation models above, the learning rate α was either estimated as a fixed
parameter for each subject (Model 5) or varied over time depending on recency-weighted
accumulation of unsigned prediction errors (|𝑇𝑃𝐸|) with weight parameter η and initial learning
rate α0 (Model 6).
Action values are then calculated from token values using Eq. 3, and decision rule is implemented
using Eq. 4.
4) Arbitration Models: Arbitration was governed by the relative reliability of emulation (REM) and
imitation (RIM) strategies. REM is driven by the min-max normalized Shannon entropy of emulation
action values (i.e. the slot machines action values AVi predicted by the Approximate Bayesian
Emulation Models described above):
𝑒𝑛𝑡𝑟𝑜𝑝𝑦(𝑡) = − ∑ 𝐴𝑉𝑖𝐸𝑀(𝑡)𝑖 × 𝑙𝑜𝑔2 (𝐴𝑉𝑖
𝐸𝑀(𝑡)) (Eq. 10)
𝑅𝐸𝑀(𝑡) = 1 −𝑒𝑛𝑡𝑟𝑜𝑝𝑦(𝑡)−min (𝑒𝑛𝑡𝑟𝑜𝑝𝑦)
max(𝑒𝑛𝑡𝑟𝑜𝑝𝑦)−min (𝑒𝑛𝑡𝑟𝑜𝑝𝑦) (Eq. 11)
RIM is driven by the min-max normalized unsigned action prediction error (APE):
𝐴𝑃𝐸(𝑡) = 1 − 𝐴𝑉𝑐ℎ𝑜𝑠𝑒𝑛𝐼𝑀 (𝑡) (Eq. 12)
𝑅𝐼𝑀(𝑡) = 1 −|𝐴𝑃𝐸(𝑡)|−min(|𝐴𝑃𝐸|)
max(|𝐴𝑃𝐸|)−min(|𝐴𝑃𝐸|) (Eq. 13)
Minimum and maximum entropy and |APE| values were obtained from practice trial data, by fitting
the emulation-only and imitation-only model to that practice data and extracting the minimum and
maximum values from the two variables.
This definition of reliability suggests that when entropy between slot machines is high (driven both
by uncertainty about which token is valuable and by the uncertainty manipulation depicted in Fig.
1C), emulation becomes unreliable. When action prediction errors are high (driven by unexpected
partner’s actions), imitation becomes unreliable.
.CC-BY-NC-ND 4.0 International licenseIt is made available under a was not peer-reviewed) is the author/funder, who has granted bioRxiv a license to display the preprint in perpetuity.
The copyright holder for this preprint (which. http://dx.doi.org/10.1101/828723doi: bioRxiv preprint first posted online Nov. 4, 2019;
30
Arbitration is then governed by an arbitration weight ω, implemented as a soft-max function of the
reliability difference, with the addition of a bias parameter δ (δ>0 reflects a bias towards emulation,
δ<0 reflects a bias towards imitation):
𝜔(𝑡) =1
1+𝑒−(𝑅𝐸𝑀(𝑡)−𝑅𝐼𝑀(𝑡)+𝛿) (Eq. 14)
The probability of choosing the slot machine on the left is computed separately for each strategy:
- using Eqs. 1-4 for emulation (𝑃𝑙𝑒𝑓𝑡𝐸𝑀 ), with either an optimal λ of 0.99 (Model 7) or an estimated
λ parameter for each subject (Model 8), and with inverse temperature parameter βEM
- using Eqs. 5, 6 and 4 for imitation (𝑃𝑙𝑒𝑓𝑡𝐼𝑀 ), with fixed learning rate α and with inverse
temperature parameter βIM
Then the two decision values 𝑃𝑙𝑒𝑓𝑡𝐸𝑀 and 𝑃𝑙𝑒𝑓𝑡
𝐼𝑀 are combined using the arbitration weight ω:
𝑃𝑙𝑒𝑓𝑡(𝑡) = 𝜔(𝑡) ∙ 𝑃𝑙𝑒𝑓𝑡𝐸𝑀 (𝑡) + (1 − 𝜔(𝑡)) ∙ 𝑃𝑙𝑒𝑓𝑡
𝐼𝑀 (𝑡) (Eq. 15)
5) Outcome RL Model: One last model we tested (Model 9) is the possibility that participants
mistakenly learn from the token that is presented as an outcome at the end of the trial, instead of
learning from the partner’s actions. This was implemented similarly to other RL models. The value
of each token was updated positively every time that token was obtained as an outcome, either by
the partner or by the participant, and negatively if that token was not obtained. Action values and
decision value were then calculated using Eqs. 3 and 4.
6) Exploratory Arbitration Model: This model (Model 10) was defined to test the possibility that
imitation is implemented as a simpler 1-step learning strategy in which the most recent partner’s
action is repeated on the current trial. Specifically, the probability of choosing the left slot machine
on each play trials according to imitation is calculated as follows:
𝑃𝑙𝑒𝑓𝑡𝐼𝑀 (𝑡) =
1
1+ 𝑒−𝛽𝐼𝑀∗(𝐴𝑉𝐿>𝑅(𝑡)) where 𝐴𝑉𝐿>𝑅(𝑡) = {
1 𝑖𝑓 𝑙𝑒𝑓𝑡 𝑎𝑐𝑡𝑖𝑜𝑛 𝑤𝑎𝑠 𝑙𝑎𝑠𝑡 𝑐ℎ𝑜𝑠𝑒𝑛 𝑏𝑦 𝑝𝑎𝑟𝑡𝑛𝑒𝑟
−1 𝑖𝑓 𝑟𝑖𝑔ℎ𝑡 𝑎𝑐𝑡𝑖𝑜𝑛 𝑤𝑎𝑠 𝑙𝑎𝑠𝑡 𝑐ℎ𝑜𝑠𝑒𝑛 𝑏𝑦 𝑝𝑎𝑟𝑡𝑛𝑒𝑟
0 𝑖𝑓 𝑛𝑜 𝑎𝑣𝑎𝑖𝑙𝑎𝑏𝑙𝑒 𝑎𝑐𝑡𝑖𝑜𝑛 𝑝𝑟𝑒𝑣𝑖𝑜𝑢𝑠𝑙𝑦 𝑐ℎ𝑜𝑠𝑒𝑛
The probability of choosing left according to emulation 𝑃𝑙𝑒𝑓𝑡𝐸𝑀 (𝑡) was defined as above (Eqs. 1-4).
Arbitration in this model was driven exclusively by the reliability of the emulation strategy (Eq.
11), with the arbitration weight ω calculated as a soft-max function of the emulation reliability,
with the addition of a bias parameter δ. Then the two decision values 𝑃𝑙𝑒𝑓𝑡𝐸𝑀 and 𝑃𝑙𝑒𝑓𝑡
𝐼𝑀 are then
combined with arbitration weight ω like above (Eq. 15).
Model fitting and comparison. As preregistered, model fitting and comparison were performed in
two different ways to assess robustness of model-fitting results:
1) Using maximum likelihood estimation in Matlab with the fminunc function to estimate
parameter estimated for each subject, followed by an out-of-sample predictive accuracy
calculation to compare models. Specifically, for the accuracy calculation, subjects were split into
5 groups of 6 subjects, mean parameters were estimated for 4 groups (24 subjects) and tested on
the remaining group (6 subjects). This was repeated for all groups, as well as for 100 different
.CC-BY-NC-ND 4.0 International licenseIt is made available under a was not peer-reviewed) is the author/funder, who has granted bioRxiv a license to display the preprint in perpetuity.
The copyright holder for this preprint (which. http://dx.doi.org/10.1101/828723doi: bioRxiv preprint first posted online Nov. 4, 2019;
31
groupings of subjects. Mean predictive accuracy (proportion of subjects’ choices correctly
predicted by the model) for each model is reported in Table 1.
2) Using hierarchical Bayesian random effects analysis. Following 35,36, the (suitably transformed)
parameters of each participant are treated as a random sample from a Gaussian distribution
characterizing the population. We estimated the mean and variance of the distribution by an
Expectation-Maximization method with a Laplace approximation. We estimated each model’s
parameters using this procedure, and then compared the goodness of fit for the different models
according to their group-level integrated Bayesian Information Criteria (iBIC, see Table 1). The
iBIC was computed by integrating out individual subjects’ parameters through sampling. The full
method is described in e.g. 35,36.
Posterior predictive analysis. We tested that the winning model could reliably predict the
behavioral effects obtained by simple GLM (see “Behavioral analysis” paragraph above), namely
the effects of past actions and past tokens on current choice. To do so, we used individual subject’s
parameters from the winning model (Model 7), as well as individual subject’s parameters from
the simple emulation (Model 2) and imitation (Model 3) models, to generate hypothetical choice
data for each participant using that participant’s trial sequence. We then ran the same GLM on the
model-generated data for each participant, calculated the mean GLM betas across participants and
repeated the process (data generation + GLM fitting) 1000 times. The GLM betas from these 1000
iterations are plotted as histograms on Fig. 2C-D, together with the true effect on participants’
actual behavioral data (red point ± standard error).
We also examined our prediction that the use of imitation versus emulation strategies is modulated
by action volatility and by token uncertainty. To do so, we extracted the arbitration weight ω(t)
from Model 7 for each trial and each participant, and averaged it for each of the 4 conditions (Fig.
3A-B): stable/low uncertainty, volatile/low uncertainty, stable/high uncertainty, volatile/high
uncertainty. Differences in arbitration weight across conditions were tested in a 2-by-2 repeated-
measures ANOVA. In a separate analysis, we compared the mean likelihood per trial of imitation
(Model 3) and emulation (Model 2) for each of the 4 conditions (Fig. 3C-D).
Software. The task was coded and presented using PsychoPy 54 version 1.85 under Windows.
Behavioral analyses, including computational models, were run on Matlab (R2018a). MRI data
was analyzed using FMRIB Software Library (FSL; version 5.0;
https://fsl.fmrib.ox.ac.uk/fsl/fslwiki), Advanced Normalization Tools (ANTs;
http://stnava.github.io/ANTs/) and Statistical Parametric Mapping (SPM; version 12;
https://www.fil.ion.ucl.ac.uk/spm/software/spm12/).
fMRI data acquisition. For Study 1, fMRI data was acquired on a Siemens Magneto TrioTim 3T
scanner at the Caltech Brain Imaging Center (Pasadena, CA), which was later upgraded to a
Siemens Prisma 3T scanner before Study 2. The same 32-channel radio frequency coil was used
for both studies. MRI acquisition protocols and sequences were also kept as similar as possible.
For functional runs, 8 scans of 410 volumes each were collected using a multi-band echo-planar
imaging (EPI) sequence with the following parameters: 56 axial slices (whole-brain), A-P phase
.CC-BY-NC-ND 4.0 International licenseIt is made available under a was not peer-reviewed) is the author/funder, who has granted bioRxiv a license to display the preprint in perpetuity.
The copyright holder for this preprint (which. http://dx.doi.org/10.1101/828723doi: bioRxiv preprint first posted online Nov. 4, 2019;
32
encoding, -30 degrees slice orientation from AC-PC line, echo time (TE) of 30ms, multi-band
acceleration of 4, repetition time (TR) of 1000ms, 60-degree flip angle, 2.5mm isotropic
resolution, 200mm x 200mm field of view, EPI factor of 80, echo spacing of 0.54ms. Positive and
negative polarity EPI-based fieldmaps were collected before each block with very similar factors
as the functional sequence described above (same acquisition box, number of slices, resolution,
echo spacing, bandwidtch and EPI factor), single band, TE of 50ms, TR of 4800ms (Study 1)/
4810ms (Study 2), 90-degree flip angle. T1-weighted and T2-weighted scans were also acquired
either at the end of the session or halfway through, both with sagittal orientation, field of view of
256mm x 256mm, and 1mm (Study 1)/0.9mm (Study 2) isotropic resolution.
fMRI data preprocessing. The same preprocessing pipeline was used in both studies. First,
reorientation and rough brain extraction of all scans were performed using fslreorient2std and bet
FSL commands, respectively. Fieldmaps were extracted using FSL topup. Following alignment of
the T2 to the T1 (FSL flirt command), T1 and T2 were co-registered into standard space using
ANTs (CIT168 high resolution T1 and T2 templates 55). Then an independent component analysis
(ICA) was performed on all functional scans using FSL MELODIC; components were classified
as signal or noise using a classifier that was trained on previous datasets from the lab; and noise
components were removed from the signal using FSL fix. De-noised functional scans were then
unwarped with fieldmaps using FSL fugue, co-registered into standard space using ANTs and
skull-stripped using SPM imcalc. Finally, 6mm full-width at half maximum Gaussian smoothing
was performed using SPM.
fMRI data modelling - preregistered. Two separate GLMs were used to model the BOLD signal,
incorporating an AR(1) model of serial correlations and a high-pass filter at 128Hz.
SPM GLM1: The first GLM was built to examine the neural correlates of arbitration and included
the following regressors:
Slot machine onset – observe trials (1), parametrically modulated by (2) the difference in
reliability (𝑅𝐸𝑀 − 𝑅𝐼𝑀), (3) the difference in available action values as predicted by the
imitation strategy (𝐴𝑉𝑙𝑒𝑓𝑡𝐼𝑀 − 𝐴𝑉𝑟𝑖𝑔ℎ𝑡
𝐼𝑀 ), and (4) the entropy over the 3 token values as predicted
by the emulation strategy (− ∑ 𝑉𝑡𝑜𝑘𝑒𝑛 ∙ 𝑙𝑜𝑔2 𝑉).
Slot machine onset – play trials (5), parametrically modulated by (6) the difference in
reliability (𝑅𝐸𝑀 − 𝑅𝐼𝑀), and (7) the chosen action value (expected reward probability) as
predicted by the arbitration model.
Partner’s action onset – observe trials (8), parametrically modulated by (9) the difference in
reliability (𝑅𝐸𝑀 − 𝑅𝐼𝑀), and (10) the reduction in entropy over token values calculated as the
KL divergence between prior and posterior token values predicted by the arbitration model.
Token onset – observe trials (11), parametrically modulated by (12) the difference in
reliability (𝑅𝐸𝑀 − 𝑅𝐼𝑀), and (13) an observational reward prediction error (oRPE), calculated
as the difference between the initial expected reward value given the chosen slot machine,
and the posterior value of the token shown on screen (as predicted by the model).
Token onset – play trials (14), parametrically modulated by (15) an experiential reward
prediction error (eRPE), calculated as described above. We hypothesized that the difference
.CC-BY-NC-ND 4.0 International licenseIt is made available under a was not peer-reviewed) is the author/funder, who has granted bioRxiv a license to display the preprint in perpetuity.
The copyright holder for this preprint (which. http://dx.doi.org/10.1101/828723doi: bioRxiv preprint first posted online Nov. 4, 2019;
33
in reliability would not occur at this onset given that it is not associated with any learning
(occurring only during observe trials) or choice (occurring earlier during play trials).
SPM GLM2: The second GLM was identical to the first except that each arbitration-related
regressor was separated into its emulation (𝑅𝐸𝑀) and imitation (𝑅𝐼𝑀) components. In addition, the
chosen action value regressor used during play trials slot machine onset was replaced by two action
value difference (chosen vs unchosen) regressors predicted by the imitation and emulation strategy
separately. This model allowed looking for a neural signature of each strategy.
For both GLMs, trials from all 8 blocks were collapsed into one session in the design matrix.
Regressors of no interest included missed choice onsets (if any) as well as 7 regressors modelling
the transitions between blocks. All onsets were modeled as stick functions (duration = 0 s). All
parametric modulators associated with the same onset regressors were allowed to compete for
variance (no serial orthogonalization). GLMs were estimated using SPM’s canonical HRF only
(no derivatives) and SPM’s classical method (restricted maximum likelihood).
First-level contrast images were created through a linear combination of the resulting beta images.
For the reliability difference signal (SPM GLM1) and for individual reliability signals (SPM
GLM2), first-level contrasts were defined as the sum of the corresponding beta images across all
onsets where the parametric modulator was added. A global RPE signal was also examined by
summing over the oRPE and eRPE contrasts.
fMRI data modelling - exploratory. A third fMRI model, SPM GLM3, was defined to test the
neural implementation of the behavioral arbitration Model 10, in which imitation is implemented
as a simpler 1-step learning strategy of repeating the partner’s most recent action. The regressors
were as follows:
Slot machine onset – observe trials (1), parametrically modulated by (2) the reliability of
emulation (𝑅𝐸𝑀), and (3) whether the partner’s previous action is available or not.
Slot machine onset – play trials (4), parametrically modulated by (5) the reliability of
emulation (𝑅𝐸𝑀), (6) whether the partner’s previous action is available or not, and the
propensity to choose according to imitation (7) or according to emulation (8), as predicted by
the arbitration model.
Partner’s action onset – observe trials (9), parametrically modulated by (10) the reliability of
emulation (𝑅𝐸𝑀), (11) the KL divergence between prior and posterior token values predicted
by the arbitration model, and (12) whether the partner’s most recent action is repeated, not
repeated or unavailable on the current trial, coded as 1, -1 and 0 respectively.
Token onset – observe trials (13), parametrically modulated by (14) the reliability of
emulation (𝑅𝐸𝑀), and (15) the value of the token shown on screen (as predicted by the model).
Token onset – play trials (16), parametrically modulated by (17) the value of the token shown
on screen (as predicted by the model).
Regions of interest. Based on previous literature on observational learning 15 and arbitration
processes between learning strategies 27, as well as the Neurosynth (http://neurosynth.org/)
“Theory of Mind” meta-analysis map, the following 8 ROIs were defined and pre-registered:
.CC-BY-NC-ND 4.0 International licenseIt is made available under a was not peer-reviewed) is the author/funder, who has granted bioRxiv a license to display the preprint in perpetuity.
The copyright holder for this preprint (which. http://dx.doi.org/10.1101/828723doi: bioRxiv preprint first posted online Nov. 4, 2019;
34
Left and right TPJ/pSTS: two 8-mm radius spheres around peaks of the Neurosynth map: (-
54,-53,22) and (58,-58,20) for left and right, respectively.
Medial OFC: 8-mm radius sphere around peak of the Neurosynth map (2,49,-20).
dmPFC: 8-mm radius sphere around peak activation tracking expected value in other-
referential space 15: (0,40,40).
Pre-SMA/dACC: 8-mm radius sphere around peak activation tracking entropy reduction (KL
divergence, 15: (-6,18,44).
Left and right vlPFC: two 8-mm radius spheres around peak activations tracking maximum
reliability of model-free and model-based learning 27: (-54,38,3) and (48,35,-2) for left and
right, respectively.
Dorsal striatum: anatomical bilateral caudate mask from AAL atlas 56.
Parameter estimates from the different contrasts were extracted from the ROIs and averaged across
voxels within the ROI.
fMRI model comparison. Model comparison and selection between SPM GLMs was performed
using the MACS (Model Assessment, Comparison and Selection) toolbox for SPM 57 and included
the following steps. For each subject and each model, cross-validated log model evidence (cvLME)
maps were estimated. cvLME maps rely on Bayesian estimations of the models and Bayesian
marginal likelihood to calculate, for each voxel, a voxel-wise cross-validated log model evidence
for that model. Then, cross-validated Bayesian model selection 58 (cvBMS) was performed to
compare GLMs. In cvBMS, second-level model inference is performed using random-effects
Bayesian model selection, leading to voxel-wise model selection via exceedance probability maps.
For each voxel in a grey matter mask, the exceedance probability was calculated as the posterior
probability that a model is more frequent than any other model in the model space (Fig. S5).
Exceedance probability was also averaged across voxels in the different ROIs (Table S3).
Group-level inference and conjunction analysis. Second-level T-maps were constructed
separately for each study by combining each subject’s first level contrasts with the standard
summary statistics approach to random-effects analysis implemented in SPM. To assess the
evidence for consistent effects across studies, conjunction maps were calculated with the minimum
T-statistic approach 59 for each contrast of interest in the winning SPM GLM (Table S4),
combining the second-level T-maps of each study. We thresholded conjunction maps at a
conjunction P-value of Pconjunction<0.0001 uncorrected, and minimum cluster size of 30 voxels,
corresponding to a whole-brain cluster-level family-wise error corrected P-value of PFWE<0.05.
.CC-BY-NC-ND 4.0 International licenseIt is made available under a was not peer-reviewed) is the author/funder, who has granted bioRxiv a license to display the preprint in perpetuity.
The copyright holder for this preprint (which. http://dx.doi.org/10.1101/828723doi: bioRxiv preprint first posted online Nov. 4, 2019;
35
Acknowledgements
This work was funded by the Caltech Conte Center for the Neurobiology of Social Decision-
Making. K.I. is supported by the Japan Society for the Promotion of Science and the Swartz
Foundation.
Author contributions
C.C. and J.O. were responsible for conceptualization and methodology. C.C. carried out the
investigations. C.C. and K.I. performed the analyses. C.C. and J.O. wrote the original manuscript
draft. C.C., K.I. and J.O. reviewed and edited the manuscript. J.O. supervised the study and
acquired funding.
Competing interests
The authors declare no competing interests.
References
1. Heyes, C. & Saggerson, A. Testing for imitative and nonimitative social learning in the budgerigar
using a two-object/two-action test. Anim. Behav. 64, 851–859 (2002).
2. Huang, C. T., Heyes, C. & Charman, T. Preschoolers’ behavioural reenactment of ‘failed
attempts’: The roles of intention-reading, emulation and mimicry. Cogn. Dev. 21, 36–45 (2006).
3. Whiten, A., McGuigan, N., Marshall-Pescini, S. & Hopper, L. M. Emulation, imitation, over-
imitation and the scope of culture for child and chimpanzee. Philos. Trans. R. Soc. Biol. Sci. 364,
2417–2428 (2009).
4. Dunne, S. & O’Doherty, J. P. Insights from the application of computational neuroimaging to
social neuroscience. Curr. Opin. Neurobiol. 23, 387–392 (2013).
5. Charpentier, C. J. & O’Doherty, J. P. The application of computational models to social
neuroscience: promises and pitfalls. Soc. Neurosci. 13, 637–647 (2018).
6. Burke, C. J., Tobler, P. N., Baddeley, M. & Schultz, W. Neural mechanisms of observational
learning. Proc. Natl. Acad. Sci. 107, 14431–14436 (2010).
7. Suzuki, S. et al. Learning to simulate others’ decisions. Neuron 74, 1125–1137 (2012).
8. Catmur, C., Walsh, V. & Heyes, C. Associative sequence learning: The role of experience in the
development of imitation and the mirror system. Philos. Trans. R. Soc. Biol. Sci. 364, 2369–2380
(2009).
9. Lametti, D. R. & Watkins, K. E. Cognitive neuroscience: The neural basis of motor learning by
observing. Curr. Biol. 26, R288–R290 (2016).
10. Rizzolatti, G. & Craighero, L. The mirror-neuron system. Annu. Rev. Neurosci. 27, 169–192
.CC-BY-NC-ND 4.0 International licenseIt is made available under a was not peer-reviewed) is the author/funder, who has granted bioRxiv a license to display the preprint in perpetuity.
The copyright holder for this preprint (which. http://dx.doi.org/10.1101/828723doi: bioRxiv preprint first posted online Nov. 4, 2019;
36
(2004).
11. Rizzolatti, G., Fadiga, L., Gallese, V. & Fogassi, L. Premotor cortex and the recognition of motor
actions. Cogn. Brain Res. 3, 131–141 (1996).
12. Cook, R., Bird, G., Catmur, C., Press, C. & Heyes, C. Mirror neurons: From origin to function.
Behav. Brain Sci. 37, 177–192 (2014).
13. Devaine, M., Hollard, G. & Daunizeau, J. The social Bayesian brain: Does mentalizing make a
difference when we learn? PLoS Comput. Biol. 10, e1003992 (2014).
14. Diaconescu, A. O. et al. Inferring on the intentions of others by hierarchical Bayesian learning.
PLoS Comput. Biol. 10, e1003810 (2014).
15. Collette, S., Pauli, W. M., Bossaerts, P. & O’Doherty, J. P. Neural computations underlying
inverse reinforcement learning in the human brain. Elife 6, e29718 (2017).
16. Frith, C. D. & Frith, U. The neural basis of mentalizing. Neuron 50, 531–534 (2006).
17. Behrens, T. E. J., Hunt, L. T., Woolrich, M. W. & Rushworth, M. F. S. Associative learning of
social value. Nature 456, 24524–9 (2008).
18. Hampton, A. N., Bossaerts, P. & O’Doherty, J. P. Neural correlates of mentalizing-related
computations during strategic interactions in humans. Proc. Natl. Acad. Sci. 105, 6741–6746
(2008).
19. Yoshida, W., Seymour, B., Friston, K. J. & Dolan, R. J. Neural mechanisms of belief inference
during cooperative games. J. Neurosci. 30, 10744–10751 (2010).
20. Boorman, E. D., O’Doherty, J. P., Adolphs, R. & Rangel, A. The behavioral and neural
mechanisms underlying the tracking of expertise. Neuron 80, 1558–1571 (2013).
21. Hill, C. A. et al. A causal account of the brain network computations underlying strategic social
behavior. Nat. Neurosci. 20, 1142–1149 (2017).
22. Balleine, B. W. & Dickinson, A. Goal-directed instrumental action: Contingency and incentive
learning and their cortical substrates. Neuropharmacology 37, 407–419 (1998).
23. Balleine, B. W. & O’Doherty, J. P. Human and rodent homologies in action control:
Corticostriatal determinants of goal-directed and habitual action. Neuropsychopharmacology 35,
48–69 (2010).
24. Glascher, J., Daw, N., Dayan, P. & O’Doherty, J. P. States versus rewards: dissociable neural
prediction error signals underlying model-based and model-free reinforcement learning. Neuron
66, 585–595 (2010).
25. Daw, N. D., Gershman, S. J., Seymour, B., Dayan, P. & Dolan, R. J. Model-based influences on
humans’ choices and striatal prediction errors. Neuron 69, 1204–1215 (2011).
26. Daw, N. D., Niv, Y. & Dayan, P. Uncertainty-based competition between prefrontal and
dorsolateral striatal systems for behavioral control. Nat. Neurosci. 8, 1704–1711 (2005).
27. Lee, S. W., Shimojo, S. & O’Doherty, J. P. Neural computations underlying arbitration between
model-based and model-free learning. Neuron 81, 687–699 (2014).
28. Carp, J. On the plurality of (methodological) worlds: estimating the analytic flexibility of fMRI
experiments. Front. Neurosci. 6, 149 (2012).
.CC-BY-NC-ND 4.0 International licenseIt is made available under a was not peer-reviewed) is the author/funder, who has granted bioRxiv a license to display the preprint in perpetuity.
The copyright holder for this preprint (which. http://dx.doi.org/10.1101/828723doi: bioRxiv preprint first posted online Nov. 4, 2019;

37
29. Simmons, J. P., Nelson, L. D. & Simonsohn, U. False-positive psychology: Undisclosed flexibility
in data collection and analysis allows presenting anything as significant. Psychol. Sci. 22, 1359–
1366 (2011).
30. Daw, N. D. Trial-by-trial data analysis using computational models. in Decision Making, Affect,
and Learning: Attention and Performance XXIII (eds. Delgado, M. R., Phelps, E. A. & Robbins,
T. W.) 3–38 (Oxford University Press, 2011). doi:10.1093/acprof:oso/9780199600434.003.0001
31. Gazzola, V. & Keysers, C. The observation and execution of actions share motor and
somatosensory voxels in all tested subjects: Single-subject analyses of unsmoothed fMRI data.
Cereb. Cortex 19, 1239–1255 (2009).
32. Fletcher, P. C. et al. Other minds in the brain: A functional imaging study of “theory of mind” in
story comprehension. Cognition 57, 109–128 (1995).
33. Van Overwalle, F. & Baetens, K. Understanding others’ actions and goals by mirror and
mentalizing systems: A meta-analysis. Neuroimage 48, 564–584 (2009).
34. Cooper, J. C., Dunne, S., Furey, T. & O’Doherty, J. P. Human dorsal striatum encodes prediction
errors during observational learning of instrumental actions. J. Cogn. Neurosci. 24, 106–118
(2012).
35. Huys, Q. J. M. et al. Disentangling the roles of approach, activation and valence in instrumental
and pavlovian responding. PLoS Comput. Biol. 7, (2011).
36. Iigaya, K., Story, G. W., Kurth-Nelson, Z., Dolan, R. J. & Dayan, P. The modulation of savouring
by prediction error and its effects on choice. Elife 5, e13747 (2016).
37. Palminteri, S., Wyart, V. & Koechlin, E. The Importance of Falsification in Computational
Cognitive Modeling. Trends Cogn. Sci. 21, 425–433 (2017).
38. Open Science Collaboration. An open, large-scale, collaborative effort to estimate the
reproducibility of psychological science. Perspect. Psychol. Sci. 7, 657–660 (2012).
39. Open Science Collaboration. Estimating the reproducibility of psychological science. Science (80-.
). 349, aac4716 (2015).
40. Nichols, T. E. et al. Best practices in data analysis and sharing in neuroimaging using MRI. Nat.
Neurosci. 20, 299–303 (2017).
41. Poldrack, R. et al. Scanning the horizon: towards transparent and reproducible neuroimaging
research. Nat Rev Neurosci 18, 115–126 (2017).
42. Hampshire, A., Chamberlain, S. R., Monti, M. M., Duncan, J. & Owen, A. M. The role of the right
inferior frontal gyrus: inhibition and attentional control. Neuroimage 50, 1313–1319 (2010).
43. Cieslik, E. C., Mueller, V. I., Eickhoff, C. R., Langner, R. & Eickhoff, S. B. Three key regions for
supervisory attentional control: Evidence from neuroimaging meta-analyses. Neurosci. Biobehav.
Rev. 48, 22–34 (2015).
44. Weissengruber, S., Lee, S. W., O’Doherty, J. P. & Ruff, C. C. Neurostimulation Reveals Context-
Dependent Arbitration Between Model-Based and Model-Free Reinforcement Learning. Cereb.
Cortex 1–13 (2019). doi:10.1093/cercor/bhz019
45. Kim, D., Park, G. Y., O’Doherty, J. P. & Lee, S. W. Task complexity interacts with state-space
uncertainty in the arbitration process between model-based and model-free reinforcement-
learning. Nat. Commun. in press, (2019).
.CC-BY-NC-ND 4.0 International licenseIt is made available under a was not peer-reviewed) is the author/funder, who has granted bioRxiv a license to display the preprint in perpetuity.
The copyright holder for this preprint (which. http://dx.doi.org/10.1101/828723doi: bioRxiv preprint first posted online Nov. 4, 2019;

38
46. Feher da Silva, C. & Hare, T. A. Humans are primarily model-based and not model-free learners
in the two-stage task. bioRxiv (2019). doi:10.1101/682922
47. Ng, A. & Russell, S. Algorithms for inverse reinforcement learning. in Proceedings of the
Seventeenth International Conference on Machine Learning, Vol. 67 (ed. De Sousa, J. P.) 663–670
(Morgan Kaufmann Publishers Inc, 2000).
48. Horner, V. & Whiten, A. Causal knowledge and imitation/emulation switching in chimpanzees
(Pan troglodytes) and children (Homo sapiens). Anim. Cogn. 8, 164–181 (2005).
49. Nielsen, M. Copying actions and copying outcomes: Social learning through the second year. Dev.
Psychol. 42, 555–565 (2006).
50. Thompson, D. E. & Russell, J. The ghost condition: Imitation versus emulation in young
children’s observational learning. Dev. Psychol. 40, 882–889 (2004).
51. Louie, K., Khaw, M. W. & Glimcher, P. W. Normalization is a general neural mechanism for
context-dependent decision making. Proc. Natl. Acad. Sci. U. S. A. 1217854110- (2013).
52. Pearce, J. M. & Hall, G. A model for Pavlovian learning: variations in the effectiveness of
conditioned but not of unconditioned stimuli. Psychol. Rev. 87, 532 (1980).
53. Li, J., Schiller, D., Schoenbaum, G., Phelps, E. A. & Daw, N. D. Differential roles of human
striatum and amygdala in associative learning. Nat. Neurosci. 14, 1250–1252 (2011).
54. Peirce, J. W. PsychoPy - Psychophysics software in Python. J Neurosci Methods 162, 8–13
(2007).
55. Tyszka, J. M. & Pauli, W. M. In vivo delineation of subdivisions of the human amygdaloid
complex in a high-resolution group template. Hum. Brain Mapp. 37, 3979–3998 (2016).
56. Tzourio-Mazoyer, N. et al. Automated anatomical labeling of activations in SPM using a
macroscopic anatomical parcellation of the MNI MRI single-subject brain. Neuroimage 15, 273–
289 (2002).
57. Soch, J. & Allefeld, C. MACS – a new SPM toolbox for model assessment, comparison and
selection. J. Neurosci. Methods 306, 19–31 (2018).
58. Soch, J., Haynes, J. & Allefeld, C. How to avoid mismodelling in GLM-based fMRI data analysis:
cross-validated Bayesian model selection. Neuroimage 141, 469–489 (2016).
59. Friston, K. J., Penny, W. D. & Glaser, D. E. Conjunction revisited. Neuroimage 25, 661–667
(2005).
.CC-BY-NC-ND 4.0 International licenseIt is made available under a was not peer-reviewed) is the author/funder, who has granted bioRxiv a license to display the preprint in perpetuity.
The copyright holder for this preprint (which. http://dx.doi.org/10.1101/828723doi: bioRxiv preprint first posted online Nov. 4, 2019;


![imitation trunk [イミテーショントランク] - JCD · 製品名称 imitation trunk エントリーNO. 1821 imitation trunk[イミテーショントランク] デザイン自在](https://img.pdfslide.net/doc/110x75/5f89cfa3f220b314941082d7/imitation-trunk-ffffffff-ec-imitation-trunk.jpg)