Embed Size (px)
Citation preview

THE JOURNAL OF COMPARATIVE NEUROLOGY 374~136-160 (1996)
Neurochemical, Morphologic, and Laminar Characterization of Cortical Projection Neurons in the Cingulate Motor Areas
of the Macaque Monkey
ESTHER A. NIMCHINSKY, PATRICK R. HOF, WARREN G. YOUNG, AND JOHN H. MORRISON
Fishberg Research Center for Neurobiology (E.A.N., P.R.H., J.H.M.), and Departments of Geriatrics and Adult Development (P.R.H., J.H.M.) and Ophthalmology (P.R.H.),
Mount Sinai School of Medicine, New York, New York 10029; Department of Neuropharmacology, Scripps Research Institute, La Jolla, California 92037(W.G.Y.)
ABSTRACT The primate cingulate gyrus contains multiple cortical areas that can be distinguished by several
neurochemical features, including the distribution of neurofilament protein-enriched pyramidal neurons. In addition, connectivity and functional properties indicate that there are multiple motor areas in the cortex lining the cingulate sulcus. These motor areas were targeted for analysis of potential interactions among regional specialization, connectivity, and cellular characteristics such as neurochemical profile and morphology. Specifically, intracortical injections of retrogradely trans- ported dyes and intracellular injection were combined with immunocytochemistry to investigate neurons projecting from the cingulate motor areas to the putative forelimb region of the primary motor cortex, area M1. Two separate groups of neurons projecting to area M1 emanated from the cingulate sulcus, one anterior and one posterior, both of which furnished commissural and ipsilateral connections with area M1. The primary difference between the two populations was laminar origin, with the anterior projection originating largely in deep layers, and the posterior projection taking origin equally in superficial and deep layers. With regard to cellular morphology, the anterior projection exhibited more morphologic diversity than the posterior projection. Commissural projec- tions from both anterior and posterior fields originated largely in layer VI. Neurofilament protein distribution was a reliable tool for localizing the two projections and for discriminating between them. Comparable proportions of the two sets of projection neurons contained neurofilament protein, although the density and distribution of the total population of neurofilament protein-enriched neurons was very different in the two subareas of origin. Within a projection, the participating neurons exhibited a high degree of morphologic heterogeneity, and no correlation was observed between somatodendritic morphology and neurofilament protein content. Thus, although the neurons that provide the anterior and posterior cingulate motor projections to area M1 differ morphologically and in laminar origin, their neurochemical profiles are similar with respect to neurofilament protein. This suggests that neurochemical phenotype may be a more important unifying feature for corticocortical projections than morphology.
Indexing terms: corticocortical connections, neurofilament protein, primate neocortex, pyramidal
e i991i Wiley-Liss, Inc.
neuron, quantitative neuroanatomy
Recently, investigations into the organization of the motor system have demonstrated the existence of numer- ous somatotopically arranged motor fields in the primate frontal cortex (Muakkassa and Strick, 1979; Hutchins et al., 1988; Shima et al., 1991; Dum and Strick, 1992, 1993; Stepniewska et "' 1993)' At least two distinct motor have been df%Xribed in the c i n d a t e sulcus; one in the anterior portion of the ventral bank of the cingulate SU~CUS
(CMAr), and one or two in the posterior portion, located in either the ventral (ChlAv) or the dorsal bank (CMAd) (Dum
*cceptedMay30, l996. Address reprint requests to Dr. John H. Morrison or Dr. Patrick R. Hof,
Fishberg Research Center for Neurobiology, Box 1065, Mount Sinai School of Medicine, One Gustave L. Levy Place, New York, ~y 10029. E-mail : [email protected] or [email protected]
8 1996 WILEY-LISS, INC.

MOTOR PROJECTION NEURONS IN THE CINGULATE CORTEX 137
1996). Such findings indicate that one of the key intrinsic properties of a corticocortical projection is its proportion of neurofilament protein-enriched neurons. We have been investigating the degree to which particular processing streams or functional categories of corticocortical circuits can be distinguished by their neurofilament protein content as a major reflection of neurochemical phenotype. In the present context, this characteristic might be useful in determining the degree to which the numerous cingulate motor areas provide inherently different projections with unique neurochemical properties.
One quality that characterizes corticocortical projections is their laminar origin. Projections from cytoarchitectoni- cally different cortical areas tend to originate in different cortical layers, with those from less-differentiated cortical areas (such as area 24) originating predominantly from deep layers, and those from more-differentiated areas (such as area 23) originating from superficial layers (Barbas, 1986). The anterior and posterior CMAs have been reported to be located in very different cytoarchitectonic areas, with the anterior CMA in an agranular cortical field (area 24) lacking, by definition, a layer IV, and the posterior CMA in an area (area 23) that possesses a well-developed layer IV (Dum and Strick, 1991). Therefore, the laminar distribu- tion of their neurons of origin might be another distinguish- ing characteristic of CMAs. In addition, because cortical and subcortical afferents terminate in specific laminar patterns, this property could have functional implications.
Another potentially distinguishing characteristic of some cortical efferent projections is the morphology of their participating neurons. Generally, the morphology of neu- rons providing a given corticocortical projection is diverse (De Lima et al., 19901, but there are examples in which the morphology is so distinctive that it is a defining attribute of the projection. For instance, the Meynert cell is morphologi- cally distinctive and generally projects from the primary visual cortex to area MT (Lund et al., 1975; Tigges et al., 1981; Fries et al., 1985), and the Betz cells in the primary motor cortex uniformly contribute to corticospinal tract (Lassek, 1940, 1941). The human cingulate cortex contains numerous distinctive and unusual cell types, most notably the gigantopyramidal cells in layer V in the cingulate sulcus (Braak, 1976) and the spindle neurons in layer Vb in area 24 (Nimchinsky et al., 1995). The macaque cingulate cortex appears to lack these obvious examples, but more subtle differences in the morphology of pyramidal neurons in the anterior and posterior cingulate cortex have been described in the rat (Vogt and Peters, 1981) and human (Schlaug et al., 1993) and are also present in the monkey. Finally, in view of the consistency of the neurofilament protein- containing neuronal population within a given projection, it would be interesting to determine whether a correlation exists between the morphology of a pyramidal neuron and its content of neurofilament protein. If such correlations existed, they would suggest that functional classes of corticocortical circuits have unique and identifiable cell biological signatures. To further our understanding of the relationships among chemoarchitecture and cell typology, connectivity, and neurochemical characteristics of neurons furnishing corticocortical projections, we analyzed the lami- nar origin, morphology, and neurofilament protein profile of two distinct yet related convergent projections from the cingulate cortex to area M1.
and Strick, 1991, 1992; He et al., 1995). These areas have been defined by physiologic recording methods (Luppino et al., 1991; Shima et al., 1991) or by the presence of neurons projecting directly to the spinal cord (Hutchins et al., 1988; Dum and Strick, 1991; He et al., 1995) or to the primary motor cortex (Ml; Muakkassa and Strick, 1979; Morecraft and Van Hoesen, 1992). Thus far, no reliable anatomic marker has been demonstrated for any of these areas.
Neurofilament protein immunoreactivity has proved to be useful as both an indicator of regional specialization and as a mechanism to discriminate corticocortical circuits in macaque neocortex (Campbell and Morrison, 1989; Camp- bell et al., 1991; Hof and Morrison, 1995; Hof et al., 1995a-c; Hof et a]., 1996). In the cingulate cortex, the distribution of neurons enriched in neurofilament protein changes dramatically as one proceeds along the cingulate gyrus from rostra1 to caudal levels (Hof and Nimchinsky, 1992). In general, the anterior cingulate cortex, in all its subdivisions, is characterized by immunoreactive pyrami- dal neurons in layers V and VI and by virtually none in layers I1 and 111. The posterior portion of the cingulate cortex is characterized by the presence of numerous strongly immunoreactive neurons in layer 111. The site where these layer I11 neurons first appear is in the most dorsal portion of the cingulate gyrus, in the cortex lining the cingulate sulcus. The region bounded anteriorly by the first appear- ance of these neurons and posteriorly with a well-populated layer I11 was described as representing a “transition zone” between the anterior cingulate area 24 and posterior cingu- late area 23 (Hof and Nimchinsky, 1992). However, the transition zone thus defined has a much greater anterior-to- posterior extent than the transition as defined by the Nissl stain. Because the neurons that best characterize this region are located in the superficial layers of the cortex, which are known to give rise to corticocortical projections (Jones, 19841, and because connections with the primary motor cortex are one of the distinguishing features of the cingulate motor areas (Luppino et al., 1990; Morecraft and Van Hoesen, 19921, it is possible that rather than merely signalling a cytoarchitectonic transition between two differ- ent areas, these neurons indicate the existence of a distinct area, quite independent of either the ((anterior” and “poste- rior” cingulate cortex,
Overall, neurofilament protein-containing pyramidal neu- rons are believed to constitute approximately 20% of the total number of pyramidal neurons; however, there is extreme regional variation in this proportion (Hof and Morrison, 1990; Hof et al., 1990; Del Rio and DeFelipe, 1994). However, studies combining retrograde transport and immunocytochemistry in the macaque monkey have shown that the neurofilament protein-containing fraction of the pyramidal neurons comprising a given corticocortical projection varies with the projection (Campbell et al., 1991; Hof et al., 1995b, c; Hof et al., 1996). For instance, 75% of the layer I1 and I11 neurons projecting from prefrontal association area 46 to the ipsilateral superior temporal sulcus contained neurofilament protein, but this proportion dropped to only 42% of the neurons in this area and layer in the projection to the inferior parietal cortex (Hof et al., 199513). In the most extreme example, the commissural projection from the border between visual areas V1 and V2 is close to 100% neurofilament protein-immunoreactive, whereas neurofilament protein-containing neurons are poorly represented in several other corticocortical projec- tions emanating from area V1 (Hof et al., 1995c; Hof et al.,

138
A E.A. NIMCHINSKY ET AL.
B
CYNl CYN2 CYN3 CYN4 CYNS
CingS
Fig. 1. Composite drawing of injection sites for the five monkeys used in the present study (A). In animal CYN3, the right hemisphere received injections of Fast Blue (FB), and the left received Diamidino Yellow (DY). In all others, the right hemisphere received DY and the left received FB. The injections for each monkey are indicated by the
MATERIALS AND METHODS Surgical procedures
Five crab-eating macaques (Macaca fascicularis, also known as long-tailed macaque or cynomolgus monkey) were used in the present study. All experimental protocols were conducted within National Institutes of Health (NIH) guidelines for animal research and were approved by the Institutional Animal Care and Use Committee (IACUC) at the Mount Sinai School of Medicine. The animals received injections into the forelimb representation of the primary motor cortex. The locations of these injections were not mapped physiologically, but were determined on the basis of previous reports (Woolsey et al., 1952; Kwan et al., 1978; Muakkassa and Strick, 1979; Godschalk et al., 1984; Hunt- ley and Jones, 1991; Lu et al., 1994). Injections were placed very close to the central sulcus; in fact, many injections were placed in the anterior bank of the central sulcus. This was done, although it was anticipated that these injections would result in relatively sparse labeling of the anterior cingulate motor projection, to avoid involvement of the premotor cortex (Holsapple and Strick, 1991; Stepniewska et al., 1993). After the opening of a 3 cm-long craniotomy and reflection of the dura, the central sulcus and posterior
grayscale code. Panels B and C show representative sections through the injection sites of animal CYN4 (B) and CYN2 (C). The same stipple patterns were used to represent injections in panels A, B, and C. CS, central sulcus; CingS, cingulate sulcus; IPS, intraparietal sulcus; LS, lateral sulcus.
portion of the arcuate sulcus were exposed. Aqueous solu- tions of Fast Blue (FB, 4%; Sigma, St. Louis, MO) and Diamidino Yellow (DY, 4%; Sigma) were injected into the left and right hemispheres, respectively, by using a 5 - ~ 1 Hamilton microsyringe with a 24-gauge needle. Injections were placed at depths from 0.8 to 1.4 mm below the pial surface at the horizontal level of the genu of the arcuate sulcus and no more than 2 to 3 mm anteriorly to the central sulcus, to avoid involving the premotor cortex. Ten to twelve 500-111 injections were placed in each site, and none penetrated the underlying white matter. The locations and extent of the injections are illustrated in Figures 1 and 2. Following the injection procedure, the dura was closed and covered with a layer of Gelfoam. The muscle, galea aponeu- rotica, and skin were closed in layers.
Tissue preparation and staining procedures After a survival time of 3 weeks to permit optimal
retrograde transport (Campbell et al., 1991; Hof et al., 1995b), the animals were perfused intracardially as previ- ously described (Hof and Nimchinsky, 1992; Hof and Morrison, 1995). Briefly, the animal was deeply anesthe- tized with ketamine hydrochloride (25 mgikg) and pentobar-
Fig. 2. Series of coronal sections through areaMl of monkeys CYNZ (A, C, E, G ) and CYN3 (B, D, F, H) showing the location o f injections. In each animal, sections were separated by 1.5 mm and are representa- tive of the entire portion of area M1 that was injected. All injections were restricted to the gray matter. Monkey CYNZ is representative o f
all animals in the present study except CYN3. In these animals, injections were placed both in the cortex lining the central sulcus and in the cortex of the gyral convexity. In monkey CYN3, however, the injections were virtually restricted to the cortex lining the sulcus. Scale bar = 500 +m.
140
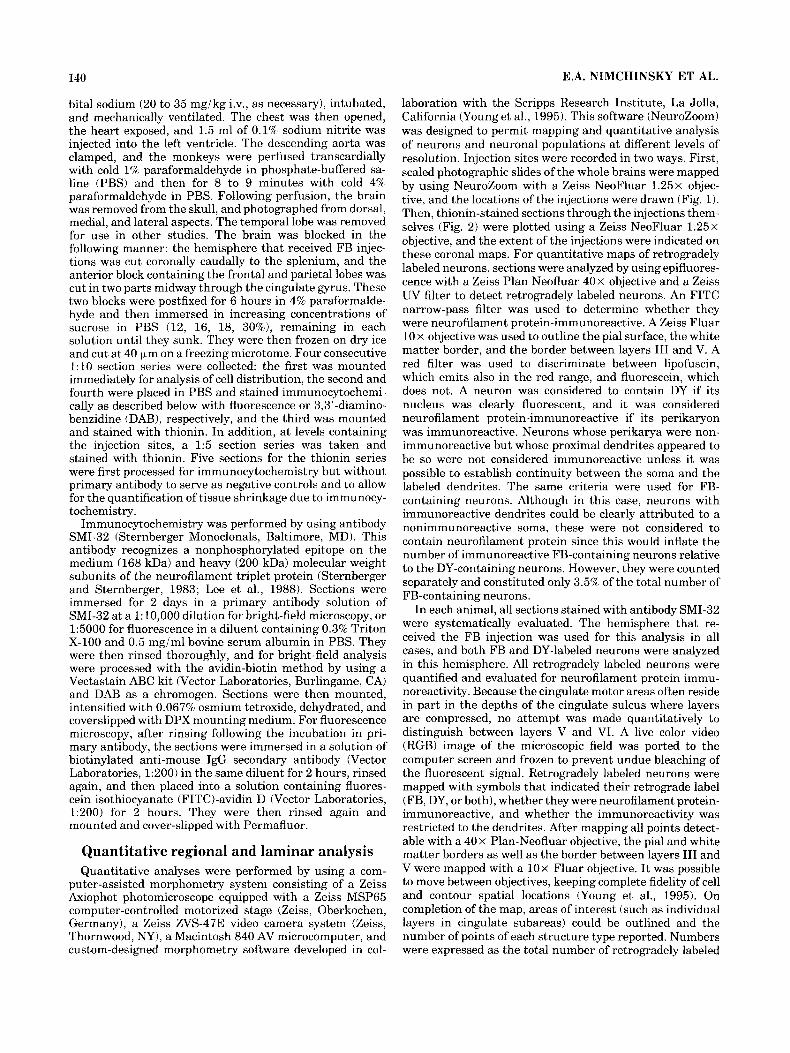
bital sodium (20 to 35 mg/kg i.v., as necessary), intubated, and mechanically ventilated. The chest was then opened, the heart exposed, and 1.5 ml of 0.1% sodium nitrite was injected into the left ventricle. The descending aorta was clamped, and the monkeys were perfused transcardially with cold 1% paraformaldehyde in phosphate-buffered sa- line (PBS) and then for 8 to 9 minutes with cold 4% paraformaldehyde in PBS. Following perfusion, the brain was removed from the skull, and photographed from dorsal, medial, and lateral aspects. The temporal lobe was removed for use in other studies. The brain was blocked in the following manner: the hemisphere that received FB injec- tions was cut coronally caudally to the splenium, and the anterior block containing the frontal and parietal lobes was cut in two parts midway through the cingulate gyrus. These two blocks were postfixed for 6 hours in 4% paraformalde- hyde and then immersed in increasing concentrations of sucrose in PBS (12, 16, 18, 30%), remaining in each solution until they sunk. They were then frozen on dry ice and cut at 40 km on a freezing microtome. Four consecutive 1 : l O section series were collected: the first was mounted immediately for analysis of cell distribution, the second and fourth were placed in PBS and stained immunocytochemi- cally as described below with fluorescence or 3,3’-diamino- benzidine (DAB), respectively, and the third was mounted and stained with thionin. In addition, at levels containing the injection sites, a 15 section series was taken and stained with thionin. Five sections for the thionin series were first processed for immunocytochemistry but without primary antibody to serve as negative controls and to allow for the quantification of tissue shrinkage due to immunocy- tochemistry .
Immunocytochemistry was performed by using antibody SMI-32 (Sternberger Monoclonals, Baltimore, MD). This antibody recognizes a nonphosphorylated epitope on the medium (168 kDa) and heavy (200 kDa) molecular weight subunits of the neurofilament triplet protein (Sternberger and Sternberger, 1983; Lee et al., 1988). Sections were immersed for 2 days in a primary antibody solution of SMI-32 at a 1:10,000 dilution for bright-field microscopy, or 15000 for fluorescence in a diluent containing 0.3% Triton X-100 and 0.5 mgiml bovine serum albumin in PBS. They were then rinsed thoroughly, and for bright-field analysis were processed with the avidin-biotin method by using a Vectastain ABC kit (Vector Laboratories, Burlingame, CAI and DAB as a chromogen. Sections were then mounted, intensified with 0.067% osmium tetroxide, dehydrated, and coverslipped with DPX mounting medium. For fluorescence microscopy, after rinsing following the incubation in pri- mary antibody, the sections were immersed in a solution of biotinylated anti-mouse IgG secondary antibody (Vector Laboratories, 1:200) in the same diluent for 2 hours, rinsed again, and then placed into a solution containing fluores- cein isothiocyanate (F1TC)-avidin D (Vector Laboratories, 1:200) for 2 hours. They were then rinsed again and mounted and cover-slipped with Permafluor.
Quantitative regional and laminar analysis Quantitative analyses were performed by using a com-
puter-assisted morphometry system consisting of a Zeiss Axiophot photomicroscope equipped with a Zeiss MSP65 computer-controlled motorized stage (Zeiss, Oberkochen, Germany), a Zeiss ZVS-47E video camera system (Zeiss, Thornwood, NY), a Macintosh 840 AV microcomputer, and custom-designed morphometry software developed in col-
E.A. NIMCHINSKY ET AL.
laboration with the Scripps Research Institute, La Jolla, California (Young et al., 1995). This software (NeuroZoom) was designed to permit mapping and quantitative analysis of neurons and neuronal populations at different levels of resolution. Injection sites were recorded in two ways. First, scaled photographic slides of the whole brains were mapped by using NeuroZoom with a Zeiss NeoFluar 1 . 2 5 ~ objec- tive, and the locations of the injections were drawn (Fig. 1). Then, thionin-stained sections through the injections them- selves (Fig. 2) were plotted using a Zeiss NeoFluar 1 . 2 5 ~ objective, and the extent of the injections were indicated on these coronal maps. For quantitative maps of retrogradely labeled neurons, sections were analyzed by using epifluores- cence with a Zeiss Plan Neofluar 4 0 ~ objective and a Zeiss UV filter to detect retrogradely labeled neurons. An FITC narrow-pass filter was used to determine whether they were neurofilament protein-immunoreactive. A Zeiss Fluar 10 x objective was used to outline the pial surface, the white matter border, and the border between layers I11 and V. A red filter was used to discriminate between lipofuscin, which emits also in the red range, and fluorescein, which does not. A neuron was considered to contain DY if its nucleus was clearly fluorescent, and it was considered neurofilament protein-immunoreactive if its perikaryon was immunoreactive. Neurons whose perikarya were non- immunoreactive but whose proximal dendrites appeared to be so were not considered immunoreactive unless it was possible to establish continuity between the soma and the labeled dendrites. The same criteria were used for FB- containing neurons. Although in this case, neurons with immunoreactive dendrites could be clearly attributed to a nonimmunoreactive soma, these were not considered to contain neurofilament protein since this would inflate the number of immunoreactive FB-containing neurons relative to the DY-containing neurons. However, they were counted separately and constituted only 3.5% of the total number of FB-containing neurons.
In each animal, all sections stained with antibody SMI-32 were systematically evaluated. The hemisphere that re- ceived the FB injection was used for this analysis in all cases, and both FB and DY-labeled neurons were analyzed in this hemisphere. All retrogradely labeled neurons were quantified and evaluated for neurofilament protein immu- noreactivity. Because the cingulate motor areas often reside in part in the depths of the cingulate sulcus where layers are compressed, no attempt was made quantitatively to distinguish between layers V and VI. A live color video (RGB) image of the microscopic field was ported to the computer screen and frozen to prevent undue bleaching of the fluorescent signal. Retrogradely labeled neurons were mapped with symbols that indicated their retrograde label (FB, DY, or both), whether they were neurofilament protein- immunoreactive, and whether the immunoreactivity was restricted to the dendrites. After mapping all points detect- able with a 4 0 ~ Plan-Neofluar objective, the pial and white matter borders as well as the border between layers I11 and V were mapped with a 1 0 ~ Fluar objective. It was possible to move between objectives, keeping complete fidelity of cell and contour spatial locations (Young et al., 1995). On completion of the map, areas of interest (such as individual layers in cingulate subareas) could be outlined and the number of points of each structure type reported. Numbers were expressed as the total number of retrogradely labeled

MOTOR PROJECTION NEURONS IN THE CINGULATE CORTEX 141
Fig. 3. Adjacent parasagittal sections through the ventral bank of the cingulate sulcus stained with Nissl (A) and antibody SMI-32 (B). The differences in cortical organization between the anterior and posterior cingulate regions are relatively difficult to perceive on the Nissl stained material, where a thin layer IV emerges posteriorly on top of the characteristically pronounced layer Va, marking the anterior border of area 23c (A, star). Neurofilament protein immunohistochem-
neurons in the anterior or posterior projection for each animal. Ipsilaterally and contralaterally projecting neurons were quantified and analyzed separately. Previously pub- lished criteria for marking the boundary between the rostra1 and caudal cingulate motor areas, for instance the posterior end of the arcuate spur (Morecraft and Van Hoesen, 19921, were not always useful, as animals varied considerably in their sulcal patterns. However, the anterior commissure proved to be a reliable landmark, less affected by slightly different angles of section, and corresponded well stereotactically to the level of the arcuate spur (Szabo and Cowan, 1984). Such landmarks were rarely necessary, however, because the retrogradely labeled neu- rons generally had a bimodal spatial distribution, and the anterior and posterior projections were clearly separable. Since the underlying statistical distribution was unknown, a chi-square test was used to analyze the difference in neurofilament protein immunoreactivity between anterior and posterior projections in layers I11 and V-VI in each animal.
istry, however, shows more dramatic changes, as layer I11 neurons appear anteriorly (B, arrowhead, left), increase in density, and then decrease in density posteriorly (B, arrowhead, right) at a point slightly caudal to the border between areas 24 and 23. These photomicrographs are from the cingulate cortex of a macaque monkey that was not used for in the mapping part of the present study. A, anterior; P, posterior. Scale bar = 500 pm.
Cell loading, reconstruction, and confocal analysis
In three cases (CYN2-41, the other cingulate gyrus was dissected, cut into approximately 5 mm-thick coronal blocks, and postfixed for 2 hours in 4% paraformaldehyde. Then the blocks were placed into PBS and cut at 300 pm on a Vibratome. For intracellular injection, the sections were mounted on nitrocellulose filter paper and immersed in PBS. FB or DY-containing neurons were identified under epifluorescence with a UV filter, impaled, and loaded with 5% Lucifer Yellow (Molecular Probes, Eugene, OR) in dHzO under a DC current of 3 to 8 nA for 10 to 12 minutes, or until the dye had filled distal processes and no further loading was observed (De Lima et al., 1990). Sections containing filled cells were then cover-slipped with Vectash- ield mounting medium and reconstructed using the micros- copy system and NeuroZoom software described above. Cells were located by using a Zeiss Fluar l ox objective and drawn using a Zeiss Apochromat 1 0 0 ~ objective with a numerical aperture of 1.4. A live RGB image was ported to

142 E.A. NIMCHINSKY ET AL.
Fig. 4. Series of coronal photomontages through several levels of the macaque monkey cingulate sulcus stained with Nissl (A, C, E, G ) or antibody SMI-32 (B, D, F, H). Each pair represents adjacent sections from the different levels. Note the prominent layer Va and absence of a defined layer IV in areas 24b and 24c in the anterior cingulate cortex (A-F), whereas the posterior cingulate cortex has a well-defined layer
IV (G, asterisks). The large arrow on panels A-F indicates the border of the cingulate cortex with the supplementary motor area (SMA), which is notable for the increased density of intensely immunoreactive layer I11 neurons. The short arrows show the border between area 24c and 24b. Scale bar = 500 pm.
the computer screen, and mapping was performed by moving the stage in I-pm steps through the z axis along the length of each dendrite. Spines were plotted at the same time. Then the section itself was drawn at l ox . In this manner, the x, y, and z coordinates of each dendritic segment of spine were recorded to enable later three- dimensional representation and rotation of the recon- structed neuron as well as rendering of the neuron in a macroscopic context. To compare the spine densities of the reconstructed neurons, an oval was drawn, centered on the
soma, which excluded the most distal portions of the dendritic tree. This was necessary because many dendrites extended deep into the section, and whereas the dendritic shaft could be resolved at depths in excess of 150 km into the section, Lucifer Yellow-filled dendritic spines became difficult to resolve. Thus, the apparent low spine density at the tips of dendritic branches could not be relied on (see, for instance, the terminal branches of the apical dendrite of neuron D in Fig. 15). The total dendritic length and number of spines enclosed in the oval was obtained, and the number

MOTOR PROJECTION NEURONS IN THE CINGULATE CORTEX 143
Figure 4 (Continued.)
of spines per length of dendrite calculated. After reconstruc- tion, the section was rinsed, cryoprotected in 25% sucrose, and subsectioned on a cryostat at 30 pm. Immunocytochem- istry was performed as described above, by using a second- ary antibody conjugated to the cyanine dye Cy-5 (Jackson ImmunoResearch Laboratories, West Grove, PA), and the sections were mounted and coverslipped. The labeled neu- rons were located again by using conventional fluorescence
microscopy and scanned on a confocal laser scanning micro- scope (Zeiss LSM 410) with a 63x or 40x objective. For visualization of Lucifer Yellow, an ArKr 4881568 laser and a 515-565 bandpass emission filter were used. For visualiza- tion of immunoreactivity with Cy-5, a HeNe 647 nm laser was used with a 670-810 bandpass emission filter. Cy-5 was used because lower wavelength dyes, such as those that emit in the visible red range, cannot be separated ad-
144 E.A. NIMCHINSKY ET AL.
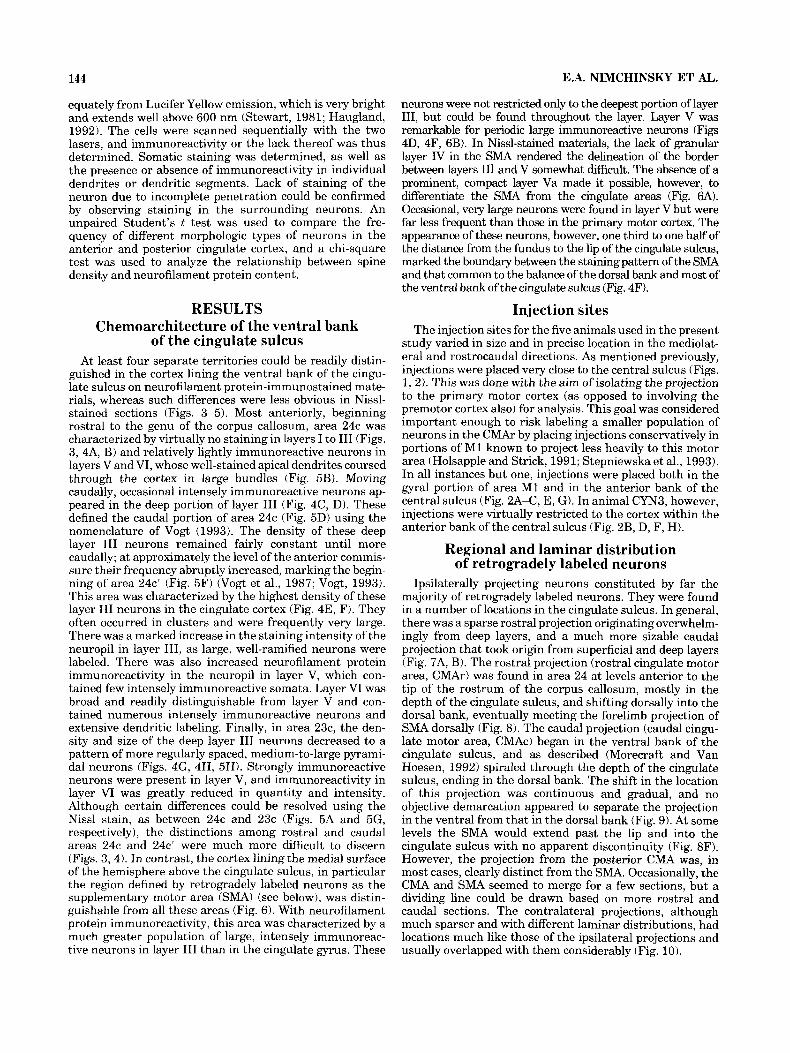
equately from Lucifer Yellow emission, which is very bright and extends well above 600 nm (Stewart, 1981; Haugland, 1992). The cells were scanned sequentially with the two lasers, and immunoreactivity or the lack thereof was thus determined. Somatic staining was determined, as well as the presence or absence of immunoreactivity in individual dendrites or dendritic segments. Lack of staining of the neuron due to incomplete penetration could be confirmed by observing staining in the surrounding neurons. An unpaired Student’s t test was used to compare the fre- quency of different morphologic types of neurons in the anterior and posterior cingulate cortex, and a chi-square test was used to analyze the relationship between spine density and neurofilament protein content.
RESULTS Chemoarchitecture of the ventral bank
of the cingulate sulcus At least four separate territories could be readily distin-
guished in the cortex lining the ventral bank of the cingu- late sulcus on neurofilament protein-immunostained mate- rials, whereas such differences were less obvious in Nissl- stained sections (Figs. 3-5). Most anteriorly, beginning rostral to the genu of the corpus callosum, area 24c was characterized by virtually no staining in layers I to I11 (Figs. 3, 4A, B) and relatively lightly immunoreactive neurons in layers V and VI, whose well-stained apical dendrites coursed through the cortex in large bundles (Fig. 5B). Moving caudally, occasional intensely immunoreactive neurons ap- peared in the deep portion of layer I11 (Fig. 4C, D). These defined the caudal portion of area 24c (Fig. 5D) using the nomenclature of Vogt (1993). The density of these deep layer I11 neurons remained fairly constant until more caudally; at approximately the level of the anterior commis- sure their frequency abruptly increased, marking the begin- ning of area 24c’ (Fig. 5F) (Vogt et al., 1987; Vogt, 1993). This area was characterized by the highest density of these layer I11 neurons in the cingulate cortex (Fig. 4E, F). They often occurred in clusters and were frequently very large. There was a marked increase in the staining intensity of the neuropil in layer 111, as large, well-ramified neurons were labeled. There was also increased neurofilament protein immunoreactivity in the neuropil in layer V, which con- tained few intensely immunoreactive somata. Layer VI was broad and readily distinguishable from layer V and con- tained numerous intensely immunoreactive neurons and extensive dendritic labeling. Finally, in area 23c, the den- sity and size of the deep layer I11 neurons decreased to a pattern of more regularly spaced, medium-to-large pyrami- dal neurons (Figs. 4G, 4H, 5H). Strongly immunoreactive neurons were present in layer V, and immunoreactivity in layer VI was greatly reduced in quantity and intensity. Although certain differences could be resolved using the Nissl stain, as between 24c and 23c (Figs. 5A and 5G, respectively), the distinctions among rostral and caudal areas 24c and 24c‘ were much more difficult to discern (Figs. 3,4). In contrast, the cortex lining the medial surface of the hemisphere above the cingulate sulcus, in particular the region defined by retrogradely labeled neurons as the supplementary motor area (SMA) (see below), was distin- guishable from all these areas (Fig. 6). With neurofilament protein immunoreactivity, this area was characterized by a much greater population of large, intensely immunoreac- tive neurons in layer I11 than in the cingulate gyrus. These
neurons were not restricted only to the deepest portion of layer 111, but could be found throughout the layer. Layer V was remarkable for periodic large immunoreactive neurons (Figs 4D, 4F, 6B). In Nissl-stained materials, the lack of granular layer IV in the SMA rendered the delineation of the border between layers I11 and V somewhat difficult. The absence of a prominent, compact layer Va made it possible, however, to differentiate the SMA from the cingulate areas (Fig. 6A). Occasional, very large neurons were found in layer V but were far less frequent than those in the primary motor cortex. The appearance of these neurons, however, one third to one half of the distance from the fundus to the lip of the cingulate sulcus, marked the boundary between the stainingpattern of the SMA and that common to the balance of the dorsal bank and most of the ventral bank of the cingulate sulcus (Fig. 4F).
Injection sites The injection sites for the five animals used in the present
study varied in size and in precise location in the mediolat- era1 and rostrocaudal directions. As mentioned previously, injections were placed very close to the central sulcus (Figs. 1, 2). This was done with the aim of isolating the projection to the primary motor cortex (as opposed to involving the premotor cortex also) for analysis. This goal was considered important enough to risk labeling a smaller population of neurons in the CMAr by placing injections conservatively in portions of M1 known to project less heavily to this motor area (Holsapple and Strick, 1991; Stepniewska et al., 1993). In all instances but one, injections were placed both in the gyral portion of area M1 and in the anterior bank of the central sulcus (Fig. 2A-C, E, GI. In animal CYN3, however, injections were virtually restricted to the cortex within the anterior bank of the central sulcus (Fig. 2B, D, F, H).
Regional and laminar distribution of retrogradely labeled neurons
Ipsilaterally projecting neurons constituted by far the majority of retrogradely labeled neurons. They were found in a number of locations in the cingulate sulcus. In general, there was a sparse rostral projection originating ovenvhelm- ingly from deep layers, and a much more sizable caudal projection that took origin from superficial and deep layers (Fig. 7A, B). The rostral projection (rostral cingulate motor area, CMAr) was found in area 24 at levels anterior to the tip of the rostrum of the corpus callosum, mostly in the depth of the cingulate sulcus, and shifting dorsally into the dorsal bank, eventually meeting the forelimb projection of SMA dorsally (Fig. 8). The caudal projection (caudal cingu- late motor area, CMAc) began in the ventral bank of the cingulate sulcus, and as described (Morecraft and Van Hoesen, 1992) spiraled through the depth of the cingulate sulcus, ending in the dorsal bank. The shift in the location of this projection was continuous and gradual, and no objective demarcation appeared to separate the projection in the ventral from that in the dorsal bank (Fig. 9). At some levels the SMA would extend past the lip and into the cingulate sulcus with no apparent discontinuity (Fig. 8F). However, the projection from the posterior CMA was, in most cases, clearly distinct from the SMA. Occasionally, the CMA and SMA seemed to merge for a few sections, but a dividing line could be drawn based on more rostral and caudal sections. The contralateral projections, although much sparser and with different laminar distributions, had locations much like those of the ipsilateral projections and usually overlapped with them considerably (Fig. 10).

MOTOR PROJECTION NEURONS IN THE CINGULATE CORTEX 145
Fig. 5. Cytoarchitecture and chemoarchitecture at selected levels of the cingulate gyms shown by Nissl stain (A, C, E, G) and neurofila- ment protein immunoreactivity (B, D, F, HI. (A, B) Area 24c, rostral to the anterior projection. (C, D) Rostra1 portion of area 24c’ at the level of the anterior projection. (E, F) Caudal portion of area 24c’ at a level of the posterior projection. (G, H) Area 23c caudal to the posterior projection. All pairs of photomontages represent equivalent fields from
immediately adjacent sections. For the exact locations of these photo- montages, see Figure 11. Note the absence of layer IV at all levels except G and H. Also note the progressive increase in the density of neurofila- ment protein-immunoreactive neurons in the deep portion of layer 111, which peaks at the level of the caudal cingulate motor area (E, F). WM, white matter. Scale bar = 100 bm.
As a result of individual differences among animals and the variability among injection sites (Fig. 11, the precise localization of the rostral and caudal cingulate motor areas as labeled varied greatly among animals (Figs. 11, 12). However, in all cases, the locations of the projections corresponded to chemoarchitectural features, with the ante- rior projection located in caudal 24c and the posterior projection in 24c’. No retrogradely labeled cells were found
at levels that had no neurofilament protein-immunoreac- tive neurons in layer I11 or at levels containing a clear layer IV or other characteristics of area 23c (Fig. 4G, H).
Case CYN3 had virtually no retrogradely labeled neurons projecting ipsilaterally to area M1 that would correspond to an anterior projection (Fig. 11). This was not due to a lack of transport, because the posterior projection was amply represented, or to some anomalous interruption of fibers

146 E.A. NIMCHINSKY ET AL.
Fig. 6. Cytoarchitecture and chemoarchitecture of the forelimb representation of the supplementary motor area (SMA). Nissl stain (A) and neurofilament protein immunoreactivity (B). Note the large popu-
lation of neurofilament protein-containing neurons in layer 111, the absence in Nissl-stained material of layer IV, and a compact layer V as seen in the cingulate cortex. Scale bar = 100 pm.
leading into this area, because there was a contralateral anterior projection. In all other cases, the retrogradely labeled neurons located anteriorly originated largely in layer V and, to a lesser extent, in layer VI. The proportion of projecting neurons found in layers V and VI varied from 77% to 95% in the anterior projection (mean = 88%; Table 1). The location of the posterior projection was somewhat more variable. I t was much larger in rostrocaudal extent than the anterior projection, and its cells far more numer- ous (Fig. 11). Retrogradely labeled neurons were evenly distributed in superficial and deep layers (51% and 49%, respectively; Table 1). In case CYN1, both anterior and
posterior projections to ipsilateral area M1 were very sparse. The anterior projection was especially small, but in contrast to that of CYN3, it was clearly defined and spanned several consecutive sections (Fig. 11). The posterior projec- tion had a bimodal distribution, with a trough of low numbers of cells between two larger projections (Fig. 11). Cases CYNB, CYN4, and CYN5 were generally comparable in size and distribution of their anterior projections, al- though in CYN2, both rostra1 and caudal projections were shifted anteriorly (Fig. 11).
Neurons projecting to the contralateral forelimb region of area M1 were less numerous but also showed anterior

MOTOR PROJECTION NEURONS IN THE CINGULATE CORTEX 147
Fig. 7. Low-magnification photomicrographs of representative sec- tions through the anterior (A) and posterior (B) projections in monkey CYN4. Photomicrograph A was taken in the fundus of the eingulate sulcus. For the exact locations of these photomicrographs, see Figure
11. (C, D) Neuron in the deep portion of layer I11 in the posterior projection that is retrogradely labeled (C) and neurofilament protein- immunoreactive (D). Note the relatively small number of immunoreac- tive neurons in this layer. Scale bar = 100 km (A, B) and 25 pm (C , D).
and posterior distributions, even in case CYN3, which lacked an anterior ipsilateral projection (Fig. 12). As in the ipsilateral anterior projection, the contralateral anterior projection arose mostly from deep layers (89%), and the posterior projection had a contribution from layer I11 (Table 1). However, even in the posterior projection, retro-
tered, albeit infrequently. Of the 75 such neurons counted, 81% were in layers V and VI. The FB-containing and DY-containing neurons found in layer I11 almost always belonged to the group of large neurons located along the border between layers I11 and V.
Neurofilament protein content gradely labeled neurons were more numerous in deep than in superficial layers (72 versus 28%, respectively). In addi- tion, they were very frequently located in layer VI, not V, as When retrogradely labeled neurons were analyzed for the . - were the ipsilaterahy prbjecting neurons.
Neurons containing both retrograde labels and therefore projecting to area M1 in both hemispheres were encoun-
presence of neurofilament protein, laminar differences arose (Table 2; Figs. 8-10). In the posterior projection, ipsilater- ally projecting neurons in layer I11 were much less likely to

148 E.A. NIMCHINSKY ET AL.
C
C
I \
Fig. 9. Representative maps (A-G) showing the disposition and neurofilament protein content of ret- rogradely labeled neurons in the pos- terior iasilateral oroiection. Conven-
F
Fig. 8. Representative maps (A-F) showing the disposition and neurofilament protein content of retrogradely labeled neurons in the anterior ipsilateral projection. Nonimmunoreactive retrogradely la- beled neurons are indicated by open circles, and neurofilament protein- immunoreactive neurons are indicated by filled circles. The gray line marks the border between layers I11 and V. The region represented by this set of maps is indicated in Figure 11. Note the predominant localization in deep cortical layers. The supplementary motor area (SMA) is present throughout this series, in the cortex of the medial wall above the cingulate sulcus. The ventral bank of the cingulate sulcus (CMAr) shifts from the depths of the cingulate sulcus dorsally, approach- ing the SMA. The strip of neurons in the ventral bank of the cingulate sulcus proved to be the anterior tip of the posterior projection.
I "
tions are the same as for Figure 8. The region represented by this set of maps is indicated in Figure 11. Note the greater density of this projection than the CMAr, and its location in superficial as well as deep layers. Note also the greater density of im- munoreactive neurons in deep rather than superficial layers. The caudal cingulate motor area (CMAc) begins anteriorly in the ventral bank of the cingulate sulcus and shifts dorsally, eventually ending in the dorsal bank of the cingulate sulcus.

MOTOR PROJECTION NEURONS IN THE CINGULATE CORTEX 149
A B
Fig. 10. Representative maps showing the disposition and neurofila- ment protein content of retrogradely labeled neurons in the anterior (A-B) and posterior (C-D) contralateral projections. Conventions are the same as for Figure 8. The regions represented by these sets of maps are indicated in Figure 12. Both of these projections occupy positions comparable to those of the analogous ipsilateral projections, but they tend to originate in the deeper layers of thc cortex.
contain neurofilament protein in their somata than those in layers V and VI (38 versus 61% overall, respectively; Fig. 9). However, these layer I11 neurons were just as likely to contain neurofilament protein as the far scarcer layer I11 neurons in the anterior projection (28 versus 38% overall, respectively; P > 0.05). Layer V and VI neurons in general were also equally as likely to contain neurofilament protein anteriorly as posteriorly (61% overall for both, P > 0.05). However, in two animals, significant differences were ob- served, with layer V and VI neurons in the anterior projection more likely than those in the posterior projection to contain neurofilament protein (Table 2).
As in the ipsilateral projections, contralaterally project- ing neurons in layer I11 were less enriched in neurofilament protein than those in layers V and VI, but the proportion was higher than for the ipsilaterally projecting neurons. In addition, their numbers were very low overall, making comparisons difficult to interpret (Fig. 10). The proportion of immunoreactive layer V and VI neurons in the contralat- era1 projections was comparable to that of the ipsilaterally projecting neurons in the same layer (Table 2). As was the
case with the ipsilateral projections, there was generally no difference in the proportion of neurons containing neurofila- ment protein between the anterior and posterior projec- tions for layer 111 or layers V and VI. In one animal (CYN5), layer V and VI neurons in the posterior projection were significantly more likely to contain neurofilament protein than cells in the anterior projection in the same layers (P = 0.021, but this was the only instance of such a difference. Neurons containing both FB and DY, although scarce, were the population most likely to be neurofilament protein- immunoreactive, with 86% in layer I11 and 84% in layers V and VI containing neurofilament protein. Finally, the analy- sis of retrogradely labeled neurons in the SMA in two animals indicated that the proportion of neurofilament protein-containing neurons in this projection was compa- rable to the proportions found in anterior and posterior CMAs (39% for layers I1 and III,64% for layers V and VI).
Neuronal morphology Morphologic studies of Lucifer Yellow-loaded retro-
gradely labeled neurons projecting from anterior and poste- rior CMA to the forelimb region of area M1 revealed heterogeneity with certain recurring features (Table 3; Fig. 13). Virtually all layer I11 neurons, whether located anteri- orly or posteriorly, were typical pyramidal neurons (Figs. 14, 15). In layers V and VI, however, atypical pyramidal cells were often encountered, more frequently in anterior than in posterior cingulate cortex (P < 0.0025). For instance, pyramidal cells with one major basal dendrite that was strongly oriented n one direction (either toward the midline or the lateral aspect of the brain) constituted 39% of the layer V and VI cells studied in anterior cingulate; of these, 71% had their major basal dendrite directed laterally (Fig. 1 4 G J ) . In posterior cingulate, 11% had major basal dendrites with a preferred orientation-laterally in all cases. Fusiform cells constituted 17% of the deep layer cells in CMAr, but only 7% in CMAc (for example, see Fig. 14C). After reconstruction, confocal microscopic analysis of immu- nocytochemically stained cells revealed no clear correlation between somatodendritic morphology and neurofilament protein content. For instance, the two layer I11 neurons shown in Figure 16 (reconstructed in Fig. 15A, C), both projecting ipsilaterally and with extensive dendritic arbori- zation, differed markedly in their neurofilament protein content: one of them having a strongly immunoreactive soma and apical dendrite and nonimmunoreactive basal dendrites, and the other with a nonimmunoreactive soma and apical dendrite but with a few very lightly immunoreac- tive secondary dendrites (Fig. 16A-F). The presence or absence of immunoreactivity bore no apparent relationship with the order or caliber of the dendrite in question (Fig. 16G-L). Furthermore, analysis of 17 reconstructed neu- rons revealed no correlation between spine density and neurofilament content (P = 0.64 for layer I11 and P = 0.21 for layers V-VI; Table 4). For instance, the neurons de- scribed above (Fig. 15A, 15C) had comparable spine densi- ties (0.439 and 0.460 spines per Fm of dendritic length, respectively). Conversely, there was no clear morphologic feature common to all neurofilament protein-enriched neu- rons or to all those that lacked neurofilament protein.

150 E.A. NIMCHINSKY ET AL.
CYNl
200
150
100
50
0
CYN2
350 300 250 200
150 100 50
0
400 500 c 300 1 I
I I I
-
n / I 2 4 1 2 3 CYN3
200
100
0
6oo 500 1 d I
I I 7 I nn
400
300
200
100
n "
gv I R
-a- I
300
Layers 11-111
Layers V-VI 100
-b- Fig. 11. Distribution and laminar origin of retrogradely labeled
neurons following injections into the ipsilateral M1. The total number of ipsilaterally projecting neurons is indicated for each section between the genu and the splenium of the corpus callosum. Note the differences in the scales of they axis, due to the varying number of neurons counted in the five monkeys. The vertical dashed lines indicate, in each case, the position of the border between the anterior and posterior projections.
The thin arrow posteriorly indicates the border between areas 24 and 23, as defined by the criteria described in the text. The lines marked (a) and (b) indicate the region spanned by the series of maps shown in Figures 8 (a) and 9 (b). The closed arrows indicate the levels of photomicrographs 7A (c ) and 7B (d). The open arrows indicate the levels of the photomontages shown in Figures 5A-B (el, 5 C D (f ), 5E-F (g), and 5G-H (h).

MOTOR PROJECTION NEURONS IN THE CINGULATE CORTEX
8 r I
151
CYNl
25 r- I n
CYN2
6o r n 50 40 24 I 23
30
20
10
0
I 120 r I - 7.4
CYN3
2o r I I
CYN4
100
80
60
40
20
0 -a-
23 CYN5
15
Layers 11-111 10
Layers V-VI 5
0
Fig. 12. Distribution and laminar origin of retrogradely labeled neurons following injections into the contralateral M1. Conventions are the same as for Figure 11. Note the differences in the scales of they axis
due to the varying number of neurons counted in the five monkeys. The lines marked (a) and (b) indicate the region spanned by the series of maps shown in Figure 10A-B (a) and 1OC-D (b).

152 E.A. NIMCHINSKY ET AL.
TABLE 1. Proportion of retrogradely labeled neurons in anterior and posterior CMA projecting to M1 located in layers 11-111 or V-VI’
CYNl CYNP CYN3 cYN4 CYN5
ant post ant post ant post ant post ant post
1-111 (96) 15 51 23 55 17 39 7 55 5 52 Ipsilateral
V-VI (%I 85 49 77 45 83 61 93 45 95 48 Total 46 855 178 1561 24 2163 217 3887 170 1544
‘Data represent the percentage of the total number of neurons counted in the ipsilatcral and contralateral projections of each animal in layers 11-111 and V-VI. Ant, rostral cingulate motor area, CMAr; post, caudal cingulate motor area, CMAc. As discussed in the text, no defined anterior ipsilateral projection was observed in monkey CYN3, in that there were few retrogradely labeled neurons, and they were widely scattered (see Fig. 11).
TABLE 2. Proportion of retrogradely labeled neurons in anterior and posterior CMA projecting to M1 that contain neurofilament protein’
CYNl CYNB CYNB CYN4 CYN5
ant post ant post ant post ant post ant post
Ipsilateral 1-111 (7c) 14 20 32 25
Total 7 435 41 865 V-VI (70) 59 41 58 61
Total 39 420 137 696
11-111 (8) 0 0 27 50 Total 1 1 11 16
v-VI (%I 44 53 65 68 Total 16 15 48 125
Contralateral
100 4
80 20
0 0
73 26
39 47 28 854 15 2137
70 73 62 1309 202 1750
73 49 69
438
43 52 28 526 58 66
185 964
44 26 9 809
47 51 161 735
0 63 0 52
52 72 44 114
‘Data represent the percentage oftotal neurons counted in each animal in layers 11-111 and V-VI. Ant, rostral cingulate motor area, CMAr; post, caudal cingulate motor area, CMAc. As discussed in the text, no defined anterior ipsilateral projection was observed in monkey CYN3, in that there were few retrogradely laheled neurons, and they were widely scattered (see Fig. 11).
TABLE 3. Numbers of Lucifer Yellow-loaded neurons of different morphologic types in CMAr and CMAc’
CMAr CMAc
11-111 v-VI 11-111 v-VI
Typical pyramid 7 (100) 11 (31) 19 (90) 15 (54) Large pyramid 0 (0) 1 ( 3 l 2 (101 5 (18) Asymmetric, lateral 0 (0) 10 (28) 0 (0) 3 (11) Asymmetric, medial . 0 (0) 4 (11) 0 (0) 0 (0) Fusiform 0 (0) 6 (17) 0 (0) 2 ( 7 ) Other 0 (0) 4 (11) 0 (01 3 (11)
1CMAr and CMAc refer, respectively, to the anterior and posterior cingulate motor areas. The percentage of the total number counted is indicated in parentheses. “Large pyramids” are neurons with a very large soma and a slightly tapering, stout apical dnedrite. Neurons categorized as “asymmetric, lateral” are neurons with a single major basal dendrite, which was oriented toward the interior of the hemisphere. “Asymmetric, medial” neurons have their major basal dendrite oriented toward the medial surface of the hemisphere. These counts represent the combined results of three animals. A total of 92 Lucifer-Yellow filled neurons were analyzed. For the topographic distribution of these cell t p e s , see Figure 13
Neurons in both groups included typical pyramids, fusiform neurons, and asymmetric forms (Figs. 14, 15).
DISCUSSION Location and laminar origin of the cingulate
projections to area M1 The present study reveals certain differences and similari-
ties between the projections from CMAr and CMAc to the forelimb region of the primary motor cortex. The primary differences are in overall size, laminar origin, and somatic morphology of the constituent neurons. However, the neurochemical phenotype as reflected in neurofilament immunoreactivity is similar in both cingulate motor projec- tions and in the SMA. Finally, this study describes the existence of a reliable marker for the cingulate motor areas,
TABLE 4. Spine density of reconstructed neuronsi
Area Cell analyzed Spinesilength Lengthispine NFP
Layers 11-111 11A 11B 12A 12B 12c
Layers V-VI 1 IC 11D 11E 11F 11G 11H 111 llJ 12D 12E 12F 12G 12H
25000 13000 50000 20000
7000 35000 35000 40000 35000 45000 35000 15000 19000 10000 20000 20000 25000 30000
0.253 0.171 0.439 0.249 0.460 0.133 0.275 0.110 0.094 0.107 0.107 0.068 0.087 0.238 0.137 0.101 0.218 0.050
3 95 5.85 2.28 4.01 2.17 7.54 3.64 9.07
10.60 9 35 9.33
14.75 11.50 4.20 7.29 9.94 4.59
20.20
‘Neurons are identified by their label in Figures 14 and 15. For each neuron, a circle was drawn, centered around the soma, such that the most distant ends were not included (see text). Area analyzed refers to the area of the circle in which spine density was analyzed. Dendritic length is expressed in pm; area in pm2. The rightmost column indicates, where available, the presence or absence of neurofilament protein (NFP) in each neuron. No statistically significant difference was observed between immunonegative and immunoposi- tive neurons. “n.a.” indicates that the neuron was not available for confocal analysis.
namely its distinctive pattern of neurofilament protein distribution.
In agreement with earlier studies (Dum and Strick, 1991; Shima et al., 1991; Morecraft and Van Hoesen, 1992), the present study places the anterior projection in cytoarchitec- tonic area 24c. It was clear, however, that the posterior projection (at least for the forelimb representation) resides not in area 23c as previously reported (Dum and Strick, 1991; Shima et al., 1991; Morecraft and Van Hoesen, 1992), but in an agranular or dysgranular area here referred to as 24c’. This is in agreement with the conclusions of Matelli et al. (1991) and others (Luppino et al., 1991, 19931, who

MOTOR PROJECTION NEURONS IN THE CINGULATE CORTEX 153
A Layers 11-111
W Layers V-VI
W A typical pyramid a large typical pyramid 0 pyramid, thin apical dendrite V inverted pyramid
/ asymmetric, lateral { asymmetric, medial
-horizontal
Fig. 13. Distribution of Lucifer Yellow-loaded neurons of various morphologic types in layers 11-111 (top) and layers V-VI (bottom). These data represent a composite of the neurons loaded in three monkeys. No attempt is made to indicate the relative sublaminar positions of the neurons within the cortex. “Asymmetric, lateral” and “asymmetric, medial” refer, respectively, to neurons whose single major basal dendrite is oriented laterally, toward the interior of the hemisphere, and medially, toward the medial surface of the hemi- sphere. A quantitative analysis of these neurons and their distribution is presented in Table 3.
referred to this area as area 24d. The present study made use only of the putative forelimb representation to define motor areas. This fact does not affect the preceding interpre- tation, however. This is because after the face representa- tion, the forelimb representation in the anterior CMA is the most rostral, followed by the hindlimb, then in the posterior CMA by forelimb and hindlimb representations as well (Dum and Strick, 1991; Luppino et al., 1991; Morecraft and Van Hoesen, 1992; He et al., 1995). Thus, the first appear- ance of retrogradely labeled neurons in this study marks the onset of the representation of the body below the neck; the low-density area between the two projections probably accommodates the anterior hindlimb representation, and their disappearance caudally represents the end of the caudal forelimb representation. This would explain why retrogradely labeled neurons disappear before the begin- ning of area 23c, since it would make sense for the posterior hindlimb projection to be in an area cytoarchitectonically and chemoarchitectonically similar to the one that contains the posterior forelimb projection. In fact, in case CYN4, whose contralateral injection probably extended dorsally well beyond the forelimb region, the distribution of retro-
gradely labeled neurons in the contralateral cingulate gyrus was very extensive in the rostrocaudal axis for both anterior and posterior projections. In this case, the involvement of hindlimb projections partially filled in the gaps seen with the other injections, further supporting previous reports of the somatotopy of this region. This case appears to indicate that the hindlimb representation may indeed occupy the most rostral portion of area 23.
Features of the ipsilateral anterior projection consistent across all animals but one (CYN3) were its sparseness, its preferential location in the depths of the cingulate sulcus, and its origin almost exclusively in deep layers. The more pronounced sparseness of the anterior projection than that described in other reports may be due to the near restric- tion of the injection in the anterior bank of the central sulcus (i.e., it did not extend as far rostrally as in the other animals). All injection sites involved this region, but most were not restricted to it. One exception is case CYN3, where virtually no anterior ipsilateral projection was observed. Examination of the injection site lends support to an earlier finding that the anterior wall of the central sulcus in the forelimb region, to which this injection site was virtually restricted, does not project heavily to CMAr (Holsapple and Strick, 1991). Similarly, a recent study in the owl monkey found that the posterior portion of the primary motor cortex projected to the posterior, not the anterior, cingulate motor area (Stepniewska et al., 1993). Although anatomic differences exist between New World and Old World mon- keys, these data support the existence of similar connectiv- ity patterns of caudal and rostral portions of area M1 in these two species.
The absence of a separate, dorsal posterior projection corresponding to the CMAd earlier described was the only significant departure in the present data from earlier reports of these projections (Hutchins et al., 1988; Dum and Strick, 1991; He et al., 1995). However, other descriptions have also been unable to make an anatomic distinction between projections in the ventral and dorsal banks of the cingulate sulcus (Morecraft and Van Hoesen, 1992; Galea and Darian-Smith, 1994; Rouiller et al., 1994). In other words, there appears to be no clear discontinuity in the distribution of projecting neurons that would signal the presence of a completely separate representation. It is possible that this discrepancy is due to alternative interpre- tations of the cortical distribution patterns and differences arising from the use of coronal sections as opposed to flat maps to illustrate neuronal distributions (Hutchins et al., 1988; Dum and Strick, 1991; He et al., 1995). The cytoarchi- tectural and chemoarchitectural characteristics of the ven- tral bank of the cingulate sulcus continue onto the dorsal bank, occupying between one third and one half of the dorsal bank, and the presence of area 6 is indicated by the appearance of very large neurons in layer V. This continua- tion of area 24 beyond the depth of the cingulate sulcus is in apparent conflict with some earlier studies (Barbas and Pandya, 1987; Dum and Strick, 1991) but is in agreement with the work of Matelli et al. (19911, Luppino et al. (1991), and Morecraft and Van Hoesen (1992). Thus, the present study recognizes only two cingulate motor areas: a small anterior one originating largely from deep layers with a sparse projection to area MI, and a much larger posterior one spanning portions of both banks of the cingulate sulcus, which originates from superficial and deep layers and comes close to, but is completely separate from, the SMA.

154 E.A. NIMCHINSKY ET AL.
Fig. 14. Reconstructions of Lucifer Yellow-loaded neurons partici- patingin the anterior projection to the ipsilateral M1. Cells (A) and (B) were located in layer 111, and the truncation of their apical dendrites was a result of sectioning. The most commonly encountered morpho- logic cell types in deep cortical layers were fusiform neurons (B) and asymmetric pyramidal neurons with one dominant basal dendrite that
was usually oriented laterally, toward the interior of the hemisphere (G-J). More rare were typical (F) and inverted (D) pyramids or neurons with a bifid basal dendrite (E). Inset shows the positions of the reconstructed neurons. Only neurons A, B, D, E, H, and J were neurofilament protein immunoreactive. Neuron G could not be recov- ered for confocal analysis. Scale bar = 100 bm.
MOTOR PROJECTION NEURONS IN THE CINGULATE CORTEX 155
B
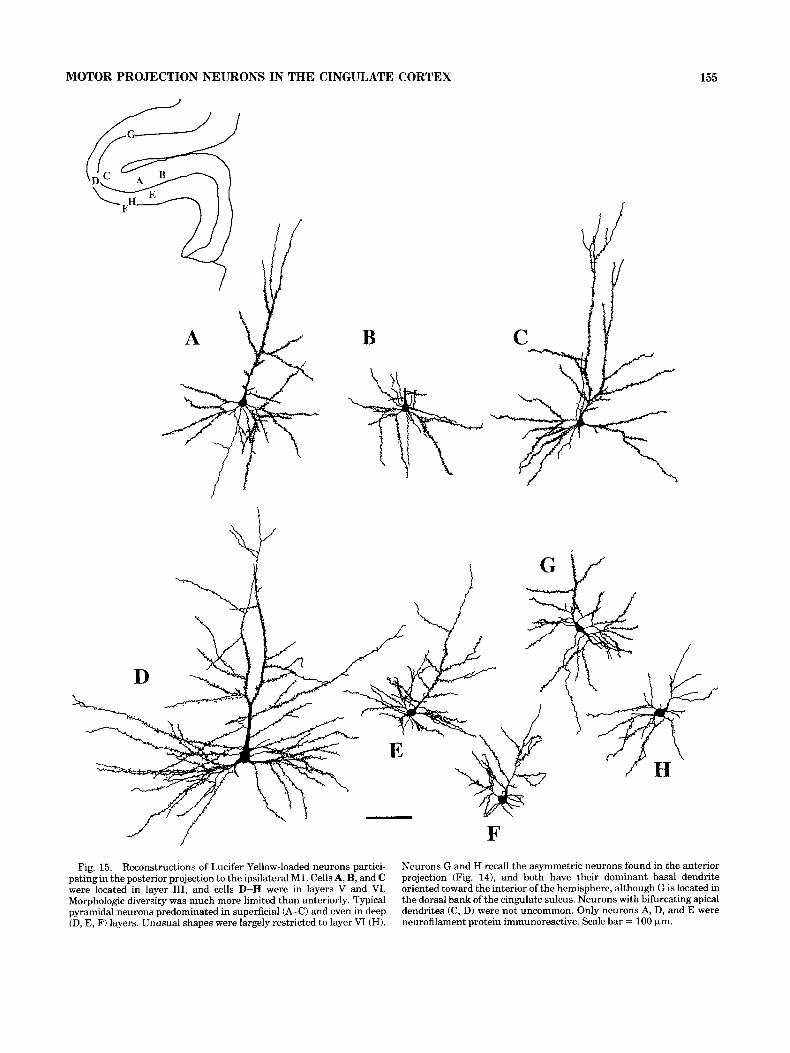
Fig. 15. Reconstructions of Lucifer Yellow-loaded neurons partici- patingin the posterior projection to the ipsilateral M1. Cells A, B, and C were located in layer 111, and cells D-H were in layers V and VI. Morphologic diversity was much more limited than anteriorly. Typical pyramidal neurons predominated in superficial (A-C) and even in deep (D, E, F) layers. Unusual shapes were largely restricted to layer VI (HI.
Neurons G and H recall the asymmetric neurons found in the anterior projection (Fig. 14), and both have their dominant basal dendrite oriented toward the interior of the hemisphere, although G is located in the dorsal bank of the cingulate sulcus. Neurons with bifurcating apical dendrites (C, D) were not uncommon. Only neurons A, D, and E were neurofilament protein immunoreactive. Scale bar = 100 Km.

156
The ipsilateral posterior projection differed most from the anterior projection in that it originated equally from superficial and deep layers. This is in apparent conflict with the findings of Ghosh et al. (1987). However, that study described only one cingulate motor projection, located at a coronal level that is clearly caudal to that of the anterior cingulate projection. In view of the sparseness of the anterior projection in the present study (whose injections closely resemble those of Ghosh et al. [19871), it is not unlikely that the true anterior projection was overlooked in that study and that the projection analyzed actually corre- sponded to the posterior projection reported in our study. Part of the reason for the difference in laminar distribution may be that the posterior CMA is closer than the anterior CMA to the primary motor cortex and is therefore closer to the injection site. In addition, many pyramidal neurons in superficial layers, especially in layer I1 and the superficial portion of layer 111, make short corticocortical connections (Jones and Wise, 1977). However, many (and at some levels most) of the retrogradely labeled layer I11 neurons were located in the deeper portions of layer 111. So whereas these neurons project the same distance as the layer I1 neurons, they may be of a different type, functionally different from those that connect all cortical areas with their immediate neighbors. I t may also be a result of the fact that the anterior-most portion of the cingulate cortex is somewhat less differentiated than slightly more caudal levels, in that the former has no granular layer IV. As one proceeds caudally, small granular neurons begin to appear between layers I11 and V constituting an incipient layer IV, which becomes more developed in the isocortical posterior cingu- late area 23. Because the rostral and caudal motor projec- tions in the present study were located in areas 24c and 24c', respectively, the caudal one may have more of the characteristics of more-differentiated cortex, which would include a tendency for its corticocortical projections to originate in superficial and deep layers. This is in contrast to less-differentiated cortex, whose projections originate mostly from deep layers (Barbas, 1986).
The contralateral projection originated preferentially in deep layers, whether as part of the anterior or the posterior projection. In fact, these neurons were most frequently found in layer VI and often abutted the white matter border. This is in agreement with another account of this projection (Rouiller et al., 1994) and is in marked contrast to most other callosal projections in the macaque monkey, which tend to come from neurons in layer I11 (Innocenti, 1986; Hof et al., 1995b, c). The only other callosal projec- tions in the primate described as originating significantly in layer VI are the homotopic projection to M1 (Zant and Strick, 1978) and the homotopic commissural projection from the hand representation of the SMA, which also originates from superficial layers (Rouiller et al., 1994). Thus, a large contribution from layer VI to commissural projections may be a common feature of motor areas in general.
Differential neuronal morphology in the cingulate motor areas
The greater morphologic diversity observed in the ante- rior projection than in the posterior projection is another feature distinguishing the two. It is possible that the greater variability in somal shape could be explained by a preferential localization in layer VI, where atypical cell types predominate (Tombol, 1984). However, there was no
E.A. NIMCHINSKY ET AL.
greater tendency for the cells in question to be located in layer VI (as opposed to layer V) anteriorly than posteriorly. The spine density reported here for layer I11 neurons is on the order of earlier estimates (Globus and Scheibel, 1967; Kemper et al., 1973; Parnavelas et al., 1973). The slightly lower figures in this study may be the result of the inclusion of the initial segments of the dendrites, which lack spines, in the calculations. The lower spine density for neurons in layers V and VI than in layers I1 and I11 is in agreement with other studies (Kemper et al., 19731, although the occasionally very low densities reported in the present study may point to a distinctive feature of these projections. The finding of more unusual pyramidal cell forms anteri- orly is in agreement with Vogt (19761, who described trends in morphologic types in the posterior cingulate cortex in the macaque. In that study, cortical areas such as areas 29 and 30, which are considered to be less differentiated in that they lack many of the features of isocortex, are character- ized by pyramidal neurons with less elaborate basal den- dritic trees. In fact, many have fusiform somata. As the cortex in area 23 approaches isocortical cytoarchitecture, basal dendritic trees become more extensive, and neuronal packing density is decreased as a result. The present study does not describe such anatomic differences in the ventral- to-dorsal direction, since the cingulate motor areas exist only in the dorsal-most part of the cingulate gyrus. How- ever, similar arguments for progressive cortical elaboration at the areal level have been made for the cortical changes in the anterior-to-posterior direction as well, with the anterior cingulate cortex representing less-differentiated cortex in contrast to the isocortical posterior cingulate cortex (Vogt et al., 1987; Hof and Nimchinsky, 1992). The present study suggests that a neurocytologic trend evident in the progres- sion from ventral to dorsal regions of the gyrus also exists in the similar anterior-to-posterior progression toward isocor- tex. Finally, in the depths of the human cingulate sulcus, there is a cortical field characterized by the presence of giant layer V pyramidal neurons that are remarkable for their dense lipofuscin deposits (Braak and Braak, 1976). Golgi-stained examples of these neurons resemble certain of the neurons described in the present study in that their apical dendrites bifurcate repeatedly, beginning not far from the soma. However, unlike the neurons of the human cingulate cortex, those in the present study have apical dendrites with numerous secondary branches and lack spine-like appendages on the soma. It is also of note that distinctive spindle-shaped neurons are conspicuous in layer Vb of the human anterior cingulate cortex (Nimchinsky et
Fig. 16. Confocal images of two neurons that were retrogradely labeled following injections into the ipsilateral M 1 and loaded with Lucifer Yellow. The left panel in each row is an image of neurofilament protein immunoreactivity, using Cy-5 as a fluorophor, and pseudocol- ored red. The middle panel is the image of Lucifer Yellow, pseudocol- ored green, in the same frame. An overlay of the two, with yellow indicating colocalization, is shown in the right panel. These two neurons, which were reconstructed and appear in Figure 15 as cells A (A-C) and C (D-F), are of comparable laminar position, size, degree of dendritic arborization, and spine density, yet the first (A-C) is immuno- reactive for neurofilament protein and the second (D-F) is not. Panels G I are higher-power images of the apical dendrite and a secondary branch of the neuron shown in panels A-C, and panels J-L are images at the same magnification showing another secondary dendrite from the same neuron. Note that despite comparable caliber and spine density, the dendrites in panels G-I are immunoreactive, whereas that in panels J-L is not. Scale bar = 60 pm (A-F) and 10 pm (G-L).

MOTOR PROJECTION NEURONS IN THE UNGULATE CORTEX 157
Figure 16

158 E.A. NIMCHINSKY ET AL.
al., 1995). Whatever the role of these neurons, these studies in the human indicate that the presence of atypical cell types is a characteristic feature of the anterior portion of the cingulate cortex in general and the cortex of the cingulate sulcus in particular, something the present study suggests is true in the macaque for even a restricted set of projections.
Neurofilament protein represents a reliable marker for cingulate motor areas
The only truly reliable indicators of the presence of the cingulate motor areas were chemoarchitectonic, specifically the presence of large, wide, and clustered neurofilament protein-containing pyramidal neurons in the deep portion of layer I11 and intensely immunoreactive neurons in a broad layer VI. Although cytoarchitectonic differences may be detectable with the Nissl stain, they are far more subtle and difficult to determine precisely than are the chemoarchi- tectonic differences. The presence of large neurofilament protein-containing neurons in layer I11 had earlier been recognized as a feature distinguishing the caudal portions of the cingulate gyrus from the most rostral part (Hof and Nimchinsky, 1992). These cells were observed to appear at first gradually and increase in density as one proceeded from the rostral to the caudal parts of the gyrus. This seemed to correlate with the approximate position of the cingulate motor areas. The present study confirms this finding, with the following observations. First, no retro- gradely labeled neurons were observed in areas devoid of layer I11 neurofilament protein-containing neurons. Sec- ond, in all five animals analyzed in the present study, the first increase in the density of layer I11 neurofilament protein-containing neurons correlated with the first appear- ance of retrogradely labeled neurons, and the further, almost stepwise increase in their density corresponded with the beginning of the caudal projection. The presence of the distinctive chemoarchitecture of area 23c was a reliable indicator that the caudal end of the projection had been reached. Third, deep layer I11 neurofilament protein- containing neurons were themselves occasionally retro- gradely labeled, suggesting that these neurons may play a direct role in the motor projection itself and might not be merely cytoarchitectonic markers.
Finally, the present study demonstrates that neurofila- ment protein immunoreactivity is a useful marker not only for the cingulate motor areas in general as distinct from the rest of the cingulate cortex, but is also able to distinguish between the anterior and posterior projection areas. This is an unusually fine regional subdivision that is made possible by the fact that throughout its extent, the cingulate gyrus exhibits fewer neurofilament protein-immunoreactive neu- rons than other cortical areas, even those just across the cingulate sulcus, such as the SMA. As a result, the superim- position of the CMAs with their large layer I11 and layer VI neurofilament protein-containing neurons is conspicuous and clearly definable.
Consistency of neurofilament protein content in the cingulate motor areas
On the population level, the observation that neurons projecting to the same cortical site (i.e., area M1) from the anterior and posterior areas were equally likely to contain neurofilament protein points to a unifying feature in these two projections. Although in two animals there was a greater proportion of neurofilament protein-containing neu-
rons in layers V and VI in the anterior than in the posterior projection, this was not a consistent trend in the other animals. In two of these other animals, the proportions- although not significantly different-showed a trend in the opposite direction. Thus, neurofilament protein content was not found to be a factor that distinguishes between the two projections. This result was surprising, given the marked difference in the layer I11 neurofilament protein- containing population between the two areas. The fact that the same proportion of this projection contains neurofila- ment protein, irrespective of whether it originates in a neurofilament protein-rich or -poor area, suggests that neurofilament protein content is a factor related to the projection itself and is not merely an artifact of the chemo- architecture of its area of origin. A possibility that presents itself as a result is that the characteristic neurofilament protein-based chemoarchitecture of an area represents the sum total of the neurofilament protein complements of its constituent projections. In other words, the chemoarchitec- ture of an area may be the result, not the determinant, of the neurochemical profile of its efferent projections.
The importance of this commonality in neurochemical phenotype is further reinforced by the fact that the laminar origin of the projection to area M1 and the morphology of the projection neurons are fundamentally different for these two areas and projections. The results of the present study suggest that certain characteristics of a projection, such as its laminar distribution and the somatodendritic morphology of its neurons, may be less related to its function than to the constraints imposed by the cytoarchi- tectonic properties of its area of origin. A study of callosal neurons in the visual cortex of the cat similarly concluded that differences in somatodendritic morphology are more closely related to local influences than target area (Vercelli and Innocenti, 1993). Thus, the differences between the two projections considered here may be attributed to their slightly different positions along the cingulate gyrus and the resultant differences in their immediate milieu. How- ever, although one physiologic study has been able to attribute slightly different properties to these projections (with neurons active in self-paced movements, and those that discharge well in advance of the onset of movement represented more heavily in the CMAr than in CMAc), the same study pointed to the prevalent similarities between them (Shima et al., 1991). This essential functional similar- ity is best reflected in their similar neurochemical profiles. Comparable results have been obtained in studies of other corticocortical connections in the macaque monkey, in which functionally similar projections tend to have compa- rable neurofilament profiles (Hof et al., 1995b, c; Hof et al., 1996). Thus, neurofilament protein content appears to be a more salient property of a projection than laminar distribu- tion or neuronal morphology.
CONCLUSION The primate cingulate cortex is the site of numerous
different functional, cytoarchitectonic, and chemoarchitec- tonic areas (Vogt, 1993). It is evident from the present study that the heterogeneity in this cortical region extends from the regional level to the level of the projection and even to the constituent neurons. Neurochemical phenotype provides a unifying characteristic for these convergent projections. However, it ceases to be informative at the cellular and subcellular level, at least regarding somatoden-
MOTOR PROJECTION NEURONS IN THE CINGULATE CORTEX 159
Hof, P.R., and J.H. Morrison 11990) Quantitative analysis of a vulnerable subset of pyramidal neurons in Alzheimer’s disease: 11. Primary and secondary visual cortex. J. Comp. Neurol. 301 :55-64.
Hof, P.R., and J.H. Morrison (1995) Neurofilament protein defines regional patterns of cortical organization in the macaque monkey visual system: A quantitative immunohistochemical analysis. J. Comp. Neurol. 352: 161- 186.
Hof, P.R., and E.A. Nimchinsky (1992) Regional distribution of neurofila- ment and calcium-binding proteins in the cingulate cortex of the macaque monkey. Cereb. Cortex2:456467.
Hof, P.R., K. Cox, and J.H. Morrison 11990) Quantitative analysis of a vulnerable subset of pyramidal neurons in Alzheimer’s disease: I. Superior frontal and inferior temporal cortex. J. Comp. Neurol. 310:44- 54.
Hof, P.R., E.J. Mufson, and J.H. Morrison l1995a) The human orbitofrontal cortex: Cytoarchitecture and quantitative immunohistochemical parcel- lation. J. Comp. Neurol. 359:48-68.
Hof, P.R., E.A. Nimchinsky, and J.H. Morrison (1995b) Neurochemical phenotype of corticocortical connections in the macaque monkey: Quan- titative analysis of a subset of neurofilament protein-immunoreactive projection neurons in frontal, parietal, temporal, and cingulate cortices. J. Comp. Neurol. 362109-133.
Hof, P.R., L.G. Ungerleider, M.J. Webster, R. Gattass, C.A. Sailstad, W.G.M. Janssen, and J.H. Morrison (1995~) Feedforward and feedback corticocor- tical projections in the monkey visual system display differential neuro- chemical phenotype. Soc. Neurosci. Abstr. 21 :904.
Hof, P.R., L.G. Ungerleider, M.J. Webster, R. Gattass, M.M. Adams, C.A. Sailstad, and J.H. Morrison (1996) Neurofilament protein is differen- tially distributed in subpopulations of corticocortical projection neurons in the macaque monkey visual pathways. J. Comp. Neurol. In press.
Holsapple, J.W., and P.L. Strick (1991) Pattern of projections from the premotor areas on the medial wall of the hemisphere to the primary motor cortex. Soc. Neurosci. Abstr. 171020.
Huntley, G.W., and E.G. Jones (1991) Relationship of intrinsic connections to forelimb movement representations in monkey motor cortex: A correlative anatomic and physiological study. J. Neurophysiol. 66:390- 413.
Hutchins, K.D., A.M. Martino, and P.L. Strick (1988) Corticospinal projec- tions from the medial wall of the hemisphere. Exp. Brain Res. 71 567- 672.
Innocenti, G.M. (1986) General organization of callosal connections in the cerebral cortex. In Jones, E.G., and A. Peters (eds): Cerebral Cortex, Volume 5 , Sensory-motor Areas and Aspects of Cortical Connectivity. New York: Plenum, pp. 291-253.
Jones, E.G. (1984) Laminar distribution of cortical efferent cells. In Peters A,, and E.G. Jones (eds): Cerebral Cortex, Volume 1, Cellular Compo- nents of the Cerebral Cortex. New York: Plenum, pp. 521-553.
Jones, E.G., and S.P. Wise (1977) Size, laminar and columnar distribution of efferent cells in the sensory-motor cortex of monkeys. J. Comp. Neurol. 175:391438.
Kemper, T.L., W.F. Caveness, and P.I. Yakovlev (1973) The neuronographic and metric study of the dendritic arbours of neurons in the motor cortex of Macaca mulatta a t birth and at 24 months of age. Brain 96:765-782.
Kwan, H.C., W.A. Mackey, J.T. Murphy, and T.C. Wong 11978) Spatial organization of precentral cortex in awake primates. 11. Motor outputs. J. Neurophysiol. 41:1120-1131.
Lassek, A.M. (1940) The human pyramidal tract. 11. A numerical investiga- tion of the Betz cells of the motor area. Arch. Neurol. Psychiatry 44:718-724.
Lassek, A.M. (1941) Magnitude of the large cells of the motor area (area 4). Arch. Neurol. Psychiatry 45:964-972.
Lee, V.M.Y., L. Otvos Jr., M.J. Carden, M. Hollosi, B. Dietzschold, and R.A. Lazzarini (1988) Identification of the major multiphosphorylation site in mammalian neurofilaments. Proc. Natl. Acad. Sci. USA 85: 1998-2002.
Lu, M.T., J.B. Preston, and P.L. Strick (1994) Interconnections between the prefrontal cortex and the premotor areas in the frontal lobe. J. Comp. Neurol. 341 :375-392.
Lund, J.S., R.D. Lund, A.E. Hendrickson, A.H. Bunt, and A.F. Fuchs 11975) The origin of efferent pathways from the primary visual cortex, area 17, of the macaque monkey as shown by retrograde transport of horseradish peroxidase. J. Comp. Neurol. 164:287-304.
Luppino, G., M. Matelli, and G. Rizzolatti 11990) Cortico-cortical connec- tions of two electrophysiologically identified arm representations in the mesial agranular frontal cortex. Exp. Brain Res. 82:214-218.
Luppino, G., M. Matelli, R.M. Camarda, V. Gallese, and G. Rizzolatti (1991) Multiple representations of body movements in mesial area 6 and the
dritic morphology, spine density, and compartmental dispo- sition of neurofilament protein. It is possible that other neurochemical markers, such as neurotransmitter receptor or ion channel proteins, may prove more informative at these higher levels of resolution. Nonetheless, the fact that certain properties do appear to be inherent to particular projections may ultimately permit the interpretation of neurochemical patterns in cortical areas of the monkey (and eventually the human) brain, within the context of functional and physiologic differences among corticocorti- cal connections.
ACKNOWLEDGMENTS We thank W.G.M. Janssen, R. Jenkins, and G. Volmar for
help during surgery and for animal care; E. Lug0 and R.S. Woolley for expert technical assistance; and H.A. Stern, S. Gonzalez-Sherwin, and E.M. Gertz for software develop- ment. This research was supported by NIH grant AGO6647 and the Human Brain Project MHDA52154.
LITERATURE CITED Barbas, H. 11986) Pattern in the laminar origin of corticocortical connec-
tions. J. Comp. Neurol. 252415-422. Barbas, H., and D.N. Pandya 11987) Architecture and frontal cortical
connections of the premotor cortex (area 6) in the rhesus monkey. J. Comp. Neurol. 256:211-228.
Braak, H. (1976) A primitive gigantopyramidal field buried in the depth of the cingulate sulcus ofthe human brain. Brain Res. I09:219-233.
Braak, H., and E. Braak (1976) The pyramidal cells of Betz within the cingulate and precentral gigantopyramidal field in the human brain. Cell Tissue Res. 172103-119.
Campbell, M.J., and J.H. Morrison (1989) Monoclonal antibody to neurofila- ment protein (SMI-32) labels a subpopulation of pyramidal neurons in the human and monkey neocortex. J. Comp. Neurol. 282:191-205.
Campbell, M.J., P.R. Hof, and J.H. Morrison (1991) A subpopulation of primate corticocortical neurons is distinguished by somatodendritic distribution of neurofilament protein. Brain Res. 539: 133-136.
De Lima, A.D., T. Voigt, and J.H. Morrison 11990) Morphology of the cells within the inferior temporal gyrus that project to the prefrontal cortex in the macaque monkey. J. Comp. Neurol. 296:159-172.
Del Rio, M.R., and J. DeFelipe (1994) A study of SMI32-stained pyramidal cells, parvalbumin-immunoreactive chandelier cells and presumptive tbalamocortical axons in the human temporal neocortex. J. Comp. Neurol. 342389-408.
Dum, R.P., and P.L. Strick (1991) The origin of corticospinal projections from the premotor areas in the frontal lobe. J. Neurosci. I 1:667-689.
Dum, R.P., and P.L. Strick 11992) Medial wall motor areas and skelemotor control. Curr. Opin. Neurobiol. 2836-839.
Dum, R.P., and P.L. Strick 11993) Cingulate motor areas. In Vogt, B.A., and M. Gabriel (eds): Neurobiology of Cingulate Cortex and Limbic Thala- mus. Boston: Birkhauser, pp. 415-441.
Fries, W., K. Keizer, and H.G.J.M. Kuypers (1985) Large layer VI cells in macaque striate cortex (Meynert cells) project to both superior colliculus and prestriate area V5. Exp. Brain Res. 58:613-616.
Galea, M.P., and I. Darian-Smith (1994) Multiple corticospinal neuron populations in the macaque monkey are specified by their unique cortical origins, spinal terminations, and connections. Cereb. Cortex 4: 166-194.
Ghosh, S., C. Brinkman, and R. Porter (1987) A quantitative study of the distribution of neurons projecting to the precentral motor cortex in the monkey IM. fusciculuris). J. Comp. Neurol. 259:424444.
Globus, A., and A.B. Scheibel 11967) Synaptic loci on visual cortical neurons of the rabbit: The specific afferent radiation. Exp. Neurol. 18:116-131.
Godscbalk, M., R.N. Lemon, H.G.J.M. Kuypers, and H.K. Ronday (1984) Cortical afferents and efferents of monkey postarcuate area: An anatomi- cal and electrophysiological study. Exp. Brain Res. 56:410-424.
Haugland, R.P. (1992) Molecular Probes. Handbook of Fluorescent Probes and Research Chemicals. Eugene: Molecular Probes.
He, S.Q., R.P. Dum, and P.L. Strick (1995) Topographic organization of corticospinal projections from the frontal lobe: Motor areas on the medial surface of the hemisphere. J. Neurosci. 15:3284-3306.

160 E.A. NIMCHINSKY ET AL.
adjacent cingulate cortex: An intracortical microstimulation study in the macaque monkey. J. Comp. Neurol. 311 :463-482.
Luppino, G., M. Matelli, R.M. Camarda, and G. Rizzolatti (1993) Corticocor- tical connections of area F3 (SMA-proper) and area F6 (pre-SMA) in the macaque monkey. J. Comp. Neurol. 338:114-140.
Matelli, M., G. Luppino, and G. Rizzolatti (1991) Architecture of superior and mesial area 6 and the adjacent cingulate cortex in the macaque monkey. J. Comp. Neurol. 311 :445462.
Morecraft, R.J., and G.W. Van Hoesen (1992) Cingulate input to the primary and supplementary motor cortices in the rhesus monkey: Evidence for somatotopy in areas 24c and 23c. J. Comp. Neurol. 322471-489.
Muakkassa, K.F., and P.L. Strick (1979) Frontal lobe inputs to primate motor cortex: Evidence for four somatotopically organized ‘premotor‘ areas. Brain Res. 177176-182.
Nimchinsky, E.A., B.A. Vogt, J.H. Morrison, and P.R. Hof (1995) Spindle neurons of the human anterior cingulate cortex. J. Comp. Neurol. 35527-37.
Parnavelas, J.G., A. Globus, and P. Kaups (1973) Continuous illumination from birth affects spine density of neurons in the visual cortex of the rat. Exp. Neurol. 40:742-747.
Rouiller, E.M., A. Babalian, 0. Kazennikov, V. Moret, X.H. Yu, and M. Wiesendanger (1994) Transcallosal connections of the distal forelimb representations of the primary and supplementary motor cortical areas in macaque monkeys. Exp. Brain Res. 102:227-243.
Schlaug, G., E. Armstrong, A. Schleicher, and K. Zilles (1993) Layer V pyramidal cells in the adult human cingulate cortex. Anat. Embryol. 187515-522.
Shima, K., K. Aya, H. Mushiake, M. Inase, H. Aizawa, and J. Tanji (1991) Two movement-related foci in the primate cingulate cortex observed in signal-triggered and self-paced forelimb movements. J. Neurophysiol. 65:188-202.
Stepniewska, I., T.M. Preuss, and J.H. Kaas (1993) Architectonics, somato- topic organization, and ipsilateral cortical connections of the primary motor area (MU of owl monkeys. J. Comp. Neurol. 330938-271.
Sternberger, L.A., and N.H. Sternberger (1983) Monoclonal antibodies distinguish phosphorylated and nonphosphorylated forms of neurofila- ments m situ. Proc. Natl. Acad. Sci. USA 80:61264130.
Stewart, W.W. (1981) Lucifer dyes-Highly fluorescent dyes for biological tracing. Nature 292: 17.
Szabo, J., and W.M. Cowan (1984) A stereotaxic atlas of the brain of the Cynomolgus monkey (Mucucu fasciculans). J. Comp. Neurol. 222265- 300.
Tigges, J., M. Tigges, S. Anschel, N.A. Cross, W.D. Letbetter, and R.L. McBride (1981) Areal and laminar distribution of neurons interconnect- ing the central visual cortical area 17,18,19, and MT in squirrel monkey. J. Comp. Neurol. 202539-560.
Tombol, T. (1984) Layer VI cells. In Peters A,, and E.G. Jones (eds): Cerebral Cortex, Volume 1, Cellular Components of the Cerebral Cortex. New York: Plenum, pp. 479-519.
Vercelli, A,, and G.M. Innocenti (1993) Morphology ofvisual callosal neurons with different locations, contralateral targets or patterns of develop- ment. Exp. Brain Res. 94:393404.
Vogt, B.A. (1976) Retrosplenial cortex in the rhesus monkey: A cytoarchitec- tonic and Golgi study. J. Comp. Neurol. 169:63-98.
Vogt, B.A. (1993) Structural organization of cingulate cortex: Areas, neu- rons, and somatodendritic transmitter receptors. In Vogt B.A., and M. Gabriel (eds): Neurobiology of Cingulate Cortex and Limbic Thalamus. Boston: Birkhauser, pp. 19-70.
Vogt, B.A., and A. Peters (1981) Form and distribution of neurons in rat cingulate cortex: Areas 32, 24 and 29. J. Comp. Neurol. 195603-625.
Vogt, B.A., D.N. Pandya, and D.L. Rosene (1987) Cingulate cortex of the rhesus monkey: I. Cytoarchitecture and thalamic afferents. J. Comp. Neurol. 262:256-270.
Woolsey, C.N., P.H. Settlage, D.R. Meyer, W. Spencer, T.P. Hamuy, and A.M. Travis (1952) Patterns of localization in precentral and “supplemen- tary” motor area and their relation to the concept of a premotor area. Res. Publ. Assoc. Res. Nerv. Ment. Dis. 30:238-264.
Young, W.G., E.A. Nimchinsky, P.R. Hof, F.E. Bloom, and J.H. Morrison (1995) NeuroZoom-Computer software for quantitative neuroana- tomic mapping and stereologic counting. Sac. Neurosci. Abstr. 21: 1078.
Zant, J.D., and P.L. Strick (1978) The cells of origin of interhemispheric connections in the primate motor cortex. SOC. Neurosci. Abstr. 4:308.