Embed Size (px)
Citation preview
Seediscussions,stats,andauthorprofilesforthispublicationat:http://www.researchgate.net/publication/259322468
NeuromuscularElectricalStimulationDoesNotEnhanceRecoveryFromMaximalExercise.
ARTICLEinINTERNATIONALJOURNALOFSPORTSPHYSIOLOGYANDPERFORMANCE·DECEMBER2013
ImpactFactor:2.68·Source:PubMed
DOWNLOADS
5
VIEWS
99
3AUTHORS:
JohnKMalone
AbertayUniversity
7PUBLICATIONS11CITATIONS
SEEPROFILE
CatherineBlake
UniversityCollegeDublin
78PUBLICATIONS607CITATIONS
SEEPROFILE
BrianCaulfield
UniversityCollegeDublin
167PUBLICATIONS1,359CITATIONS
SEEPROFILE
Availablefrom:JohnKMalone
Retrievedon:17June2015

1
Title: Neuromuscular electrical stimulation does not enhance recovery from maximal 1
exercise 2
3
Authors: John K. Malone, Catherine Blake, Brian Caulfield 4
5
ABSTRACT 6
Purpose: To investigate the use of neuromuscular electrical stimulation (NMES) during 7 acute recovery between 2 bouts of maximal aerobic exercise. Methods: On 3 separate days, 8
19 trained male cyclists (28±7 yr; 76.4±10.4 kg; P V O2max (power output at V O2max) 417±44 W) 9
performed a 3 min maximal cycling bout at 105% P V O2max, prior to a 30 min randomly 10 assigned recovery intervention of either: i) Passive (PAS: resting); ii) Active (ACT: 30% 11
P V O2max); or iii) NMES (5 Hz / 4 pulses at 500 μs). Immediately after, a cycle bout at 95% P12
V O2max to exhaustion (TLIM) was performed. Heart rate (HR) and blood lactate (BLa) were 13 recorded at designated time-points. Data were analyzed using repeated measures ANOVA 14 with Tukey’s HSD post hoc. Statistical significance threshold was P<0.05. Results: The 15
TLIM was significantly shorter for NMES compared to ACT (vs. 199.6 ± 69.4s vs. 250.7 ± 16
105.5s: P=0.016), but not PAS recovery (199.6 ± 69.4s vs. 216.4 ± 77.5s: P=0.157). The 17 TLIM was not significantly different between ACT and PAS (250.7 ± 105.5s vs. 216.4 ± 77.5s: 18 P=0.088). The decline in BLa was significantly greater during ACT compared to NMES and 19
PAS recovery (P < 0.001), with no difference between NMES and PAS. Also, HR was 20
significantly higher during ACT compared to NMES and PAS recovery (P < 0.001), with no 21 difference between NMES and PAS. Conclusions: NMES was less effective than ACT and 22 comparable to PAS recovery when used between two bouts of maximal aerobic exercise in 23
trained male cyclists. 24
25
Key Words: Athletic Therapy, Exercise Performance, Aerobic, Sports Physiology, Muscle 26 Function
27 28 29 30
Introduction 31
There are many situations in sport where inadequate recovery can limit performance1, 32
especially for acute recovery (< 1 h) between bouts of exercise, since this is the time period 33 typically required for full homeostasis to be returned following very high intensity exercise
2. 34
Certain competitive sports can involve multiple bouts during a single competitive event, often 35 with minimal recovery. Examples include track and field, swimming, rowing, track cycling or 36 cross-country sprint skiing, which can involve multiple bouts of exercise at intensities close 37
to, or above maximal aerobic power ( V O2max), i.e., < 10 min of maximal exercise. For 38
example, rowing regattas normally consist of 2000m races during an event meet, with bouts 39 typically lasting between 6 and 7 min. Track cycling events such as the individual or team 40 pursuits comprise of maximal bouts of < 5 min duration. Sports like cross-country sprint 41 skiing, comprise of interval type competition, e.g., 4 heats of approximately (~) 2-3 min 42
duration, separated by very short rest periods (~ 15-20 min between final heats), over a 2 – 3 43 hour period
3. Recovery periods between bouts can often be minimal, particularly where 44
individuals are involved in multiple events during a meet. Athletes participating in events 45
2
like these, particularly at or near elite level, where the margins between success and failure 46 are often very small, should theoretically benefit from enhancing the recovery process 47 between bouts. Similar beneficial recovery effects should also improve the quality and safety 48 of athlete training sessions, by potentially reducing fatigue, muscle soreness or even injury 49 risk
4. 50
51 Due to its purported analgesic effects on muscle soreness
5 and its effect of increasing 52
localized blood flow6, the use of sub-tetanic neuromuscular electrical stimulation (NMES) to 53
promote acute (< 1 h), medium (1-24 h) and long-term (> 24 h) recovery has received 54 increased attention in recent years
4. However, only a small body of this research has 55
previously investigated the use of NMES during acute recovery7-10
. Two of these studies8,10
56 focused on recovery from bouts of supra-maximal anaerobic exercise, with another
7 using the 57
small musculature of the forearm flexors. Neric et al.9 is the only study to have focused on 58
acute recovery from exercise, the intensity of which was close to the domain of maximal 59 aerobic exercise. However, they did not investigate post recovery exercise performance. 60 61 To the knowledge of the investigators, there are no previous studies that have investigated the 62
acute effects of NMES on post recovery exercise performance, when applied to the large 63 musculature of the lower body between bouts of maximal aerobic exercise lasting < 10 min. 64
The duration of these bouts, the musculature used, and the recovery period duration are 65 scenarios very applicable to many sporting situations in both training and competition. The 66
aims of this study were to; 1) Investigate the effectiveness of NMES compared to traditional 67 recovery methods when used on the large muscle groups of the lower body within a 30 min 68
period (a duration too short to achieve complete recovery) between two bouts of maximal 69 aerobic exercise; 2) Investigate whether there were any associations observed between 70
recovery intervention, heart rate (HR), blood lactate (BLa), and subsequent post exercise 71 fatigue. 72 73
The principal hypotheses were that NMES would be effective for maintaining subsequent 74 exercise performance and lowering post exercise BLa compared to Passive (PAS) recovery. 75
These hypotheses were based on the fact that NMES is known to induce hyperaemia12
, and 76 has been previously shown to increase blood flow
6,13. However, the specific sub-tetanic, 77
continuous stimulation parameters used in this study, have been shown previously to be 78
effective at increasing systemic blood flow, muscle activation and oxygen uptake by 79 mimicking the effects of shivering, without causing undue discomfort
11. Therefore, it was 80
hypothesized that hyperaemia would be increased (reflected systemically by a small but 81 significant increase in HR) to a greater extent during this continuous muscle contraction 82
protocol compared to our previous intermittent protocol8, resulting in a greater muscle pump 83
effect and thus metabolite clearance. 84 85 86
Methods 87
Subjects 88
Twenty one trained male amateur cyclists volunteered to participate in this study. Due to 89 work commitments, two withdrew prior to completion, leaving 19 subjects included for final 90
analysis (28 ± 7 yr; 178.7 ± 6.3 cm; 76.4 ± 10.4 kg; Body-fat: 10.8 ± 5.3 %; V O2max: 56.8 ± 91 6.4 ml
.min
-1.kg
-1). Subjects were recruited from competitive cycling (Ireland A classification, 92
n=17)/ triathlete clubs (n=2), and were involved in regular training (≥ 3 sessions/wk) and 93 competition (≥1 month). Subjects were fully informed of procedures relating to the study and 94
3
completed a pre-test medical screening questionnaire and provided written informed consent 95 prior to participation. Subjects were only included if they were healthy trained male cyclists 96 aged 18–40 y/o, free from recent injury (< 3 months) or any acute/ chronic metabolic or 97 cardiovascular complications. Participation was voluntary and subjects had the right to 98 withdraw at any stage without question. All procedures were approved by the Institutional 99
Research Ethics Board. 100 101
Design 102
To mimic competitive sports training/ competition scenarios involving fatiguing maximal 103 intensity exercise bouts (< 10 min) with inadequate recovery duration intervals (< 1 h), 104
subjects performed a 3 min bout at 105% power output at V O2max (p V O2max) prior to a 105
randomly assigned 30 min recovery intervention period consisting of either: NMES, PAS or 106 ACT recovery. Immediately after, subjects performed a maximal aerobic cycle bout at 95% 107
p V O2max to exhaustion (TLIM). The performance scores from the TLIM were compared to 108 assess which recovery intervention had the greatest positive effect on subsequent 109
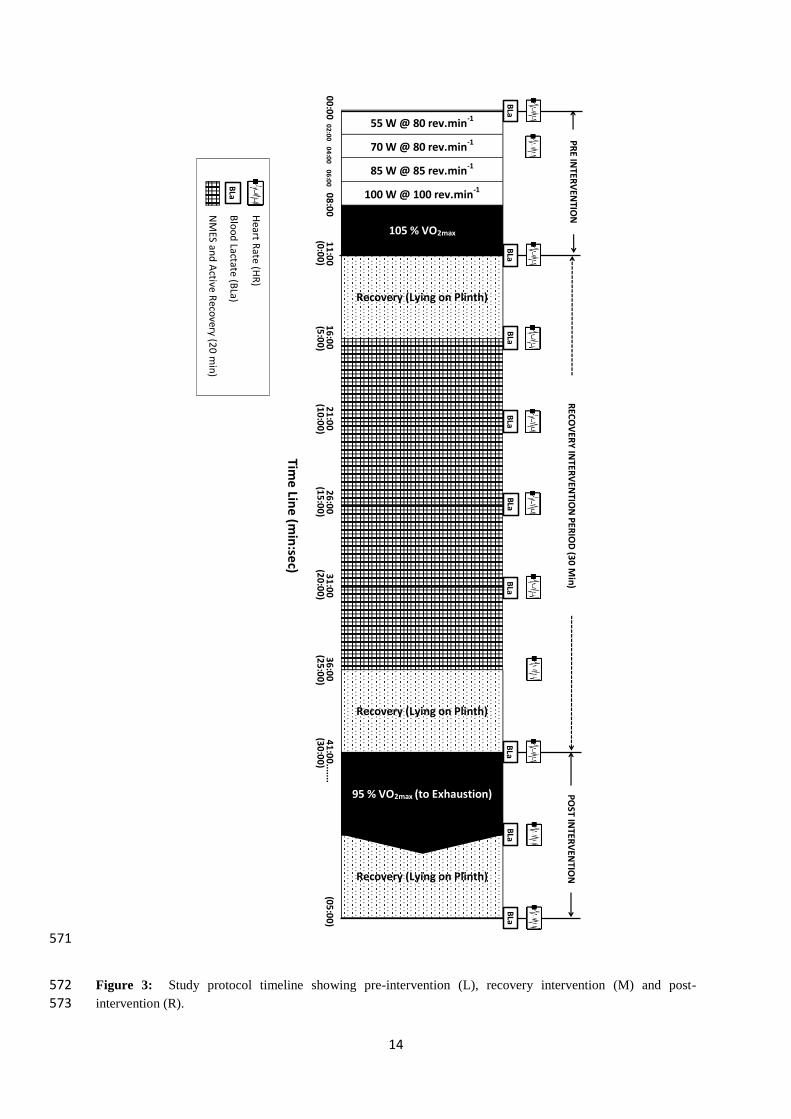
performance. To monitor physiological responses to the maximal aerobic bouts and during 110 the recovery intervention period, HR and BLa were recorded at designated time points 111 throughout (Figure 3). 112 113
114
Methodology 115
Subjects attended the institutional human performance laboratory on four separate occasions. 116
To control for circadian rhythm, sessions were carried out at the same time of day (± 1 h)14
, 117
with a minimum of 72 h between sessions to allow full recovery15
. Subjects were instructed 118 to refrain from any form of exercise and alcohol consumption
16, to eat normally and to stay 119
well hydrated during the 24 h prior to each session. They were also instructed to abstain from 120
caffeine consumption on the day of each session due to the possible stimulatory effects of 121 caffeine on high intensity exercise
17, or nutritional ergogenic aids that may have impacted 122
results (e.g., creatine supplementation). Subjects recorded a food and activity log during the 123 24 h prior to session 1, and were instructed to stringently replicate this log for subsequent 124 sessions. They were made aware of the importance of their compliance to data accuracy. All 125
sessions were carried out on an electro-magnetic braked cycle ergometer (Lode Sport 126 Excalibur, Netherlands). 127
128
Session 1: Height (cm), Body mass (kg) and Body fat %18
were recorded prior to performing 129
a graded maximal incremental cycle test. This test was conducted to: i) establish trained 130
status; ii) determine P V O2max in order to determine the intensity of the subsequent ACT 131 recovery. The test consisted of cycling at 100 W for 1 min, with each 1 min stage thereafter 132 increasing by 30 W until volitional exhaustion. For more details on these procedures, please 133
refer to our previous study8. 134
135 NMES Familiarization: The NMES device (NT2010, Biomedical Research Ltd, Galway, 136 Ireland) delivered current waveforms via an array of adhesive electrodes to the quadriceps 137 and hamstring musculature (Figure 1). A single phase program was used to produce 138
rhythmical contractions, by delivering bursts of 4 pulses, each of 500μs duration at a packet 139
frequency of 5 Hz for a 20 min period. These parameters are all within the ranges suggested 140 when used for the purpose of promoting muscle recovery (4). None of the subjects reported 141 prior experience of using NMES and were fully informed about all procedures and any 142 potential risks (e.g., possible skin irritation). Because the perception of intensity of NMES is 143
4
highly variable among individuals and thus, needs to be selected on an individual basis19
, 144 subjects increased the stimulation intensity to the highest comfortable level tolerable (i.e., 145 before any subjective discomfort was felt). The maximum current output delivery of the 146 device was 140 mA (Figure 2). However, current output chosen by subjects, were as 147 expected, considerably lower than this (67.2 ± 8.4 mA). 148
149 Pre-Intervention Test (105% PVO2max) Familiarization: To help eliminate any practice/ 150
learning effect of performing the 105% P V O2max cycle bout in subsequent sessions, a 151 familiarization trial, which included a standardized warm-up lead-in (see Figure 3), was 152
performed. To replicate subjects’ natural environment, the cycle ergometer was set-up to 153 each subjects own individual preference, with the settings chosen, used for all subsequent 154 testing sessions. They were also encouraged to use their own pedals and cleats. 155
156 Sessions 2-4: Each session consisted of a standardized warm-up, a 3 min maximal aerobic 157
exercise bout (105% P V O2max), a 30 min recovery intervention, and a maximal aerobic 158
exercise bout to exhaustion (TLIM) at 95% P V O2max (Figure 3). 159 160 Firstly, subjects performed a standardized 8 min warm-up (80 rev.min
-1 for 4 consecutive 2-161
min stages (55, 70, 85 and 100W), prior to performing a maximal aerobic trial at 105% 162
P V O2max, whilst maintaining a cadence of ~100 rev.min-1
for 3 min, using standardized verbal 163
encouragement. Due to the intense nature of the trial, ~ 50% of subjects were unable to 164 complete the 3 min protocol (avg. time attained 160s ± 10s). In these cases, they cycled to 165
exhaustion with the time attained used for subsequent sessions. Immediately after, a 30 min 166
randomly assigned recovery intervention period began (subjects selected the order from 167
concealed envelopes during session 1), consisting of either: 1) PAS: lying on a plinth with a 168
back rest angle of 15 degrees; 2) ACT: cycling at 30% P V O2max20
; or 3) NMES: 5 Hz / 4 169 pulses at 500 μs, (lying similar to PAS). As there was a time requirement for subjects to put-170 on/ take off the NMES apparatus, 5 min was allowed either side for NMES, and it was 171
decided to that ACT recovery duration be the same. This ensured that the total time period of 172 recovery was exactly 30 min duration overall, regardless of intervention type (see Figure 3). 173
Upon completion of the 30 min period (at precisely 29min:50s), subjects increased cadence 174 from 0 to 110 rev.min
-1 during a 10 s period of unloaded cycling, prior to the cycling 175
intensity increasing in a square wave fashion to 95% P V O2max. Using standardized verbal 176 encouragement, subjects were instructed maintain ~ 100 rev.min
-1 cadence and were 177
instructed to keep cycling to exhaustion, even when the rev.min-1
dropped in the latter stages 178 of the trial. The TLIM trial was terminated immediately upon cadence dropping under 70 179
rev.min-1
(to nearest 0.1s). Subjects remained passively seated for 5 min to enable a post 180 exercise BLa sample to be obtained. 181
182 To control for variables such as motivation that may have affected results; 1) subjects were 183 blinded to time, both during and at the completion of the trail, and were not made aware of 184
time achieved during any of the sessions until the completion of their final TLIM trial during 185 session 4; 2) all verbal encouragement was delivered by the investigator using a written 186 script, ensuring subjects received the exact same strong standardized verbal encouragement at 187 the exact same time during pre and post intervention trials in all sessions
21. 188
189
Blood Lactate and Heart Rate: Small capillary blood samples (5 μL) were taken from the 190
index or middle finger at specific time points (Figure 3), and immediately analyzed using an 191
5
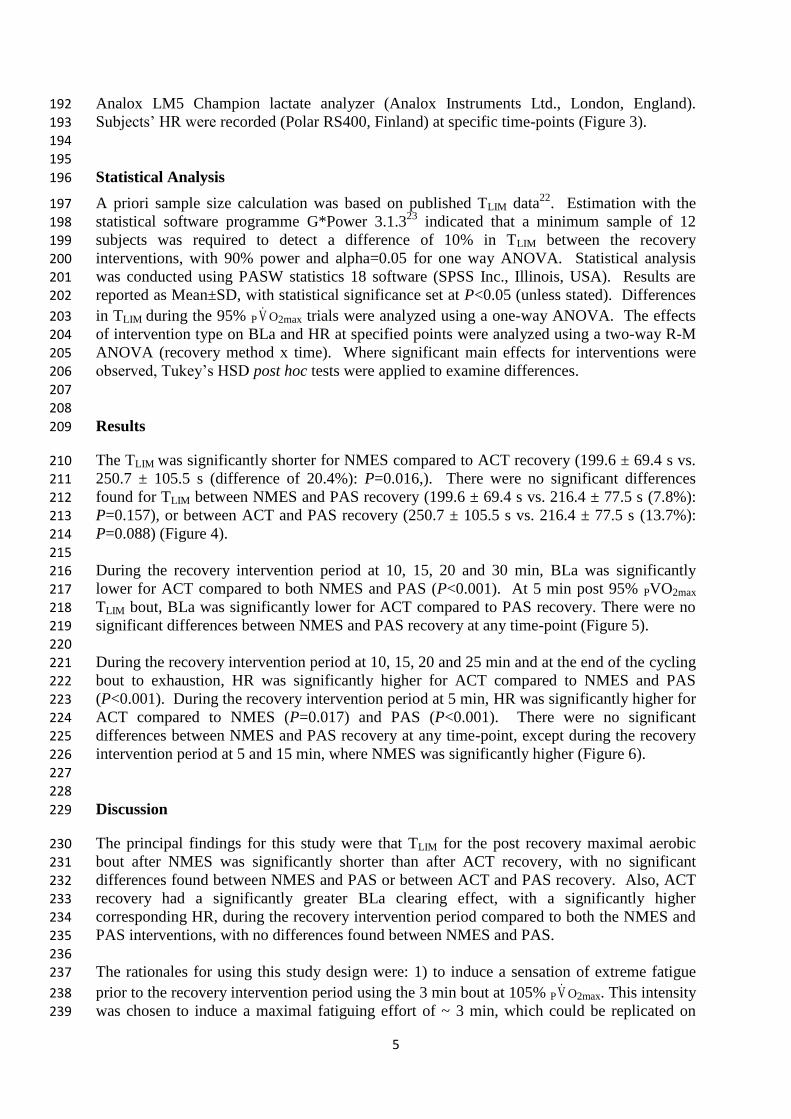
Analox LM5 Champion lactate analyzer (Analox Instruments Ltd., London, England). 192 Subjects’ HR were recorded (Polar RS400, Finland) at specific time-points (Figure 3). 193 194 195
Statistical Analysis 196
A priori sample size calculation was based on published TLIM data22
. Estimation with the 197 statistical software programme G*Power 3.1.3
23 indicated that a minimum sample of 12 198
subjects was required to detect a difference of 10% in TLIM between the recovery 199 interventions, with 90% power and alpha=0.05 for one way ANOVA. Statistical analysis 200 was conducted using PASW statistics 18 software (SPSS Inc., Illinois, USA). Results are 201
reported as Mean±SD, with statistical significance set at P<0.05 (unless stated). Differences 202
in TLIM during the 95% P V O2max trials were analyzed using a one-way ANOVA. The effects 203 of intervention type on BLa and HR at specified points were analyzed using a two-way R-M 204 ANOVA (recovery method x time). Where significant main effects for interventions were 205 observed, Tukey’s HSD post hoc tests were applied to examine differences. 206 207
208
Results 209
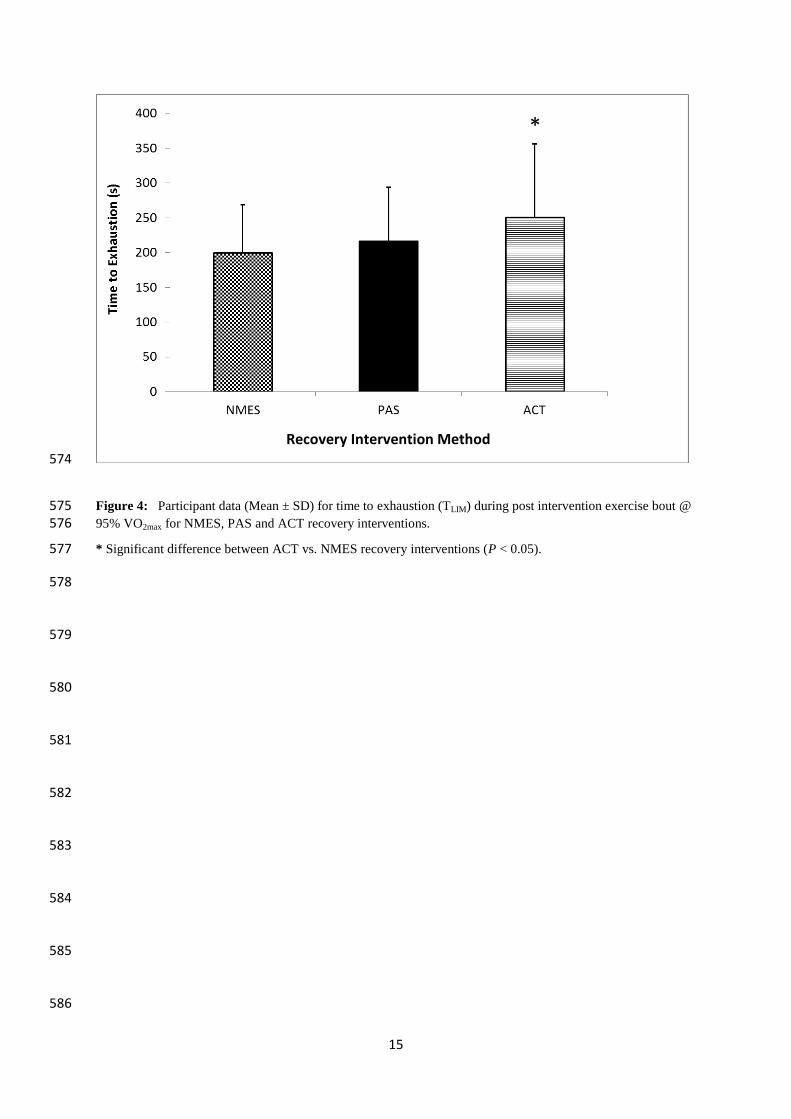
The TLIM was significantly shorter for NMES compared to ACT recovery (199.6 ± 69.4 s vs. 210 250.7 ± 105.5 s (difference of 20.4%): P=0.016,). There were no significant differences 211
found for TLIM between NMES and PAS recovery (199.6 ± 69.4 s vs. 216.4 ± 77.5 s (7.8%): 212 P=0.157), or between ACT and PAS recovery (250.7 ± 105.5 s vs. 216.4 ± 77.5 s (13.7%): 213
P=0.088) (Figure 4). 214 215
During the recovery intervention period at 10, 15, 20 and 30 min, BLa was significantly 216 lower for ACT compared to both NMES and PAS (P<0.001). At 5 min post 95% PVO2max 217 TLIM bout, BLa was significantly lower for ACT compared to PAS recovery. There were no 218
significant differences between NMES and PAS recovery at any time-point (Figure 5). 219 220
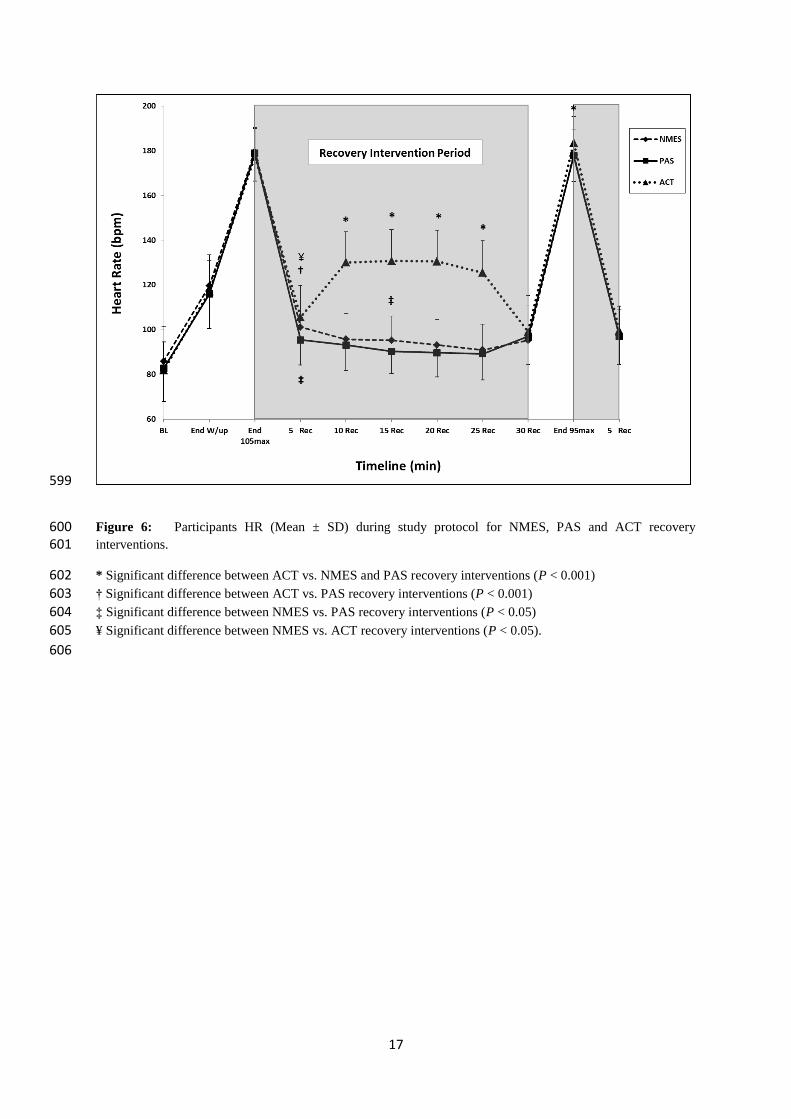
During the recovery intervention period at 10, 15, 20 and 25 min and at the end of the cycling 221 bout to exhaustion, HR was significantly higher for ACT compared to NMES and PAS 222 (P<0.001). During the recovery intervention period at 5 min, HR was significantly higher for 223
ACT compared to NMES (P=0.017) and PAS (P<0.001). There were no significant 224 differences between NMES and PAS recovery at any time-point, except during the recovery 225
intervention period at 5 and 15 min, where NMES was significantly higher (Figure 6). 226 227
228
Discussion 229
The principal findings for this study were that TLIM for the post recovery maximal aerobic 230 bout after NMES was significantly shorter than after ACT recovery, with no significant 231 differences found between NMES and PAS or between ACT and PAS recovery. Also, ACT 232
recovery had a significantly greater BLa clearing effect, with a significantly higher 233 corresponding HR, during the recovery intervention period compared to both the NMES and 234 PAS interventions, with no differences found between NMES and PAS. 235
236 The rationales for using this study design were: 1) to induce a sensation of extreme fatigue 237
prior to the recovery intervention period using the 3 min bout at 105% P V O2max. This intensity 238 was chosen to induce a maximal fatiguing effort of ~ 3 min, which could be replicated on 239

6
multiple days and would mimic many sporting activities both in competition and training. 240 Cycling was chosen as it is a mode of exercise where variables can be precisely controlled, 241 has direct application to the sport of cycling, and provides metabolic specificity with other 242 aforementioned sports. Secondly, to use a recovery period too short for complete recovery to 243 be achieved prior to commencement of the TLIM trial. The BLa and HR profiles verified this, 244
as neither had fully returned to base-line levels prior to the start of the TLIM trial (Figures 5 245 and 6). This was important as it mimics many sporting scenarios where recovery durations 246 are insufficient. It also enabled the recovery intervention modalities to be directly compared 247 to assess which was the most effective for enhancing subsequent performance. 248 249
The principal hypotheses were that NMES would be effective for maintaining subsequent 250 exercise performance and lowering post exercise BLa compared to PAS recovery. This study 251
used a stimulation device similar to our previous study8. However, whereas an intermittent 252
NMES protocol was used for that study, this study used a continuous stimulation protocol, 253 which is more typically used for these types of studies
7,9,10,24. The NMES parameters used in 254
this study were specifically designed to minimize muscle fatigue and elicit a mild aerobic 255 effect using sub-tetanic stimulation, and has previously been shown to increase muscle 256
activation and oxygen uptake by mimicking the effects of shivering, without causing undue 257 discomfort
11. Also, although direct blood flow was not measured in the study, NMES has 258
been previously shown to increase blood flow6,13
. Therefore, we hypothesised that any 259 increase in localized blood flow due to a ‘muscle pump’ effect would help to increase 260
metabolite removal from the fatigued muscles to a greater extent than PAS recovery, 261 especially as subjects used NMES at quite a high intensity without any sensation of 262
discomfort (67.2 ± 8.4 mA). We speculated that a small but significant increase in overall 263 systemic blood flow, would be reflected by increased HR, especially as these NMES 264
parameters have previously shown increases in subject HR (albeit using a different study 265 protocol) in healthy adults
11. However, the resultant findings do not support our hypothesis. 266
In fact, PAS recovery actually showed a trend (suggesting better performance, although not 267
statistically significant) for better TLIM performance compared to NMES (216.4 ± 77.5s vs. 268 199.6 ± 69.4s, P=0.157). Also, whilst HR was consistently higher at all times points during 269
the recovery intervention period for NMES compared to PAS recovery, it only reached 270 significance at 5 and 15 min (Figure 6). 271 272
Whilst the findings for HR and BLa were similar to our previous study8, the findings for 273
performance differed, as we found no significant differences across interventions when bouts 274
of maximal anaerobic exercise were performed, in a similar trained population. Interestingly, 275 a recent study
25 investigated contrast water immersion (CWI) using a similar protocol to ours 276
(30 min recovery intervention prior to a TLIM trial). They suggested the principal reason for 277 the enhanced effect of CWI therapy compared to PAS recovery was related to the increased 278 HR response during the CWI, which they speculated increased blood flow to the muscles and 279 thus increased metabolite removal during the recovery period. Interestingly, they found that 280 CWI resulted in relatively better performance during their TLIM trials (maximal aerobic) 281
compared to their multiple Wingate exercise trials (maximal anaerobic). Whereas, NMES 282 performed relatively poorer in this study (maximal aerobic) compared to our previous study
283 (maximal anaerobic)
8. The reasons for these findings are unclear. However, it may have 284
been due to CWI significantly increasing HR upon each cold immersion compared to PAS 285 recovery their study
25, something that we failed to show in either this, or our previous study
8. 286
287
The findings for BLa with NMES contrasted with previous studies9,24
, who found that BLa 288 was lowered significantly faster with NMES compared to PAS recovery. The rationale for 289
7
investigating the effects of NMES on Bla is that the previous studies that have found positive 290 effects of NMES on BLa clearance compared to PAS recovery, either did not investigate post 291 intervention performance
9,24, failed to show any subsequent performance benefit
7,8 or found a 292
positive effect on performance (baseball pitching speed)10
. Importantly, two of these 293 studies
9,24, based their conclusions solely on the effects of NMES on subsequent BLa 294
lowering. However, recent evidence appears to suggest that the direct effects of lactate per se 295 on muscle fatigue may be minimal, although much is still currently unknown about the 296 fatigue phenomenon
26. The reasons for the contrasting findings are unclear, however may be 297
related to different protocols and/ or NMES parameters used in their studies. Previous 298 studies either did not state the intensity of stimulation used
24, or used intensities considerably 299
lower than our study (67.2 ± 8.4 vs. ~ 30 mA)9. 300
301
The possibility that the NMES protocol itself exerted a potential negative impact on the 302 recovery process (despite comfortable contraction levels) cannot be dismissed, especially as 303 NMES is known to induce muscle fatigue to a greater extent than voluntary muscle 304 activation
19. Muscle recruitment during NMES is non-selective and spatially fixed, resulting 305
in Type II muscle fiber activation even at low stimulation intensities27
. Therefore, it is 306
possible that there were fatigue accrued to larger Type II fibers during the NMES recovery 307 intervention period (Type II fibers would have been inactive during the ACT intervention) 308
which may have negated any potential positive influences of NMES on recovery, thus 309 affecting performance in the subsequent TLIM trial. However, every attempt was made to 310
minimize this by using stimulation parameters that were designed to limit fatigue by 311 incurring less spatially fixed stimulation at a given intensity (Figure 2). This study also used 312
very stringent methodology to ensure that there were minimal influences of external factors 313 that may have affected results. We are also very confident that there were no familiarization 314
effects of performing the TLIM bouts, especially as subjects were trained cyclists who 315 performed a familiarization session. Our data analysis confirms this, as the ratio of which 316 sessions the TLIM best scores occurred is 6:6:7 for sessions 2, 3, and 4 respectively. 317
318 319
Practical Applications 320
It appears NMES is less effective than ACT, and does not offer any additional performance 321
advantage over traditional PAS recovery, at least for enhancing acute recovery from maximal 322
aerobic exercise. Although this study used trained cyclists on a cycle ergometer, which may 323
not have mechanical specificity with some of the other aforementioned ‘power aerobic’ 324
sports, there is metabolic specificity with these sports, regardless of mode. Therefore, these 325
findings should be of value to any power aerobic athlete and not just cyclists. However, 326
athletes who use NMES for similar purposes need to consider that there can be considerable 327
individual variability when using NMES, due to factors such as variations in underlying 328
adipose tissue affecting current in the stimulated region19
. In this study, only a small 329
minority of subjects (3 of 19) responded positively to NMES compared to ACT and PAS 330
recovery. There was also variability in subjects’ perceptions of tolerance and discomfort, 331
mirrored by the variability in intensities used. This variability is not unusual however, and 332
helps explain why: 1) this, and previous studies28,29,30
used subjective, rather than objective 333
selection of intensity; 2) there is not a universal recommendation on the optimum intensity of 334
NMES that should be used during recovery from fatiguing exercise. Although, it is likely 335
that intensity needs to be comfortable, but high enough to induce sufficient muscle 336
8
contractions (to act as a muscle pump) for metabolite clearance, whilst not being too high, 337
that will induce muscle fatigue. 338
339
Conclusions 340
Based on these findings, ACT recovery appears to be the optimal method for enhancing 341 short-term recovery between two bouts of maximal aerobic exercise, at least in a trained 342 population. NMES was less effective than ACT, and comparable to PAS recovery for 343 enhancing short-term recovery between 2 bouts of maximal aerobic cycle exercise in a 344
trained male population. 345
346
347
Acknowledgements 348
The authors wish to thank Dr. Louis Crowe for his expert help with the program design for 349 the NMES device, and Mr. Romain Denis for his laboratory assistance during data collection. 350 The authors also wish to thank the subjects for taking part in this research. 351
352
The authors gratefully acknowledge the funding supplied by Bio Medical Research (BMR) 353 Ltd., Galway, Ireland and Enterprise Ireland to enable to study to be completed. BMR is the 354 manufacturer of the NMES device used in this study. 355
356
The results of the current study do not constitute endorsement of the product by the authors or 357
the journal. 358
359
References 360
1. Higgins TR, Heazlewood IT, and Climstein M. A random control trial of contrast baths 361 and ice baths for recovery during competition in U/20 rugby union. J Strength Cond Res. 362 2011;25(4):1046-1051. 363
364 2. Barnett A. Using recovery modalities between training sessions in elite athletes: does it 365
help? Sports Med. 2006; 36(9):781-796. 366
367 3. Mikkola J, Laaksonen M, Holmberg HC, Vesterinen V, and Nummela A. Determinants of 368
a simulated cross-country skiing sprint competition using V2 skating technique on roller 369 skis. J Strength Cond Res. 2010;24(4):920-928. 370
371 4. Babault N, Cometti C, Maffiuletti NA, and Deley G. Does electrical stimulation enhance 372
post-exercise performance recovery? Eur J Appl Physiol. 2011;111(10):2501-2507. 373 374 5. McLoughlin TJ, Snyder AR, Brolinson PG, and Pizza FX. Sensory level electrical muscle 375
stimulation: effect on markers of muscle injury. Br J Sports Med. 2004;38(6):725-729. 376 377
6. Grunovas A, Stilinska V, Poderys J and Trinkunas E. Peripheral and systemic circulation 378 after local dynamic exercise and recovery using passive foot movement and 379 electrostimulation. J Sports Med & Phys Fitness. 2007;47(3):335-343. 380
381
9
7. Heyman E, De Geus B, Mertens I, and Meeusen R. Effects of four recovery methods on 382 repeated maximal rock climbing performance. Med Sci Sports Exerc. 2009;41(6):1303-383 1310. 384
385 8. Malone JK, Coughlan GF, Crowe L, Gissane GC, and Caulfield B. The physiological 386
effects of low-intensity neuromuscular electrical stimulation (NMES) on short-term 387 recovery from supra-maximal exercise bouts in male triathletes. Eur J Appl Physiol. 388 2012;112(7):2421-2432. 389
390 9. Neric FB, Beam WC, Brown LE, and Wiersma LD. Comparison of swim recovery and 391
muscle stimulation on lactate removal after sprint swimming. J Strength Cond Res. 392 2009;23(9):2560-2567. 393
394 10. Warren CD, Brown LE, Landers MR and Stahura KA. Effect of three different between-395
inning recovery methods on baseball pitching performance. J Strength Cond Res. 396 2011;25(3):683-688. 397
398
11. Crognale D, De Vito G, Minogue C, Crowe L, Grosset JF and Caulfield B. 399 Neuromuscular electrical stimulation can elicit aerobic exercise response without undue 400
discomfort in healthy physically active adults. J Strength Cond Res. 2013;27(1):208-215. 401 402
12. Miller BF, Gruben KG and Morgan BJ. Circulatory responses to voluntary and 403 electrically induced muscle contractions in humans. Phys Ther. 2000;80(1):53-60. 404
405 13. Levine SP, Kett RL, Gross MD, Wilson BA, Cederna PS and Juni JE. Blood flow in the 406
gluteus maximus of seated individuals during electrical muscle stimulation. Arch Phys 407 Med Rehabil. 1990;71(9):682-686. 408
409
14. Souissi N, Bessot N, Chamari K, Gauthier A, Sesboue B, and Davenne D. Effect of time 410 of day on aerobic contribution to the 30-s Wingate test performance. Chronobiol Int. 411
2007;24(4):739-748. 412 413 15. Cortis C, Tessitore A, Perroni F, Lupo C, Pesce C, Ammendolia A, and Capranica L. 414
Interlimb coordination, strength, and power in soccer players across the lifespan. J 415 Strength Cond Res. 2009;23(9):2458-2466. 416
417 16. Watt KK, Hopkins WG, and Snow RJ. Reliability of performance in repeated sprint 418
cycling tests. J Sci Med Sport. 2002;5(4):354-361. 419 420 17. Astorino TA and Roberson DW. Efficacy of acute caffeine ingestion for short-term high-421
intensity exercise performance: a systematic review. J Strength Cond Res. 2010;24(1): 422 257-265. 423
424 18. Jackson AS and Pollock ML. Generalized equations for predicting body density of men. 425
Br J Nutr. 1978;40(3):497-504. 426 427 19. Maffiuletti NA. Physiological and methodological considerations for the use of 428
neuromuscular electrical stimulation. Eur J Appl Physiol. 2010;110(2):223-234. 429
430
10
20. Bond V, Adams RG, Tearney RJ, Gresham K, Ruff W. Effects of active and passive 431 recovery on lactate removal and subsequent isokinetic muscle function. J Sports Med 432 Phys Fitness. 1991;31(3):357-361. 433
434 21. Maffiuletti NA and Bendahan D. Mesurement methods of muscle fatigue. In: Williams C 435
& Ratel S, eds, Human Muscle Fatigue. Oxon, Routledge: 2009: 25. 436 437 22. Costa VP, De Matos DG, Pertence LC, Martins JAN, De Lima JRP. Reproducibility of 438
cycling time to exhaustion at VO2max in competitive cyclists. J Exerc Physiol Online 439 2011;14(1):28-35. 440
441 23. Faul F, Erdfelder E, Lang AG, and Buchner A. G*Power 3: a flexible statistical power 442
analysis program for the social, behavioral, and biomedical sciences. Behav Res methods. 443 2007;39(2):175-191. 444
445 24. Byoundo S, Kim D, Dongjea C, Changki K, and Hyungsoo S. The effect of electrical 446
stimulation on blood lactate after anaerobic muscle fatigue induced in taekwondo athletes. 447
J Phys Ther Sci. 2011;23(2):271-275. 448 449
25. Crampton D, Donne B, Egana M, and Warmington SA. Sprint cycling performance is 450 maintained with short-term contrast water immersion. Med Sci Sports Exerc. 451
2011;43(11):2180-2188. 452 453
26. Allen DG, Lamb GD, Westerblad H. Skeletal muscle fatigue: cellular mechanisms. 454 Physiol Rev. 2008;88(1):287-332. 455
456 27. Gregory CM and Bickel CS. Recruitment patterns in human skeletal muscle during 457
electrical stimulation. Phys Ther. 2005;85(4):358-364. 458
459 28. Lattier G, Millet GY, Martin A, and Martin V. Fatigue and recovery after high-intensity 460
exercise. Part II: Recovery interventions. Int J Sports Med. 2004;25(7):509-515. 461 462 29. Tessitore A, Meeusen R, Cortis C, and Capranica L. Effects of different recovery 463
interventions on anaerobic performances following preseason soccer training. J Strength 464 Cond Res. 2007;21(3):745-750. 465
466 30. Cortis C, Tessitore A, D'Artibale E, Meeusen R, and Capranica L. Effects of post-467
exercise recovery interventions on physiological, psychological, and performance 468 parameters. Int J Sports Med. 2010;31(5):327-335. 469
470
471 472
473 474 475 476
477 478
479
11
Figure Captions 480
Figure 1: Pictures showing A) anterior view and B) posterior view of the specially designed 481 garment wraps and the position of electrodes on the quadriceps and hamstring muscle groups 482 (left leg wrap omitted for illustration purposes only) (Taken from Malone et al., 2012). 483
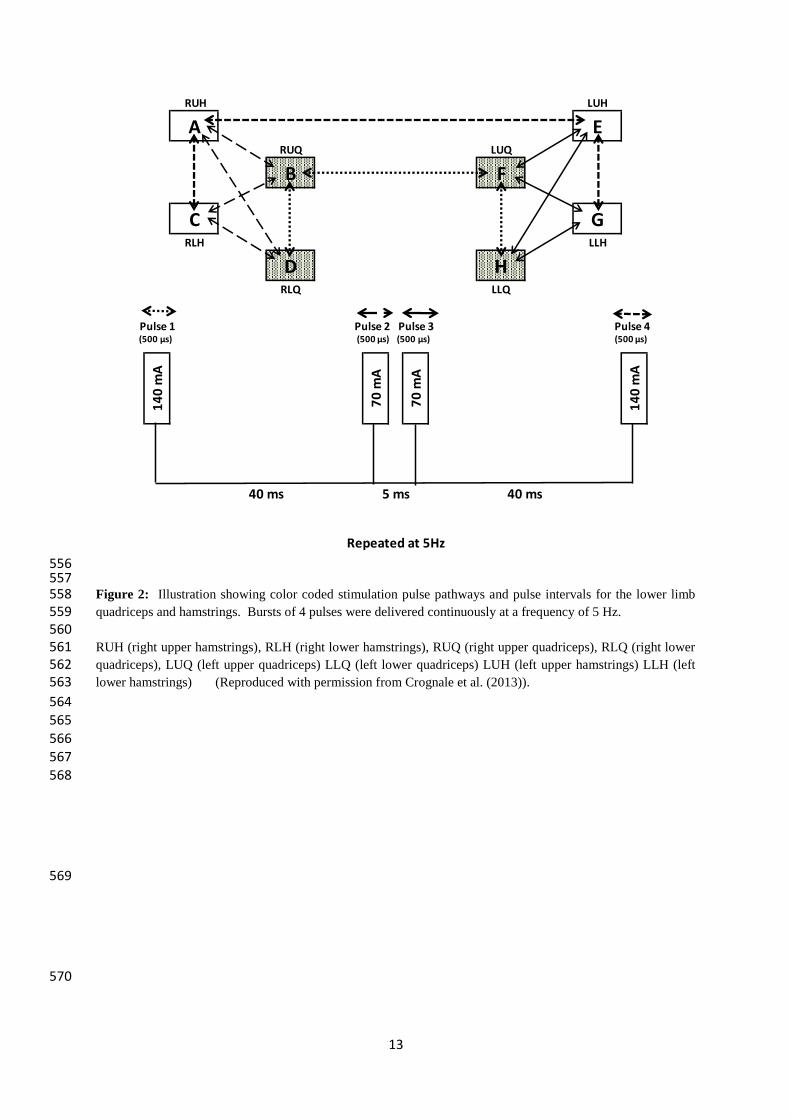
484 485 Figure 2: Illustration showing color coded stimulation pulse pathways and pulse intervals 486 for the lower limb quadriceps and hamstrings. Bursts of 4 pulses were delivered 487 continuously at a frequency of 5 Hz. 488
489
490
RUH (right upper hamstrings), RLH (right lower hamstrings), RUQ (right upper quadriceps), 491 RLQ (right lower quadriceps), LUQ (left upper quadriceps) LLQ (left lower quadriceps) 492 LUH (left upper hamstrings) LLH (left lower hamstrings) (Reproduced with permission 493 from Crognale et al. (2013)). 494 495
496 Figure 3: Study protocol timeline showing pre-intervention (L), recovery intervention (M) 497
and post-intervention (R). 498 499
500 Figure 4: Participant data (Mean ± SD) for time to exhaustion (TLIM) during post 501
intervention exercise bout @ 95% VO2max for NMES, PAS and ACT recovery interventions. 502 * Significant difference between ACT vs. NMES recovery interventions (P < 0.05). 503
504 505 Figure 5: Participants BLa (Mean ± SD) during study protocol for NMES, PAS and ACT 506
recovery interventions 507 * Significant difference between ACT vs. NMES and PAS recovery interventions (P < 0.001) 508
† Significant difference between ACT vs. PAS recovery interventions (P < 0.05). 509 510 511
Figure 6: Participants HR (Mean ± SD) during study protocol for NMES, PAS and ACT 512
recovery interventions. 513
* Significant difference between ACT vs. NMES and PAS recovery interventions (P < 0.001) 514 † Significant difference between ACT vs. PAS recovery interventions (P < 0.001) 515
‡ Significant difference between NMES vs. PAS recovery interventions (P < 0.05) 516 ¥ Significant difference between NMES vs. ACT recovery interventions (P < 0.05). 517 518 519 520
521 522 523 524
525 526
527

12
528
529 530
Figure 1: Pictures showing A) anterior view and B) posterior view of the specially designed garment wraps and 531 the position of electrodes on the quadriceps and hamstring muscle groups (left leg wrap omitted for illustration 532 purposes only) (Taken from Malone et al., 2012). 533
534 535
536 537 538 539
540
541
542 543 544 545 546
547 548 549 550 551
552 553
554 555
13
556 557 Figure 2: Illustration showing color coded stimulation pulse pathways and pulse intervals for the lower limb 558 quadriceps and hamstrings. Bursts of 4 pulses were delivered continuously at a frequency of 5 Hz. 559 560 RUH (right upper hamstrings), RLH (right lower hamstrings), RUQ (right upper quadriceps), RLQ (right lower 561 quadriceps), LUQ (left upper quadriceps) LLQ (left lower quadriceps) LUH (left upper hamstrings) LLH (left 562 lower hamstrings) (Reproduced with permission from Crognale et al. (2013)). 563
564 565
566 567
568
569
570
RUH LUH
A ERUQ LUQ
B F
C GRLH LLH
D HRLQ LLQ
P 1 P2 P3
Repeated at 5Hz
14
0 m
A
14
0 m
A
70
mA
40 ms 40 ms
70
mA
5 ms
Pulse 1 Pulse 2 Pulse 3 Pulse 4(500 μs) (500 μs) (500 μs) (500 μs)
14
571
Figure 3: Study protocol timeline showing pre-intervention (L), recovery intervention (M) and post-572
intervention (R). 573
Heart R
ate (HR
)
Blo
od
Lactate (BLa)
NM
ES and
Active R
ecovery (2
0 m
in)
Recovery (Lying on Plinth)
95 % VO2max (to Exhaustion)
70 W @ 80 rev.min-1
85 W @ 85 rev.min-1
100 W @ 100 rev.min-1
55 W @ 80 rev.min-1
105 % VO2max
Recovery (Lying on Plinth)
Recovery (Lying on Plinth)
00
:00
02
:00
04
:00
06
:00
08
:00
11
:00
1
6:0
0
21
:00
2
6:0
0
31
:00
36
:00
41
:00
.......(0
5:0
0)
(0:0
0)
(5:0
0)
(10
:00
)(1
5:0
0)
(20
:00
)(2
5:0
0)
(30
:00
)
Time
Line
(min
:sec)
PR
EIN
TERV
ENTIO
N
PO
STIN
TERV
ENTIO
N
REC
OV
ERY
INTER
VEN
TION
PER
IOD
(30
Min
)
BLa
BLa
BLa
BLa
BLa
BLa
BLa
BLa
BLa
*
BLa
15
574
Figure 4: Participant data (Mean ± SD) for time to exhaustion (TLIM) during post intervention exercise bout @ 575 95% VO2max for NMES, PAS and ACT recovery interventions. 576
* Significant difference between ACT vs. NMES recovery interventions (P < 0.05). 577
578
579
580
581
582
583
584
585
586
*
Recovery Intervention Method

16
587
Figure 5: Participants BLa (Mean ± SD) during study protocol for NMES, PAS and ACT recovery 588 interventions 589
* Significant difference between ACT vs. NMES and PAS recovery interventions (P < 0.001) 590 † Significant difference between ACT vs. PAS recovery interventions (P < 0.05). 591
592
593
594
595
596
597
598
17
599
Figure 6: Participants HR (Mean ± SD) during study protocol for NMES, PAS and ACT recovery 600 interventions. 601
* Significant difference between ACT vs. NMES and PAS recovery interventions (P < 0.001) 602 † Significant difference between ACT vs. PAS recovery interventions (P < 0.001) 603
‡ Significant difference between NMES vs. PAS recovery interventions (P < 0.05) 604
¥ Significant difference between NMES vs. ACT recovery interventions (P < 0.05). 605
606


![Surface neuromuscular electrical stimulation for ...doras.dcu.ie/19651/1/dpom4.pdf · [Intervention Review] Surface neuromuscular electrical stimulation for quadriceps strengthening](https://img.pdfslide.net/doc/110x75/5f36ebff4193e847ed61bb54/surface-neuromuscular-electrical-stimulation-for-dorasdcuie196511dpom4pdf.jpg)