Embed Size (px)
Citation preview

Cohen ©2014 Mark Cohen, all rights reserved www.brainmapping.org
Neuronal Anatomyand Electrical Activity
Mark S. CohenUCLA Psychiatry, Neurology, Radiology, Psychology, Biomedical Engineering, Biomedical Physics
Suite 17-369 NPI
Cohen ©2014 Mark Cohen, all rights reserved www.brainmapping.org
Topics
• anatomy of single neurons• resting and action potentials• transmission of signals• chemical and electrical synapses• information coding• BOLD and unit activity• MR-visible effects
Cohen ©2014 Mark Cohen, all rights reserved www.brainmapping.org
Types of Neurons
Axon
Dendrites
Soma (cell body)
Axon terminals
Cohen ©2014 Mark Cohen, all rights reserved www.brainmapping.org
Resting Potential
Typical:-90 < resting potential < -60 mV

Cohen ©2014 Mark Cohen, all rights reserved www.brainmapping.org
Development of the Membrane Potential
–
–
–
–– –
–
–
––
–
–
+
+
++
++
+
+
+++
+
– +
Cohen ©2014 Mark Cohen, all rights reserved www.brainmapping.org
Development of the Membrane Potential
–
–
–
–– –
–
–
––
–
–
+
+
++
++
+
+
+++
+
– +
Cohen ©2014 Mark Cohen, all rights reserved www.brainmapping.org
Development of the Membrane Potential
–
–
–
–– –
–
–
––
–
–+
+
+
++
++
+
+
+++
Nernst Potential:
– +E = RTFln [Cinside][Coutside]
≈ 27mV ln [Cinside][Coutside]
Cohen ©2014 Mark Cohen, all rights reserved www.brainmapping.org
Observed Ion Concentrations
[A-] 350 mM
[Cl-] 40-100 mM[Cl-] 540 mM
–75 mV
[K+] 400 mM[K+] 10 mM
[Na+] 50 mM[Na+] 460 mM
3 Na+ out 2 K+ in
+60 mV
-95 mV
-45 to -70 mV
Nernst Potential@37°C
E =RTFlnpA[A]out pB[B]out py [x]in py [y]inpA[A]in pB[B]in px [x]out py [y]out
!
" # #
$
% & &
A,B are cationsx,y are anions
Cohen ©2014 Mark Cohen, all rights reserved www.brainmapping.org
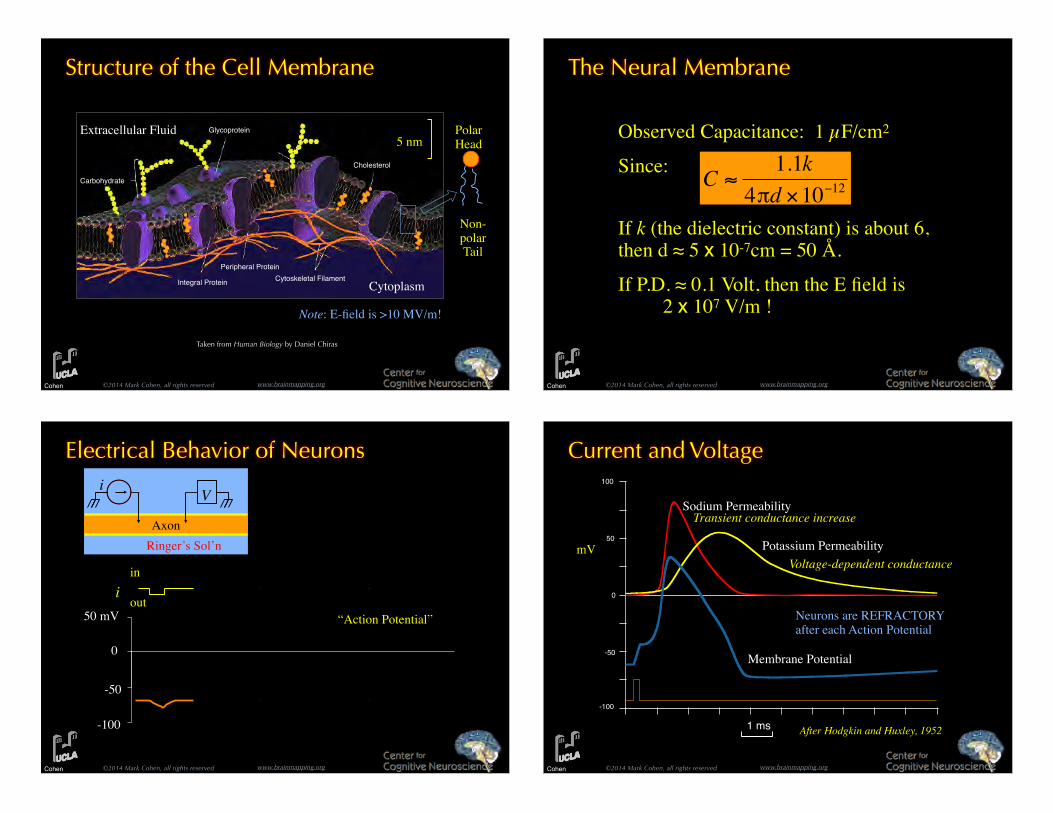
Structure of the Cell Membrane
Taken from Human Biology by Daniel Chiras
Extracellular Fluid
Cytoplasm
Carbohydrate
Integral Protein
Peripheral ProteinCytoskeletal Filament
Cholesterol
Glycoprotein Polar Head
Non-polar Tail
5 nm
Note: E-field is >10 MV/m!
Cohen ©2014 Mark Cohen, all rights reserved www.brainmapping.org
The Neural Membrane
Observed Capacitance: 1 µF/cm2
Since:
If k (the dielectric constant) is about 6, then d ≈ 5 x 10⁻⁷cm = 50 Å.
If P.D. ≈ 0.1 Volt, then the E field is" 2 x 10⁷ V/m !
C ≈1.1k
4πd ×10−12
Cohen ©2014 Mark Cohen, all rights reserved www.brainmapping.org
Electrical Behavior of Neurons
50 mV
0
-50
-100
AxonRinger’s Sol’n
i
iV
out
in
“Action Potential”
Cohen ©2014 Mark Cohen, all rights reserved www.brainmapping.org
Current and Voltage
Sodium Permeability
Potassium Permeability
Membrane Potential
mV
100
-100
-50
50
0
1 ms
Transient conductance increase
Voltage-dependent conductance
Neurons are REFRACTORY after each Action Potential
After Hodgkin and Huxley, 1952

Cohen ©2014 Mark Cohen, all rights reserved www.brainmapping.org
Sodium Leakage with Action Potentials
C = 1µF/cm2
10 µm
With Each Action Potential:
[Na+] is increased by 0.1% with each Action Potential!
Na+
ΔV = 0.13 VoltQ = CV = 1.3 x 10⁻⁷ Coulombs /cm2
= 1.4 x 10⁻¹² Moles/cm2
Surface Area = 2.8 x 10⁻⁵ cm2
Cell Volume = 9 x 10 -13 liters, about half of which is liquid.
At 40 mM Sodium:= 4.0 x 10⁻¹⁴ Moles Sodium/cell
Each AP passes 3.7 x 10⁻¹⁷ Moles of Na+
Cohen ©2014 Mark Cohen, all rights reserved www.brainmapping.org
Passive Firing of Action Potentials
Cohen ©2014 Mark Cohen, all rights reserved www.brainmapping.org
Na+Na+
Na+
Na+Na+
Na+Na+
Na+Na+
Na+Na+
Na+
αα
αα
αα
αα
ββ
ββ
ββ
ββ
αααα
ββ
ββ
αααα
αααα
αα
αα
ββ
ββ
ββ
ββ
ββ
ββ
K+K+
K+K+
K+
K+
K+K+
ATP
ADP
P
P
P
P INSIDE OF CELL
Sodium Potassium PumpAfter Matthews and van Holde: Biochemistry 2/e Initial State
Pump Open to Inside
Na+ Taken from Inside
ATP Phosphorylates α Subunit and Stimulates Conformation Change
Sodium is Released
Pump Open to Outside
Two Potassium Ions Accepted from Outside
Dephosphorylation Stimulates Conformation Change
Potassium Expelled to Inside
Cohen ©2014 Mark Cohen, all rights reserved www.brainmapping.org
Cable Properties
ri
CmrmEm
x
0 λ 2λ−2λ −λ
Vx
V0= e−
xλ
λ = rm /riFor vertebrate neurons:
µm < λ < mm
ri
Cmrm
ri
Cmrm
ri
Cmrm
V x/V
o
x
Intracellular
Extracellular

Current
Cohen ©2014 Mark Cohen, all rights reserved www.brainmapping.org
Voltage/Pressure Analogy
ri
Cmrm
rm
Cm
ri
Current
Cohen ©2014 Mark Cohen, all rights reserved www.brainmapping.org
Cable Properties
10 15 20 msec0 5
For vertebrate neurons: 0.5 msec < τ < 5 msec V
ri
CmrmEm
xri
Cmrm
ri
Cmrm
ri
Cmrm
Intracellular
Extracellular
Cohen ©2014 Mark Cohen, all rights reserved www.brainmapping.org
Propagation of the Action Potential
V1 V2 V3 V4
0V1
0V2
0V3
thresh
thresh
thresh
thresh0
V4
Resulting Velocity ~1-3m/sec
Cohen ©2014 Mark Cohen, all rights reserved www.brainmapping.org
Propagation of the Action Potential
V1 V2 V3 V4
0V1
0V2
0V3
thresh
thresh
thresh
thresh0
V4
Resulting Velocity ~1-3m/sec

Cohen ©2014 Mark Cohen, all rights reserved www.brainmapping.org
Propagation of the Action Potential
V1 V2 V3 V4
0V1
0V2
0V3
thresh
thresh
thresh
thresh0
V4
Resulting Velocity ~1-3m/sec
Cohen ©2014 Mark Cohen, all rights reserved www.brainmapping.org
Propagation of the Action Potential
V1 V2 V3 V4
0V1
0V2
0V3
thresh
thresh
thresh
thresh0
V4
Resulting Velocity ~1-3m/sec
Cohen ©2014 Mark Cohen, all rights reserved www.brainmapping.org
Propagation of the Action Potential
V1 V2 V3 V4
0V1
0V2
0V3
thresh
thresh
thresh
thresh0
V4
Resulting Velocity ~1-3m/sec
Cohen ©2014 Mark Cohen, all rights reserved www.brainmapping.org
Propagation of the Action Potential
V1 V2 V3 V4
0V1
0V2
0V3
thresh
thresh
thresh
thresh0
V4
Resulting Velocity ~1-3m/sec

Cohen ©2014 Mark Cohen, all rights reserved www.brainmapping.org
Propagation of the Action Potential
V1 V2 V3 V4
0V1
0V2
0V3
thresh
thresh
thresh
thresh0
V4
Resulting Velocity ~1-3m/sec
Cohen ©2014 Mark Cohen, all rights reserved www.brainmapping.org
Propagation of the Action Potential
V1 V2 V3 V4
0V1
0V2
0V3
thresh
thresh
thresh
thresh0
V4
Resulting Velocity ~1-3m/sec
Cohen ©2014 Mark Cohen, all rights reserved www.brainmapping.org
Propagation of the Action Potential
V1 V2 V3 V4
0V1
0V2
0V3
thresh
thresh
thresh
thresh0
V4
Resulting Velocity ~1-3m/sec
Cohen ©2014 Mark Cohen, all rights reserved www.brainmapping.org
Myelin Sheath
100 Å

Cohen ©2014 Mark Cohen, all rights reserved www.brainmapping.org
Myelin Sheath
Cohen ©2014 Mark Cohen, all rights reserved www.brainmapping.org
Myelin Sheath
Cohen ©2014 Mark Cohen, all rights reserved www.brainmapping.org
Nodes of Ranvier
Cohen ©2014 Mark Cohen, all rights reserved www.brainmapping.org
Saltatory Conduction
Node:Low Membrane ResistanceHigh Membrane Current FlowFires Action Potential
Action Potential Regeneration
Internode:High Membrane ResistanceLong Spatial ConstantShort Time Constant
Efficient Electrotonic Conduction
MyelinAxon

Cohen ©2014 Mark Cohen, all rights reserved www.brainmapping.org
White and Gray Matter
Trans-Calossal Fibers
Arcuate Fibers
Optic Radiations
After: Catani, et al., NeuroImage 17:77, 2002
Cohen ©2014 Mark Cohen, all rights reserved www.brainmapping.org
EPSP’s: Excitatory Post-Synaptic Potentials
Muscle end plate potentialsRecorded in low Ca2+ / high Mg2+
Boyd & Martin, 1956
Amplitudes are quantized and display a Poisson distribution
20
16
12
8
4
0
# of
Obs
erva
tions
Measured Potential (mV)0 0.4 0.8 1.2 1.6 2.0 2.4 2.8
f (k;λ) = λke−λ
k!
Cohen ©2014 Mark Cohen, all rights reserved www.brainmapping.org
Reversal Potential
0 2 4 6 8 msec
Outward
Inward
200
200
0 nA
38 mV
-120 mV
-15 mV
epsp’s result from increased K+ and Na+ conductance, with ΔNa+ > ΔK+
After Magleby and Stevens, 1972
iout
+–Vset +
Neuron
Extra-cellular fluid
Cohen ©2014 Mark Cohen, all rights reserved www.brainmapping.org
Neural Synapse
From: http://www.driesen.com/synapse.htm
Microtubules
Synaptic vesicles
Synaptic Bouton
Synaptic Cleft
Mitochondrion
Dendritic Spine
Presynaptic Membrane Postsynaptic Membrane
Golgi Complex
Synaptic Cleft
Synaptic vesicles

Cohen ©2014 Mark Cohen, all rights reserved www.brainmapping.org
Synapses by EM
200 nm
Synaptic Density
Flat Vesicles
Round Vesicles
Mitochondria
Atlas of Ultrastructural Neurocytologyhttp://synapses.mcg.edu/atlas/1_6_1.stm
Cohen ©2014 Mark Cohen, all rights reserved www.brainmapping.org
Synaptic Mechanism (movie)
Delay from Presynaptic Action Potential to Post-synaptic Voltage Change is ≈ 0.5 msec
Cohen ©2014 Mark Cohen, all rights reserved www.brainmapping.org
Synaptic Vesicles
From: Matthews, G. Neurobiology: Molecules, Cells and Systems 2nd edn
Exocytosis of Transmitter requires Ca2+
Cohen ©2014 Mark Cohen, all rights reserved www.brainmapping.org
NeurotransmittersSmall Molecules:
AcetylcholineSerotoninHistamineEpinephrineNorepinephrineDopamineAdenosineATPNitric Oxide
Amino AcidsAspartateGamma-aminobutyric AcidGlutamateGlycine
PeptidesAngiotensin IIBradykininBeta-endorphinBombesinCalcitoninCholecystokininEnkephalinDynorphinInsulinGalaninGastrinGlucagonGRHGHRH
MotilinNeurotensinNeuropeptide YSubstance PSecretinSomatostatinVasopressinOxytocinProlactinThyrotropinTHRHLuteinizing HormoneVasoactive Intestinal Peptide" …and many others

Cohen ©2014 Mark Cohen, all rights reserved www.brainmapping.org
Electrical Synapses
50 nm50 nm
Gap Junction
Cohen ©2014 Mark Cohen, all rights reserved www.brainmapping.org
Gap Junction Microstructure
Modified from: http://aids.hallym.ac.kr
Intercellular Gap
Gap Junction Channel
NH3+
COO–
Connexon
ConnexonSubunit
Gap Junctions have no synaptic delay, and may act as simple resistance or as electrical rectifiers
Cohen ©2014 Mark Cohen, all rights reserved www.brainmapping.org
SpatioTemporal Summation of psp’s
http://www.oseplus.de/Images/jpg/Synapse1.jpg
2 mV Single epsp
0 8 ms
-20
6
12
Summated epsp’s
Cohen ©2014 Mark Cohen, all rights reserved www.brainmapping.org
Integration of Inputs
Electrotonic properties of cells can result in spatial information zones within cells

Cohen ©2014 Mark Cohen, all rights reserved www.brainmapping.org
Dendritic Spines
Atlas of Ultrastructural Neurocytology
1 µm
Cohen ©2014 Mark Cohen, all rights reserved www.brainmapping.org
How Do Neurons Encode Information?
1. Firing Rate: Ranges up to 1000 spikes/second
2. Labeled Channels: Each neuron has different information content
3. Modification of Synaptic Efficacy
4. Firing Synchrony
5. Transmitter Identity
Action Potentials are Identical!
Cohen ©2014 Mark Cohen, all rights reserved www.brainmapping.org
Place Encoding - Basilar Membrane
Frequency
V
t20kHz
20Hz
Cohen ©2014 Mark Cohen, all rights reserved www.brainmapping.org
Inhibition
0 5 10 15 ms
-80
-70
-60
Cl– influx
K+ efflux
Reversal potential of Cl– is near the resting potential. Therefore, its inhibition may be silent.

Cohen ©2014 Mark Cohen, all rights reserved www.brainmapping.org
Pre-Synaptic Inhibition
Excitatory Synapse
Inhibitory Synapse
Cohen ©2014 Mark Cohen, all rights reserved www.brainmapping.org
What Might We Detect?• Energy Demand• Direct Electrical Signaling• Morphological Differences• Chemical Concentrations• Tissue Density• Fat/Water• etc...
Cohen ©2014 Mark Cohen, all rights reserved www.brainmapping.org
How does BOLD relate to neural firing?
Energy Demands in TransmissionPre-synaptic:
Transmitter SynthesisExocytosisTransmitter re-uptake
Post-SynapticMaintenance of membrane potential after ion leakageExcitatory: Removal of Sodium (Na/K pump)Inhibitory: ???
Cohen ©2014 Mark Cohen, all rights reserved www.brainmapping.org
Logothetis Results
LFP = 40-130 HzMUA = 300-1500 Hz
Pre ! On! PostStim
Logothetis, et al., Nature 412:152, 2001

Cohen ©2014 Mark Cohen, all rights reserved www.brainmapping.org
Logothetis resultsAverage
BOLD
LFP * hrf
LFP/MUA
BOLD
Norm
aliz
ed R
espo
nse
ContrastTime
Time
Norm
aliz
ed R
espo
nse
Norm
aliz
ed R
espo
nse
Cohen ©2014 Mark Cohen, all rights reserved www.brainmapping.org
Types of Neurons
Axon
Cohen ©2014 Mark Cohen, all rights reserved www.brainmapping.org
CSF
Presumed Origin of the EEG
+ + + +–
–
– – –
–Skin
Bone
Cohen ©2014 Mark Cohen, all rights reserved www.brainmapping.org
Many Neurons are Not “Seen” by EEG
Bone
Skin
Bone
CSF

Cohen ©2014 Mark Cohen, all rights reserved www.brainmapping.org
General Limitations in EEG Localization
• Deeper Sources Show Weaker Signals
• Magnitude Depends on Dipole Orientation
• Magnitude Depends on Temporal Synchrony
• Magnitude Depends on Spatial Coherence
• Conductivity of Body Tissues (CSF, scalp) Blur the Scalp Potentials