Embed Size (px)
Citation preview

NEURONAL CHANGES IN THE
HIPPOCAMPUS OF
POST-STROKE SURVIVORS
Elizabeth Gemmell MRes. Neuroscience, BSc Hons Biomedical Science
Neurovascular Research Group Institute for Ageing and Health
Newcastle University Campus for Ageing and Vitality
Newcastle Upon Tyne NE4 5PL
Dissertation submitted for the degree of Doctor of Philosophy in Newcastle University
November, 2013
i
Abstract
Background: Delayed post-stroke dementia (PSD) affects up to 50% of all stroke
survivors, developing months or years after the initial stroke. However, the underlying
mechanisms which cause PSD are unclear. Hippocampal atrophy is associated with PSD
and vascular dementia, and hippocampal neurons are known to be particularly
vulnerable in stroke and cerebrovascular disease. This work aimed to identify
neuropathological characteristics and mechanisms contributing to cognitive decline in
post-stroke survivors, focusing on the involvement of regional specific hippocampal
neurons.
Methods: Post-mortem brain tissue from the prospective CogFAST study was analyzed
to compare pathological changes in stroke survivors who developed PSD with those
who maintained normal cognitive function (PSND). Tissue from elderly controls and
pathologically defined dementia groups; Alzheimer’s disease (AD), vascular dementia
(VaD), mixed AD with VaD (MD); were also analysed for comparison with different
disease aetiologies. Histological and immunohistochemical staining with quantitative
image analysis and 3D morphometric analysis was carried out in paraffin-embedded
sections, and protein immunoblotting was used in frozen hippocampal tissue.
Key findings: Neuronal volumes in hippocampal subfields CA1-4 were reduced in PSD,
VaD and AD subjects compared to elderly controls and PSND. Neuronal volume was
also related to post-stroke cognitive function. There were no differences in dendritic
length-density, hippocampal myelin loss, or autophagy markers between PSD and
PSND. However, neuronal volumes were related to hippocampal tau pathology
burden, reactive astrocyte density and myelin density in the alveus. Interestingly, the
PSND subjects had greater burden of hippocampal amyloid-β than PSD. There were no
quantitative differences in markers for astrocytes or microglia between the post-stroke
groups.
Conclusion: These findings suggest that neuronal volume loss is associated with post-
stroke and ageing-related dementia. There were no relationships between the
observed neuronal changes and AD pathology in stroke survivors, suggesting an
important role for cerebrovascular disease processes.

ii
Acknowledgements
First and foremost, I would like to thank my supervisor Professor Raj Kalaria for giving
me the opportunity to complete a PhD in this exciting area of research, and for his
support, knowledge and enthusiasm which has helped to inspire my work.
I would like to give special thanks to Mr. Arthur Oakley for his advice and support
throughout my PhD, and for his great sense of humour, generosity, and tales of his
time in research which have made my time with the Neurovascular Research group
especially enjoyable.
I would not have been able to complete my PhD without the help of my colleagues and
good friends, particularly Dr. Lucy Craggs, Dr. Ahmad Khundakar, and Janet Slade who
taught me the essential research skills I acquired during my PhD. I wish to extend my
gratitude to Ros Hall and Mary Johnson for their assistance and expert advice in
neuroanatomy and histological techniques. I would also like to thank Edward Tam,
Georgina Smalley and Sukhraj Tiwana, and all the staff at the Newcastle Brain Tissue
Resource for their assistance during my studies. None of this research would have
been possible without the generosity of the patients and families involved in the
Cognitive Function After Stroke study, and I hope my work will help to inspire further
important research in this field.
Finally I would like to thank Dean Smith and my family for always supporting and
encouraging me through my studies, and to let them know how much I appreciate all
that they have done to help me achieve my PhD.
My PhD was funded by the Medical Research Council as part of the Lifelong Health and
Wellbeing Initiative at the Centre for Brain Ageing and Vitality.
Lizzie Gemmell
November, 2013
iii
Contents NEURONAL CHANGES IN THE HIPPOCAMPUS OF POST-STROKE SURVIVORS .................. i
Chapter 1. Introduction ................................................................................................ 1
1.1 Ageing, stroke and dementia ............................................................................. 1
1.1.1 Post-stroke dementia .................................................................................. 1
1.2 Causes of delayed post-stroke dementia ........................................................... 3
1.2.1 Cerebrovascular disease (CVD) ................................................................... 4
1.2.2 Alzheimer’s disease (AD) ............................................................................. 7
1.2.3 Mixed dementia: CVD and AD................................................................... 11
1.2.4 Ageing ........................................................................................................ 12
1.3 The Cognitive Function After Stroke (CogFAST) study ..................................... 14
1.3.1 Study design .............................................................................................. 14
1.3.2 Key CogFAST study findings ...................................................................... 16
1.3.3 Hippocampal microvascular changes in delayed PSD ............................... 17
1.4 The hippocampus in post-stroke dementia ..................................................... 18
1.4.1 Hippocampal atrophy and dementia ........................................................ 18
1.4.2 The hippocampus and memory ................................................................ 19
1.4.3 Hippocampal anatomy and circuitry ......................................................... 20
1.4.4 Pyramidal neurons in the Cornu Ammonis ............................................... 23
1.4.5 Differential subfield vulnerability in PSD .................................................. 26
1.4.6 Neurodegeneration and autophagy ......................................................... 27
1.5 The role of neuroglia in neurodegeneration .................................................... 28
1.5.1 Astrocytes .................................................................................................. 29
iv
1.5.2 Microglia .................................................................................................... 33
1.5.3 Oligodendrocytes ...................................................................................... 34
1.6 Aims and hypotheses ....................................................................................... 36
Chapter 2. Materials and Methods ............................................................................. 37
2.1 Introduction ...................................................................................................... 37
2.2 Subject selection and clinical diagnosis............................................................ 37
2.2.1 CogFAST study design ............................................................................... 37
2.2.2 Neuropathological assessment and dementia diagnoses ........................ 38
2.2.3 Subject demographics and pathological findings ..................................... 40
2.3 Tissue acquisition ............................................................................................. 41
2.4 Paraffin-embedded tissue preparation ............................................................ 42
2.4.1 Sectioning, dewaxing and mounting ......................................................... 42
2.5 Histology ........................................................................................................... 44
2.5.1 Cresyl Fast Violet (CFV) ............................................................................. 44
2.5.2 Luxol Fast Blue (LFB) ................................................................................. 44
2.5.3 Haematoxylin and Eosin (H & E) ............................................................... 45
2.6 Standard immunohistochemistry (IHC) protocol ............................................. 45
2.7 Image analysis .................................................................................................. 48
2.7.1 Image capture ........................................................................................... 48
2.7.2 Image Pro analysis ..................................................................................... 48
2.7.3 Image Pro analysis of LFB stained sections and myelin index calculations
49
2.7.4 Astrocyte counts ....................................................................................... 50
v
2.7.5 2.7.5 3D Stereology for neuronal density and volume ............................. 50
2.7.6 3D stereology for dendritic length-density ............................................... 53
2.8 Protein analysis in frozen hippocampal tissue ................................................. 54
2.8.1 Tissue extraction ....................................................................................... 54
2.8.2 DC protein assay ........................................................................................ 55
2.8.3 Protein separation by SDS-PAGE ............................................................... 56
2.8.4 Protein immunoblotting ............................................................................ 57
2.9 Baboon model of acute chronic cerebral hypoperfusion ................................ 59
2.10 Statistical analyses ........................................................................................ 61
Chapter 3. Neuronal Volume and Density Changes in Post-Stroke and Ageing Related
Dementias 62
3.1 Introduction ...................................................................................................... 62
3.1.1 Measuring neuronal volume and density using 3D stereology ................ 63
3.2 Aims .................................................................................................................. 64
3.3 Methods ........................................................................................................... 64
3.3.1 3D stereological analysis of neuronal volumes and densities .................. 64
3.3.2 Statistical analyses .................................................................................... 65
3.4 Results .............................................................................................................. 65
3.4.1 Subject demographics ............................................................................... 65
3.4.2 Neuronal density in PSD and ageing-related dementias .......................... 66
3.4.3 Neuronal volumes in PSD and ageing-related dementias ........................ 68
3.4.4 Clinicopathological correlations ................................................................ 71
3.4.5 Neuronal changes in younger versus elderly controls .............................. 73
vi
3.4.6 Neuronal changes in a baboon model of acute cerebral hypoperfusion . 75
3.5 Discussion ......................................................................................................... 77
3.5.1 Reduced neuronal volumes in post-stroke and ageing-related dementias
77
3.5.2 Neuronal volumes and densities in different disease processes .............. 78
3.5.3 Comparison with previous studies ............................................................ 79
3.5.4 Limitations of neuronal volume and density measurements ................... 80
3.5.5 Neuronal volumes in middle-aged and elderly controls ........................... 81
3.5.6 Neuronal volumes were reversibly reduced in acute cerebral
hypoperfusion ......................................................................................................... 82
3.6 Conclusions ....................................................................................................... 83
Chapter 4. Neurodegenerative Processes in Stroke Survivors ................................... 84
4.1 Introduction ...................................................................................................... 84
4.1.1 Hippocampal Alzheimer’s-type pathology ................................................ 84
4.1.2 Dysfunctional autophagy in AD and CVD .................................................. 86
4.2 Aims .................................................................................................................. 89
4.3 Materials and methods .................................................................................... 89
4.3.1 IHC and image analysis .............................................................................. 89
4.3.2 Semi-quantitative rating of hippocampal Aβ pathology ........................... 89
4.3.3 Semi-quantitative rating of hippocampal tau pathology .......................... 90
4.3.4 Statistical analyses .................................................................................... 90
4.4 Results .............................................................................................................. 93
4.4.1 AD pathology ............................................................................................. 93
vii
4.4.2 Autophagy markers ................................................................................... 96
4.4.3 Correlations between autophagy markers ............................................... 99
4.4.4 Clinicopathological correlations .............................................................. 100
4.5 Discussion ....................................................................................................... 100
4.5.1 Hippocampal AD pathology .................................................................... 100
4.5.2 Autophagy markers ................................................................................. 102
4.6 Conclusions ..................................................................................................... 104
Chapter 5. Hippocampal Dendritic Changes in Post-Stroke and Ageing-Related
Dementias 105
5.1 Introduction .................................................................................................... 105
5.1.1 Dendrites and dendritic spines ............................................................... 105
5.1.2 Techniques used to study dendrite morphology: Golgi staining ............ 106
5.1.3 Techniques used to study dendrite morphology: MAP2 IHC.................. 107
5.1.4 Dendritic changes after ischemia ............................................................ 107
5.1.5 Synapse loss in AD and stroke ................................................................. 109
5.2 Aims ................................................................................................................ 111
5.3 Materials and methods .................................................................................. 112
5.3.1 IHC ........................................................................................................... 112
5.3.2 Image Pro analysis of MAP2 in the pyramidal layer ............................... 112
5.3.3 Novel 3D analysis of dendritic length density in the stratum radiatum . 112
5.3.4 Investigation of CA layers stained for MAP2 and other post-synaptic
proteins 112
5.3.5 Protein immunoblots of synaptic markers ............................................. 113
viii
5.3.6 Statistical analysis ................................................................................... 113
5.4 Results ............................................................................................................ 114
5.4.1 MAP2 2D image analysis ......................................................................... 114
5.4.2 MAP2 dendritic length density ............................................................... 117
5.4.3 Visual investigation of MAP2 and post-synaptic markers ...................... 118
5.4.4 MAP2 and drebrin staining in perfused non-human primate model ..... 122
5.4.5 Protein immunoblots of synaptic markers ............................................. 124
5.5 Discussion ....................................................................................................... 126
5.5.1 MAP2 in the pyramidal layer................................................................... 126
5.5.2 MAP2 dendritic length density in the stratum radiatum ........................ 126
5.5.3 MAP2 and AD pathology ......................................................................... 129
5.5.4 Visual investigation of MAP2, drebrin and PSD-95 staining ................... 129
5.5.5 Pre- and post-synaptic proteins in frozen hippocampal tissue .............. 130
5.6 Conclusions ..................................................................................................... 132
Chapter 6. Hippocampal white matter changes and involvement of astrocytes and
microglia 134
6.1 Introduction .................................................................................................... 134
6.1.1 White matter changes in the alveus ....................................................... 134
6.1.2 Neuroglia in stroke and AD ..................................................................... 138
6.2 Aims ................................................................................................................ 141
6.3 Methods ......................................................................................................... 142
6.3.1 Histological and IHC staining ................................................................... 142
6.3.2 Image analysis ......................................................................................... 142
ix
6.3.3 Statistical analysis ................................................................................... 145
6.4 Results ............................................................................................................ 146
6.4.1 White matter changes in the alveus ....................................................... 146
6.4.2 Neuronal dMBP staining ......................................................................... 148
6.4.3 Neuronal pyknosis rating ........................................................................ 150
6.4.4 Astrocyte density .................................................................................... 151
6.4.5 Microglia .................................................................................................. 158
6.5 Discussion ....................................................................................................... 160
6.5.1 White matter damage ............................................................................. 160
6.5.2 Astrocyte densities .................................................................................. 162
6.5.3 Microglia .................................................................................................. 164
6.6 Conclusions ..................................................................................................... 165
Chapter 7. Discussion ................................................................................................ 167
7.1 Introduction .................................................................................................... 167
7.2 Neuronal atrophy as a mechanism contributing to cognitive impairment .... 168
7.3 Investigating mechanisms causing neuronal atrophy .................................... 169
7.3.1 Alzheimer’s disease pathology ................................................................ 169
7.3.2 Autophagy ............................................................................................... 169
7.3.3 Neuronal connectivity; dendrites, dendritic spines and synapses ......... 170
7.3.4 White matter changes in ageing and CVD .............................................. 172
7.3.5 Role of astrocytes and microglial activation ........................................... 173
7.4 General strengths and limitations .................................................................. 174
7.4.1 Unique strengths of the CogFAST cohort ................................................ 174
x
7.4.2 Additional factors to consider ................................................................. 174
7.4.3 Limitations associated with human post-mortem studies of age-
associated dementia ............................................................................................. 175
7.5 Future Directions ............................................................................................ 176
7.5.1 Short-term studies .................................................................................. 176
7.5.2 Medium-term studies ............................................................................. 177
7.5.3 Long-term studies ................................................................................... 178
7.6 Conclusions ..................................................................................................... 179
Chapter 8. Appendix ................................................................................................. 180
xi
Figure and table legends
Figure 1.1 Progression of delayed post-stroke dementia over time. TIA = transient
ischaemic attack, NFT = neurofibrillary tangle, CAA = cerebral amyloid angiopathy. ...... 4
Figure 1.2. Common pathological characteristics of AD and VaD. A,
Hyperphosphorylated tau pathology in the hippocampus of an AD subject, visualized
using antibodies to AT8; B, amyloid plaques in the hippocampus of an AD subject,
visualized using antibodies to 4G8; C, Cerebral amyloid angiopathy (CAA), arrows show
Aβ deposition in capillaries; D, atherosclerotic changes in the left carotid artery of an
elderly subject (C and D adapted from Grinberg and Thal, 2010); E, normal blood vessel
in elderly subject; F, Arteriolosclerotic blood vessel in a subject with SVD,
demonstrating splitting of concentric smooth muscle cell layers . ................................ 10
Figure 1.3 The CogFAST study design. Mean survival time from stroke to death was
6.72 years (Allan et al., 2011). CT = X-ray computed tomography scan, MMSE = Mini
Mental State Exam, CAMCOG = Cambridge Cognitive Examination, DSM = Diagnostic
and Statistical Manual of mental disorders. ................................................................... 15
Figure 1.4 Hippocampal atrophy in an Alzheimer’s disease and control subject.
Thinning of the cortex and enlarging of ventricles is also evident in the AD brain,
contributing to overall brain atrophy. ............................................................................ 19
Figure 1.5. Diagram showing the location of the hippocampus in the medial temporal
lobe and the differences between episodic and semantic memory. ............................. 20
Figure 1.6 A, Transverse section of the hippocampus stained using cresyl fast violet to
visualize neuronal soma and neuronal subfields: The CA4 subfield is completely
enclosed by the dentate gyrus, the CA3 begins at the ‘mouth’ of the DG and contains
larger and more uniformly oriented neurons, the CA2 neurons are larger, rounder and
densely packed in a narrow band, and the CA1 widens out to a broad band of more
dispersed, smaller pyramidal neurons. The CA1/subiculum border is harder to visually
identify, and is generally considered to begin where the distribution of neurons
becomes more patchy in the straighter band of cells towards the entorhinal cortex. B,
Major circuits of information processing in the hippocampus. Orange arrows represent
the traditional trisynaptic loop involving the DG - CA3 - CA1; Blue arrows represent the
xii
disynaptic loop involving the CA3 - CA1; Yellow arrows represent the disynaptic loop
involving the CA2 – CA1; the green arrow represents the monosynaptic
temporoammonic pathway from the EC to CA1. The black arrow in the CA3 represents
its highly reciprocal connections (Jones and McHugh, 2011). ........................................ 22
Figure 1.7. Layers of the Cornu Ammonis. Str = stratum, SO = stratum oriens, SP =
stratum pyramidal, SR = stratum radiatum. Adapted from (Duevernoy, 2005). ............ 24
Figure 1.8. Hippocampal subfields visualized using immunohistochemistry to detect
dendritic protein MAP2. .................................................................................................. 25
Figure 1.9. GFAP-positive astrocytes in the CA1 visualized using nickel-DAB. A,
Protoplasmic astrocyte; B, Fibrous astrocyte in the alveus, surrounded by other GFAP-
immunopositive processes; C, Astrocytes and astrocytic endfeet around a blood vessel.
A, B Scale bar = 50µm; C, Scale bar = 100µm.................................................................. 33
Figure 1.10 Activated microglia in the CA1 of an AD subject, visualized using IHC to
CD68. Scale bar = 50µm. ................................................................................................. 34
Figure 1.11. A, Diagram of an oligodendrocyte forming myelin sheath around an axon;
B, Characteristic regular, small, darkly stained nuclei of oligodendrocytes in the alveus,
section stained using LFB for myelin and haematoxylin to visualize nuclei. Scale bar =
50µm. .............................................................................................................................. 35
Figure 2.1. A, Levels 18 and 19 according to the Newcastle Brain Map (Perry and
Oakley, 1993); B, Close-up of hippocampal formation at level 18 with clearly
identifiable dentate gyrus and CA regions in a section stained with cresyl-fast violet. . 43
Figure 2.2. Example screen capture of image analysis using Image Pro. Histogram-
based segmentation is performed to highlight in red all immunopositive staining. ...... 48
Figure 2.3 Diagrams demonstrating how images were taken throughout the alveus of
LFB/CFV stained hippocampal sections. A, Red squares represent individual images
taken at 10x magnification; B The alveus was delineated as one subfield for myelin
index analysis. ................................................................................................................. 49
Figure 2.4. CA1 stratum pyramidal stained for ALDH1L1 with 3x4 counting grid overlay.
Scale bar = 100µm. .......................................................................................................... 50
xiii
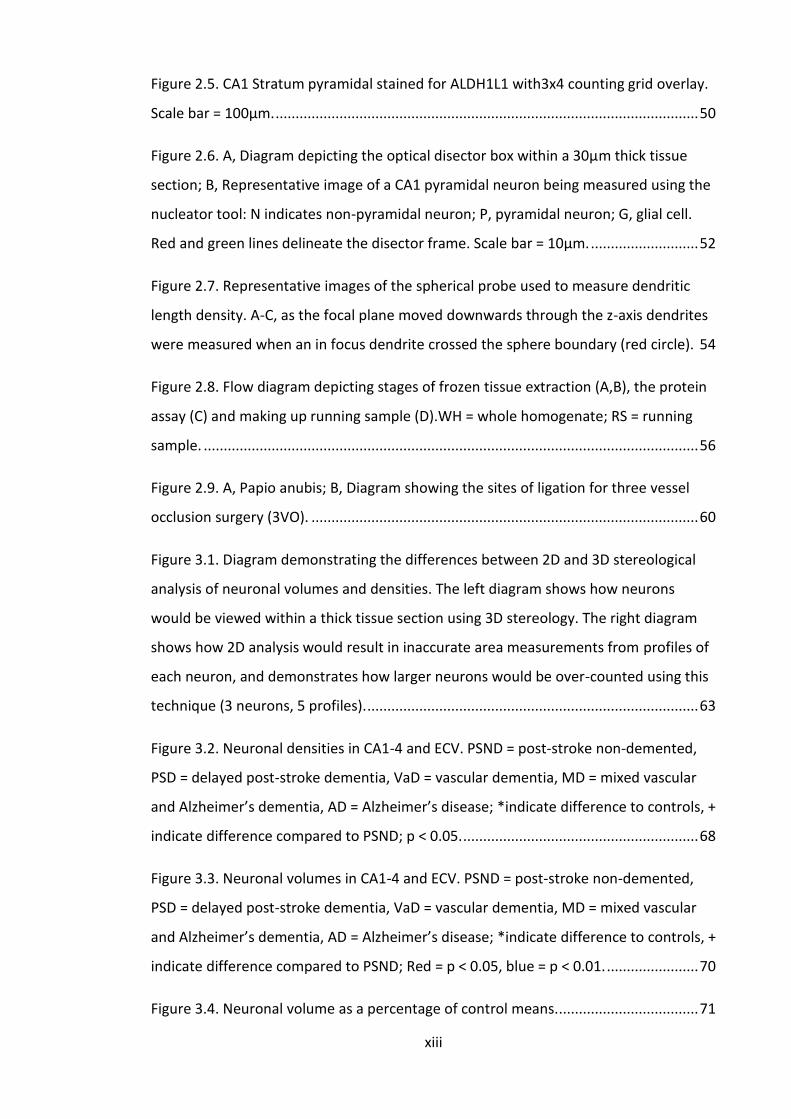
Figure 2.5. CA1 Stratum pyramidal stained for ALDH1L1 with3x4 counting grid overlay.
Scale bar = 100µm. .......................................................................................................... 50
Figure 2.6. A, Diagram depicting the optical disector box within a 30µm thick tissue
section; B, Representative image of a CA1 pyramidal neuron being measured using the
nucleator tool: N indicates non-pyramidal neuron; P, pyramidal neuron; G, glial cell.
Red and green lines delineate the disector frame. Scale bar = 10µm. ........................... 52
Figure 2.7. Representative images of the spherical probe used to measure dendritic
length density. A-C, as the focal plane moved downwards through the z-axis dendrites
were measured when an in focus dendrite crossed the sphere boundary (red circle). 54
Figure 2.8. Flow diagram depicting stages of frozen tissue extraction (A,B), the protein
assay (C) and making up running sample (D).WH = whole homogenate; RS = running
sample. ............................................................................................................................ 56
Figure 2.9. A, Papio anubis; B, Diagram showing the sites of ligation for three vessel
occlusion surgery (3VO). ................................................................................................. 60
Figure 3.1. Diagram demonstrating the differences between 2D and 3D stereological
analysis of neuronal volumes and densities. The left diagram shows how neurons
would be viewed within a thick tissue section using 3D stereology. The right diagram
shows how 2D analysis would result in inaccurate area measurements from profiles of
each neuron, and demonstrates how larger neurons would be over-counted using this
technique (3 neurons, 5 profiles). ................................................................................... 63
Figure 3.2. Neuronal densities in CA1-4 and ECV. PSND = post-stroke non-demented,
PSD = delayed post-stroke dementia, VaD = vascular dementia, MD = mixed vascular
and Alzheimer’s dementia, AD = Alzheimer’s disease; *indicate difference to controls, +
indicate difference compared to PSND; p < 0.05. ........................................................... 68
Figure 3.3. Neuronal volumes in CA1-4 and ECV. PSND = post-stroke non-demented,
PSD = delayed post-stroke dementia, VaD = vascular dementia, MD = mixed vascular
and Alzheimer’s dementia, AD = Alzheimer’s disease; *indicate difference to controls, +
indicate difference compared to PSND; Red = p < 0.05, blue = p < 0.01. ....................... 70
Figure 3.4. Neuronal volume as a percentage of control means. ................................... 71
xiv
Figure 3.5. CA2 neuronal volumes were positively correlated with total CAMCOG
scores (A) and memory sub-scores (B), with subjects with total CAMCOG score < 40
and memory score < 10 excluded. o = PSD; x = PSND. ................................................... 72
Figure 3.6 CA1 and CA2 neuronal densities (A) and volumes (B) in elderly and younger
controls. Red asterisk indicates significant difference compared to controls................ 74
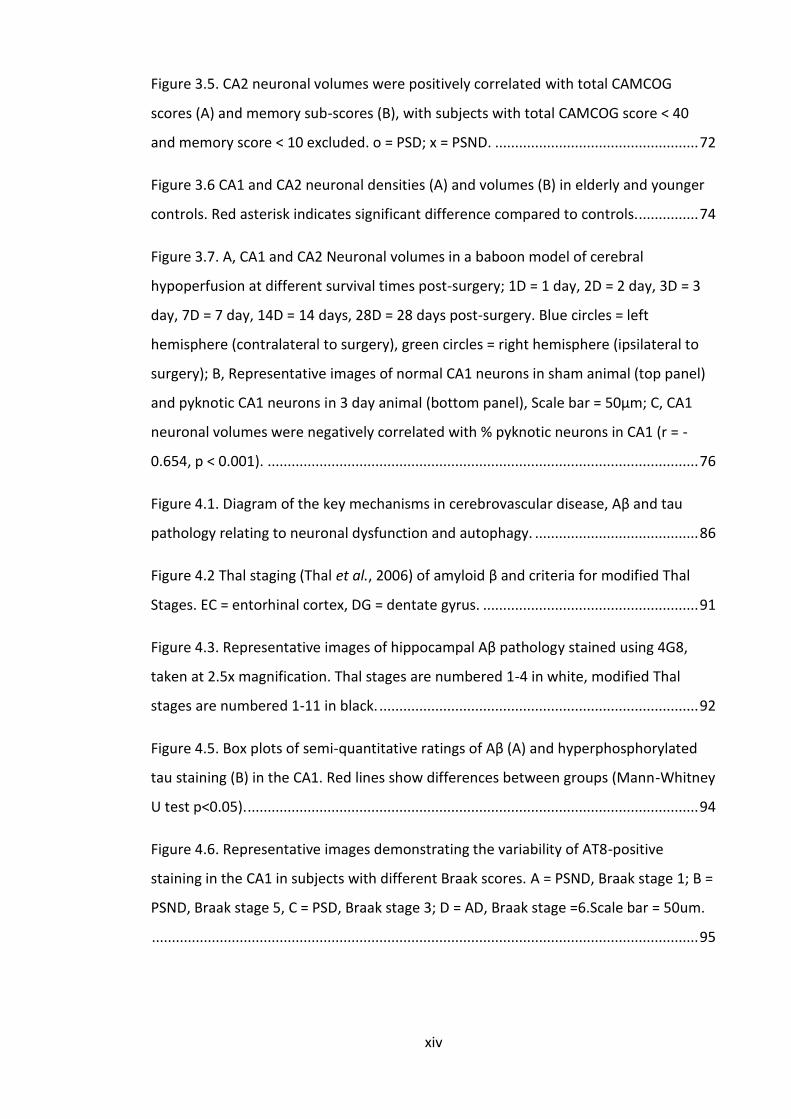
Figure 3.7. A, CA1 and CA2 Neuronal volumes in a baboon model of cerebral
hypoperfusion at different survival times post-surgery; 1D = 1 day, 2D = 2 day, 3D = 3
day, 7D = 7 day, 14D = 14 days, 28D = 28 days post-surgery. Blue circles = left
hemisphere (contralateral to surgery), green circles = right hemisphere (ipsilateral to
surgery); B, Representative images of normal CA1 neurons in sham animal (top panel)
and pyknotic CA1 neurons in 3 day animal (bottom panel), Scale bar = 50µm; C, CA1
neuronal volumes were negatively correlated with % pyknotic neurons in CA1 (r = -
0.654, p < 0.001). ............................................................................................................ 76
Figure 4.1. Diagram of the key mechanisms in cerebrovascular disease, Aβ and tau
pathology relating to neuronal dysfunction and autophagy. ......................................... 86
Figure 4.2 Thal staging (Thal et al., 2006) of amyloid β and criteria for modified Thal
Stages. EC = entorhinal cortex, DG = dentate gyrus. ...................................................... 91
Figure 4.3. Representative images of hippocampal Aβ pathology stained using 4G8,
taken at 2.5x magnification. Thal stages are numbered 1-4 in white, modified Thal
stages are numbered 1-11 in black. ................................................................................ 92
Figure 4.5. Box plots of semi-quantitative ratings of Aβ (A) and hyperphosphorylated
tau staining (B) in the CA1. Red lines show differences between groups (Mann-Whitney
U test p<0.05). ................................................................................................................. 94
Figure 4.6. Representative images demonstrating the variability of AT8-positive
staining in the CA1 in subjects with different Braak scores. A = PSND, Braak stage 1; B =
PSND, Braak stage 5, C = PSD, Braak stage 3; D = AD, Braak stage =6.Scale bar = 50um.
......................................................................................................................................... 95
xv
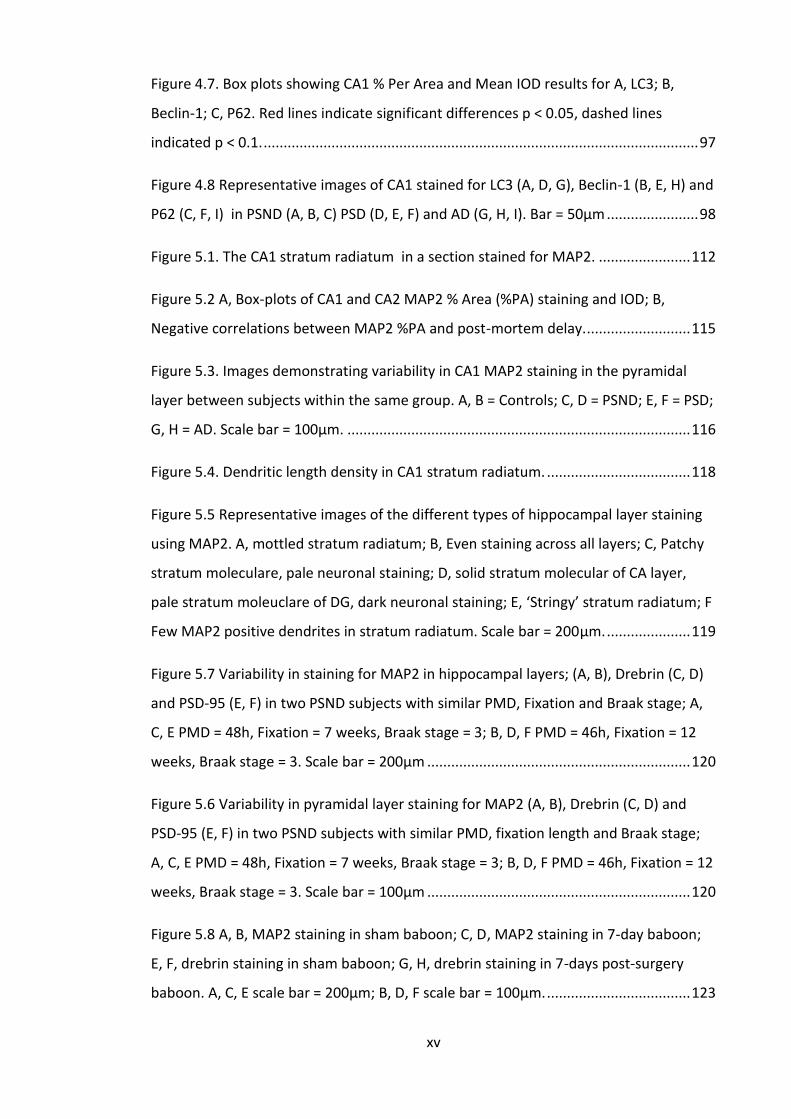
Figure 4.7. Box plots showing CA1 % Per Area and Mean IOD results for A, LC3; B,
Beclin-1; C, P62. Red lines indicate significant differences p < 0.05, dashed lines
indicated p < 0.1. ............................................................................................................. 97
Figure 4.8 Representative images of CA1 stained for LC3 (A, D, G), Beclin-1 (B, E, H) and
P62 (C, F, I) in PSND (A, B, C) PSD (D, E, F) and AD (G, H, I). Bar = 50µm ....................... 98
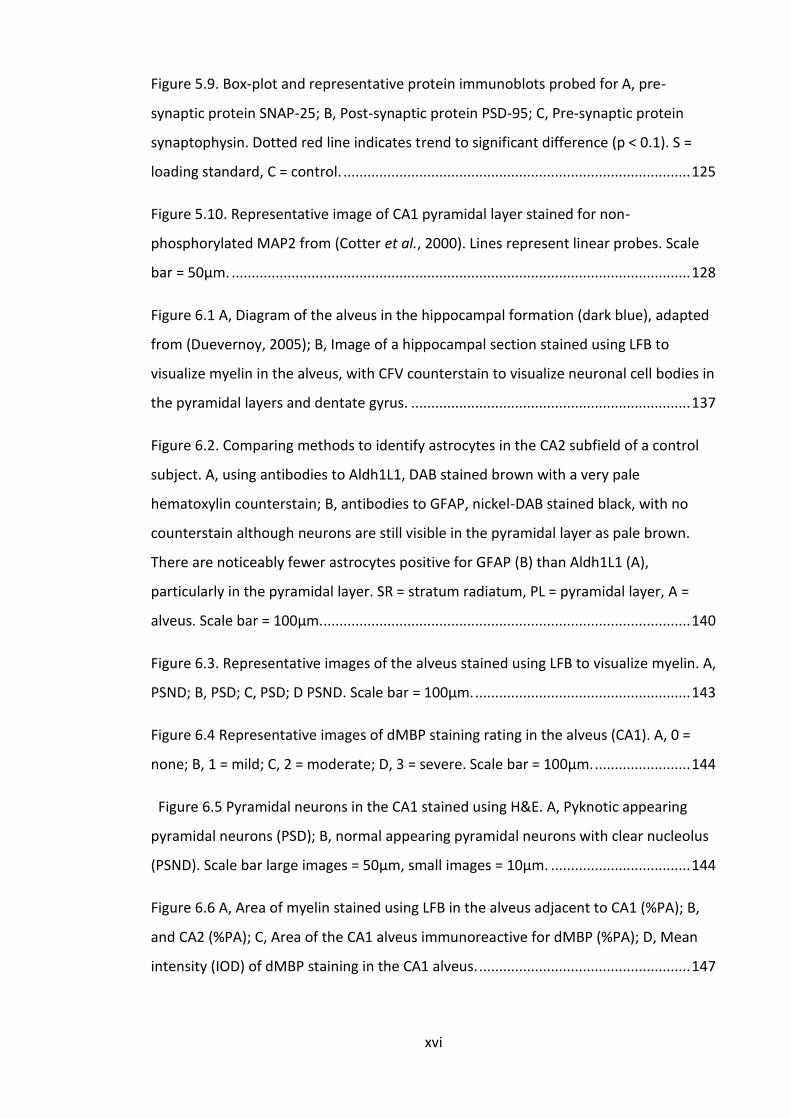
Figure 5.1. The CA1 stratum radiatum in a section stained for MAP2. ....................... 112
Figure 5.2 A, Box-plots of CA1 and CA2 MAP2 % Area (%PA) staining and IOD; B,
Negative correlations between MAP2 %PA and post-mortem delay. .......................... 115
Figure 5.3. Images demonstrating variability in CA1 MAP2 staining in the pyramidal
layer between subjects within the same group. A, B = Controls; C, D = PSND; E, F = PSD;
G, H = AD. Scale bar = 100µm. ...................................................................................... 116
Figure 5.4. Dendritic length density in CA1 stratum radiatum. .................................... 118
Figure 5.5 Representative images of the different types of hippocampal layer staining
using MAP2. A, mottled stratum radiatum; B, Even staining across all layers; C, Patchy
stratum moleculare, pale neuronal staining; D, solid stratum molecular of CA layer,
pale stratum moleuclare of DG, dark neuronal staining; E, ‘Stringy’ stratum radiatum; F
Few MAP2 positive dendrites in stratum radiatum. Scale bar = 200µm. ..................... 119
Figure 5.7 Variability in staining for MAP2 in hippocampal layers; (A, B), Drebrin (C, D)
and PSD-95 (E, F) in two PSND subjects with similar PMD, Fixation and Braak stage; A,
C, E PMD = 48h, Fixation = 7 weeks, Braak stage = 3; B, D, F PMD = 46h, Fixation = 12
weeks, Braak stage = 3. Scale bar = 200µm .................................................................. 120
Figure 5.6 Variability in pyramidal layer staining for MAP2 (A, B), Drebrin (C, D) and
PSD-95 (E, F) in two PSND subjects with similar PMD, fixation length and Braak stage;
A, C, E PMD = 48h, Fixation = 7 weeks, Braak stage = 3; B, D, F PMD = 46h, Fixation = 12
weeks, Braak stage = 3. Scale bar = 100µm .................................................................. 120
Figure 5.8 A, B, MAP2 staining in sham baboon; C, D, MAP2 staining in 7-day baboon;
E, F, drebrin staining in sham baboon; G, H, drebrin staining in 7-days post-surgery
baboon. A, C, E scale bar = 200µm; B, D, F scale bar = 100µm. .................................... 123
xvi
Figure 5.9. Box-plot and representative protein immunoblots probed for A, pre-
synaptic protein SNAP-25; B, Post-synaptic protein PSD-95; C, Pre-synaptic protein
synaptophysin. Dotted red line indicates trend to significant difference (p < 0.1). S =
loading standard, C = control. ....................................................................................... 125
Figure 5.10. Representative image of CA1 pyramidal layer stained for non-
phosphorylated MAP2 from (Cotter et al., 2000). Lines represent linear probes. Scale
bar = 50µm. ................................................................................................................... 128
Figure 6.1 A, Diagram of the alveus in the hippocampal formation (dark blue), adapted
from (Duevernoy, 2005); B, Image of a hippocampal section stained using LFB to
visualize myelin in the alveus, with CFV counterstain to visualize neuronal cell bodies in
the pyramidal layers and dentate gyrus. ...................................................................... 137
Figure 6.2. Comparing methods to identify astrocytes in the CA2 subfield of a control
subject. A, using antibodies to Aldh1L1, DAB stained brown with a very pale
hematoxylin counterstain; B, antibodies to GFAP, nickel-DAB stained black, with no
counterstain although neurons are still visible in the pyramidal layer as pale brown.
There are noticeably fewer astrocytes positive for GFAP (B) than Aldh1L1 (A),
particularly in the pyramidal layer. SR = stratum radiatum, PL = pyramidal layer, A =
alveus. Scale bar = 100µm. ............................................................................................ 140
Figure 6.3. Representative images of the alveus stained using LFB to visualize myelin. A,
PSND; B, PSD; C, PSD; D PSND. Scale bar = 100µm. ...................................................... 143
Figure 6.4 Representative images of dMBP staining rating in the alveus (CA1). A, 0 =
none; B, 1 = mild; C, 2 = moderate; D, 3 = severe. Scale bar = 100µm. ........................ 144
Figure 6.5 Pyramidal neurons in the CA1 stained using H&E. A, Pyknotic appearing
pyramidal neurons (PSD); B, normal appearing pyramidal neurons with clear nucleolus
(PSND). Scale bar large images = 50µm, small images = 10µm. ................................... 144
Figure 6.6 A, Area of myelin stained using LFB in the alveus adjacent to CA1 (%PA); B,
and CA2 (%PA); C, Area of the CA1 alveus immunoreactive for dMBP (%PA); D, Mean
intensity (IOD) of dMBP staining in the CA1 alveus. ..................................................... 147
xvii
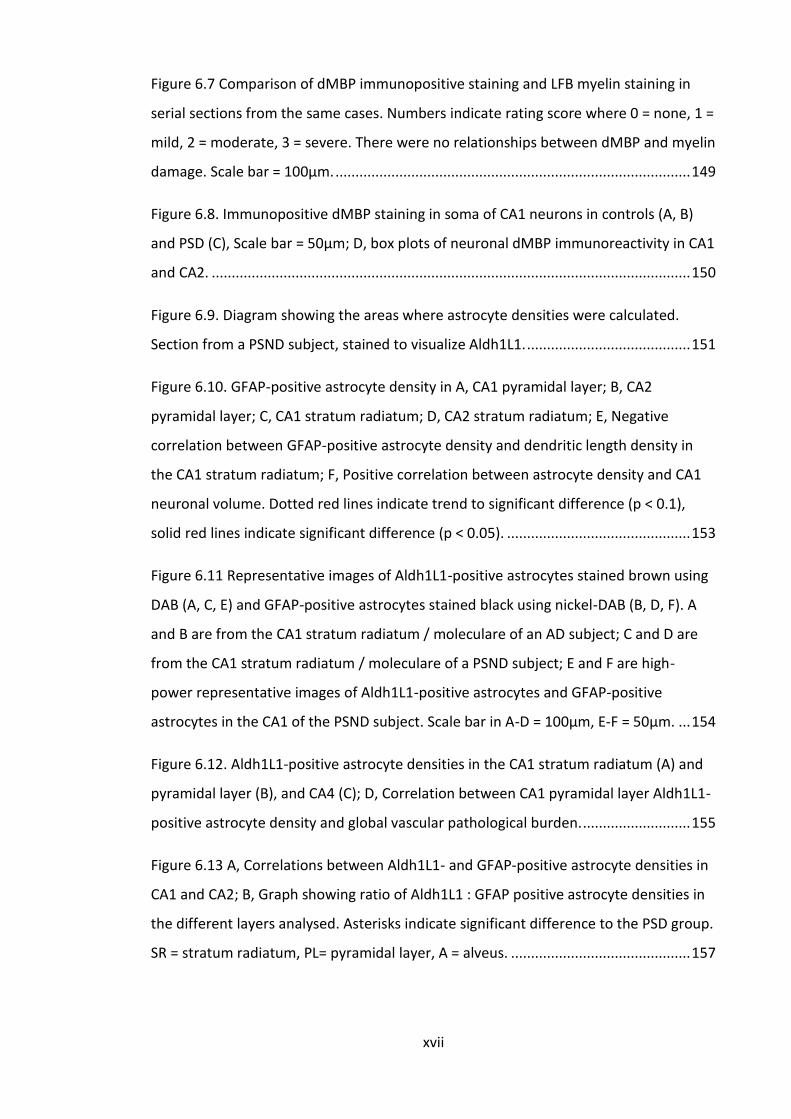
Figure 6.7 Comparison of dMBP immunopositive staining and LFB myelin staining in
serial sections from the same cases. Numbers indicate rating score where 0 = none, 1 =
mild, 2 = moderate, 3 = severe. There were no relationships between dMBP and myelin
damage. Scale bar = 100µm. ......................................................................................... 149
Figure 6.8. Immunopositive dMBP staining in soma of CA1 neurons in controls (A, B)
and PSD (C), Scale bar = 50µm; D, box plots of neuronal dMBP immunoreactivity in CA1
and CA2. ........................................................................................................................ 150
Figure 6.9. Diagram showing the areas where astrocyte densities were calculated.
Section from a PSND subject, stained to visualize Aldh1L1. ......................................... 151
Figure 6.10. GFAP-positive astrocyte density in A, CA1 pyramidal layer; B, CA2
pyramidal layer; C, CA1 stratum radiatum; D, CA2 stratum radiatum; E, Negative
correlation between GFAP-positive astrocyte density and dendritic length density in
the CA1 stratum radiatum; F, Positive correlation between astrocyte density and CA1
neuronal volume. Dotted red lines indicate trend to significant difference (p < 0.1),
solid red lines indicate significant difference (p < 0.05). .............................................. 153
Figure 6.11 Representative images of Aldh1L1-positive astrocytes stained brown using
DAB (A, C, E) and GFAP-positive astrocytes stained black using nickel-DAB (B, D, F). A
and B are from the CA1 stratum radiatum / moleculare of an AD subject; C and D are
from the CA1 stratum radiatum / moleculare of a PSND subject; E and F are high-
power representative images of Aldh1L1-positive astrocytes and GFAP-positive
astrocytes in the CA1 of the PSND subject. Scale bar in A-D = 100µm, E-F = 50µm. ... 154
Figure 6.12. Aldh1L1-positive astrocyte densities in the CA1 stratum radiatum (A) and
pyramidal layer (B), and CA4 (C); D, Correlation between CA1 pyramidal layer Aldh1L1-
positive astrocyte density and global vascular pathological burden. ........................... 155
Figure 6.13 A, Correlations between Aldh1L1- and GFAP-positive astrocyte densities in
CA1 and CA2; B, Graph showing ratio of Aldh1L1 : GFAP positive astrocyte densities in
the different layers analysed. Asterisks indicate significant difference to the PSD group.
SR = stratum radiatum, PL= pyramidal layer, A = alveus. ............................................. 157
xviii
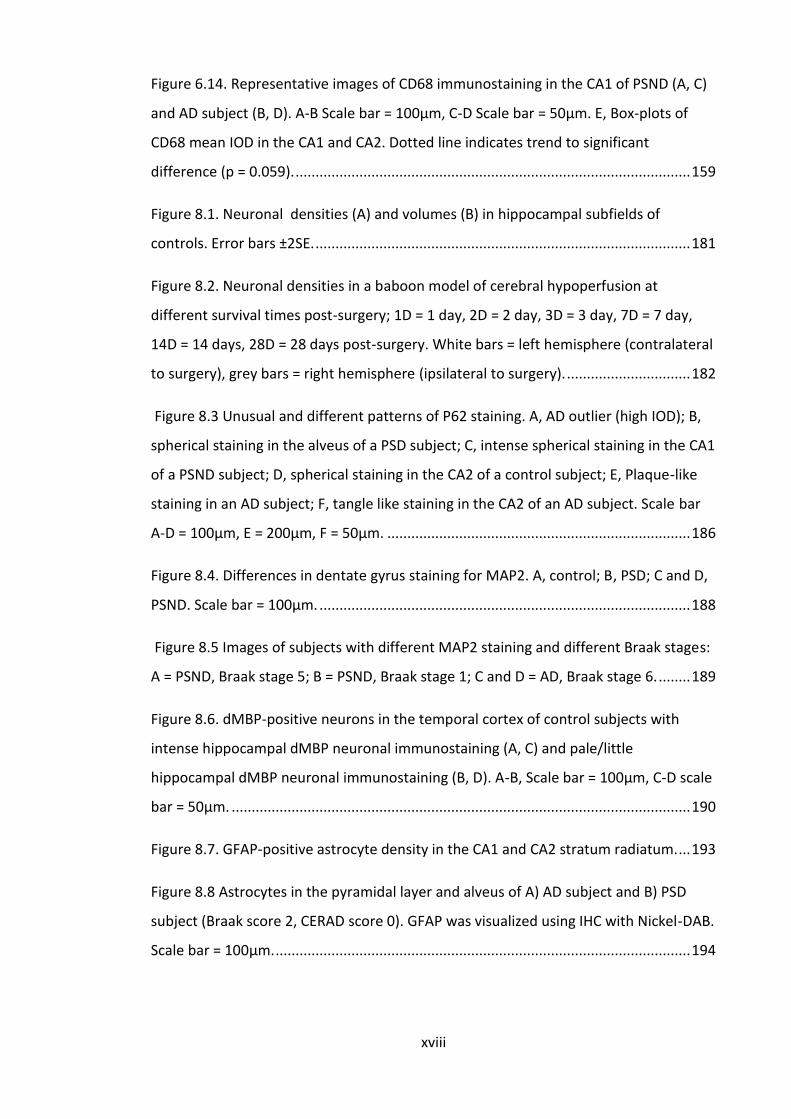
Figure 6.14. Representative images of CD68 immunostaining in the CA1 of PSND (A, C)
and AD subject (B, D). A-B Scale bar = 100µm, C-D Scale bar = 50µm. E, Box-plots of
CD68 mean IOD in the CA1 and CA2. Dotted line indicates trend to significant
difference (p = 0.059). ................................................................................................... 159
Figure 8.1. Neuronal densities (A) and volumes (B) in hippocampal subfields of
controls. Error bars ±2SE. .............................................................................................. 181
Figure 8.2. Neuronal densities in a baboon model of cerebral hypoperfusion at
different survival times post-surgery; 1D = 1 day, 2D = 2 day, 3D = 3 day, 7D = 7 day,
14D = 14 days, 28D = 28 days post-surgery. White bars = left hemisphere (contralateral
to surgery), grey bars = right hemisphere (ipsilateral to surgery). ............................... 182
Figure 8.3 Unusual and different patterns of P62 staining. A, AD outlier (high IOD); B,
spherical staining in the alveus of a PSD subject; C, intense spherical staining in the CA1
of a PSND subject; D, spherical staining in the CA2 of a control subject; E, Plaque-like
staining in an AD subject; F, tangle like staining in the CA2 of an AD subject. Scale bar
A-D = 100µm, E = 200µm, F = 50µm. ............................................................................ 186
Figure 8.4. Differences in dentate gyrus staining for MAP2. A, control; B, PSD; C and D,
PSND. Scale bar = 100µm. ............................................................................................. 188
Figure 8.5 Images of subjects with different MAP2 staining and different Braak stages:
A = PSND, Braak stage 5; B = PSND, Braak stage 1; C and D = AD, Braak stage 6. ........ 189
Figure 8.6. dMBP-positive neurons in the temporal cortex of control subjects with
intense hippocampal dMBP neuronal immunostaining (A, C) and pale/little
hippocampal dMBP neuronal immunostaining (B, D). A-B, Scale bar = 100µm, C-D scale
bar = 50µm. ................................................................................................................... 190
Figure 8.7. GFAP-positive astrocyte density in the CA1 and CA2 stratum radiatum. ... 193
Figure 8.8 Astrocytes in the pyramidal layer and alveus of A) AD subject and B) PSD
subject (Braak score 2, CERAD score 0). GFAP was visualized using IHC with Nickel-DAB.
Scale bar = 100µm. ........................................................................................................ 194
xix
Table 1.1 Comparison of the development and distribution of Amyloid-β and tau
pathology in AD. * = from (Thal et al., 2002), ** = from (Braak and Braak, 1991). ......... 8
Table 1.2. Common risk factors for AD and VaD (de la Torre, 2002). ............................. 12
Table 1.3 Summary of clinical assessments performed in the CogFAST study. CAMCOG
= cognitive part of the Cambridge Examination for Mental Disorders of the elderly
(CAMDEX) (de Koning et al., 1998); DSM = Diagnostic and Statistical Manual of mental
disorders ; CDR = Clinical Dementia Rating; Barthel ADL = Index to measure
performance in activities of daily living. ......................................................................... 14
Table 2.1. Subject demographics of all stroke subjects analysed. PSND = post-stroke
non-demented, PSD = delayed post stroke dementia; PMD = post-mortem delay. ...... 40
Table 2.2. Subject demographics of all subjects analysed. VaD = Vascular dementia, MD
= mixed vascular dementia and Alzheimer’s disease, AD = Alzheimer’s disease; PMD =
post-mortem delay.......................................................................................................... 41
Table 2.3. List of antibodies and methods used for immunohistochemistry. MAb =
monoclonal antibody; PAb = polyclonal antibody; F = formic acid antigen retrieval; M =
microwave antigen retrieval; P = pressure cooker antigen retrieval method; NHS =
normal horse serum; NGS = normal goat serum. ........................................................... 47
Table 2.4 Location and numbers of images and grid squares in which astrocyte counts
were performed. ............................................................................................................. 50
Table 2.5. Protocol for making two 20 x 10cm acrylamide gels. .................................... 57
Table 2.6. List of antibodies and concentrations used for protein immunoblots. Blots
were incubated with primary antibodies at 4C overnight. ............................................. 59
Table 3.1 Subject demographics. PSND = post-stroke non-demented, PSD = delayed
post-stroke dementia, VaD = vascular dementia, MD = mixed vascular and Alzheimer’s
dementia, AD = Alzheimer’s disease, PMD = post mortem delay, N/A = information not
available for the majority of control subjects. ................................................................ 66
xx
Table 3.2. Correlations between CA neuronal volumes and CAMCOG scores and sub-
scores. Ns = not significant. When correlations were corrected for multiple
comparisons (20 tests), the cut-off for significance was reduced to p < 0.0025. ........... 73
Table 3.3. Subject demographics in elderly vs. younger controls. ................................. 73
Table 4.1 Demographics of subjects studied for Aβ and tau pathology. Slightly fewer
subjects were analysed for tau pathology (Controls n = 10, PSND n = 19, PSD n = 10,
VaD n = 13, MD n = 13, AD n = 11). ................................................................................. 93
Table 4.2. Correlations between different methods used to rate Alzheimer type
pathology. Pale blue indicates p < 0.05, dark blue indicates p < 0.01. ........................... 94
Table 4.3 Demographics of subjects investigated using LC3 and Beclin-1. .................... 96
Table 4.4. Demographics of subjects investigated using P62. ........................................ 96
Table 4.5. Correlations between LC3, Beclin-1 and P62 image analysis results. Light grey
highlights correlations significant at p < 0.05. Dark grey highlight correlations that
remained significant after correcting for multiple testing (p < 0.00074). ...................... 99
Table 5.1 Demographics of subjects analysed with 2D Image Pro analysis of MAP2
immunostaining. ........................................................................................................... 114
Table 5.2. Demographics of subjects studied using 3D stereology to quantify dendritic
length-density. .............................................................................................................. 117
Table 5.3. Demographics of subjects analysed for synaptic proteins in frozen
hippocampal tissue. ...................................................................................................... 124
Table 6.1 Demographics of groups analysed for LFB, dMBP and pyknosis rating studies.
....................................................................................................................................... 146
Table 6.2 Correlations between dMBP staining in the alveus and neuronal soma
(pyramidal layer). Dark blue highlights correlations p < 0.01, mid blue highlights p <
0.05, pale blue highlights trends to correlations p < 0.1. ............................................. 148
Table 6.3. Group demographics of subjects analysed using astrocyte counts. ............ 151
xxi
Table 6.4. Group demographics of subjects analysed using CD68 to visualise activated
microglia. ....................................................................................................................... 158
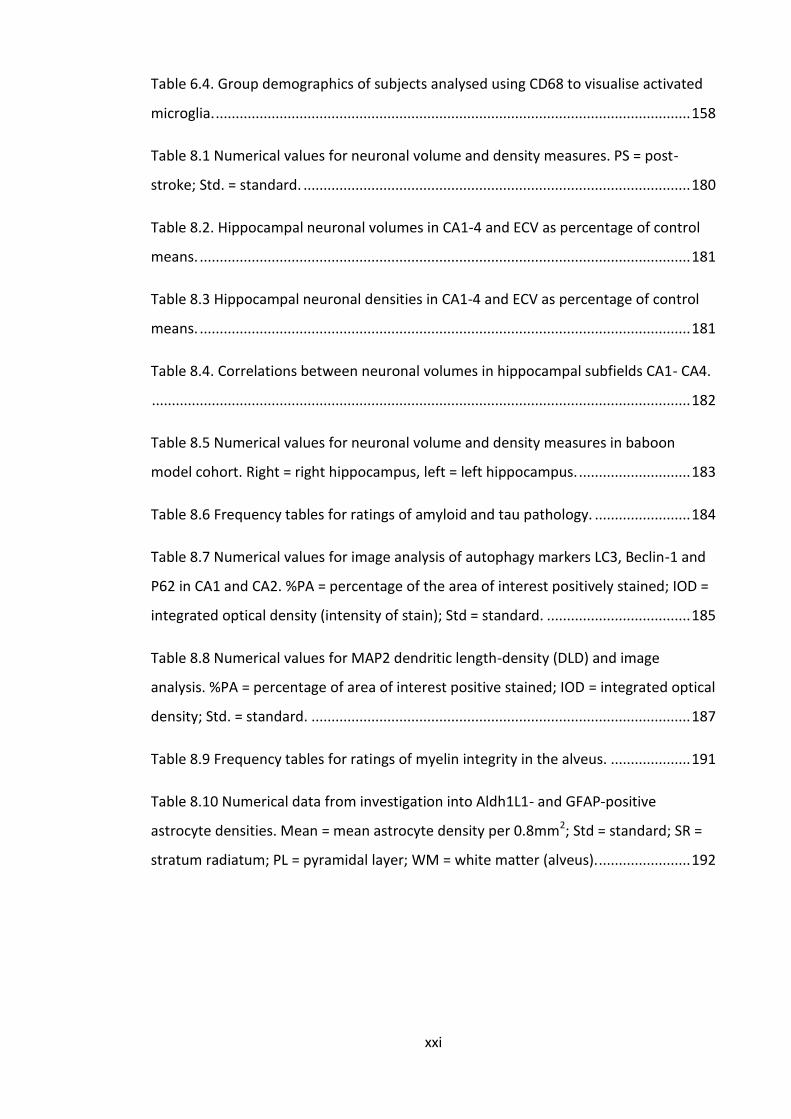
Table 8.1 Numerical values for neuronal volume and density measures. PS = post-
stroke; Std. = standard. ................................................................................................. 180
Table 8.2. Hippocampal neuronal volumes in CA1-4 and ECV as percentage of control
means. ........................................................................................................................... 181
Table 8.3 Hippocampal neuronal densities in CA1-4 and ECV as percentage of control
means. ........................................................................................................................... 181
Table 8.4. Correlations between neuronal volumes in hippocampal subfields CA1- CA4.
....................................................................................................................................... 182
Table 8.5 Numerical values for neuronal volume and density measures in baboon
model cohort. Right = right hippocampus, left = left hippocampus. ............................ 183
Table 8.6 Frequency tables for ratings of amyloid and tau pathology. ........................ 184
Table 8.7 Numerical values for image analysis of autophagy markers LC3, Beclin-1 and
P62 in CA1 and CA2. %PA = percentage of the area of interest positively stained; IOD =
integrated optical density (intensity of stain); Std = standard. .................................... 185
Table 8.8 Numerical values for MAP2 dendritic length-density (DLD) and image
analysis. %PA = percentage of area of interest positive stained; IOD = integrated optical
density; Std. = standard. ............................................................................................... 187
Table 8.9 Frequency tables for ratings of myelin integrity in the alveus. .................... 191
Table 8.10 Numerical data from investigation into Aldh1L1- and GFAP-positive
astrocyte densities. Mean = mean astrocyte density per 0.8mm2; Std = standard; SR =
stratum radiatum; PL = pyramidal layer; WM = white matter (alveus). ....................... 192
xxii
Abbreviations
2D Two-dimensional
2-VO Two vessel occlusion
3D Three-dimensional
3-VO Three vessel occlusion
AD Alzheimer’s disease
APES Aminopropyltriethoxysilane
APP Amyloid precursor protein
AV Autophagic vacuole
Aβ Amyloid-β
BSA Bovine serum albumin
CA1-4 Cornu Ammonis 1-4
CAA Cerebral amyloid angiopathy
CAMCOG Cambridge Examination for Mental Disorders in the Elderly
CERAD Consortium to Establish a Registry for Alzheimer’s Disease
CFV Cresyl fast violet
CogFAST Cognitive Function After Stroke
CT Computed Tomography
CVD Cerebrovascular disease
DAB 3,3′-Diaminobenzidine
DC Detergent compatible
DG Dentate gyrus
DLB Dementia with Lewy Bodies
dMBP Degraded myelin basic protein
DSM Diagnostic and Statistical Manual of Mental Disorders
DTI Diffusion tensor imaging
DTT Dithiothreitol
EC Entorhinal cortex
ECV Entorhinal cortex layer V
GABA γ-Aminobutyric acid
GFAP Glial fibrillary acidic protein
H&E Haematoxylin and eosin
IHC Immunohistochemistry
IOD Integrated optical density
LFB Luxol fast blue
MCAO Middle cerebral artery occlusion
MCI Mild cognitive impairment
MD Mixed dementia
MRI Magnetic resonance imaging
MTL Medial temporal lobe
NBTR Newcastle Brain Tissue Resource
xxiii
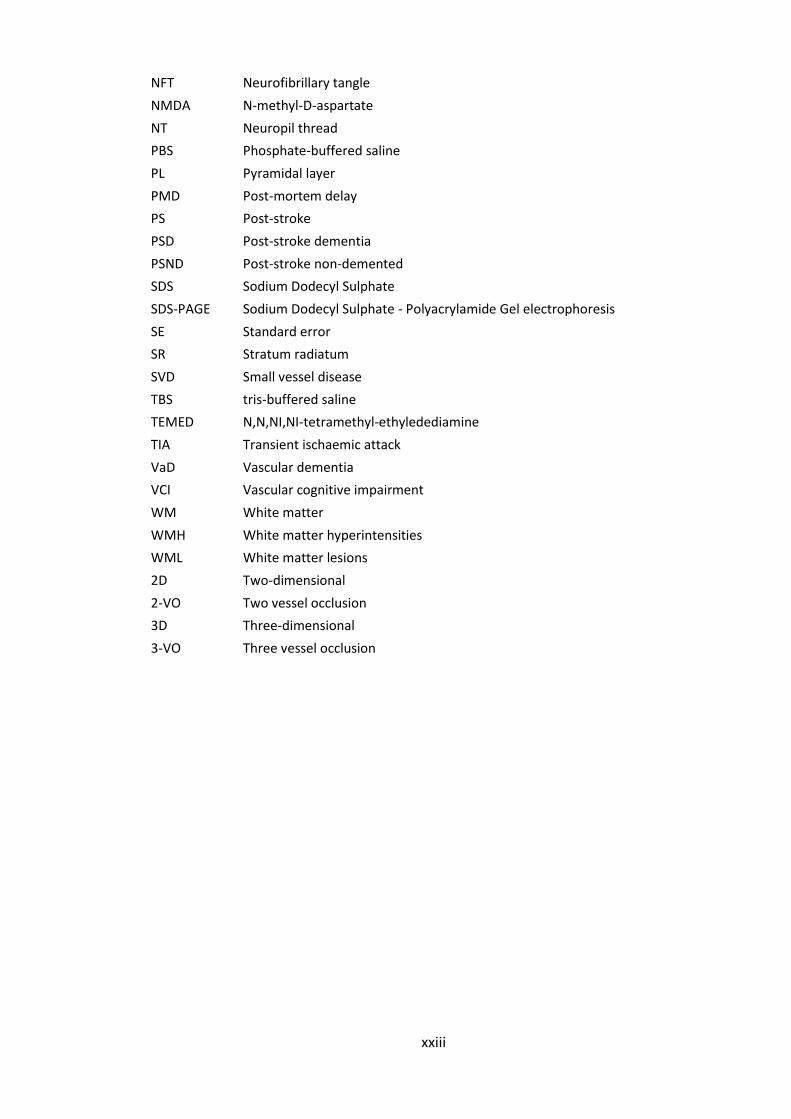
NFT Neurofibrillary tangle
NMDA N-methyl-D-aspartate
NT Neuropil thread
PBS Phosphate-buffered saline
PL Pyramidal layer
PMD Post-mortem delay
PS Post-stroke
PSD Post-stroke dementia
PSND Post-stroke non-demented
SDS Sodium Dodecyl Sulphate
SDS-PAGE Sodium Dodecyl Sulphate - Polyacrylamide Gel electrophoresis
SE Standard error
SR Stratum radiatum
SVD Small vessel disease
TBS tris-buffered saline
TEMED N,N,NI,NI-tetramethyl-ethyledediamine
TIA Transient ischaemic attack
VaD Vascular dementia
VCI Vascular cognitive impairment
WM White matter
WMH White matter hyperintensities
WML White matter lesions
2D Two-dimensional
2-VO Two vessel occlusion
3D Three-dimensional
3-VO Three vessel occlusion
xxiv
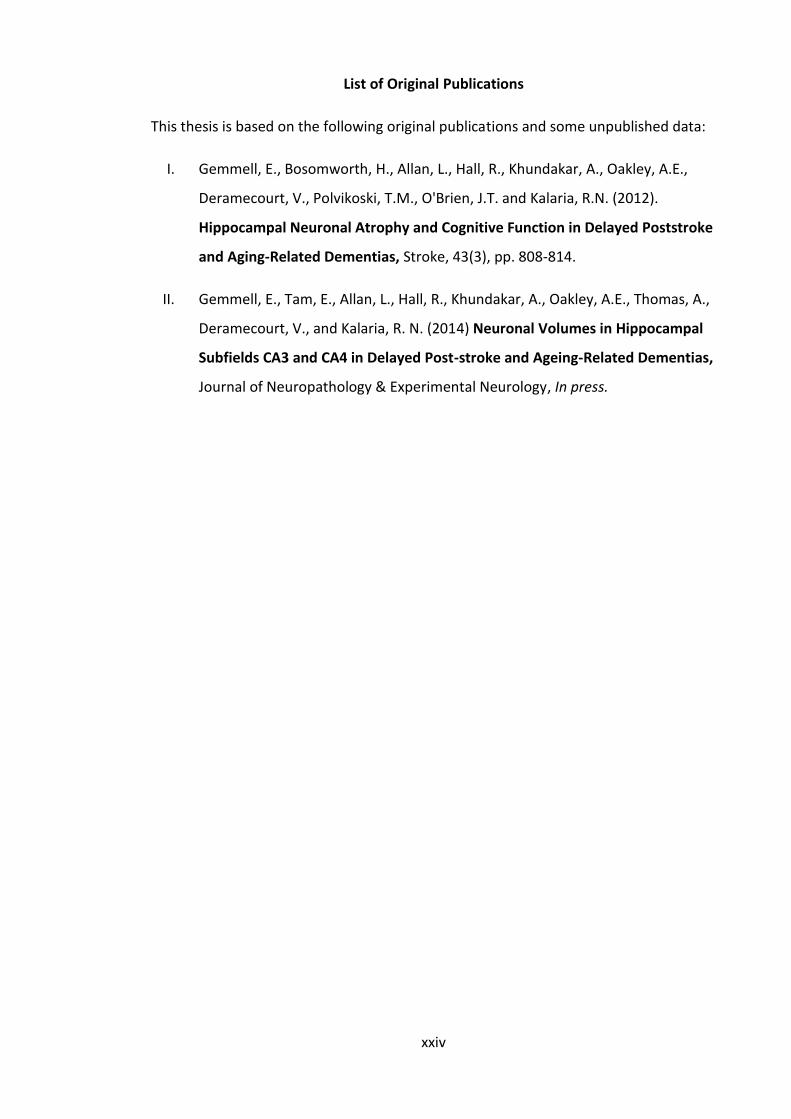
List of Original Publications
This thesis is based on the following original publications and some unpublished data:
I. Gemmell, E., Bosomworth, H., Allan, L., Hall, R., Khundakar, A., Oakley, A.E.,
Deramecourt, V., Polvikoski, T.M., O'Brien, J.T. and Kalaria, R.N. (2012).
Hippocampal Neuronal Atrophy and Cognitive Function in Delayed Poststroke
and Aging-Related Dementias, Stroke, 43(3), pp. 808-814.
II. Gemmell, E., Tam, E., Allan, L., Hall, R., Khundakar, A., Oakley, A.E., Thomas, A.,
Deramecourt, V., and Kalaria, R. N. (2014) Neuronal Volumes in Hippocampal
Subfields CA3 and CA4 in Delayed Post-stroke and Ageing-Related Dementias,
Journal of Neuropathology & Experimental Neurology, In press.
1
Chapter 1. Introduction
1.1 Ageing, stroke and dementia
The incidence of stroke and dementia increase exponentially with age, which has
profound implications for the global ageing population (Burton et al., 2004;
Pendelbury, 2009). It is predicted that one fifth of the world’s population will be over
60 years old by 2050, and 115 million people will have dementia (Luengo-Fernandez et
al., 2010; Prince et al., 2013). Ageing and stroke are the first and second greatest risk
factors for dementia, and one third of people will suffer from stroke and/or dementia
during their lifetime (Gorelick and Nyenhuis, 2013).
In the UK, 30% of people over 80 years old have dementia, and as many again are
affected by cognitive impairment not meeting the criteria for dementia diagnosis
(O'Brien et al., 2003). As the number of elderly people in the UK continues to rise over
the next 20 years, the number of people affected is predicted to increase by a further
40%. Stroke prevalence in over 75-year-olds is also increasing; from 9% in 1994 to 13%
in 2006 (Stroke Statistics 2009, 2009). Although improvements in healthcare and
intervention strategies have succeeded in reducing mortality after stroke, this has
been associated with a simultaneous increase in post-stroke dementia diagnoses, as
more elderly people survive to become at higher risk of developing dementia
(Ukraintseva et al., 2006).
Dementia can have a devastating impact on patients and their families, and the
growing prevalence of dementia also puts a significant strain on the economy and
healthcare system(Luengo-Fernandez et al., 2010). It is therefore becoming
increasingly critical that effective therapies and preventative strategies are developed
to reduce the risk of dementia. With this in mind, this study aimed to further current
understanding of the causes of dementia in elderly stroke survivors.
1.1.1 Post-stroke dementia
Dementia is a clinical syndrome characterised by progressive decline in memory and at
least one other cognitive domain, severe enough to interfere with performing the
2
tasks of daily life (Americal Psychiatric Association: Diagnostic and Statistical Manual of
Mental Disorders, Fourth Edition, 2000). Age-related dementia is commonly caused by
neurodegenerative diseases which develop within brain cells, and cerebrovascular
disease which causes brain injury by restricting blood supply to brain cells. The most
common cause of dementia is Alzheimer’s disease, a neurodegenerative disease which
accounts for around 60% of all dementia cases (Luengo-Fernandez et al., 2010).
Vascular dementia (VaD) is caused by cerebrovascular disease (CVD) and is generally
considered to be the second most common form of dementia accounting for at least
30% of dementia cases (Román, 2002a). Strokes are caused by CVD, therefore post-
stroke dementia is considered a type of VaD. Recently, the term vascular cognitive
impairment (VCI) has also been introduced to encompass all types of cognitive
dysfunction attributed to CVD (O'Brien et al., 2003). VaD is commonly used for
research purposes to describe a more extreme form of VCI (Grysiewicz and Gorelick,
2012). Additionally the term VCI-no dementia can be used to describe less severe
cognitive impairment caused by CVD (Moorhouse and Rockwood, 2008).
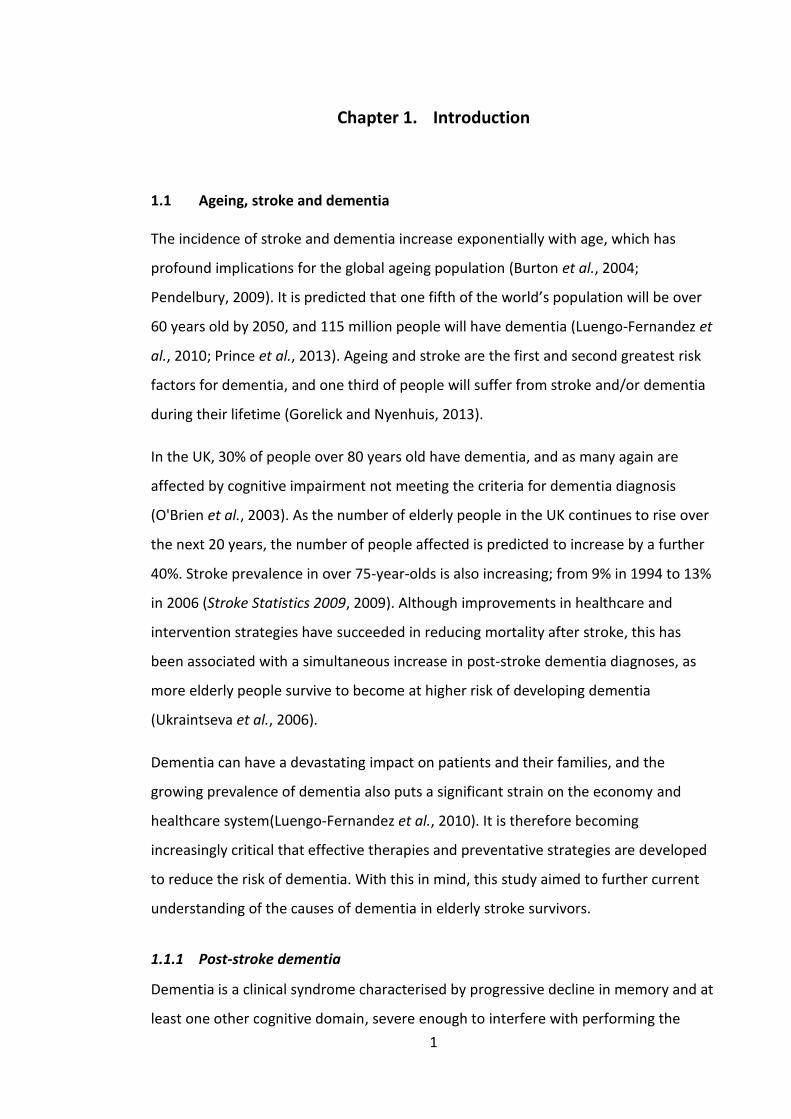
Figure 1.1 Common causes of dementia in the elderly. The three most common dementias caused by neurodegenerative diseases are Alzheimer’s disease, Dementia with Lewy Bodies (DLB), and Frontotemporal dementia (FTD). Dementia caused by CVD is known as VaD, which encompasses numerous subtypes based on type of lesion and vessel affected (O'Brien et al., 2003).
In addition to these common causes of dementia, rarer diseases and syndromes can
also result in dementia and dementia-like symptoms. Parkinson’s disease dementia
(PDD) accounts for 2% of dementia cases in the UK, and is strongly associated with
3
older age, with a study finding the prevalence of dementia in Parkinson’s patients over
80 years old to be 69% (compared to 0% in patients under 50 years)(Mayeux et al.,
1992). PDD develops secondary to the motor symptoms, and is related to Lewy body
disease resulting in dementia that is very similar to DLB (Apaydin et al., 2002). Other
conditions linked to dementia in the elderly include rare hereditary neurodegenerative
diseases (e.g. Huntington’s disease) and cerebrovascular diseases (e.g. CADASIL
[Cerebral Autosomal-Dominant Arteriopathy with Subcortical Infarcts and
Leukoencephalopathy], the most common hereditary stroke disorder), infection with
HIV (human immunodeficiency virus, which can cause neurocognitive impairment and
dementia) or prion protein (Creutzfeld-Jakob disease), multiple sclerosis and
corticobasal degeneration. Additionally, dementia-like symptoms may have treatable
reversible causes such as metabolic dysfunction (e.g. hypothyroidism), nutritional
disorders (e.g. vitamin B-6 or B-12 deficiencies), dehydration, brain infections (e.g.
meningitis or untreated syphilis), and normal pressure hydrocephalus. However, these
rarer causes of dementia account for only 5% of the dementia cases in the UK
('Factsheet: Rarer Causes of Dementia,' 2012), and were not investigated in this thesis.
1.2 Causes of delayed post-stroke dementia
Ischaemic strokes account for 90% of all strokes, and occur when an artery in the brain
is occluded, restricting the supply of oxygen and nutrients to a region of the brain.1 The
clinical presentation of stroke depends on the size and location of the blood vessel and
area of the brain affected. Studies have shown that around 25% of stroke survivors
develop dementia within the first 3 months post-stroke (Barba et al., 2000; Desmond
et al., 2000), indicating that the stroke damaged a large area of the brain critical for
cognitive function. It is unclear why the risk of dementia remains substantially higher
in non-demented stroke survivors compared to stroke-free controls, as few studies
have followed stroke survivors beyond two years post-stroke, and even fewer have
investigated pathological mechanisms in elderly stroke survivors (Kokmen et al., 1996;
Allan et al., 2011).
1 Haemorrhagic strokes are the second most common cause of stroke, and occur when a major artery in
the brain is ruptured. This study focussed on the cause of dementia after ischaemic strokes.
4
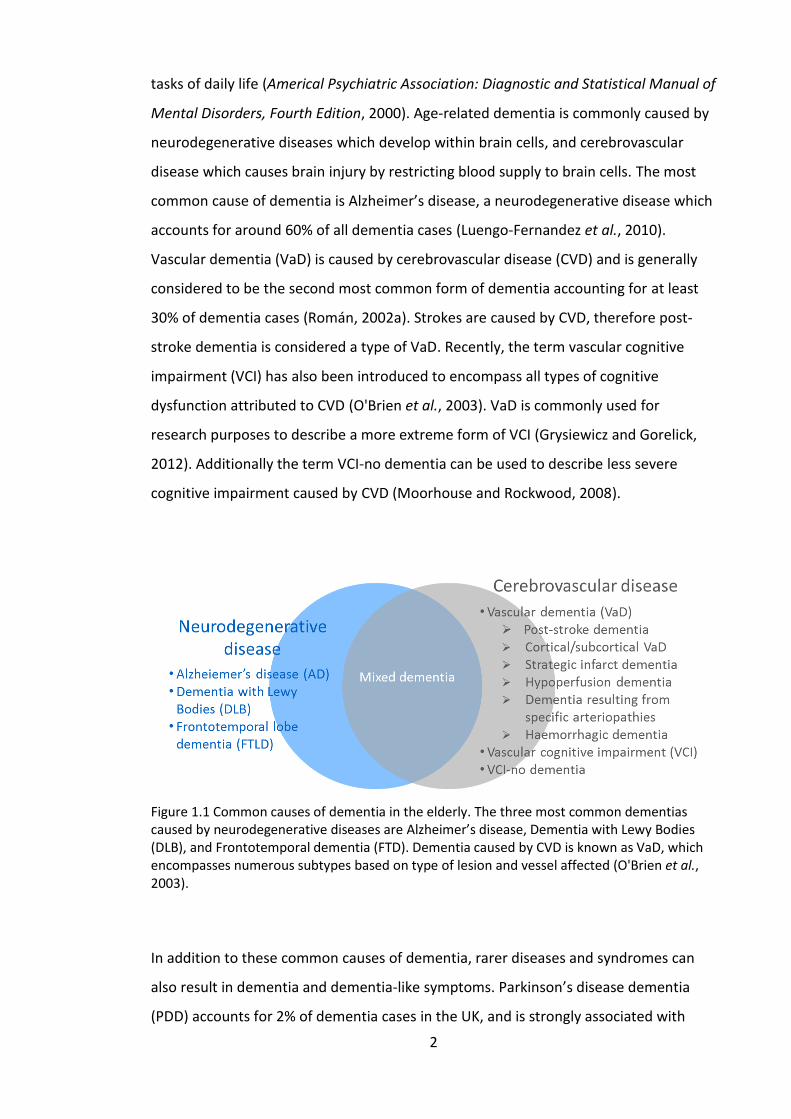
Dementia which develops several months to years after a stroke is commonly
described as delayed post-stroke dementia (PSD), and may involve both CVD and
neurodegenerative disease (Figure 1.1). Reports of the cumulative incidence of
delayed PSD developing more than one year post-stroke have ranged from 7.4% in
population-based studies of first ever stroke, to 41% when pre-stroke dementia was
included (Pendlebury and Rothwell, 2009; Allan et al., 2011). Age, multiple vascular
lesions, the characteristics of the first stroke, and presence of several risk factors are
strongly associated with long-term risk of dementia post-stroke (Altieri et al., 2004;
Allan et al., 2011), however, the precise mechanisms accelerating cognitive decline are
unclear. Greater understanding of these mechanisms is needed for the prevention and
management of delayed PSD.
Figure 1.1 Progression of delayed post-stroke dementia over time. TIA = transient ischaemic attack, NFT = neurofibrillary tangle, CAA = cerebral amyloid angiopathy.
1.2.1 Cerebrovascular disease (CVD)
Cerebrovascular disease (CVD) can cause vascular dementia through single strategic
infarcts (post-stroke dementia), multiple infarcts (multi-infarct dementia), and the
accumulation of multiple smaller lacunes and hypoperfusive lesions. Hypoperfusion
and infarction damages neurons and glia as they do not receive the oxygen and trophic
factors required for normal functioning (Zlokovic, 2011). As neurons are the
fundamental unit of information processing, loss or damage to neurons and neuronal
5
connections results in impaired cognition. The subtype of CVD, total volume of
cerebral infarction and functional tissue loss, and location of the lesions are considered
to be the major determinants of dementia in CVD (Leys et al., 1999).
Cerebrovascular lesions may be categorised as large or atherothrombolic and small-
vessel events. Large-vessel events involving the carotid arteries and circle of Willis
restrict blood flow to larger areas of the brain resulting in a greater volume of
functional tissue loss, and are generally associated with high mortality, morbidity and
severe cognitive and/or physical impairment. Cognitive impairment may result from
single strategic infarcts, where an infarct damages functionally critical areas of the
brain. Strategic areas commonly affected include: the angular gyrus, thalamus, basal
forebrain, bilateral involvement of the basal ganglia and thalamus, posterior cerebral
artery territories including the ventral-medial temporal lobe, hippocampus, occipital
structures and thalamus, and anterior cerebral artery territories (Román, 2002b).
Strokes which destroy greater than 50 – 100ml of tissue (Tomlinson et al., 1970), or
result in large peri-lesional incomplete ischaemic areas involving white matter, and
large periventricular white matter ischaemic lesions are also considered major risk
factors for PSD (Román, 2002b).
Changes in smaller arteries and temporary occlusions causing transient ischaemic
attacks (TIAs) are associated with stepwise or insidious cognitive decline. Pathological
changes to small vessels are assumed to cause stenosis and occlusions leading to
chronic hypoperfusion and infarction of the surrounding brain tissue (Kalaria et al.,
2004). The build-up of small lesions progressively damages increasing volumes of brain
tissue to cause insidious cognitive decline to VaD. Subcortical lacunar infarctions
caused by small vessel disease (SVD) may also cause stroke-like clinical symptoms
when they develop in strategic locations (Bailey et al., 2012).
It is widely accepted that CVD causes a spectrum of changes in the brain that can be
viewed on MRI as white matter hyperintensities (WMH) (Kalaria and Ihara, 2013).
However, WM degeneration may also be caused by primary axonal degeneration
occurring as a result of neuron loss or damage in the grey matter (Capizzano et al.,
2004). Imaging studies have demonstrated that WM changes tend to occur in fibres
within the frontal lobes (Tullberg et al., 2004) and disrupt the frontal cortical-
6
subcortical circuits that underlie executive functions. The frontal lobe is more
vulnerable to WM changes than the temporal lobe (Tullberg et al., 2004), which fits
with current understanding of the relationship between frontal lobe changes and
impairments in attention and executive functions that are frequently observed in
patients with VaD.
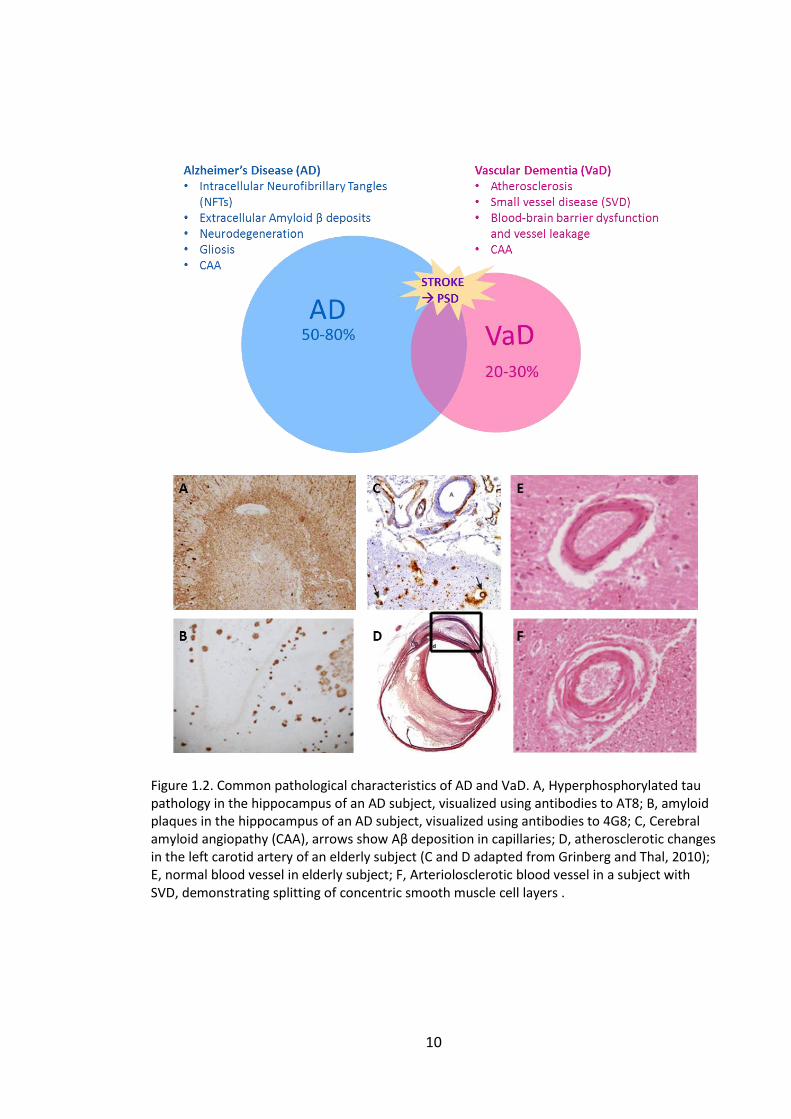
CVD causes vessel changes through three main disease mechanisms; atherosclerosis,
small vessel disease, and cerebral amyloid angiopathy (Grinberg and Thal, 2010).
Atherosclerosis is a degenerative vessel disorder caused by the accumulation of blood-
borne lipids such as cholesterol in vessel walls. Atherosclerotic plaques, which
commonly develop in medium to large arteries, can cause cerebral thrombosis due to
narrowing of the blood vessel lumen, or rupture and cause vessel occlusion or an
embolism occluding a smaller artery (Grinberg and Thal, 2010). Thromboembolic
events are generally considered to cause up to 50% of all ischaemic strokes (Ferrer et
al., 2008), and the occlusion of internal carotid arteries and those of the circle of Willis
are thought to explain ≤15% of VaD (Kalaria, 2012).
Cerebral small vessel disease (SVD) describes disease processes which impair blood
flow in small perforating cerebral arterioles, capillaries and venules. Pathological small
vessel wall alterations in SVD include arteriosclerosis (thickening and hardening of
vessel walls), lipohyalinosis (wall thickening and lumen narrowing), fibrinoid necrosis
(fibrin plugs in vessel lumen and walls) and perivascular tissue changes caused by
blood-brain barrier dysfunction (leakage of toxic substances and metabolites out of the
vessels)(Wardlaw et al., 2003). SVD lesions such as lacunar infarcts (<20mm diameter),
lacunes (3 -15mm fluid-filled cavities in the basal ganglia or white matter),
microbleeds, and white matter hyperintensities (indicative of demyelination or dilated
perivascular spaces) are visible using neuroimaging and post-mortem
histopathological techniques (Wardlaw, 2008; Pantoni, 2010; Wardlaw et al., 2013).
Cerebral amyloid angiopathy (CAA) is characterized by deposits of amyloid-β protein
(Aβ) protein in vessel walls and is a common feature of ageing and AD (Grinberg and
Thal, 2010). CAA is believed to be caused by disrupted clearance of Aβ through the
perivascular space, resulting in the build-up of Aβ near the basement membrane
(Weller et al., 2009). Capillary CAA can occlude or disrupt blood flow and result in
7
infarctions or hypoperfusion, and can damage blood vessel walls causing
haemorrhages (Grinberg and Thal, 2010).
The relationship between the size, type and location of cerebrovascular lesions and
cognitive dysfunction are not well understood. Until recently, the prevalence of VaD
was often underestimated as dementia diagnosis criteria was biased towards AD,
emphasizing memory impairment as an essential symptom (Román, 2002a), although
memory impairments tend to develop later in VaD (Desmond et al., 1999). The high
specificity and low sensitivity for diagnosis of VaD therefore meant that many VaD
subjects were misdiagnosed with other forms of dementia (Wetterling et al., 1996).
This directed the focus of dementia research on AD, leaving the role of vascular lesions
in dementia comparatively understudied. In addition, the frequent co-occurrence of
AD with vascular pathology meant that AD was interpreted as being the primary cause
of dementia while the role of CVD was overlooked. Although these issues are now
being addressed, there are currently no standardized neuropathological criteria to
quantify vascular lesions. This has resulted in differing procedures for pathological
examination of VaD being used in different laboratories, making comparison between
studies difficult (Jellinger, 2007). Furthermore, there are no set criteria for a
pathological diagnosis of VaD, which has hindered the understanding of the
relationships between vascular lesion burden and cognitive impairment.
1.2.2 Alzheimer’s disease (AD)
Between 19-61% of stroke survivors who develop PSD also have a high burden of
Alzheimer’s disease (AD) pathology (Leys et al., 2005), which implicates AD in the
pathogenesis of delayed PSD. AD is clinically characterized by impairment in short-
term and spatial memory, which becomes more severe as the disease progresses and
other cognitive domains become impaired. The pathological hallmarks of AD are
amyloid-β (Aβ) plaques, neurofibrillary tangles (NFTs), neuropil threads (NTs), and
neuritic plaques. AD is also associated with neuronal and synaptic loss, CAA and gliosis
(Attems and Jellinger, 2012).
One of the characteristic features of AD are cortical Aβ plaques, which are large
insoluble extracellular aggregates of Aβ peptides, formed by the cleavage of the
transmembrane amyloid precursor protein (APP) by β and γ secretases into Aβ40 and
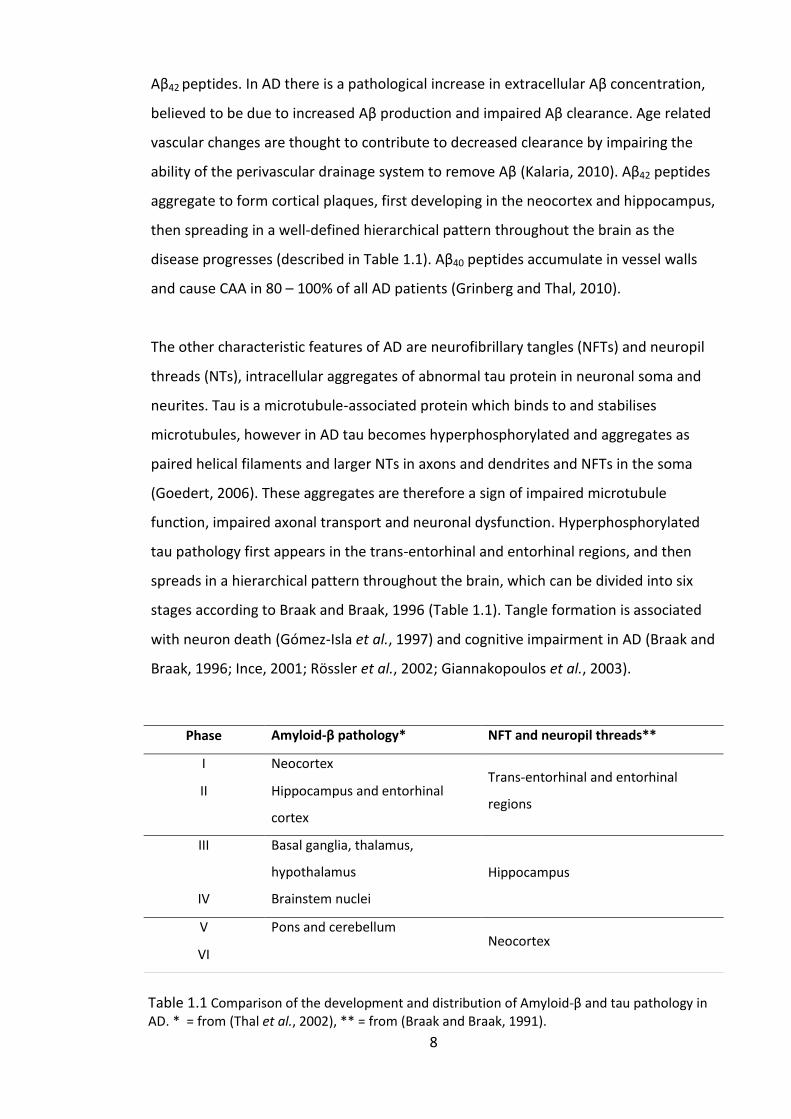
8
Aβ42 peptides. In AD there is a pathological increase in extracellular Aβ concentration,
believed to be due to increased Aβ production and impaired Aβ clearance. Age related
vascular changes are thought to contribute to decreased clearance by impairing the
ability of the perivascular drainage system to remove Aβ (Kalaria, 2010). Aβ42 peptides
aggregate to form cortical plaques, first developing in the neocortex and hippocampus,
then spreading in a well-defined hierarchical pattern throughout the brain as the
disease progresses (described in Table 1.1). Aβ40 peptides accumulate in vessel walls
and cause CAA in 80 – 100% of all AD patients (Grinberg and Thal, 2010).
The other characteristic features of AD are neurofibrillary tangles (NFTs) and neuropil
threads (NTs), intracellular aggregates of abnormal tau protein in neuronal soma and
neurites. Tau is a microtubule-associated protein which binds to and stabilises
microtubules, however in AD tau becomes hyperphosphorylated and aggregates as
paired helical filaments and larger NTs in axons and dendrites and NFTs in the soma
(Goedert, 2006). These aggregates are therefore a sign of impaired microtubule
function, impaired axonal transport and neuronal dysfunction. Hyperphosphorylated
tau pathology first appears in the trans-entorhinal and entorhinal regions, and then
spreads in a hierarchical pattern throughout the brain, which can be divided into six
stages according to Braak and Braak, 1996 (Table 1.1). Tangle formation is associated
with neuron death (Gómez-Isla et al., 1997) and cognitive impairment in AD (Braak and
Braak, 1996; Ince, 2001; Rössler et al., 2002; Giannakopoulos et al., 2003).
Phase Amyloid-β pathology* NFT and neuropil threads**
I Neocortex Trans-entorhinal and entorhinal
regions II Hippocampus and entorhinal
cortex
III Basal ganglia, thalamus,
hypothalamus Hippocampus
IV Brainstem nuclei
V Pons and cerebellum Neocortex
VI
Table 1.1 Comparison of the development and distribution of Amyloid-β and tau pathology in AD. * = from (Thal et al., 2002), ** = from (Braak and Braak, 1991).
9
A definitive diagnosis of AD is only confirmed after post-mortem examination. Until
recently, diagnosis was based upon the semi-quantitative rating of ‘frequent’ neuritic
plaques – Aβ plaques containing degenerating neurites – according to the CERAD score
(Consortium to Establish a Establish a Registry for Alzheimer's Disease)(Mirra et al.,
1991), and Braak stage V/VI of NFTs (Braak and Braak, 1991). Montine et al. have now
updated these guidelines to include more detailed methods to assess and report
coexisting disease pathology such as vascular lesions; to incorporate staging of Aβ
deposits, NFTs, and neuritic plaques; and to recognize that AD pathology can also
develop in subjects without cognitive impairment (Montine et al., 2012).
The causative relationship between the two pathological hallmarks of AD remains
unclear. Over the last 20 years, the amyloid cascade hypothesis has dominated
Alzheimer’s disease research, postulating that Aβ deposits trigger AD processes and
are the cause of neuron and synapse loss, mediated by the formation of tau pathology
(Hardy and Higgins, 1992). However, studies found that Aβ plaque burden was not
closely related to dementia symptoms or neurodegeneration, and it is not uncommon
for elderly individuals with severe Aβ pathology to maintain normal cognitive function
(Braak and Braak, 1991). In addition, plaque development follows a different pattern
to tau pathology during disease progression (Table 1.1)(Attems and Jellinger, 2012).
Furthermore, although the vast majority of research into AD treatments has focussed
on clearing Aβ aggregates from the brain, no drugs designed to prevent or reverse
amyloid accumulation have passed Phase III clinical trials (Karran et al., 2011).
Therefore, the original amyloid hypothesis has been modified to propose that soluble
oligomers of Aβ may be the toxic component that directly injures synapses and
neurites (Hardy and Selkoe, 2002). Further discussion on the role of AD pathology in
neuronal and cognitive dysfunction is continued in Chapter 4.
10
Figure 1.2. Common pathological characteristics of AD and VaD. A, Hyperphosphorylated tau pathology in the hippocampus of an AD subject, visualized using antibodies to AT8; B, amyloid plaques in the hippocampus of an AD subject, visualized using antibodies to 4G8; C, Cerebral amyloid angiopathy (CAA), arrows show Aβ deposition in capillaries; D, atherosclerotic changes in the left carotid artery of an elderly subject (C and D adapted from Grinberg and Thal, 2010); E, normal blood vessel in elderly subject; F, Arteriolosclerotic blood vessel in a subject with SVD, demonstrating splitting of concentric smooth muscle cell layers .
11
1.2.3 Mixed dementia: CVD and AD
Large epidemiological and neuroimaging studies have consistently found that
dementia subjects often have a mixture of both neurodegenerative and vascular
lesions. Around 30-50% of VaD patients have coexisting AD pathology, and over 30% of
AD cases have co-existing cerebrovascular pathology (Snowdon et al., 1997; Kalaria
and Ballard, 1999; Wharton et al., 2011; Kling et al., 2013). The extent to which these
disease processes influence and interact with one another is unclear, although the
importance of CVD in the pathogenesis of AD is now becoming more widely recognized
(Ruitenberg et al., 2005; Bell and Zlokovic, 2009; Uh et al., 2010; Chen et al., 2011a).
Studies have found that hypoperfusion is associated with amyloid plaque
accumulation, suggesting that SVD processes can also trigger AD mechanisms (Sojkova
et al., 2008; Huang et al., 2012). Conversely, AD pathology can also cause vascular
damage, as cerebral capillary degeneration has been found in practically all AD
subjects examined post-mortem (de la Torre, 2002). The co-existence of AD and CVD
lesions have been found to have additive effect on cognitive function, further
supporting the hypothesis that these pathological processes are synergistic and
cumulative (Nagy et al., 1997; Snowdon et al., 1997; Zekry et al., 2002; Toledo et al.,
2013). The involvement of CVD processes in AD is also evident in the number of shared
risk factors for AD and VaD, many of which are traditionally associated with
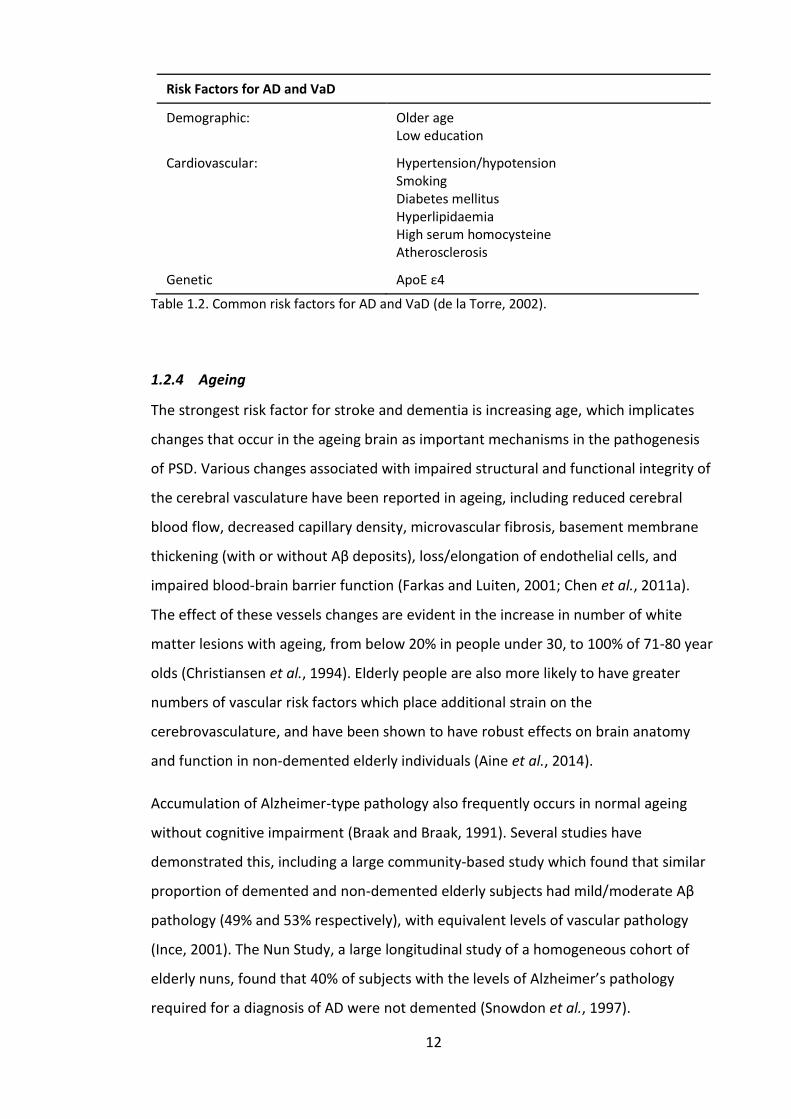
atherosclerosis or cardiovascular disease (Table 1.2)(Gorelick, 2004; Kling et al., 2013).
The increased vulnerability of stroke survivors to dementia has therefore been
suggested to be due to the ischaemic cascade triggering or exacerbating widespread
neurodegenerative processes (Kalaria, 2000; Lee et al., 2005; Cumming and
Brodtmann, 2011).
12
Risk Factors for AD and VaD
Demographic: Older age Low education
Cardiovascular: Hypertension/hypotension Smoking Diabetes mellitus Hyperlipidaemia High serum homocysteine Atherosclerosis
Genetic ApoE ε4
Table 1.2. Common risk factors for AD and VaD (de la Torre, 2002).
1.2.4 Ageing
The strongest risk factor for stroke and dementia is increasing age, which implicates
changes that occur in the ageing brain as important mechanisms in the pathogenesis
of PSD. Various changes associated with impaired structural and functional integrity of
the cerebral vasculature have been reported in ageing, including reduced cerebral
blood flow, decreased capillary density, microvascular fibrosis, basement membrane
thickening (with or without Aβ deposits), loss/elongation of endothelial cells, and
impaired blood-brain barrier function (Farkas and Luiten, 2001; Chen et al., 2011a).
The effect of these vessels changes are evident in the increase in number of white
matter lesions with ageing, from below 20% in people under 30, to 100% of 71-80 year
olds (Christiansen et al., 1994). Elderly people are also more likely to have greater
numbers of vascular risk factors which place additional strain on the
cerebrovasculature, and have been shown to have robust effects on brain anatomy
and function in non-demented elderly individuals (Aine et al., 2014).
Accumulation of Alzheimer-type pathology also frequently occurs in normal ageing
without cognitive impairment (Braak and Braak, 1991). Several studies have
demonstrated this, including a large community-based study which found that similar
proportion of demented and non-demented elderly subjects had mild/moderate Aβ
pathology (49% and 53% respectively), with equivalent levels of vascular pathology
(Ince, 2001). The Nun Study, a large longitudinal study of a homogeneous cohort of
elderly nuns, found that 40% of subjects with the levels of Alzheimer’s pathology
required for a diagnosis of AD were not demented (Snowdon et al., 1997).
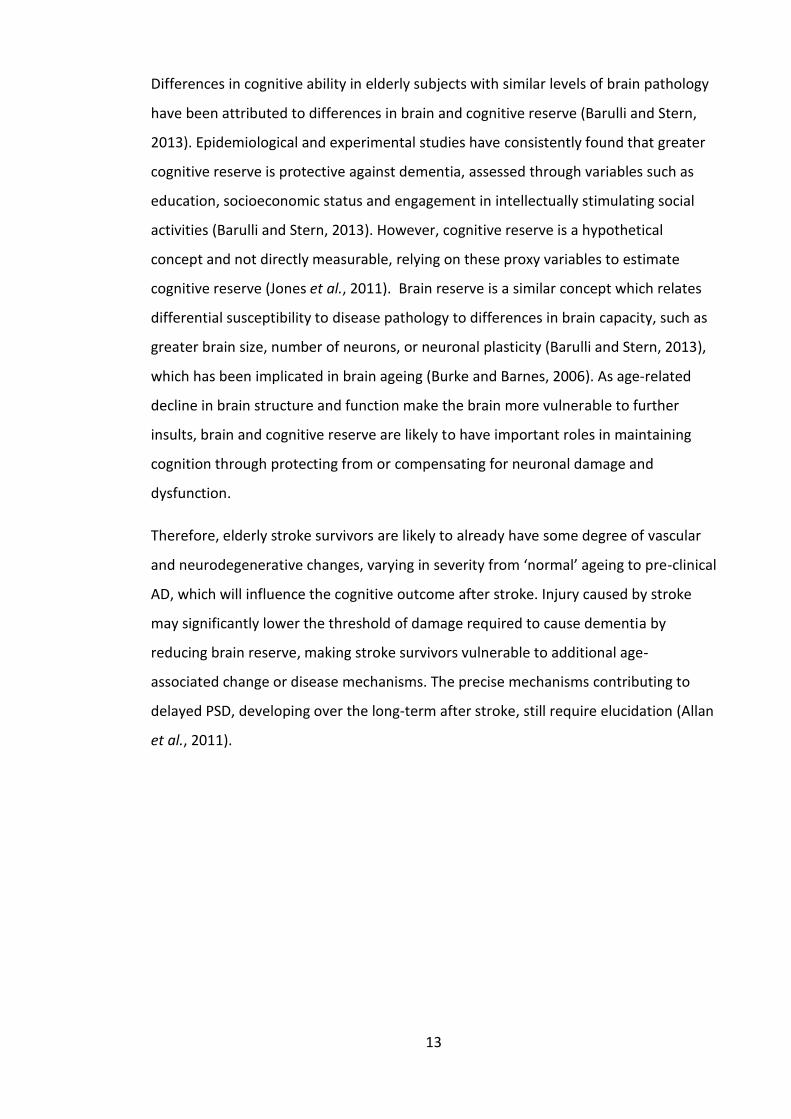
13
Differences in cognitive ability in elderly subjects with similar levels of brain pathology
have been attributed to differences in brain and cognitive reserve (Barulli and Stern,
2013). Epidemiological and experimental studies have consistently found that greater
cognitive reserve is protective against dementia, assessed through variables such as
education, socioeconomic status and engagement in intellectually stimulating social
activities (Barulli and Stern, 2013). However, cognitive reserve is a hypothetical
concept and not directly measurable, relying on these proxy variables to estimate
cognitive reserve (Jones et al., 2011). Brain reserve is a similar concept which relates
differential susceptibility to disease pathology to differences in brain capacity, such as
greater brain size, number of neurons, or neuronal plasticity (Barulli and Stern, 2013),
which has been implicated in brain ageing (Burke and Barnes, 2006). As age-related
decline in brain structure and function make the brain more vulnerable to further
insults, brain and cognitive reserve are likely to have important roles in maintaining
cognition through protecting from or compensating for neuronal damage and
dysfunction.
Therefore, elderly stroke survivors are likely to already have some degree of vascular
and neurodegenerative changes, varying in severity from ‘normal’ ageing to pre-clinical
AD, which will influence the cognitive outcome after stroke. Injury caused by stroke
may significantly lower the threshold of damage required to cause dementia by
reducing brain reserve, making stroke survivors vulnerable to additional age-
associated change or disease mechanisms. The precise mechanisms contributing to
delayed PSD, developing over the long-term after stroke, still require elucidation (Allan
et al., 2011).

14
1.3 The Cognitive Function After Stroke (CogFAST) study
1.3.1 Study design
The Cognitive Function After Stroke (CogFAST) study was set up in 1999 to investigate
the risk factors and substrates dementia after stroke. The study recruited 355 non-
demented stroke survivors over 75 years old to prospectively study the evolution of
cognitive changes after stroke, particularly focussing on identifying and understanding
the causes of delayed PSD. Due to the strict exclusion criteria precluding anyone who
had severe cognitive impairment or disabilities at three months post-stroke, it was
unlikely that CogFAST participants had suffered large vessel strokes. Therefore,
CogFAST subjects were likely to have experienced smaller strokes, TIAs or strategic
lacunar infarcts. Study participants received annual clinical and neuropsychological
evaluations from baseline three months post-stroke to provide information about
cognitive changes over time (Table 1.1). A subset of participants also received MRI
(magnetic resonance imaging) scans to assess volumetric and cerebral blood flow
changes. Over 60 participants have now donated their brain for post-mortem research
into the pathological mechanisms causing VCI in stroke survivors. Full details of the
recruitment criteria and study design are described in Figure 1.3 and in Chapter 2
(page 37).
Standard clinical assessments Vascular risk factors identified
Cardiovascular history and examination Neurological history and examination Blood pressure Blood chemistry
Angina, myocardial infarct, stroke, transient ischaemic attack Hypertension, hypotension Atrial fibrillation, hyperlipidaemia, diabetes mellitus
Neuropsychological assessment Cognitive domain assessed
CAMCOG (Cambridge Assessment Mental Disorders in the Elderly, Section B) CDR computerized battery DSM IV CDR and Barthel ADL
Global cognitive performance, with subscales of memory, orientation and executive function Composite of sub scales for power of attention Dementia diagnosis To assist dementia diagnosis
Table 1.3 Summary of clinical assessments performed in the CogFAST study. CAMCOG = cognitive part of the Cambridge Examination for Mental Disorders of the elderly (CAMDEX) (de Koning et al., 1998); DSM = Diagnostic and Statistical Manual of mental disorders ; CDR = Clinical Dementia Rating; Barthel ADL = Index to measure performance in activities of daily living.
15
Figure 1.3 The CogFAST study design. Mean survival time from stroke to death was 6.72 years (Allan et al., 2011). CT = X-ray computed tomography scan, MMSE = Mini Mental State Exam, CAMCOG = Cambridge Cognitive Examination, DSM = Diagnostic and Statistical Manual of mental disorders.
16
1.3.2 Key CogFAST study findings
The CogFAST study has generated several important findings that were particularly
relevant to my studies. The study found that during the first 15 months post-stroke,
50% of participants showed initial improvement in cognitive function, ~40% remained
stable, and ~10% developed delayed PSD (Ballard, 2003). However, despite the vast
majority of subjects demonstrating initial improvements or cognitive stability, the
long-term risk of dementia remained increased compared to stroke-free elderly
subjects; by three years post-stroke 21% of stroke survivors had developed dementia
and by seven years 39.5% had developed PSD (Allan et al., 2011). Incidence of delayed
PSD was calculated to be 6.32 cases per 100 person years (Allan et al., 2011).
Volumetric MRI investigations found that development of post-stroke cognitive
impairment was associated with medial temporal lobe (MTL) atrophy (Allan et al.,
2011), and that PSD subjects had smaller hippocampal volumes compared to non-
demented stroke survivors and controls, demonstrating similar hippocampal atrophy
to AD subjects (Firbank et al., 2011). All stroke survivors had a greater volume of white
matter hyperintensities (WMH) compared to controls, however, the volume of WMH
was not a predictor of subsequent cognitive decline (Firbank et al., 2007). Volume of
WMH in the temporal lobe was associated with memory impairment, and frontal
WMH were associated with deficits in attention and processing speed but not
executive dysfunction (Burton et al., 2004).
These findings confirmed that long-term risk of dementia was increased in stroke
survivors from the CogFAST cohort and was associated with structural changes in the
MTL and hippocampus. This was initially assumed to be due to the stroke triggering or
exacerbating AD processes, as atrophy of the MTL and hippocampus is traditionally
associated with AD (Gosche et al., 2002). However, when PSD subjects came to
autopsy, the majority met neuropathological criteria for VaD, suggesting that AD
processes were not the most important determinant of post-stroke cognition (Kalaria
et al., 2004). No previous studies had investigated neuropathological outcomes in
older stroke survivors, although the finding of substantial vascular pathology in
delayed PSD subjects supported the theory that dementia after stroke may be caused
by on-going vascular pathological mechanisms including large and small vessel disease
(Allan et al., 2011). Allen et al. suggested that these pathological findings may also
17
reflect the inclusion criteria requiring cognitively intact elderly people over 75 years
old, with at least one clinically detectable stroke, which may have excluded people
with significant co-existing neurodegenerative pathology. As a previous study had
found that PSD predicted poor long-term survival (Melkas et al., 2009), it was
surprising to find that there were no differences in mean survival time between
demented and non-demented stroke survivors who came to autopsy (mean survival
time = 6.72 years, 95% confidence intervals = 6.38–7.05) (Allan et al., 2011).
In the CogFAST cohort, the presence of three or more cardiovascular risk factors
(particularly ischaemic heart disease and hypertension), poor CAMCOG memory and
executive function scores at baseline, previous disabling stroke, depression and older
age were found to be significant predictors for death or dementia (Allan et al., 2011).
The PSD group had non-significantly greater mean number of infarcts compared to the
PSND group (4.5 ±2.8(SD) vs. 3.9 ±2(SD)), and a greater percentage of PSD subjects had
>3 microinfarcts in four regions (50% vs. 41%, p = 0.05) (Allan et al., 2011). However,
due to study limitations, Allen et al. were not able to accurately establish whether
further strokes had occurred at follow-up, or whether different types of stroke or
arterial territories involved were associated with increased likelihood of developing
delayed PSD (Allan et al., 2011).
Overall, the CogFAST study has confirmed that the long-term prognosis for survival and
cognitive function in older stroke survivors is poor, although it is encouraging to find
that risk of dementia is highly related to modifiable vascular risk factors. Neuroimaging
findings indicated that the MTL and hippocampus were key structures involved in the
pathogenesis of post-stroke dementia, as atrophy of these regions was associated with
poor cognitive outcome. However, the underlying mechanisms causing these structural
and functional changes in delayed PSD remain unclear. Therefore, my studies focussed
on exploring pathological mechanisms in the hippocampus to further current
understanding of the cellular substrates of hippocampal atrophy and cognitive
impairment in delayed PSD.
1.3.3 Hippocampal microvascular changes in delayed PSD
A parallel study of delayed PSD in CogFAST subjects recently investigated changes to
hippocampal microvasculature stroke survivors, AD and VaD subjects (Burke et al.,
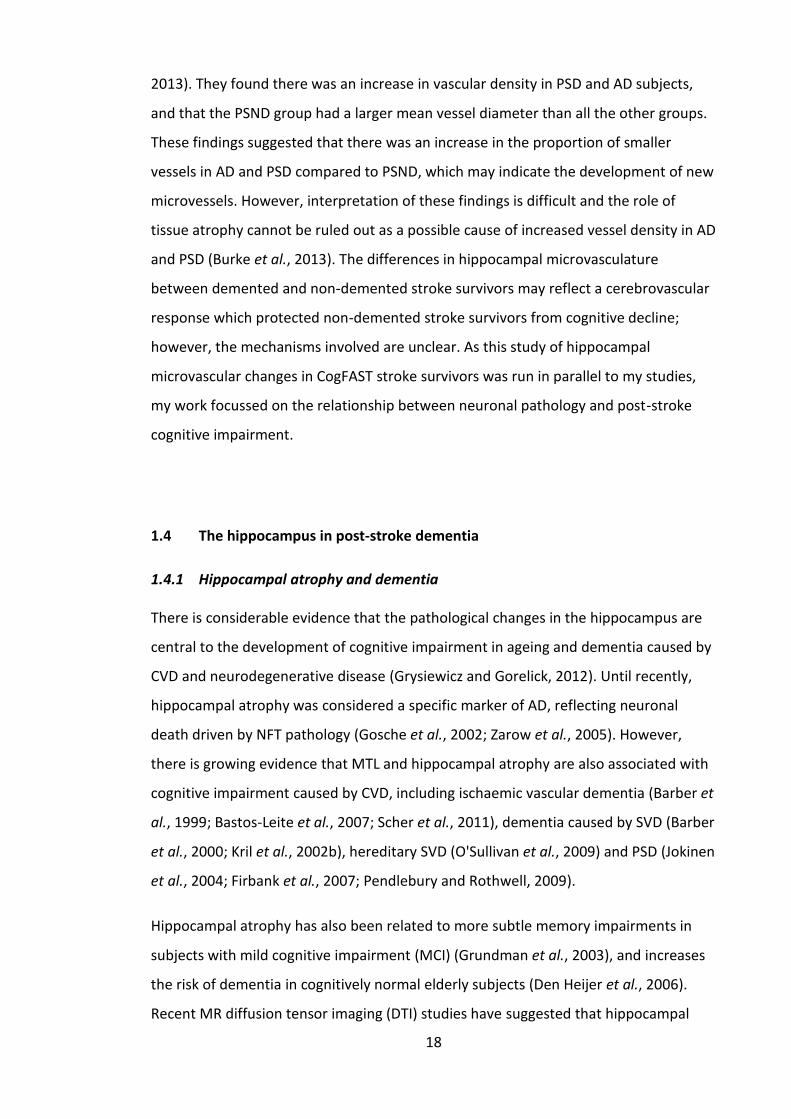
18
2013). They found there was an increase in vascular density in PSD and AD subjects,
and that the PSND group had a larger mean vessel diameter than all the other groups.
These findings suggested that there was an increase in the proportion of smaller
vessels in AD and PSD compared to PSND, which may indicate the development of new
microvessels. However, interpretation of these findings is difficult and the role of
tissue atrophy cannot be ruled out as a possible cause of increased vessel density in AD
and PSD (Burke et al., 2013). The differences in hippocampal microvasculature
between demented and non-demented stroke survivors may reflect a cerebrovascular
response which protected non-demented stroke survivors from cognitive decline;
however, the mechanisms involved are unclear. As this study of hippocampal
microvascular changes in CogFAST stroke survivors was run in parallel to my studies,
my work focussed on the relationship between neuronal pathology and post-stroke
cognitive impairment.
1.4 The hippocampus in post-stroke dementia
1.4.1 Hippocampal atrophy and dementia
There is considerable evidence that the pathological changes in the hippocampus are
central to the development of cognitive impairment in ageing and dementia caused by
CVD and neurodegenerative disease (Grysiewicz and Gorelick, 2012). Until recently,
hippocampal atrophy was considered a specific marker of AD, reflecting neuronal
death driven by NFT pathology (Gosche et al., 2002; Zarow et al., 2005). However,
there is growing evidence that MTL and hippocampal atrophy are also associated with
cognitive impairment caused by CVD, including ischaemic vascular dementia (Barber et
al., 1999; Bastos-Leite et al., 2007; Scher et al., 2011), dementia caused by SVD (Barber
et al., 2000; Kril et al., 2002b), hereditary SVD (O'Sullivan et al., 2009) and PSD (Jokinen
et al., 2004; Firbank et al., 2007; Pendlebury and Rothwell, 2009).
Hippocampal atrophy has also been related to more subtle memory impairments in
subjects with mild cognitive impairment (MCI) (Grundman et al., 2003), and increases
the risk of dementia in cognitively normal elderly subjects (Den Heijer et al., 2006).
Recent MR diffusion tensor imaging (DTI) studies have suggested that hippocampal
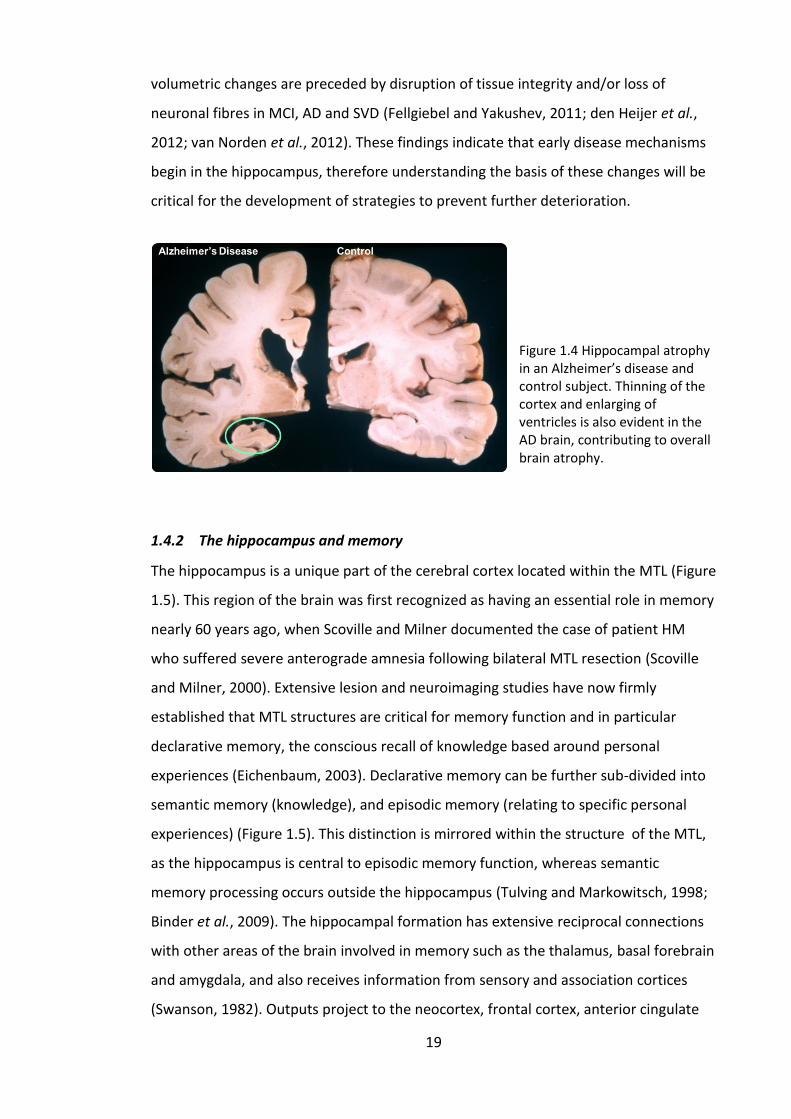
19
volumetric changes are preceded by disruption of tissue integrity and/or loss of
neuronal fibres in MCI, AD and SVD (Fellgiebel and Yakushev, 2011; den Heijer et al.,
2012; van Norden et al., 2012). These findings indicate that early disease mechanisms
begin in the hippocampus, therefore understanding the basis of these changes will be
critical for the development of strategies to prevent further deterioration.
Figure 1.4 Hippocampal atrophy in an Alzheimer’s disease and control subject. Thinning of the cortex and enlarging of ventricles is also evident in the AD brain, contributing to overall brain atrophy.
1.4.2 The hippocampus and memory
The hippocampus is a unique part of the cerebral cortex located within the MTL (Figure
1.5). This region of the brain was first recognized as having an essential role in memory
nearly 60 years ago, when Scoville and Milner documented the case of patient HM
who suffered severe anterograde amnesia following bilateral MTL resection (Scoville
and Milner, 2000). Extensive lesion and neuroimaging studies have now firmly
established that MTL structures are critical for memory function and in particular
declarative memory, the conscious recall of knowledge based around personal
experiences (Eichenbaum, 2003). Declarative memory can be further sub-divided into
semantic memory (knowledge), and episodic memory (relating to specific personal
experiences) (Figure 1.5). This distinction is mirrored within the structure of the MTL,
as the hippocampus is central to episodic memory function, whereas semantic
memory processing occurs outside the hippocampus (Tulving and Markowitsch, 1998;
Binder et al., 2009). The hippocampal formation has extensive reciprocal connections
with other areas of the brain involved in memory such as the thalamus, basal forebrain
and amygdala, and also receives information from sensory and association cortices
(Swanson, 1982). Outputs project to the neocortex, frontal cortex, anterior cingulate
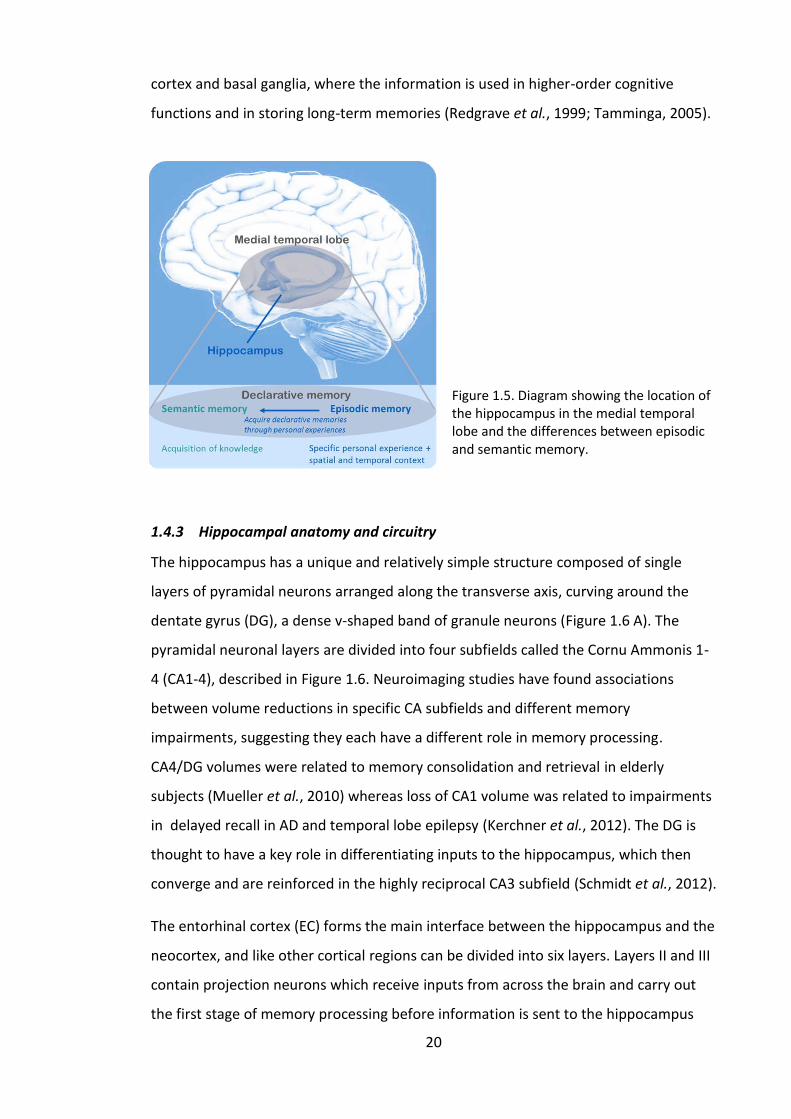
20
cortex and basal ganglia, where the information is used in higher-order cognitive
functions and in storing long-term memories (Redgrave et al., 1999; Tamminga, 2005).
Figure 1.5. Diagram showing the location of the hippocampus in the medial temporal lobe and the differences between episodic and semantic memory.
1.4.3 Hippocampal anatomy and circuitry
The hippocampus has a unique and relatively simple structure composed of single
layers of pyramidal neurons arranged along the transverse axis, curving around the
dentate gyrus (DG), a dense v-shaped band of granule neurons (Figure 1.6 A). The
pyramidal neuronal layers are divided into four subfields called the Cornu Ammonis 1-
4 (CA1-4), described in Figure 1.6. Neuroimaging studies have found associations
between volume reductions in specific CA subfields and different memory
impairments, suggesting they each have a different role in memory processing.
CA4/DG volumes were related to memory consolidation and retrieval in elderly
subjects (Mueller et al., 2010) whereas loss of CA1 volume was related to impairments
in delayed recall in AD and temporal lobe epilepsy (Kerchner et al., 2012). The DG is
thought to have a key role in differentiating inputs to the hippocampus, which then
converge and are reinforced in the highly reciprocal CA3 subfield (Schmidt et al., 2012).
The entorhinal cortex (EC) forms the main interface between the hippocampus and the
neocortex, and like other cortical regions can be divided into six layers. Layers II and III
contain projection neurons which receive inputs from across the brain and carry out
the first stage of memory processing before information is sent to the hippocampus
21
(Figure 1.6 B)(Canto et al., 2008). Therefore, the superficial and deep layers of the EC
can generally be considered as discrete input/output regions, although studies show
the layers of the EC are highly interconnected therefore this is likely to be an over-
simplification (Canto et al., 2008).
The intrahippocmapal circuit is a complex network of hippocampal neuronal
connections arranged along the transverse axis of the hippocampus (Cenquizca and
Swanson, 2007). Information is received from cortical inputs via EC layer II neurons
projecting to the DG and CA3, and layer III projecting to the CA1 and subiculum.
Historically, models of hippocampal circuitry have focussed on sequential steps of
information processing, creating a well-defined trisynaptic hippocampal loop from the
DG – CA3 – CA1. However, anatomical, neurophysiological and behavioural studies
have established that this is a considerable over-simplification, as the hippocampus
contains multiple circuits, allowing conversion and comparison of combinations of raw
and processed information in a highly interconnected 3D network (van Strien et al.,
2009; Jones and McHugh, 2011). Based upon recent findings, four major overlapping
circuits of information processing have been proposed: (1) the trisynaptic loop
involving the DG - CA3 - CA1, (2) a disynaptic loop involving the CA3 - CA1, (3) a
disynaptic loop involving the CA2 – CA1, and (4) the monosynaptic temporoammonic
pathway from the EC to CA1 (Figure 1.6) (Jones and McHugh, 2011). Therefore,
information converges on the CA1 subfield, and is then output via the subiculum back
to the EC (layers V and VI), parahippocampal and neocortical areas (Jones and
McHugh, 2011).
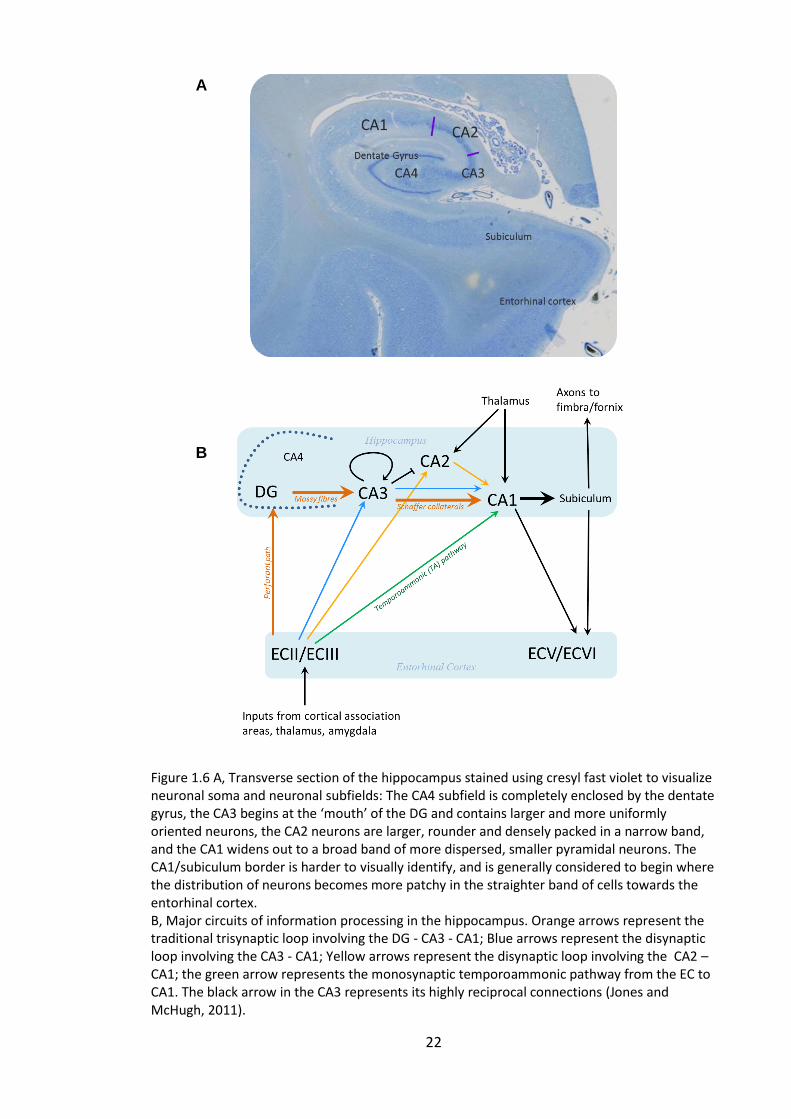
22
Figure 1.6 A, Transverse section of the hippocampus stained using cresyl fast violet to visualize neuronal soma and neuronal subfields: The CA4 subfield is completely enclosed by the dentate gyrus, the CA3 begins at the ‘mouth’ of the DG and contains larger and more uniformly oriented neurons, the CA2 neurons are larger, rounder and densely packed in a narrow band, and the CA1 widens out to a broad band of more dispersed, smaller pyramidal neurons. The CA1/subiculum border is harder to visually identify, and is generally considered to begin where the distribution of neurons becomes more patchy in the straighter band of cells towards the entorhinal cortex. B, Major circuits of information processing in the hippocampus. Orange arrows represent the traditional trisynaptic loop involving the DG - CA3 - CA1; Blue arrows represent the disynaptic loop involving the CA3 - CA1; Yellow arrows represent the disynaptic loop involving the CA2 – CA1; the green arrow represents the monosynaptic temporoammonic pathway from the EC to CA1. The black arrow in the CA3 represents its highly reciprocal connections (Jones and McHugh, 2011).
A
B
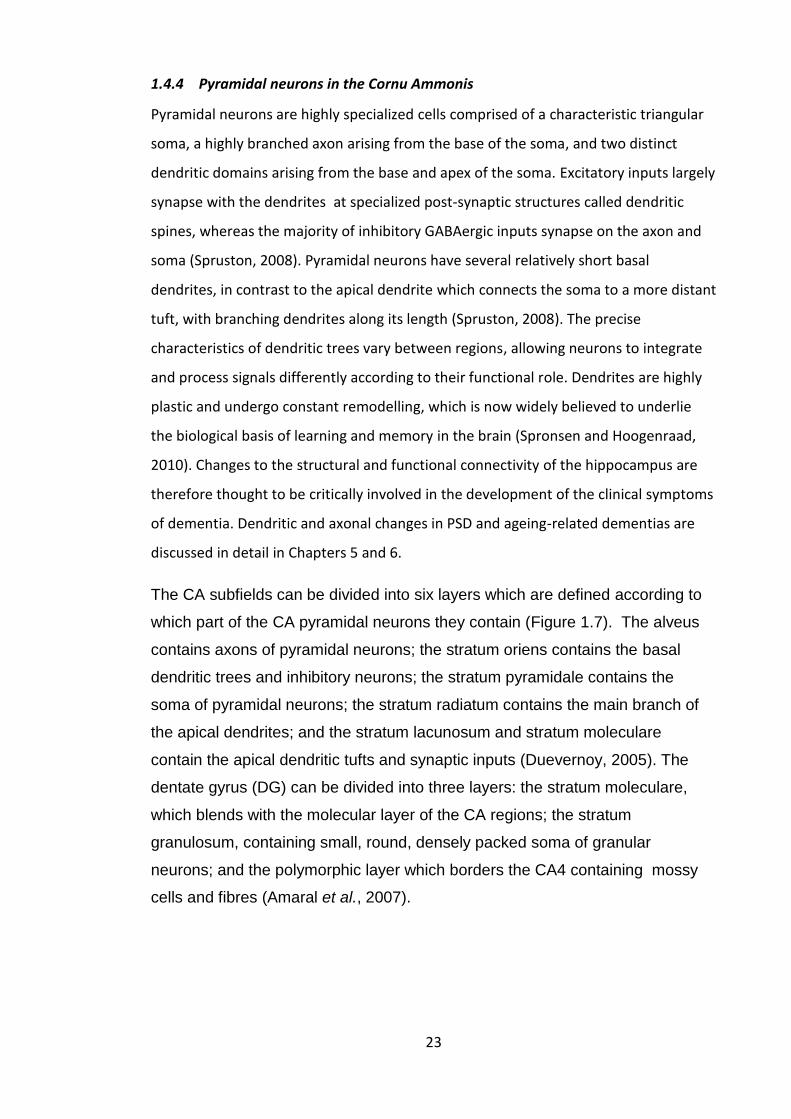
23
1.4.4 Pyramidal neurons in the Cornu Ammonis
Pyramidal neurons are highly specialized cells comprised of a characteristic triangular
soma, a highly branched axon arising from the base of the soma, and two distinct
dendritic domains arising from the base and apex of the soma. Excitatory inputs largely
synapse with the dendrites at specialized post-synaptic structures called dendritic
spines, whereas the majority of inhibitory GABAergic inputs synapse on the axon and
soma (Spruston, 2008). Pyramidal neurons have several relatively short basal
dendrites, in contrast to the apical dendrite which connects the soma to a more distant
tuft, with branching dendrites along its length (Spruston, 2008). The precise
characteristics of dendritic trees vary between regions, allowing neurons to integrate
and process signals differently according to their functional role. Dendrites are highly
plastic and undergo constant remodelling, which is now widely believed to underlie
the biological basis of learning and memory in the brain (Spronsen and Hoogenraad,
2010). Changes to the structural and functional connectivity of the hippocampus are
therefore thought to be critically involved in the development of the clinical symptoms
of dementia. Dendritic and axonal changes in PSD and ageing-related dementias are
discussed in detail in Chapters 5 and 6.
The CA subfields can be divided into six layers which are defined according to
which part of the CA pyramidal neurons they contain (Figure 1.7). The alveus
contains axons of pyramidal neurons; the stratum oriens contains the basal
dendritic trees and inhibitory neurons; the stratum pyramidale contains the
soma of pyramidal neurons; the stratum radiatum contains the main branch of
the apical dendrites; and the stratum lacunosum and stratum moleculare
contain the apical dendritic tufts and synaptic inputs (Duevernoy, 2005). The
dentate gyrus (DG) can be divided into three layers: the stratum moleculare,
which blends with the molecular layer of the CA regions; the stratum
granulosum, containing small, round, densely packed soma of granular
neurons; and the polymorphic layer which borders the CA4 containing mossy
cells and fibres (Amaral et al., 2007).
24
Figure 1.7. Layers of the Cornu Ammonis. Str = stratum, SO = stratum oriens, SP = stratum pyramidal, SR = stratum radiatum. Adapted from (Duevernoy, 2005).

25
Figure 1.8. Hippocampal subfields visualized using immunohistochemistry to detect dendritic protein MAP2.
26
1.4.5 Differential subfield vulnerability in PSD
Hippocampal atrophy is thought to be caused by loss of neurons, as studies have
shown that neurons in the largest hippocampal subfield, the CA1, are particularly
vulnerable to injury and neurodegeneration in AD and hypoxia-ischemia (Kril et al.,
2002a; Kril et al., 2004; Zarow et al., 2005). However, the precise mechanisms causing
hippocampal atrophy and dysfunction in PSD are unclear. During ischemia, neurons
can be damaged through a combination of hypoxia, hypoglycaemia, and glutamate
excitotoxicity (Larsen et al., 2006). Reduced blood flow to neurons also causes an
imbalance in neurotrophic and apoptotic signals which may lead to neurodegeneration
(Banasiak et al., 2000). Studies of animal models of transient cerebral ischemia have
reported delayed post-ischaemic cell death with CA1 neurons starting to degenerate 2-
3 days after ~15 minute ischemia, peaking at one week after the event (Kirino, 1982).
These changes are associated with increased extracellular glutamate concentration
suggesting that neurons are lost due to excitotoxic mechanisms (Ruan et al., 2006).
Excitotoxicity has also been implicated in neurodegeneration in AD (Hynd et al., 2004;
Mishizen-Eberz et al., 2004).
Excitotoxicity is a process by which neurons become overexcited by high levels of
extracellular glutamate at synapses, which activates NMDA receptors and causes
calcium ion influx, triggering a cascade of catabolic processes causing cell damage and
apoptotic cell death (Olney and Sharpe, 1969; Ankarcrona et al., 1995). NMDA
receptors are highly expressed in hippocampal neurons, which is assumed to
contribute to the increased vulnerability to excitotoxic injury (Mishizen-Eberz et al.,
2004). Within the hippocampus, CA1 pyramidal neurons are particularly susceptible to
NMDA-induced-excitotoxicity, whereas neurons in other CA subfields and the DG are
more resistant. This selective sensitivity of CA1 neurons is not well understood, though
the high density of NMDA NR2B subunits in CA1 neurons suggests they may be
involved (Chen et al., 2007). Additionally, because hippocampal network activity
culminates in the CA1 region, neuronal excitability during hypoxia-ischemia may be
particularly high in CA1 neurons (Butler et al., 2010).
In contrast, the CA2 subfield is considered the resistant subfield, as neurons do not
appear to be lost from this region in AD or CVD. This may be related to their structure
27
and connectivity; CA2 neurons have distinct dendritic morphology, connectivity and
basal membrane properties compared to CA1 neurons (Jones and McHugh, 2011) and
do not appear to be sequentially activated as part of the classic ‘trisynaptic loop’ of
hippocampal circuitry. Furthermore, CA2 neurons do not exhibit experimentally
induced plasticity as readily as CA1 or CA3 neurons, which has been attributed to
increased calcium buffering (Jones and McHugh, 2011), which may also protect against
hyper-excitability. The differential vulnerability of the CA1 and CA2 neurons in ageing,
hypoxia and AD means that studies comparing neuronal changes in the CA1 and CA2
subfields within the same section and subject can regard the CA2 neurons as an
internal control for any changes observed in CA1 (i.e. if changes are only observed in
the CA1 subfield, they must represent pathological changes rather than an artefact of
tissue processing).
1.4.6 Neurodegeneration and autophagy
The major mechanisms of neuronal cell death after ischemia are apoptosis and
necrosis, and both have been implicated in delayed neuronal death in the
hippocampus after hypoxic-ischaemic injury (Hara and Mori, 2000). Additionally,
macroautophagy (autophagy)2, a degradation pathway for organelles and long-lived
proteins too large to be degraded by the ubiquitin-proteasome-system, is also
triggered in neurons after hypoxic and excitotoxic injury, and excessive or imbalanced
induction can contribute to neuronal cell death (Cherra III and Chu, 2008). However,
autophagy may also provide a neuroprotective mechanism in the early stages of injury
(Carloni et al., 2008).
Dysfunctional autophagy has been implicated in AD, ischemia and ageing, and
autophagy has a role in maintaining neuronal function and morphology. During
autophagy, proteins become enclosed in double-membraned autophagic vacuoles
(AVs), which fuse with lysosomes in the soma to degrade the proteins Error! Reference
source not found.(Kragh et al., 2012). Under normal conditions autophagy is highly
efficient in neurons; therefore neurons contain very few AVs. During cell starvation,
2 Two other forms of autophagy also exist; chaperone-mediated autophagy and microautophagy.
Macroautophagy is the most extensively studied and has been implicated in ageing and dementia, and is commonly simply referred to as ‘autophagy’. Levine, B. and Kroemer, G. (2008) 'Autophagy in the Pathogenesis of Disease', Cell, 132(1), pp. 27-42.
28
stress or injury, autophagy is upregulated to degrade non-essential proteins and
release amino acids that can then be recycled for stress adaptation or to maintain ATP
production (Levine and Kroemer, 2008; Johansen and Lamark, 2011). Autophagy is
therefore considered to provide a neuroprotective response in neurodegenerative
disease and hypoxic-ischaemic injury (Nixon, 2006; Mariño et al., 2011).
The two most commonly studied proteins involved in autophagy are LC3 (microtubule
associated protein 1, light chain 3) and Beclin-1. During the initiation of autophagy,
LC3-I becomes anchored to the AV membrane to form LC3-II, a specific marker for
autophagosomes (Mizushima, 2004). Beclin-1 is involved in the recruitment of the
membranes which form the autophagosomes, and also interacts with anti-apoptotic
protein Bcl-2 as an upstream gatekeeper of apoptosis (Liang 1998). Under stress
conditions, Beclin-1 dissociates from Bcl-2 and induces autophagy, providing a
cytoprotective mechanism to avoid cell death (Maiuri et al., 2010). In ageing neurons
there is an accumulation of non-functional cellular components which is associated
with a decline in autophagic degradation (Salminen and Kaarniranta, 2009). Ageing and
early AD have been associated with a decline in Beclin-1 levels (Cherra III and Chu,
2008; Pickford et al., 2008; Rohn et al., 2011), however it is unclear whether ageing-
associated impairments in autophagy are the cause of, or result from, impaired fusion
with lysosomes and clearance of AVs (Levine and Kroemer, 2008). Further discussion
on the role of autophagy in neuronal injury continued in Chapter 4.
1.5 The role of neuroglia in neurodegeneration
Over the last 20 years there have been considerable advances in our understanding of
the role of neuroglial cells – astrocytes, oligodendrocytes and microglia – in brain
organization and function (Giaume et al., 2007). These cells, particularly astrocytes,
express many of the same receptors as neurons, receive synaptic inputs, release
gliotransmitters and form networks, maintain the blood-brain barrier, provide the
brain’s main defence against injury and infection, and can act as pluripotent neural
precursors for adult neurogenesis (Giaume et al., 2007). With such pivotal roles in
29
brain homeostasis and function, pathological changes to neuroglia in CVD and AD are
likely to contribute to cognitive decline post-stroke and in ageing-related dementias.
1.5.1 Astrocytes
Astrocytes are the most numerous type of glial cell in the brain and are distributed in a
homogeneous non-overlapping manner with each astrocyte occupying a distinct
territory. It is believed that astrocytes may be as heterogeneous as neurons (Barres,
2008), although they have historically been defined using two main sub-types based on
their location and morphology. Protoplasmic astrocytes are found in the grey matter
and have a characteristic spherical cell body with several tortuous branched stem
processes which are evenly extended around the cell body in all directions and contact
synapses and blood vessels. Fibrous astrocytes are found in the white matter, and have
a more oblong cell body, with longer, less ramified fibre-like processes mainly
extending in two opposite directions which contact nodes of Ranvier and blood vessels
(Sofroniew and Vinters, 2010).
Recently, additional classes of primate-specific glial fibrillary acidic protein (GFAP)
positive astrocytes have been identified. Interlaminar astrocytes are found in layer 1,
and extend tortuous processes from the pial surface across several millimetres to
terminate in layers 2 – 4 (Colombo and Reisin, 2004). Protoplasmic astrocytes (the
most common) are found in layers 2 – 6, and extend processes in all directions. A
recent study also identified varicose projection astrocytes, which appear to be higher-
order-primate-specific, and are sparsely found in layers 5 -6. These projection
astrocytes extend approximately 1mm long straight processes within the deep layers
of the cortex, characterised by varicosities every 10µm. Interestingly, these processes
were found to extend in all directions and did not maintain the non-overlapping
domain organisation. As many of the processes from these varicose projection
astrocytes were found to contact vessels, it was suggested that these astrocytes may
play a role in coordinating functional hyperemia across large areas (Oberheim et al.,
2009). The precise role of these different sub-types remains unclear, although it has
been suggested that the complexity and diversity of cortical astrocytes is an
evolutionary adaptation underlying the increased processing power of the human
brain (Oberheim et al., 2006).
30
In addition, GFAP positive radial neuronal stem cells (NSCs), found in the
subventricular zone of the lateral ventricles and subgranular zone of the dentate gyrus
in the adult brain, have been referred to as a sub-type of astrocyte (Doetsch et al.,
1999). However, these cells significantly differ from astrocytes as in morphology,
chemical phenotype and physiological characteristics, and are the predominant source
of adult neurogenesis, whereas protoplasmic and fibrous astrocytes are highly
differentiated and specialized cells that do not exhibit neurogenic potential (Imura et
al., 2006; Sofroniew and Vinters, 2010). Therefore, it has been suggested that these
cells simply be considered radial NSCs rather than a subtype of mature astrocyte to
maintain clear functional distinctions between different cell types (Sofroniew and
Vinters, 2010).
Role of astrocytes in synapse function
During development, astrocytes play an important role in synapse formation,
maintenance and pruning, and are involved in guiding developing axons (Powell and
Geller, 1999; Barres, 2008). Protoplasmic astrocyte processes envelop all synapses, and
in the hippocampus and cortex each astrocyte is estimated to contact hundreds of
dendrites from several neurons (Halassa et al., 2007). Astrocytes have an important
role in maintaining synapses through regulating ion concentrations and scavenging
excess neurotransmitters and waste products from the extracellular space. In addition,
astrocytes respond to neurotransmitters including glutamate through increased
intracellular calcium levels (Porter and McCarthy, 1996). Studies have shown that
these astrocytic calcium waves develop in well-defined receptive fields and are sharply
tuned for orientation and spatial-frequency, indicating that astrocytes act quasi-
independently with a small number of neurons surrounding them (Schummers et al.,
2008). Astrocytes are also believed to regulate synaptic transmission through the
release of gliotransmitters, which gave rise to the ‘tripartate synapse’ hypothesis
which suggests that astrocytes have a central role in synaptic activity and information
processing in neuronal networks (Perea et al., 2009). Through this function, astrocytes
have also been suggested to increase network complexity required for higher brain
functions (Giaume et al., 2007).
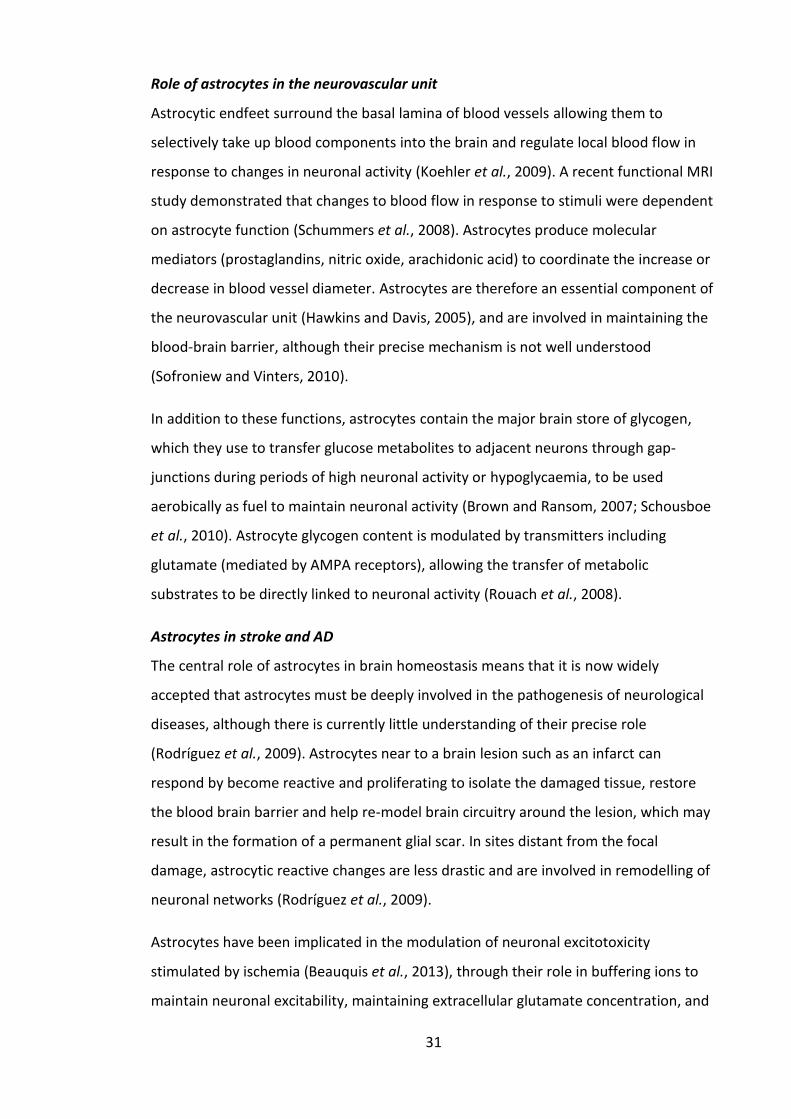
31
Role of astrocytes in the neurovascular unit
Astrocytic endfeet surround the basal lamina of blood vessels allowing them to
selectively take up blood components into the brain and regulate local blood flow in
response to changes in neuronal activity (Koehler et al., 2009). A recent functional MRI
study demonstrated that changes to blood flow in response to stimuli were dependent
on astrocyte function (Schummers et al., 2008). Astrocytes produce molecular
mediators (prostaglandins, nitric oxide, arachidonic acid) to coordinate the increase or
decrease in blood vessel diameter. Astrocytes are therefore an essential component of
the neurovascular unit (Hawkins and Davis, 2005), and are involved in maintaining the
blood-brain barrier, although their precise mechanism is not well understood
(Sofroniew and Vinters, 2010).
In addition to these functions, astrocytes contain the major brain store of glycogen,
which they use to transfer glucose metabolites to adjacent neurons through gap-
junctions during periods of high neuronal activity or hypoglycaemia, to be used
aerobically as fuel to maintain neuronal activity (Brown and Ransom, 2007; Schousboe
et al., 2010). Astrocyte glycogen content is modulated by transmitters including
glutamate (mediated by AMPA receptors), allowing the transfer of metabolic
substrates to be directly linked to neuronal activity (Rouach et al., 2008).
Astrocytes in stroke and AD
The central role of astrocytes in brain homeostasis means that it is now widely
accepted that astrocytes must be deeply involved in the pathogenesis of neurological
diseases, although there is currently little understanding of their precise role
(Rodríguez et al., 2009). Astrocytes near to a brain lesion such as an infarct can
respond by become reactive and proliferating to isolate the damaged tissue, restore
the blood brain barrier and help re-model brain circuitry around the lesion, which may
result in the formation of a permanent glial scar. In sites distant from the focal
damage, astrocytic reactive changes are less drastic and are involved in remodelling of
neuronal networks (Rodríguez et al., 2009).
Astrocytes have been implicated in the modulation of neuronal excitotoxicity
stimulated by ischemia (Beauquis et al., 2013), through their role in buffering ions to
maintain neuronal excitability, maintaining extracellular glutamate concentration, and
32
their resistance to hypoxic injury (Nedergaard and Dirnagl, 2005; Giaume et al., 2007).
Astrocytic malfunction has been suggested to contribute to delayed neuronal death
after ischemia as astrocytes are normally highly resistant to hypoxia, and if astrocytes
are lost, neurons are not likely to be able to survive (Nedergaard and Dirnagl, 2005).
Astrocytes protect neurons from excitotoxic cell death after ischemia through acting as
a glutamate sink, maintaining extracellular ion concentrations to prevent neuronal
depolarization, and providing the main antioxidant protection in brain tissue
(Rodríguez et al., 2009). If these functions become impaired they can exacerbate
neurodegeneration due to the reversal of the glutamate uptake system, blood-brain
barrier dysfunction and impaired blood flow, and secondary neuronal death after
astrocyte death (Giaume et al., 2007). One study has shown there was rapid depletion
of glutamine synthetase, a key enzyme in the detoxification of glutamate, from
astrocytes in vulnerable regions including the CA1 after hypoxic insult (Lee et al.,
2010). The loss of glutathione synthetase was therefore suggested to be an early
pathological mechanism impairing the ability of astrocytes to protect neurons from
excitotoxic injury, and potentially contributing to excitotoxic neurodegeneration in
regions vulnerable to hypoxia (Lee et al., 2010).
In AD, astrocytes have also been implicated in excitotoxic cell death, and become
reactive and take up large amounts of Aβ and neuronal debris surrounding plaques
(Ong et al., 2013). Different types of astrocytes are likely to be differentially vulnerable
to AD pathology. One study found that interlaminar astrocytes were more vulnerable
to AD pathology in the neocortex, demonstrating a loss of interlaminar processes,
whereas intralaminar processes became more reactive in severe AD. However, the
relationship between loss of the interlaminar processes and the density of neuritic
plaques was inconsistent (Colombo et al., 2002). Further discussion of the role of
astrocytes in stroke and dementia is continued in Chapter 6.
33
Figure 1.9. GFAP-positive astrocytes in the CA1 visualized using nickel-DAB. A, Protoplasmic astrocyte; B, Fibrous astrocyte in the alveus, surrounded by other GFAP-immunopositive processes; C, Astrocytes and astrocytic endfeet around a blood vessel. A, B Scale bar = 50µm; C, Scale bar = 100µm.
1.5.2 Microglia
Microglia are the most abundant immune cells in the brain and therefore make up the
brain’s major defence mechanism against injury and disease. Bone-marrow derived
microglia invade the brain during embryonic and early postnatal development
(Cuadros and Navascués, 1998). Under normal conditions, microglia are distributed
throughout the neuropil and appear ‘ramified’ with a small soma and numerous thin
branched processes which contact neurons, astrocytes, axon terminals, dendritic
spines and blood vessels. These processes regularly extend and retract within their
territory (Nimmerjahn et al., 2005; Giaume et al., 2007) to monitor the status of the
environment and cleanse the extracellular fluid of metabolites and toxic factors (Fetler
and Amigorena, 2005). Ramified microglia have been implicated in promoting synapse
formation through the production of microglial brain-derived neurotrophic factor
(BDNF) (Parkhurst et al., 2013), and their processes have been shown to contact
multiple synapse-associated elements during normal conditions, particularly transient
dendritic spines, and these microglial-synapse interactions were found to be regulated
by experience. Therefore, microglia may also play an active role in modifying or
eliminating synapses in the healthy brain (Tremblay et al., 2010).
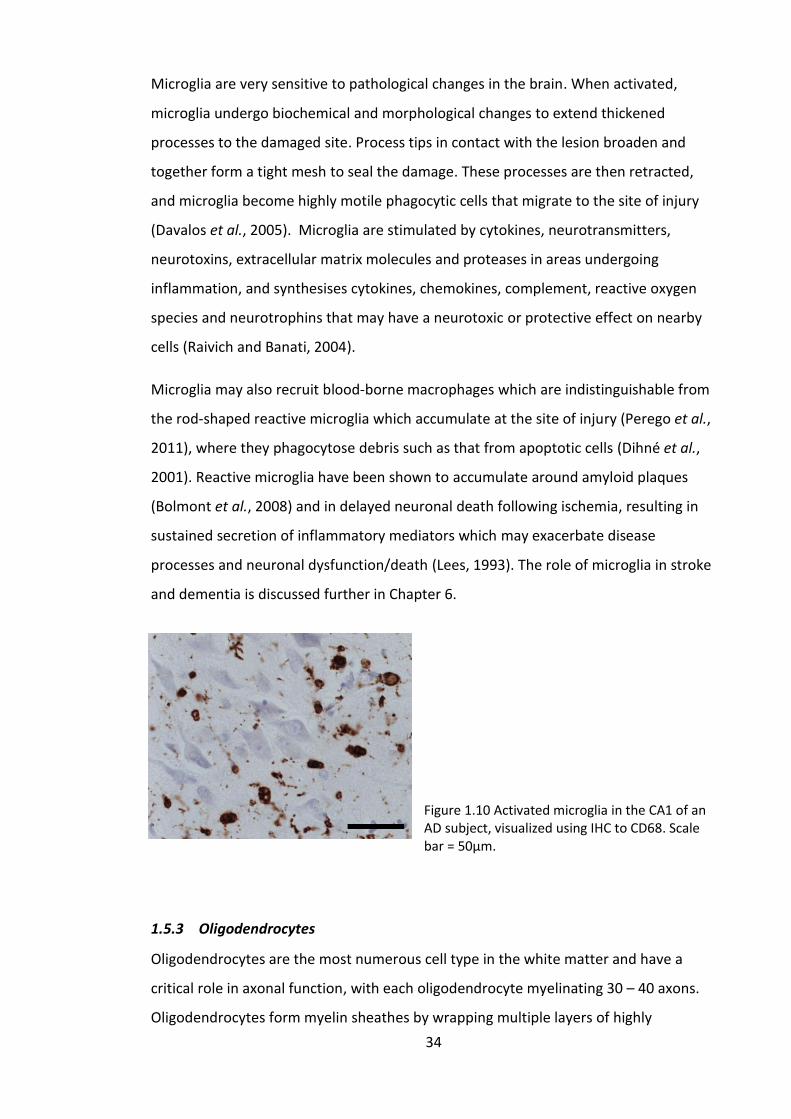
34
Microglia are very sensitive to pathological changes in the brain. When activated,
microglia undergo biochemical and morphological changes to extend thickened
processes to the damaged site. Process tips in contact with the lesion broaden and
together form a tight mesh to seal the damage. These processes are then retracted,
and microglia become highly motile phagocytic cells that migrate to the site of injury
(Davalos et al., 2005). Microglia are stimulated by cytokines, neurotransmitters,
neurotoxins, extracellular matrix molecules and proteases in areas undergoing
inflammation, and synthesises cytokines, chemokines, complement, reactive oxygen
species and neurotrophins that may have a neurotoxic or protective effect on nearby
cells (Raivich and Banati, 2004).
Microglia may also recruit blood-borne macrophages which are indistinguishable from
the rod-shaped reactive microglia which accumulate at the site of injury (Perego et al.,
2011), where they phagocytose debris such as that from apoptotic cells (Dihné et al.,
2001). Reactive microglia have been shown to accumulate around amyloid plaques
(Bolmont et al., 2008) and in delayed neuronal death following ischemia, resulting in
sustained secretion of inflammatory mediators which may exacerbate disease
processes and neuronal dysfunction/death (Lees, 1993). The role of microglia in stroke
and dementia is discussed further in Chapter 6.
Figure 1.10 Activated microglia in the CA1 of an AD subject, visualized using IHC to CD68. Scale bar = 50µm.
1.5.3 Oligodendrocytes
Oligodendrocytes are the most numerous cell type in the white matter and have a
critical role in axonal function, with each oligodendrocyte myelinating 30 – 40 axons.
Oligodendrocytes form myelin sheathes by wrapping multiple layers of highly
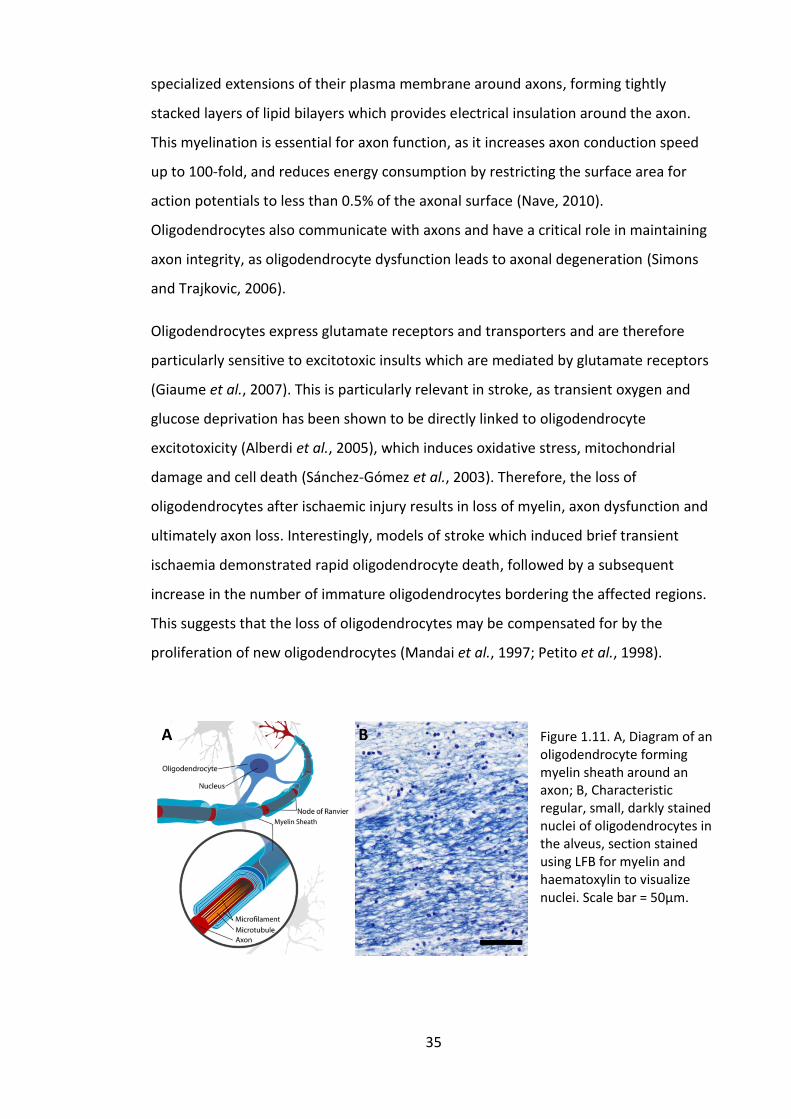
35
specialized extensions of their plasma membrane around axons, forming tightly
stacked layers of lipid bilayers which provides electrical insulation around the axon.
This myelination is essential for axon function, as it increases axon conduction speed
up to 100-fold, and reduces energy consumption by restricting the surface area for
action potentials to less than 0.5% of the axonal surface (Nave, 2010).
Oligodendrocytes also communicate with axons and have a critical role in maintaining
axon integrity, as oligodendrocyte dysfunction leads to axonal degeneration (Simons
and Trajkovic, 2006).
Oligodendrocytes express glutamate receptors and transporters and are therefore
particularly sensitive to excitotoxic insults which are mediated by glutamate receptors
(Giaume et al., 2007). This is particularly relevant in stroke, as transient oxygen and
glucose deprivation has been shown to be directly linked to oligodendrocyte
excitotoxicity (Alberdi et al., 2005), which induces oxidative stress, mitochondrial
damage and cell death (Sánchez-Gómez et al., 2003). Therefore, the loss of
oligodendrocytes after ischaemic injury results in loss of myelin, axon dysfunction and
ultimately axon loss. Interestingly, models of stroke which induced brief transient
ischaemia demonstrated rapid oligodendrocyte death, followed by a subsequent
increase in the number of immature oligodendrocytes bordering the affected regions.
This suggests that the loss of oligodendrocytes may be compensated for by the
proliferation of new oligodendrocytes (Mandai et al., 1997; Petito et al., 1998).
Figure 1.11. A, Diagram of an oligodendrocyte forming myelin sheath around an axon; B, Characteristic regular, small, darkly stained nuclei of oligodendrocytes in the alveus, section stained using LFB for myelin and haematoxylin to visualize nuclei. Scale bar = 50µm.
36
1.6 Aims and hypotheses
This study investigated neuronal changes in differentially vulnerable hippocampal
subfields in stroke survivors from the CogFAST cohort in relation to clinicopathological
findings. The main research aims were to:
Identify novel pathological features discriminating subjects who had developed
delayed post-stroke dementia from those who maintained cognitive function
after stroke.
Investigate possible mechanisms related to clinical and pathological changes in
PSD, or associated with a protective role in PSND subjects.
Elucidate the importance of different disease processes by comparing findings
in post-stroke subjects with pathologically confirmed pure ‘AD’ and ‘VaD’
subjects, as well as cognitively normal elderly controls.
My main hypotheses for each chapter are described below:
For the study described in Chapter 3, I hypothesised that hippocampal neuron
loss and reductions in neuronal soma volume may contribute to cognitive
impairment after stroke and hippocampal atrophy.
In Chapter 4, I hypothesised that a greater burden of hippocampal AD
pathology and dysfunctional autophagy may be associated with neuronal
atrophy and cognitive impairment after stroke.
In Chapter 5, I hypothesised that loss of apical dendritic arbour and synapses
would be associated with neuronal volume reductions and cognitive
impairment caused by greater CVD or degenerative disease mechanisms.
In Chapter 6, I hypothesised that damage to hippocampal axons may be related
to neuronal volume changes and cognitive impairment after stroke. I also
hypothesised that pathological changes to astrocytes and microglia may be
related to neuronal changes, disease pathology, and cognitive impairment.
37
Chapter 2. Materials and Methods
2.1 Introduction
The main focus of this study was to compare pathological changes and disease
mechanisms in stroke survivors who developed PSD with those who maintained
normal cognitive function. To achieve this, tissue was analysed from subjects from the
CogFAST study and compared with elderly controls and pathologically defined
dementia groups (AD, VaD and mixed AD with VaD).
Tissue from a non-human primate (baboon) model of acute cerebral hypoperfusion
was also analysed to provide insight into acute neuronal changes in an experimental
animal model of CVD. The model also allowed comparison between immersion fixed
(human) and perfusion fixed (baboon) tissue to determine the influence of post
mortem delay on the results observed in human tissue.
2.2 Subject selection and clinical diagnosis
2.2.1 CogFAST study design
Stroke patients over 75 years old were recruited from hospital-based stroke registers
in North East England providing they were not demented according to DSM-IIIR
(Diagnostic and Statistical Manual of Mental Disorders, Third Edition, Revised) criteria,
did not show signs cognitive impairment at baseline three months after stroke, and
had no disabilities that would impair cognitive testing (Allan et al., 2011). A total of 355
eligible stroke patients gave written informed consent to participate in the Cognitive
Function After Stroke (CogFAST) study. Ethical approval was given by the Joint Ethics
Committee of Newcastle and North Tyneside Health Authority, Newcastle University
and Northumbria University.
Medical histories were documented for all CogFAST participants. The mean age at
baseline was 80 (SD ±4.1 (SD)) and the median number of baseline cardiovascular risk
factors was 2 (range 1-3)(Ballard et al., 2003b). Additional details on the clinical
38
characteristics of the CogFAST cohort are described in detail in (Ballard et al., 2003a;
Ballard et al., 2003b).
All participants received annual clinical and cognitive follow-up assessments including
the Mini Mental State Exam (MMSE)(Folstein et al., 1975) to screen for dementia and
the Cambridge Cognitive Examination (CAMCOG) section B, the cognitive and self-
contained part of the Cambridge Examination for Mental Disorders of the Elderly (Roth
et al., 1986), described in section 1.3 (page 14). The CAMCOG test generated a global
cognitive score (/107) and subscores for memory (/27) and executive function (/28).
Mean global CAMCOG score at baseline was 85.1 (SD ±8.96). Additional details of all
components of the follow-up battery are described in (Allan et al., 2011). Over 60
patients who came to autopsy donated their brains for further research.
2.2.2 Neuropathological assessment and dementia diagnoses
Final diagnoses of VaD, AD or MD were based on both clinical (Diagnostic and
Statistical Manual of Mental Disorders, Fourth Edition criteria for dementia) and
neuropathological data at clinicopathological consensus meetings. Clinical diagnosis of
dementia was made if there was evidence of memory impairment and one or more of
aphasia, agnosia or disturbance of executive function severe enough to cause
significant impairment in social or occupational functioning and represent a significant
decline from a previous level of functioning. A clinical diagnosis of AD was made when
in addition to these deficits, the course was characterized by gradual onset and
continuing cognitive decline, and the cognitive deficits could not be attributed to other
central nervous system, systemic or substance-induced conditions or delirium. A
clinical diagnosis of VaD was made when in addition to the cognitive deficits, subjects
demonstrated evidence of focal neurological signs or laboratory evidence of
cerebrovascular disease related to the disturbance (Americal Psychiatric Association:
Diagnostic and Statistical Manual of Mental Disorders, Fourth Edition, 2000).
Neuropathological assessment of all CogFAST subjects and VaD, AD and MD subjects
was carried by out by experienced neuropathologists (T. M. Polvikoski, R. Perry and J.
Attems) using standard protocols including visual inspection of macroscopic and
microscopic infarcts, CERAD rating of neuritic plaques and Braak staging of tau
pathology (Mirra et al., 1991; Braak and Braak, 1996), as described in Section 1.2.2.
39
CERAD diagnostic criteria are based on semi-quantitative assessment of neocortical
neuritic plaques (with thickened silver-positive neurites) which generates an age-
related plaque score, which is integrated with clinical information to determine the
level of certainty of the diagnosis of AD. Overall distribution of vascular amyloid
deposition and proportion of plaques containing amyloid cores was also noted (Mirra
et al., 1991). Pathological diagnosis of AD was made with Braak stage V-VI and
moderate-severe CERAD scores in the absence in significant vascular pathology (Kalaria
et al., 2004). Pathological diagnosis of VaD was assigned if there was evidence of
multiple or cystic infarcts, lacunae, microinfarcts and small vessel disease, with Braak
stage <IV and absence of other primary neurodegenerative disease. Pathological
diagnosis of MD was assigned if there was evidence of CVD severe enough to cause
VaD, together with sufficient AD pathology for a diagnosis of AD. Although control
subjects were not psychologically assessed before death, they did not show any
evidence of neurological disease or cognitive impairment. A vascular disease severity
rating was also carried out in CogFAST subjects, generating scores for global vascular
pathology (/20) and hippocampal subscores (/4). This method rated cerebrovascular
lesions including arteriolosclerosis, amyloid angiopathy, perivascular hemosiderin
leakage, perivascular spaces dilation, myelin loss and cortical micro- (<0.05cm) and
large-infarcts (>0.5cm) on a 0-3 scale as described in (Deramecourt et al., 2012).
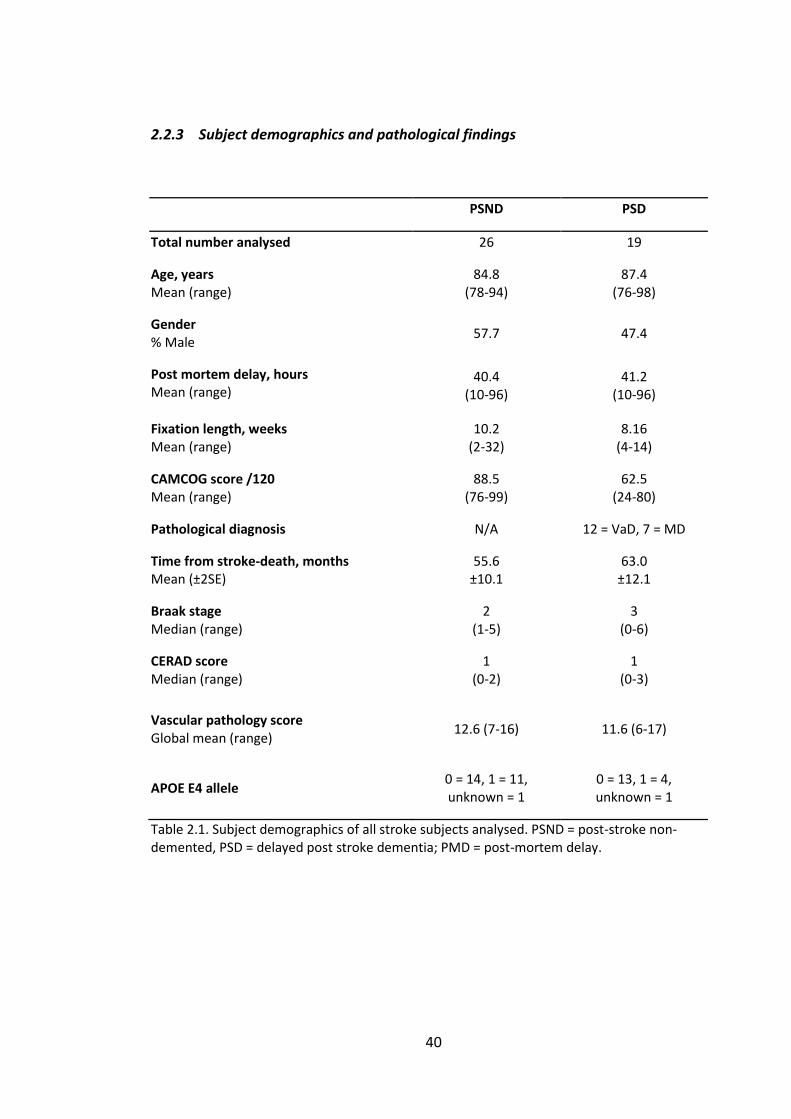
40
2.2.3 Subject demographics and pathological findings
PSND PSD
Total number analysed 26 19
Age, years Mean (range)
84.8 (78-94)
87.4 (76-98)
Gender % Male
57.7 47.4
Post mortem delay, hours Mean (range)
40.4 (10-96)
41.2 (10-96)
Fixation length, weeks Mean (range)
10.2 (2-32)
8.16 (4-14)
CAMCOG score /120 Mean (range)
88.5 (76-99)
62.5 (24-80)
Pathological diagnosis N/A 12 = VaD, 7 = MD
Time from stroke-death, months Mean (±2SE)
55.6 ±10.1
63.0 ±12.1
Braak stage Median (range)
2 (1-5)
3 (0-6)
CERAD score Median (range)
1 (0-2)
1 (0-3)
Vascular pathology score Global mean (range)
12.6 (7-16)
11.6 (6-17)
APOE E4 allele 0 = 14, 1 = 11, unknown = 1
0 = 13, 1 = 4, unknown = 1
Table 2.1. Subject demographics of all stroke subjects analysed. PSND = post-stroke non-demented, PSD = delayed post stroke dementia; PMD = post-mortem delay.
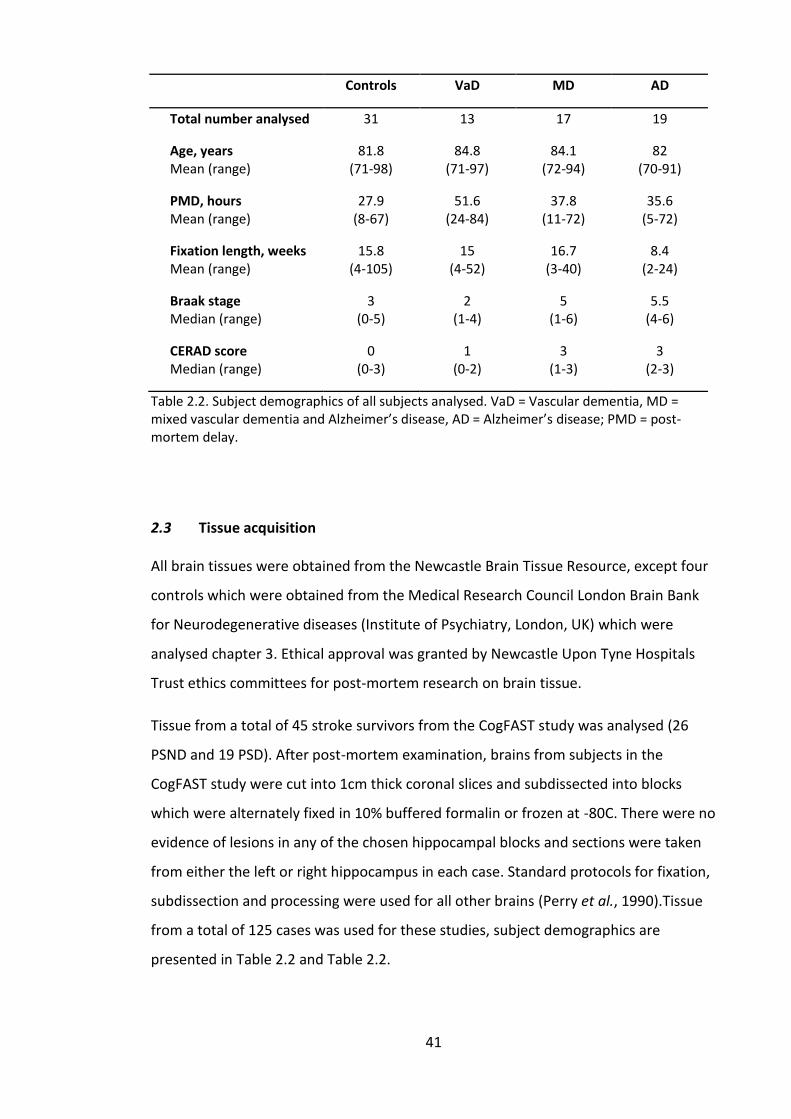
41
Controls VaD MD AD
Total number analysed 31 13 17 19
Age, years Mean (range)
81.8 (71-98)
84.8 (71-97)
84.1 (72-94)
82 (70-91)
PMD, hours Mean (range)
27.9 (8-67)
51.6 (24-84)
37.8 (11-72)
35.6 (5-72)
Fixation length, weeks Mean (range)
15.8 (4-105)
15 (4-52)
16.7 (3-40)
8.4 (2-24)
Braak stage Median (range)
3 (0-5)
2 (1-4)
5 (1-6)
5.5 (4-6)
CERAD score Median (range)
0 (0-3)
1 (0-2)
3 (1-3)
3 (2-3)
Table 2.2. Subject demographics of all subjects analysed. VaD = Vascular dementia, MD = mixed vascular dementia and Alzheimer’s disease, AD = Alzheimer’s disease; PMD = post-mortem delay.
2.3 Tissue acquisition
All brain tissues were obtained from the Newcastle Brain Tissue Resource, except four
controls which were obtained from the Medical Research Council London Brain Bank
for Neurodegenerative diseases (Institute of Psychiatry, London, UK) which were
analysed chapter 3. Ethical approval was granted by Newcastle Upon Tyne Hospitals
Trust ethics committees for post-mortem research on brain tissue.
Tissue from a total of 45 stroke survivors from the CogFAST study was analysed (26
PSND and 19 PSD). After post-mortem examination, brains from subjects in the
CogFAST study were cut into 1cm thick coronal slices and subdissected into blocks
which were alternately fixed in 10% buffered formalin or frozen at -80C. There were no
evidence of lesions in any of the chosen hippocampal blocks and sections were taken
from either the left or right hippocampus in each case. Standard protocols for fixation,
subdissection and processing were used for all other brains (Perry et al., 1990).Tissue
from a total of 125 cases was used for these studies, subject demographics are
presented in Table 2.2 and Table 2.2.
42
2.4 Paraffin-embedded tissue preparation
After immersion fixation blocks were processed (dehydrated in alcohol and cleared in
xylene), and embedded in paraffin wax. Unless stated otherwise, standard protocols
described below were used for all tissue sectioning, dewaxing and mounting.
2.4.1 Sectioning, dewaxing and mounting
Sections were cut using a Shandon FinesseE+ rotary microtome from predefined
paraffin-embedded hippocampal blocks as close as possible to coronal level 18-20
according to the Newcastle Brain Map (Perry and Oakley, 1993). This level was defined
as between the pregeniculate nucleus and the pulvinar at which the emergence of the
ventricle is visible (Figure 2.1 A), where the dentate gyrus and CA regions 1-4 are
clearly identifiable (Figure 2.1 B).
To make slides more adhesive for tissue sections, clean slides were immersed in
acetone for 5 minutes, drained of excess fluid then placed in a 2% solution of APES (3
aminopropyl triethoxysilane) in acetone for 5 minutes. After draining, excess reagent
was removed by gently dipping slides in fresh distilled water. Slides were dried at 45°C
and stored until use.
Before staining, sections were rehydrated through two 10 minute changes of xylene
and decreasing concentrations of alcohol for 1 minute each in 100%, 95%, 75% and
50%, then washed in water for 5 minutes.
After staining, sections were dehydrated in 95% ethanol for 1 minute and two changes
of 100% ethanol for 2 minutes each. Sections were then immersed in two changes of
xylene for a minimum of 2 minutes each before coverslips were applied with DPX.
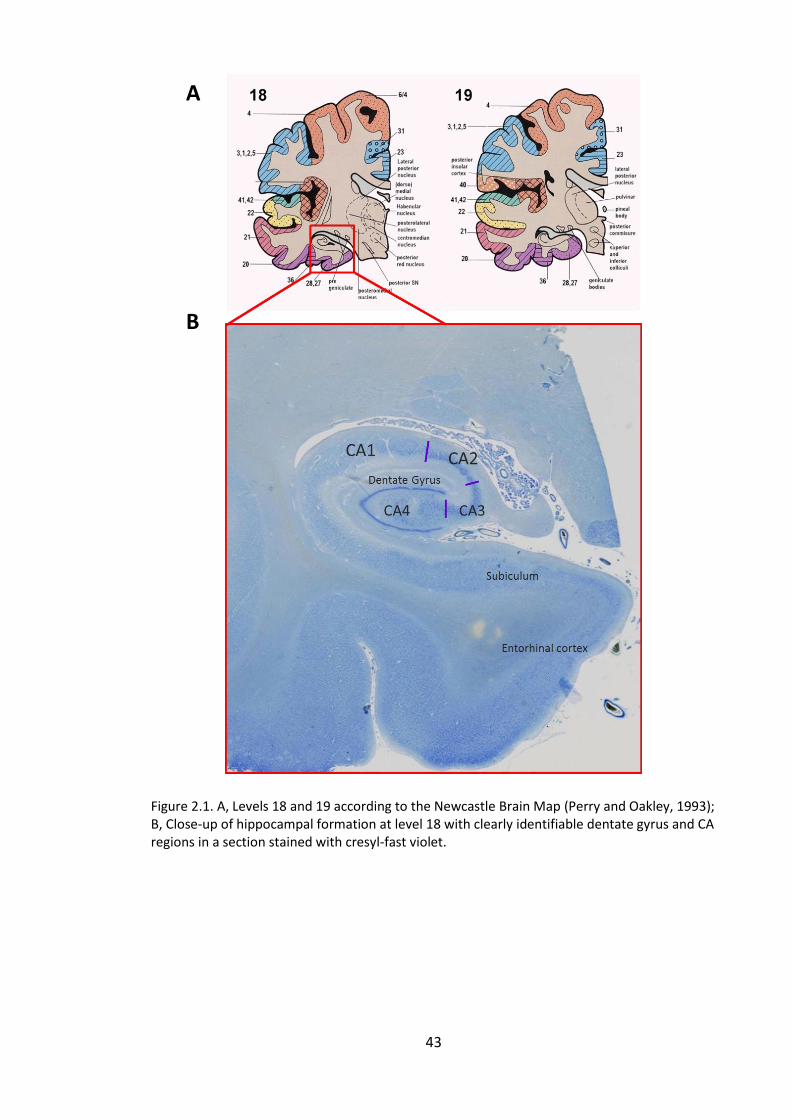
43
Figure 2.1. A, Levels 18 and 19 according to the Newcastle Brain Map (Perry and Oakley, 1993); B, Close-up of hippocampal formation at level 18 with clearly identifiable dentate gyrus and CA regions in a section stained with cresyl-fast violet.
A
B
44
2.5 Histology
2.5.1 Cresyl Fast Violet (CFV)
Cresyl Fast Violet (CFV) was used to stain tissue to visualise neuronal soma, nuclei and
nucleoli. Sections were dewaxed and rehydrated to 95% alcohol for 1 minute,
immersed in 1% acid alcohol for 5 minutes and rinsed in 3 changes of deionized water.
Sections were incubated for 5 minutes in CFV solution pre-heated to 60°C, then cooled
for 5 minutes. CFV solution was made using 20-25mls stock solution (0.2% w/v cresyl
fast violet in deionized water) in 500mls deionized water and 500mls acetate buffer
(13.5mls acetic acid, 23.5g sodium acetate to 2000mls in deionized water, pH 4.5).
Sections were differentiated in 95% alcohol until the background was pale purple.
Staining consistency was checked under a microscope before sections were
dehydrated, cleared in xylene and mounted.
2.5.2 Luxol Fast Blue (LFB)
Luxol Fast Blue (LFB) is a copper phthalocyanine dye that is attracted to the
lipoproteins of the myelin sheath which stains myelinated axons deep blue, therefore,
LFB was used to visualize myelin in tissue sections. Sections were dewaxed and
rehydrated to 95% ethanol, then incubated for 2 hours in LFB stain (1g of Luxol fast
blue and 5mls of 10% acetic acid in 1000mls of 95% alcohol) preheated to 60C.
Sections were cooled for 10 minutes, then washed in 70% ethanol for 1 minute.
Sections were then differentiated in 4 cycles of; 1 minute in distilled water, 10 seconds
in LiCoO3 and 1 minute in 70% ethanol. After 4 cycles of differentiation sections were
viewed under a microscope to assess staining. If the grey matter still appeared blue,
sections were differentiated further until the grey matter appeared clear. When
sections were consistently stained they were immersed in water ready for the CFV
counterstain. Sections were immersed in CFV solution (0.1% CFV in 1% acetic acid) for
2 minutes at room temperature, washed in distilled water and differentiated in 95%
ethanol. Sections were checked for staining consistency before being dehydrated,
cleared in xylene and mounted.
45
2.5.3 Haematoxylin and Eosin (H & E)
Haematoxylin and eosin (H & E) was used to visualize cell nuclei in blue and other
eosinophilic structures in shades of red, pink and orange. Sections were dewaxed and
rehydrated to water then immersed in haematoxylin solution for 3 minutes (5g
haematoxylin, 0.5g sodium iodate, 40ml glacial acetic acid, 300ml glycerine, 700ml
distilled water). After a wash in tap water, sections were dipped in 1% acid alcohol for
40 seconds and washed again in water. Sections were then immersed in ammonia tap
water for 1 minute and washed in water. Sections were then immersed in eosin for 3
minutes (10g eosin, 0.25g phloxine, 0.25g erytheosin, 1000ml 20% alcohol). After being
washed in tap water sections were differentiated in 95% ethanol to remove excess
stain. Slides were checked under a microscope for staining consistency before
mounting.
2.6 Standard immunohistochemistry (IHC) protocol
All immunohistochemical staining was performed using the following protocol unless
stated otherwise. To minimize staining variability, wherever possible all sections
stained with each antibody were stained simultaneously. Table 2.3 details the antigen
retrieval method, buffer, block and antibody concentrations used in each experiment.
Paraffin-embedded sections were dewaxed rehydrated to water. Antigen retrieval was
performed using one of the following techniques:
For microwave antigen retrieval, sections were simmered in sodium citrate
solution (diluted in deionized water from a 10x stock solution of 2.94g
trisodium citrate in 1 litre of distilled water, pH 6) for 11 minutes in the
microwave. Sections were left in the solution to cool for 20 minutes and
washed in tap water.
For pressure cooker antigen retrieval, sections were immersed in boiling 10mM
citrate buffer (pH 6) and cooked under pressure for ~8 minutes until pressure
was reached. Sections were then rinsed in tap water.
For formic acid antigen retrieval, sections were dipped in 40% formic acid, then
immersed in concentrated formic acid (10ml 99% formic acid in 90ml distilled
46
water, pH 2) for 4 hours (in a sealed container in a fume hood). Sections were
then dipped in 40% formic acid and transferred to running tap water for 10
minutes.
After antigen retrieval, endogenous peroxidase activity was quenched using 0.3%
hydrogen peroxide in buffer for 15 minutes. The buffers used were tris-buffered saline
with 0.5% Triton-X (TBS-TX, 12g tris and 81g NaCl in 10l distilled water, pH 7.6), or
phosphate buffered saline with 0.5% Triton-X (PBS-TX, 2.76g NaH2PO4.1H20, 11.36g
Na2HPO4 anhydrous, 85g NaCl, in 10l distilled water, pH 7.2).
After three washes in buffer, sections were incubated for 30 minutes at room
temperature in blocking serum diluted in buffer. Excess solution was removed then
sections were incubated overnight at 4C with the primary antibody. Sections were
then washed in three changes of buffer, then incubated with 0.5% secondary antibody
(biotinylated Universal antibody, Vector Vectastain Universal kit) and 1.5% blocking
serum (15µl per 1ml TBS-TX) for 30 minutes at room temperature. Sections were
washed in three changes of buffer then incubated with 20µls Avidin DH (reagent A)
and 20µls of the paired biotinylated enzyme (Reagent B) from the Vector Vectastain kit
per 1ml TBS-TX. Sections were washed in three changes of buffer and visualized with
diaminobenzidine (DAB) for 5 minutes (100mg DAB and 167µl hydrogen peroxide per
400ml TBS). A pale haematoxylin counterstain was often used to visualize cell nuclei.
The method used to visualize GFAP differed slightly from this standard protocol, as
nickel-DAB was used in the final stage. After the final wash in buffer (PBS-TX), sections
were washed in acetate buffer (3.4g sodium acetate trihydrate per 250ml distilled
water, to pH 6 with acetic acid). Following this wash, a nickel-DAB solution (2.5g di-
ammonium nickel-sulphate, 100ml acetate buffer, 50mg DAB, 40mg ammonium
chloride, 200mg beta-D-glucose, 100µl glucose oxidase) was pipetted onto the sections
and incubated for 10 minutes. Slides were then washed in acetate buffer, before being
dehydrated, cleared in xylene and mounted.
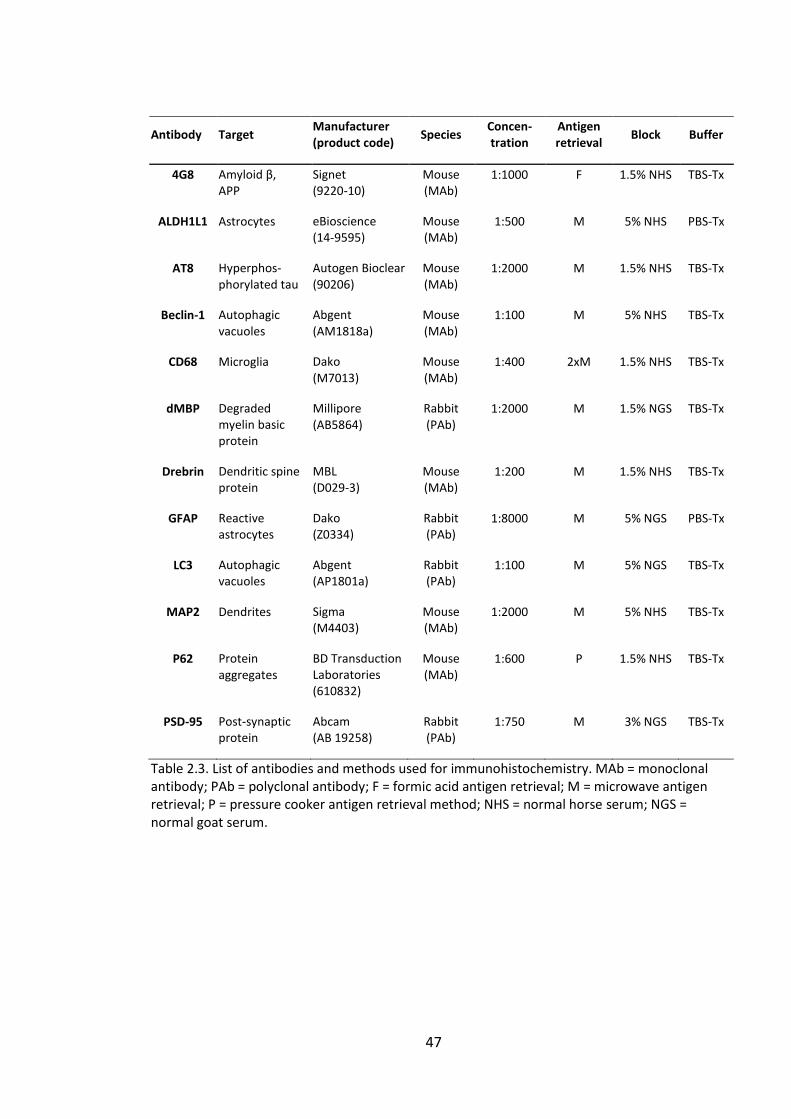
47
Antibody Target Manufacturer (product code)
Species Concen-tration
Antigen retrieval
Block Buffer
4G8 Amyloid β, APP
Signet (9220-10)
Mouse (MAb)
1:1000 F 1.5% NHS TBS-Tx
ALDH1L1 Astrocytes eBioscience (14-9595)
Mouse (MAb)
1:500 M 5% NHS PBS-Tx
AT8 Hyperphos-phorylated tau
Autogen Bioclear (90206)
Mouse (MAb)
1:2000 M 1.5% NHS TBS-Tx
Beclin-1 Autophagic vacuoles
Abgent (AM1818a)
Mouse (MAb)
1:100 M 5% NHS TBS-Tx
CD68 Microglia Dako (M7013)
Mouse (MAb)
1:400 2xM 1.5% NHS TBS-Tx
dMBP Degraded myelin basic protein
Millipore (AB5864)
Rabbit (PAb)
1:2000 M 1.5% NGS TBS-Tx
Drebrin Dendritic spine protein
MBL (D029-3)
Mouse (MAb)
1:200 M 1.5% NHS TBS-Tx
GFAP Reactive astrocytes
Dako (Z0334)
Rabbit (PAb)
1:8000 M 5% NGS PBS-Tx
LC3 Autophagic vacuoles
Abgent (AP1801a)
Rabbit (PAb)
1:100 M 5% NGS TBS-Tx
MAP2 Dendrites Sigma (M4403)
Mouse (MAb)
1:2000 M 5% NHS TBS-Tx
P62 Protein aggregates
BD Transduction Laboratories (610832)
Mouse (MAb)
1:600 P 1.5% NHS TBS-Tx
PSD-95 Post-synaptic protein
Abcam (AB 19258)
Rabbit (PAb)
1:750 M 3% NGS TBS-Tx
Table 2.3. List of antibodies and methods used for immunohistochemistry. MAb = monoclonal antibody; PAb = polyclonal antibody; F = formic acid antigen retrieval; M = microwave antigen retrieval; P = pressure cooker antigen retrieval method; NHS = normal horse serum; NGS = normal goat serum.
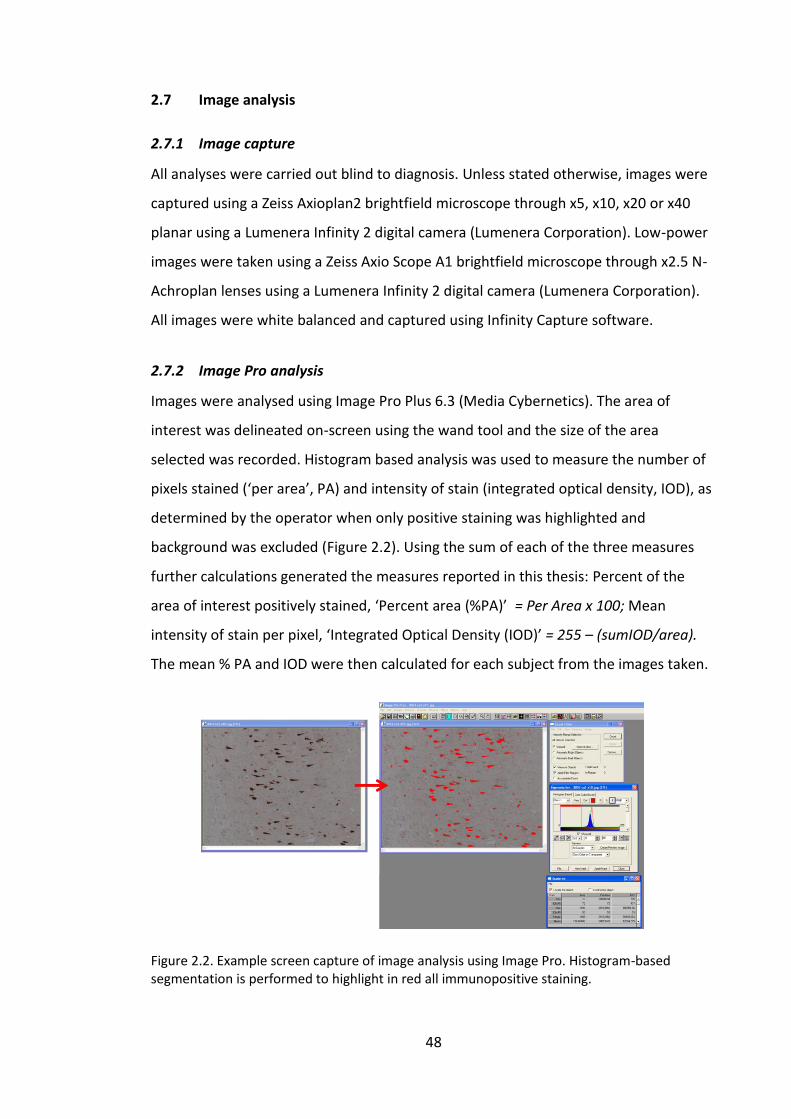
48
2.7 Image analysis
2.7.1 Image capture
All analyses were carried out blind to diagnosis. Unless stated otherwise, images were
captured using a Zeiss Axioplan2 brightfield microscope through x5, x10, x20 or x40
planar using a Lumenera Infinity 2 digital camera (Lumenera Corporation). Low-power
images were taken using a Zeiss Axio Scope A1 brightfield microscope through x2.5 N-
Achroplan lenses using a Lumenera Infinity 2 digital camera (Lumenera Corporation).
All images were white balanced and captured using Infinity Capture software.
2.7.2 Image Pro analysis
Images were analysed using Image Pro Plus 6.3 (Media Cybernetics). The area of
interest was delineated on-screen using the wand tool and the size of the area
selected was recorded. Histogram based analysis was used to measure the number of
pixels stained (‘per area’, PA) and intensity of stain (integrated optical density, IOD), as
determined by the operator when only positive staining was highlighted and
background was excluded (Figure 2.2). Using the sum of each of the three measures
further calculations generated the measures reported in this thesis: Percent of the
area of interest positively stained, ‘Percent area (%PA)’ = Per Area x 100; Mean
intensity of stain per pixel, ‘Integrated Optical Density (IOD)’ = 255 – (sumIOD/area).
The mean % PA and IOD were then calculated for each subject from the images taken.
Figure 2.2. Example screen capture of image analysis using Image Pro. Histogram-based segmentation is performed to highlight in red all immunopositive staining.
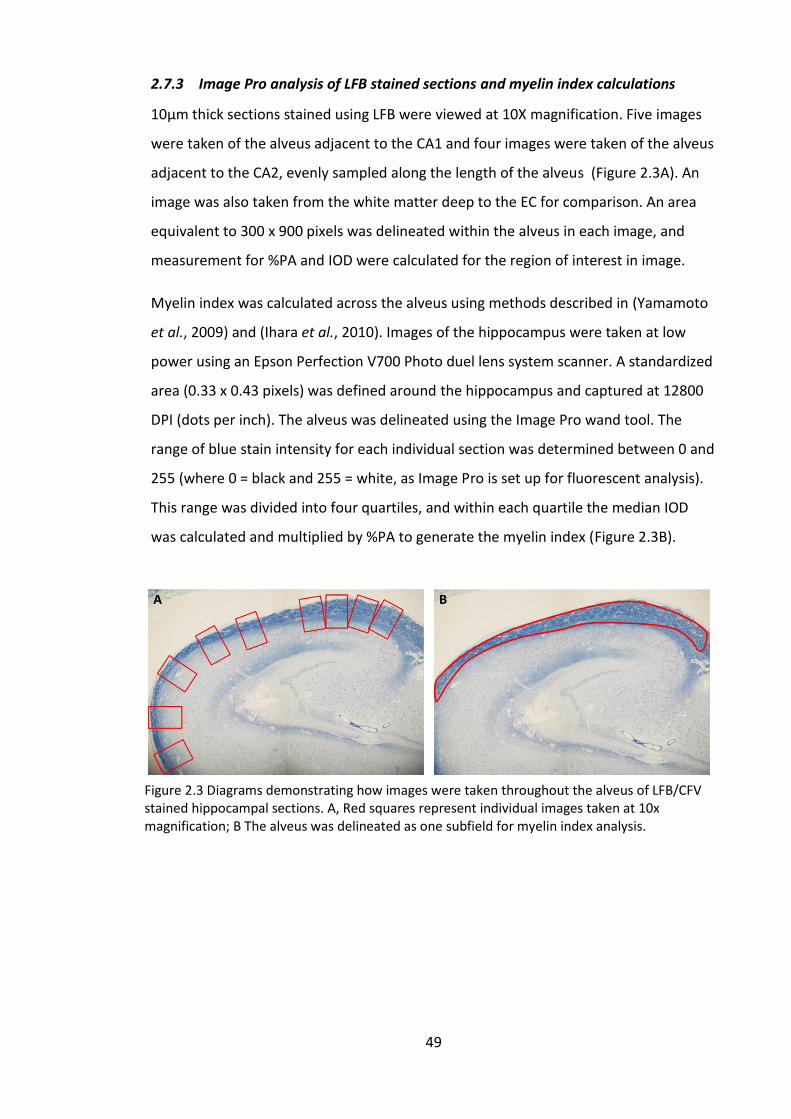
49
2.7.3 Image Pro analysis of LFB stained sections and myelin index calculations
10µm thick sections stained using LFB were viewed at 10X magnification. Five images
were taken of the alveus adjacent to the CA1 and four images were taken of the alveus
adjacent to the CA2, evenly sampled along the length of the alveus (Figure 2.3A). An
image was also taken from the white matter deep to the EC for comparison. An area
equivalent to 300 x 900 pixels was delineated within the alveus in each image, and
measurement for %PA and IOD were calculated for the region of interest in image.
Myelin index was calculated across the alveus using methods described in (Yamamoto
et al., 2009) and (Ihara et al., 2010). Images of the hippocampus were taken at low
power using an Epson Perfection V700 Photo duel lens system scanner. A standardized
area (0.33 x 0.43 pixels) was defined around the hippocampus and captured at 12800
DPI (dots per inch). The alveus was delineated using the Image Pro wand tool. The
range of blue stain intensity for each individual section was determined between 0 and
255 (where 0 = black and 255 = white, as Image Pro is set up for fluorescent analysis).
This range was divided into four quartiles, and within each quartile the median IOD
was calculated and multiplied by %PA to generate the myelin index (Figure 2.3B).
Figure 2.3 Diagrams demonstrating how images were taken throughout the alveus of LFB/CFV stained hippocampal sections. A, Red squares represent individual images taken at 10x magnification; B The alveus was delineated as one subfield for myelin index analysis.
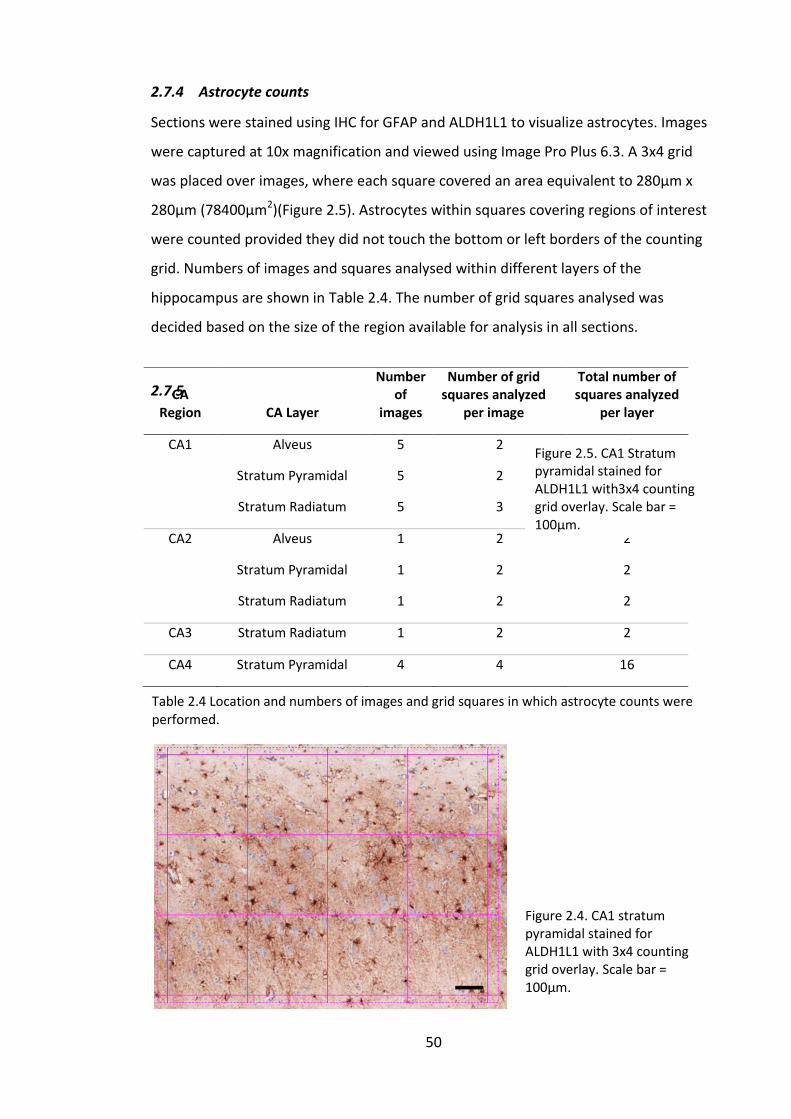
50
2.7.4 Astrocyte counts
Sections were stained using IHC for GFAP and ALDH1L1 to visualize astrocytes. Images
were captured at 10x magnification and viewed using Image Pro Plus 6.3. A 3x4 grid
was placed over images, where each square covered an area equivalent to 280µm x
280µm (78400µm2)(Figure 2.5). Astrocytes within squares covering regions of interest
were counted provided they did not touch the bottom or left borders of the counting
grid. Numbers of images and squares analysed within different layers of the
hippocampus are shown in Table 2.4. The number of grid squares analysed was
decided based on the size of the region available for analysis in all sections.
2.7.5
Table 2.4 Location and numbers of images and grid squares in which astrocyte counts were performed.
CA Region CA Layer
Number of
images
Number of grid squares analyzed
per image
Total number of squares analyzed
per layer
CA1 Alveus 5 2 10
Stratum Pyramidal 5 2 10
Stratum Radiatum 5 3 15
CA2 Alveus 1 2 2
Stratum Pyramidal 1 2 2
Stratum Radiatum 1 2 2
CA3 Stratum Radiatum 1 2 2
CA4 Stratum Pyramidal 4 4 16
Figure 2.5. CA1 Stratum pyramidal stained for ALDH1L1 with3x4 counting grid overlay. Scale bar = 100µm.
Figure 2.4. CA1 stratum pyramidal stained for ALDH1L1 with 3x4 counting grid overlay. Scale bar = 100µm.
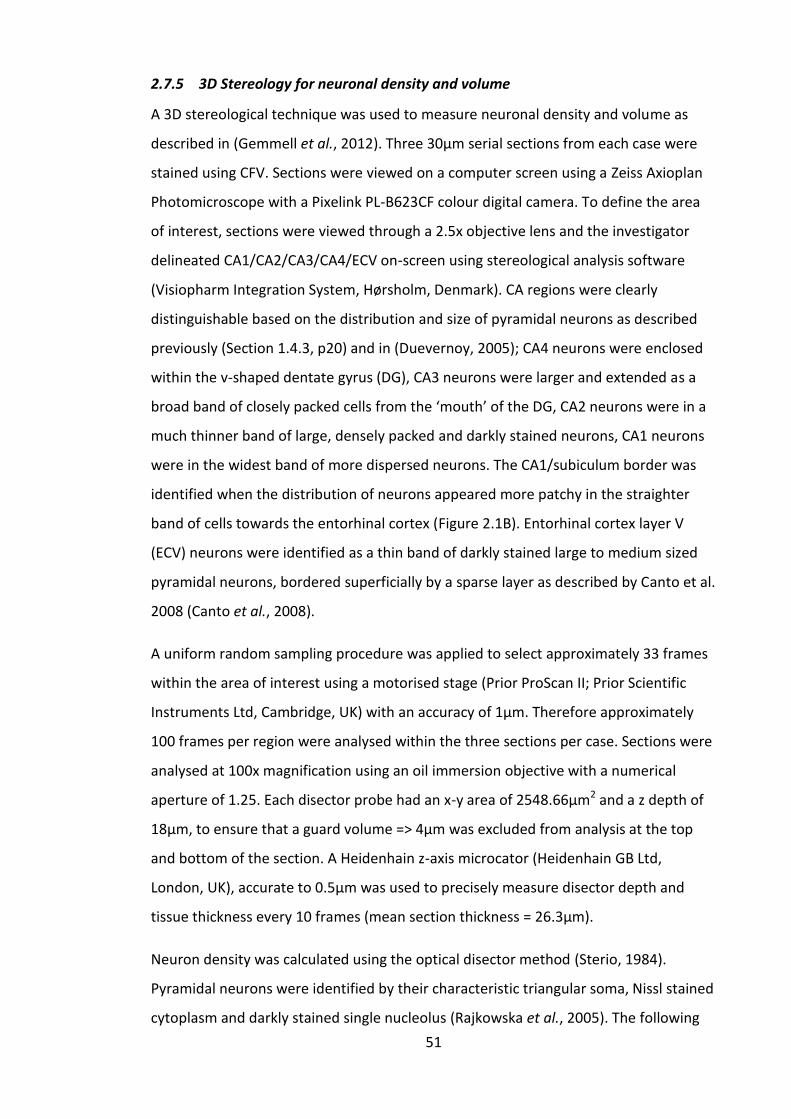
51
2.7.5 3D Stereology for neuronal density and volume
A 3D stereological technique was used to measure neuronal density and volume as
described in (Gemmell et al., 2012). Three 30µm serial sections from each case were
stained using CFV. Sections were viewed on a computer screen using a Zeiss Axioplan
Photomicroscope with a Pixelink PL-B623CF colour digital camera. To define the area
of interest, sections were viewed through a 2.5x objective lens and the investigator
delineated CA1/CA2/CA3/CA4/ECV on-screen using stereological analysis software
(Visiopharm Integration System, Hørsholm, Denmark). CA regions were clearly
distinguishable based on the distribution and size of pyramidal neurons as described
previously (Section 1.4.3, p20) and in (Duevernoy, 2005); CA4 neurons were enclosed
within the v-shaped dentate gyrus (DG), CA3 neurons were larger and extended as a
broad band of closely packed cells from the ‘mouth’ of the DG, CA2 neurons were in a
much thinner band of large, densely packed and darkly stained neurons, CA1 neurons
were in the widest band of more dispersed neurons. The CA1/subiculum border was
identified when the distribution of neurons appeared more patchy in the straighter
band of cells towards the entorhinal cortex (Figure 2.1B). Entorhinal cortex layer V
(ECV) neurons were identified as a thin band of darkly stained large to medium sized
pyramidal neurons, bordered superficially by a sparse layer as described by Canto et al.
2008 (Canto et al., 2008).
A uniform random sampling procedure was applied to select approximately 33 frames
within the area of interest using a motorised stage (Prior ProScan II; Prior Scientific
Instruments Ltd, Cambridge, UK) with an accuracy of 1µm. Therefore approximately
100 frames per region were analysed within the three sections per case. Sections were
analysed at 100x magnification using an oil immersion objective with a numerical
aperture of 1.25. Each disector probe had an x-y area of 2548.66µm2 and a z depth of
18µm, to ensure that a guard volume => 4µm was excluded from analysis at the top
and bottom of the section. A Heidenhain z-axis microcator (Heidenhain GB Ltd,
London, UK), accurate to 0.5µm was used to precisely measure disector depth and
tissue thickness every 10 frames (mean section thickness = 26.3µm).
Neuron density was calculated using the optical disector method (Sterio, 1984).
Pyramidal neurons were identified by their characteristic triangular soma, Nissl stained
cytoplasm and darkly stained single nucleolus (Rajkowska et al., 2005). The following
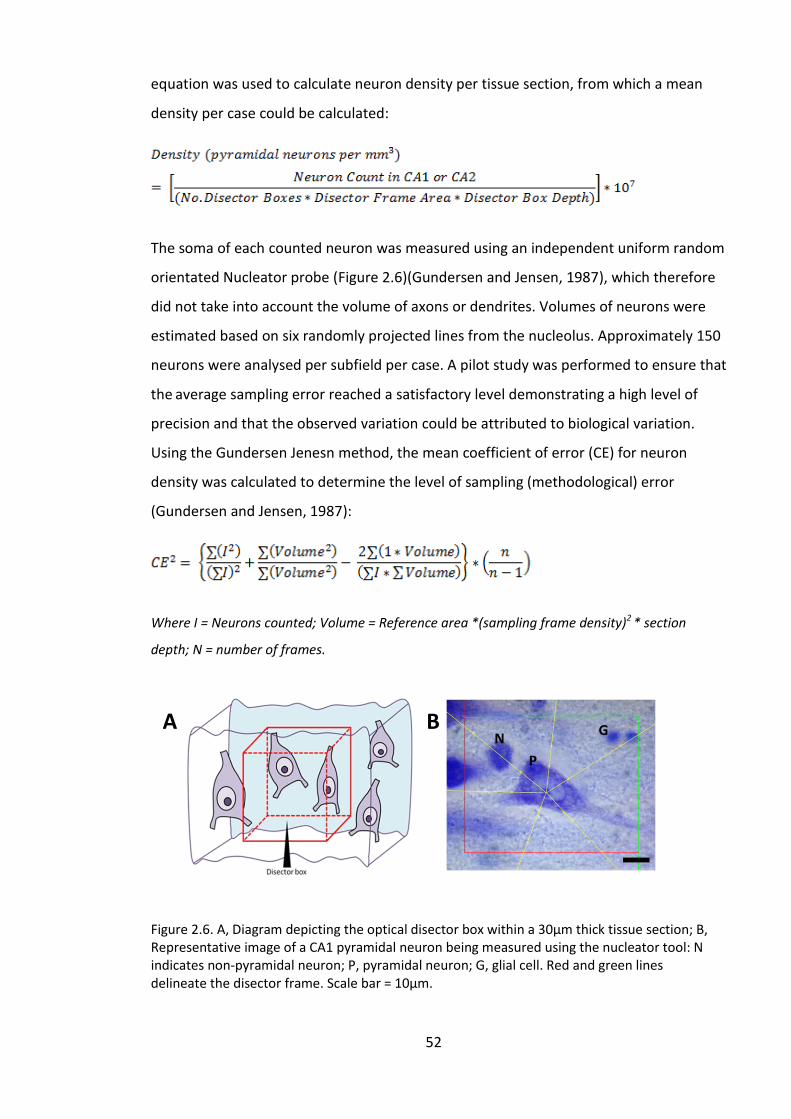
52
equation was used to calculate neuron density per tissue section, from which a mean
density per case could be calculated:
The soma of each counted neuron was measured using an independent uniform random
orientated Nucleator probe (Figure 2.6)(Gundersen and Jensen, 1987), which therefore
did not take into account the volume of axons or dendrites. Volumes of neurons were
estimated based on six randomly projected lines from the nucleolus. Approximately 150
neurons were analysed per subfield per case. A pilot study was performed to ensure that
the average sampling error reached a satisfactory level demonstrating a high level of
precision and that the observed variation could be attributed to biological variation.
Using the Gundersen Jenesn method, the mean coefficient of error (CE) for neuron
density was calculated to determine the level of sampling (methodological) error
(Gundersen and Jensen, 1987):
Where I = Neurons counted; Volume = Reference area *(sampling frame density)2 * section
depth; N = number of frames.
Figure 2.6. A, Diagram depicting the optical disector box within a 30µm thick tissue section; B, Representative image of a CA1 pyramidal neuron being measured using the nucleator tool: N indicates non-pyramidal neuron; P, pyramidal neuron; G, glial cell. Red and green lines delineate the disector frame. Scale bar = 10µm.
A B
53
2.7.6 3D stereology for dendritic length-density
A 3D stereological technique was used to calculate the length-density of dendrites in
the CA1 stratum radiatum. This technique had previously been applied to estimate the
length-density of the hippocampal microvasculature in CogFAST subjects (Burke et al.,
2013). Fifteen 30µm thick sections were cut from pre-defined paraffin-embedded
hippocampal blocks. Three sections were then selected from this series at 5 section
intervals, thus sampling through a total of 450µm of hippocampal tissue. Sections were
then stained using IHC for MAP2 to visualise dendrites. Sections were viewed using a
Zeiss Axiolab brightfield microscope and 5x and 100x objectives and a JVC digital
camera attached to a computer. The area of interest (stratum radiatum) was defined
at 5x magnification using the Stereologer 2000 software (Stereologer, WV, USA) by
drawing round the area on-screen. The software applied a stratified-random sampling
procedure to select ~45 frames within the defined region of interest. Frames were
viewed at 100x magnification with a numerical aperture of 1.25 under oil immersion.
A spherical probe 18µm in diameter was used to measure the length-density of
dendrites. Spherical probes are ideal to estimate the length of anisotrophic structures
such as dendrites, as spheres are isotropic in three-dimensions (Gokhale, 1990).
Viewed from above, the probe appeared as a circle of increasing and then decreasing
diameter as the focal plane was moved through the z-axis. The operator marked
whenever a dendrite came into focus intersecting the sphere border (Figure 2.7).
Average section thickness was 23.4µm, ensuring a guard volume =>2µm was excluded
from analysis at the top and bottom of each section. A pilot study was initially carried
out to establish that analysing ~45 frames per case gave an acceptable coefficient of
error demonstrating high level of accuracy (CE = 0.066 ±0.02SE). The software then
calculated length density (Lv) from the number of dendrites intersecting the probe (ΣQ)
within the area of the sampling probe (ΣA) using the equation
Lv = 2(ΣQ/ ΣA) (Mouton, 2002).
54
Figure 2.7. Representative images of the spherical probe used to measure dendritic length density. A-C, as the focal plane moved downwards through the z-axis dendrites were measured when an in focus dendrite crossed the sphere boundary (red circle).
2.8 Protein analysis in frozen hippocampal tissue
Analysis of protein levels in frozen hippocampal tissue was carried out using a protein
immunoblotting technique. Proteins were separated by gel electrophoresis (SDS-PAGE)
and transferred to a nitrocellulose membrane to allow protein detection by
immunoprobing with antibodies. This method allowed comparison of protein levels
between disease groups using frozen tissue which therefore removed the effect of
tissue processing and fixation.
2.8.1 Tissue extraction
Cryostat sections of 20µm and 100µm thickness were cut from frozen hippocampal
blocks at level 18-20 according to the Newcastle Brain Map and stored at -80C. Each
20µm section was stained with CFV for visualisation of tissue structure. Frozen sections
were taken down through decreasing concentrations of alcohol to water (1 minute in
100%, 95%, 75%, 50% ethanol and 5 minutes in water). Sections were immersed in acid
alcohol for 5 minutes and incubated in pre-heated CFV solution in acetate buffer at
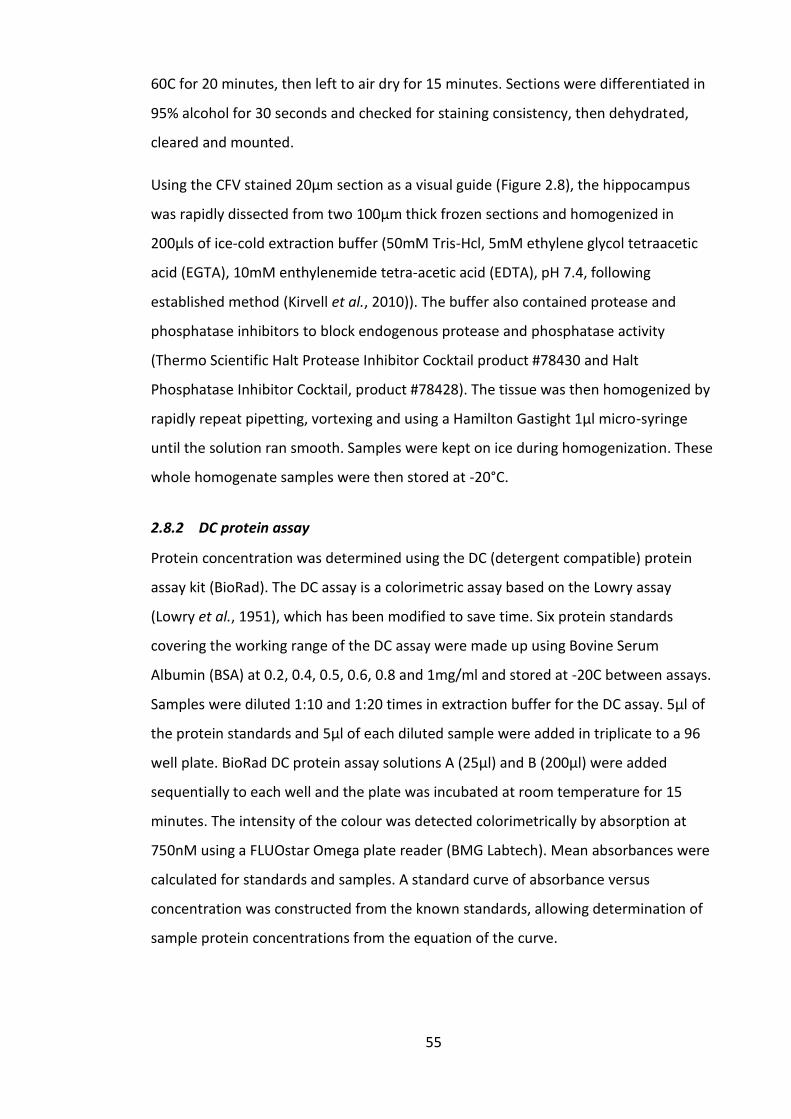
55
60C for 20 minutes, then left to air dry for 15 minutes. Sections were differentiated in
95% alcohol for 30 seconds and checked for staining consistency, then dehydrated,
cleared and mounted.
Using the CFV stained 20µm section as a visual guide (Figure 2.8), the hippocampus
was rapidly dissected from two 100µm thick frozen sections and homogenized in
200µls of ice-cold extraction buffer (50mM Tris-Hcl, 5mM ethylene glycol tetraacetic
acid (EGTA), 10mM enthylenemide tetra-acetic acid (EDTA), pH 7.4, following
established method (Kirvell et al., 2010)). The buffer also contained protease and
phosphatase inhibitors to block endogenous protease and phosphatase activity
(Thermo Scientific Halt Protease Inhibitor Cocktail product #78430 and Halt
Phosphatase Inhibitor Cocktail, product #78428). The tissue was then homogenized by
rapidly repeat pipetting, vortexing and using a Hamilton Gastight 1µl micro-syringe
until the solution ran smooth. Samples were kept on ice during homogenization. These
whole homogenate samples were then stored at -20°C.
2.8.2 DC protein assay
Protein concentration was determined using the DC (detergent compatible) protein
assay kit (BioRad). The DC assay is a colorimetric assay based on the Lowry assay
(Lowry et al., 1951), which has been modified to save time. Six protein standards
covering the working range of the DC assay were made up using Bovine Serum
Albumin (BSA) at 0.2, 0.4, 0.5, 0.6, 0.8 and 1mg/ml and stored at -20C between assays.
Samples were diluted 1:10 and 1:20 times in extraction buffer for the DC assay. 5µl of
the protein standards and 5µl of each diluted sample were added in triplicate to a 96
well plate. BioRad DC protein assay solutions A (25µl) and B (200µl) were added
sequentially to each well and the plate was incubated at room temperature for 15
minutes. The intensity of the colour was detected colorimetrically by absorption at
750nM using a FLUOstar Omega plate reader (BMG Labtech). Mean absorbances were
calculated for standards and samples. A standard curve of absorbance versus
concentration was constructed from the known standards, allowing determination of
sample protein concentrations from the equation of the curve.
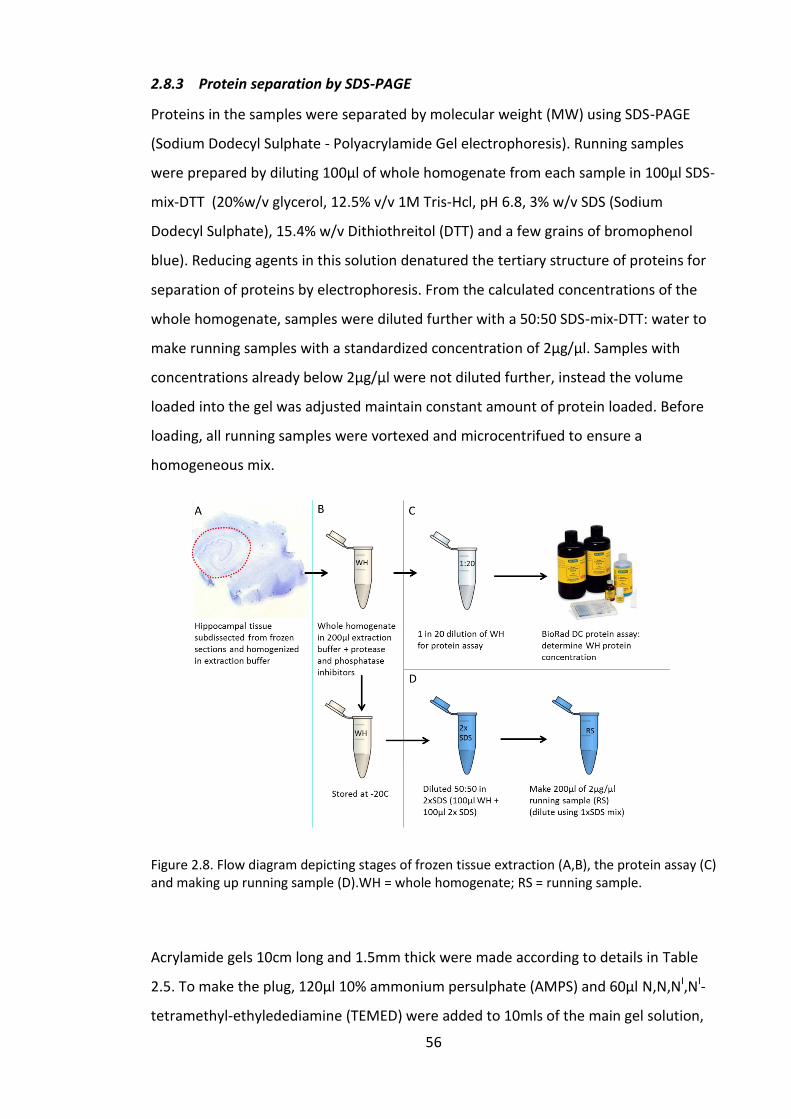
56
2.8.3 Protein separation by SDS-PAGE
Proteins in the samples were separated by molecular weight (MW) using SDS-PAGE
(Sodium Dodecyl Sulphate - Polyacrylamide Gel electrophoresis). Running samples
were prepared by diluting 100µl of whole homogenate from each sample in 100µl SDS-
mix-DTT (20%w/v glycerol, 12.5% v/v 1M Tris-Hcl, pH 6.8, 3% w/v SDS (Sodium
Dodecyl Sulphate), 15.4% w/v Dithiothreitol (DTT) and a few grains of bromophenol
blue). Reducing agents in this solution denatured the tertiary structure of proteins for
separation of proteins by electrophoresis. From the calculated concentrations of the
whole homogenate, samples were diluted further with a 50:50 SDS-mix-DTT: water to
make running samples with a standardized concentration of 2µg/µl. Samples with
concentrations already below 2µg/µl were not diluted further, instead the volume
loaded into the gel was adjusted maintain constant amount of protein loaded. Before
loading, all running samples were vortexed and microcentrifued to ensure a
homogeneous mix.
Figure 2.8. Flow diagram depicting stages of frozen tissue extraction (A,B), the protein assay (C) and making up running sample (D).WH = whole homogenate; RS = running sample.
Acrylamide gels 10cm long and 1.5mm thick were made according to details in Table
2.5. To make the plug, 120µl 10% ammonium persulphate (AMPS) and 60µl N,N,NI,NI-
tetramethyl-ethyledediamine (TEMED) were added to 10mls of the main gel solution,
57
which was mixed by inversion and then quickly poured into two casts. After five
minutes the plugs were set and excess solution was removed with 3MM paper. To
make the main gel, 400µl 10% (w/v) AMPS and 40µl TEMED were added to the
remaining 40mls of main gel solution and poured into the casts, leaving room for the
stack and combs. A few ml of water saturated butanol was added to ensure the surface
set smoothly while the gel was left to set for 15-30 minutes. Once set, water saturated
butanol was washed off with distilled water, and excess water was removed with 3MM
paper. The stack was prepared from 3.4mls acrylamide, 2.52mls 1M Tris-HCl pH 6.8,
200µl 10% SDS and made up to 20mls with water. When ready, 200µl 10% AMPS and
20µl TEMED were added to the stack solution, which was quickly poured into the casts
and 24-well combs were inserted. Gels were left for >30 minutes to completely set.
Combs were then carefully removed and wells were washed out with distilled water
before being placed in the running module.
Gels were run using an upright electrophoresis tank (Complete OmniPAGE Mini Wide
system, SLS ) at 150V constant in fresh running buffer (16.66g Tris, 144 g glycine, 10g
SDS, to 2l with distilled water) for 50 minutes or until the blue dye had run into the
plug. 10µl of pre-stained molecular weight marker (Spectra Multicolor Broad Range
Protein Ladder, Thermo Scientific) was used to demonstrate the distance moved by
known molecular weight (MW) protein standards, ranging from 10-260 kDa. A
standard mix made from all running samples was also loaded three times per gel to
assess variation within and between gels. The amount of protein loaded is described
for individual experiments.
6% 8% 10% 12%
Target protein molecular weight (kDa) 100-300 50-200 20-100 10-50 Acrylamide (mls) 10 13.3 16.7 20 2M Tris-HCl pH 8.8 (mls) 9.4 9.4 9.4 9.4 10% SDS (mls) 0.5 0.5 0.5 0.5 Water Made up to 50mls
Table 2.5. Protocol for making two 20 x 10cm acrylamide gels.
2.8.4 Protein immunoblotting
Nitrocellulose membranes of 0.45mm thickness were hydrated in distilled water and
western blot buffer (5% w/v isopropanol, 0.4M glycine, 2.5mM Tris buffer) for 10
minutes each. Gels were removed from the SDS-PAGE casts and soaked in western blot
buffer for 5 minutes. The western blot stack was constructed from layers of; sponge,
58
Whatman 3MM paper soaked in western blot buffer, the gel, the nitrocellulose
membrane, a second layer of Whatman 3MM paper and sponge. These were
compressed inside the cassette, which was immersed the transfer tank filled with
western blot buffer with the gel towards the negative electrodes. The buffer was kept
cool using a system running 16°C cool water through pipes immersed in the tank. A
constant current of 350mA was applied for 120 minutes to ensure complete transfer.
After transfer, membranes were dried on fresh blotting paper and the position of
molecular weight markers were marked on in permanent pen. The membranes were
washed in TBS-T for 5 minutes (20mM Tris HCL, pH 7.5, 150mM NaCl, 0.1% w/v Tween
20). Membranes were then immersed in Ponceau stain for 1 minute (0.5% w/v
ponceau S, 5% w/v trichloracetic acid), and rinsed in distilled water to check for
successful protein transfer. The ponceau stain was removed using TBS-T.
Enhanced chemiluminescent (ECL) assay for protein detection
Proteins on the nitrocellulose membrane were detected using immunoprobing
technique. To remove non-specific binding sites the nitrocellulose membrane was
immersed in 5% w/v non-fat dried milk (Marvel) in TBS-T for 30 minutes at room
temperature and gently mixed on a platform shaker. The membranes were then
incubated with the primary antibody in 5% non-fat dried milk on a platform shaker
overnight at 4C. After six 5 minute washes in 1% non-fat dried milk in TBS-T,
membranes were incubated for 1 hour with the horse radish peroxidase conjugated
secondary antibody (1:2000 dilution in 5% non-fat dried milk in TBS-T). The
membranes were then washed in six 5 minute washes in 1% non-fat dried milk in TBS-
T, with a final wash in TBS-T.
The membranes were then dried on fresh blotting paper, laid on a glass plate and
incubated with a chemiluminescent substrate solution for 5 minutes (reagents A and B
in a 1:1 ratio, Thermo Scientific, SuperSignal West Pico kit). A clear plastic sheet was
then laid over the membrane to keep it moist. Membranes were imaged using a
Fujifilm Luminescent Image Analyzer LAS4000 System cooled to -30C. Membranes
were exposed for varying lengths of time to achieve optimal signal detection for
analysis.
59
Quantification of protein blots
The optical density of bands was measured using ImageJ image analysis software. Raw
data were normalized to the optical density of β-tubulin. The amount of signal
detected was corrected between gels using the mean value from the standards loaded
on gels. Data were expressed as the optical density of the band for each protein
sample loaded.
Primary antibody
Target Manufacturer (Product code)
Species Concentration Secondary antibody
PSD-95 Post-synaptic protein
Abcam (AB 19258)
Rabbit 1:1000 Anti-rabbit (1:2000)
SNAP-25 Pre-synaptic vesicles
Affiniti Research Products, UK
Mouse 1:2000 Anti-mouse (1:2000)
SY38 Pre-synaptic vesicles
Cymbus (MAB5258-20UG)
Mouse 1:2000 Anti-mouse (1:2000)
α/Β-Tubulin
Loading control
Cell Signalling (2148S)
Rabbit 1:1000 Anti-rabbit (1:2000)
Table 2.6. List of antibodies and concentrations used for protein immunoblots. Blots were incubated with primary antibodies at 4C overnight.
2.9 Baboon model of acute chronic cerebral hypoperfusion
The non-human primate model (baboons) have comparable vascular and brain
anatomy, morphology, cellular physiology and biochemistry to the human brain, and
develop Aβ and tau pathology with ageing, allowing greater insight into
pathophysiological mechanisms of human brain disorders than rodent models can
provide.
Eighteen male olive baboons (Papio anubis) over 10 years old weighing 15-20kg
underwent permanent three vessel occlusion (3VO) surgery where the left vertebral
and both internal carotid arteries were ligated under deep anaesthesia (Figure 2.9).
Animals were left to recover for 1, 3, 7, 14 or 28 days post-surgery before being
euthanized with ketamine (Baneux et al., 1986). Three age, weight and sex matched
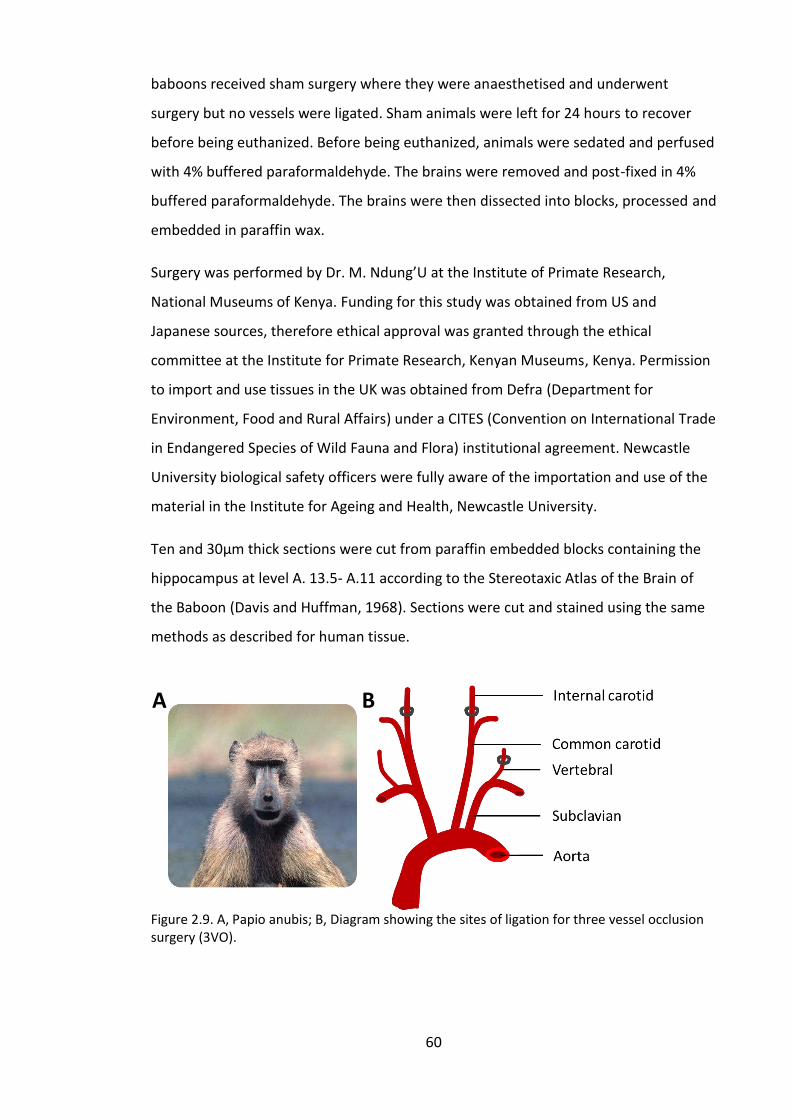
60
baboons received sham surgery where they were anaesthetised and underwent
surgery but no vessels were ligated. Sham animals were left for 24 hours to recover
before being euthanized. Before being euthanized, animals were sedated and perfused
with 4% buffered paraformaldehyde. The brains were removed and post-fixed in 4%
buffered paraformaldehyde. The brains were then dissected into blocks, processed and
embedded in paraffin wax.
Surgery was performed by Dr. M. Ndung’U at the Institute of Primate Research,
National Museums of Kenya. Funding for this study was obtained from US and
Japanese sources, therefore ethical approval was granted through the ethical
committee at the Institute for Primate Research, Kenyan Museums, Kenya. Permission
to import and use tissues in the UK was obtained from Defra (Department for
Environment, Food and Rural Affairs) under a CITES (Convention on International Trade
in Endangered Species of Wild Fauna and Flora) institutional agreement. Newcastle
University biological safety officers were fully aware of the importation and use of the
material in the Institute for Ageing and Health, Newcastle University.
Ten and 30µm thick sections were cut from paraffin embedded blocks containing the
hippocampus at level A. 13.5- A.11 according to the Stereotaxic Atlas of the Brain of
the Baboon (Davis and Huffman, 1968). Sections were cut and stained using the same
methods as described for human tissue.
Figure 2.9. A, Papio anubis; B, Diagram showing the sites of ligation for three vessel occlusion surgery (3VO).
A B
61
2.10 Statistical analyses
Statistical analyses were carried out using SPSS v.19. Before using parametric tests,
data were checked for normal distribution using the Shapiro-Wilk test and
homogeneity of variance using Levene’s test.
Normally distributed data were analysed using the following parametric tests; ANOVA
with post-hoc Tukey’s to compare group means, Pearson’s correlation to find
relationships between variables, and paired T-test to compare related means.
When data were not normally distributed data were analysed using the following non-
parametric tests; Kruskall Wallis and Mann-Whitney tests to compare groups,
Spearman’s correlation to find relationships between variables (and ordinal variables),
and Wilcoxon signed rank test to compare related means. Corrections for multiple
testing were carried out using the Bonferroni adjustment, by dividing the chosen alpha
level (p < 0.05) by the number of tests carried out, to determine the p value cut-off for
significance. Interpretation of significance using both cut-off points is discussed.
Associations between categorical data were analysed using Pearson χ2 test or Fisher’s
Exact test with Phi and Cramer’s V.
62
Chapter 3. Neuronal Volume and Density Changes in Post-Stroke and
Ageing Related Dementias
3.1 Introduction
Hippocampal atrophy is associated with cognitive impairment in AD, VaD and
dementia caused by familiar small vessel disease (Bastos-Leite et al., 2007; O'Sullivan
et al., 2009; Frisoni et al., 2010; Scher et al., 2011). MTL atrophy was also found to be a
predictor of delayed PSD in stroke survivors from the CogFAST cohort (Firbank et al.,
2007). Historically, the cause of reduced tissue volume and associated cognitive
impairment was believed to be neurodegeneration. This was based upon studies
demonstrating reduced neuronal numbers in hippocampal subfields in VaD (Kril et al.,
2002b; Zarow et al., 2008), AD (Giannakopoulos et al., 1996; Kril et al., 2002b; Rössler
et al., 2002; Zarow et al., 2005) mixed VaD and AD (Zarow et al., 2005), and animal
models of ischaemic stroke (Kirino, 1982; Olson and McKeon, 2004). In support of this
theory, neuron number was shown to be related to hippocampal volume in ageing and
AD (Kril et al., 2004). Therefore, I reasoned that greater neurodegeneration may
account for the more severe cognitive decline and structural brain changes in stroke
survivors who developed delayed PSD compared to those who maintained normal
cognitive function.
However, there is growing evidence that neuron loss is not the only factor that
contributes to brain atrophy and functional decline. Studies into MCI and early
dementia have found that hippocampal atrophy and cognitive decline develop before
any significant loss of hippocampal neurons (Apostolova et al., 2010; Leal and Yassa,
2013). In addition, although hippocampal atrophy is associated with memory
impairment in AD and normal ageing (Apostolova et al., 2011), studies have found
that there is limited neuron loss with age (West et al., 1994; Pakkenberg et al., 2003)
and neurodegeneration in AD may only make a weak contribution to tissue atrophy
(Rössler et al., 2002). Furthermore, conflicting reports of CA1 neuron loss in VaD
suggest other mechanisms contribute to tissue atrophy and cognitive dysfunction in
CVD (Kril et al., 2002b; Korbo et al., 2004; Zarow et al., 2005). There is now growing
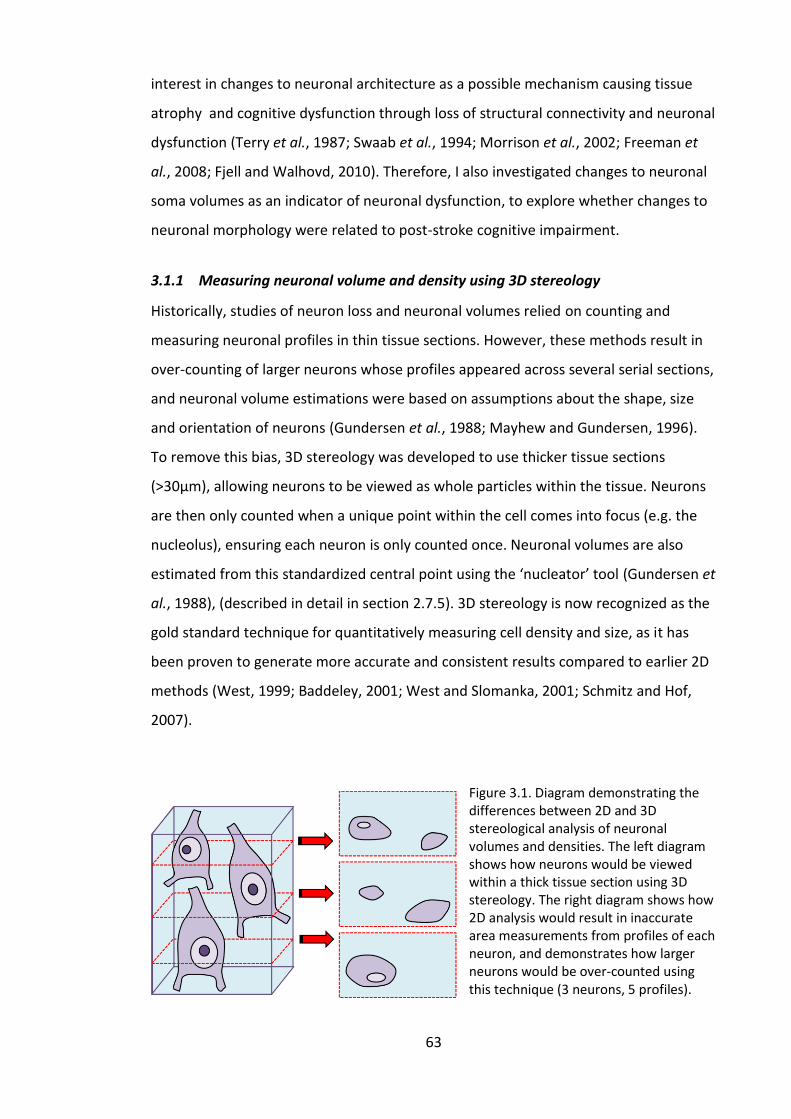
63
interest in changes to neuronal architecture as a possible mechanism causing tissue
atrophy and cognitive dysfunction through loss of structural connectivity and neuronal
dysfunction (Terry et al., 1987; Swaab et al., 1994; Morrison et al., 2002; Freeman et
al., 2008; Fjell and Walhovd, 2010). Therefore, I also investigated changes to neuronal
soma volumes as an indicator of neuronal dysfunction, to explore whether changes to
neuronal morphology were related to post-stroke cognitive impairment.
3.1.1 Measuring neuronal volume and density using 3D stereology
Historically, studies of neuron loss and neuronal volumes relied on counting and
measuring neuronal profiles in thin tissue sections. However, these methods result in
over-counting of larger neurons whose profiles appeared across several serial sections,
and neuronal volume estimations were based on assumptions about the shape, size
and orientation of neurons (Gundersen et al., 1988; Mayhew and Gundersen, 1996).
To remove this bias, 3D stereology was developed to use thicker tissue sections
(>30µm), allowing neurons to be viewed as whole particles within the tissue. Neurons
are then only counted when a unique point within the cell comes into focus (e.g. the
nucleolus), ensuring each neuron is only counted once. Neuronal volumes are also
estimated from this standardized central point using the ‘nucleator’ tool (Gundersen et
al., 1988), (described in detail in section 2.7.5). 3D stereology is now recognized as the
gold standard technique for quantitatively measuring cell density and size, as it has
been proven to generate more accurate and consistent results compared to earlier 2D
methods (West, 1999; Baddeley, 2001; West and Slomanka, 2001; Schmitz and Hof,
2007).
Figure 3.1. Diagram demonstrating the differences between 2D and 3D stereological analysis of neuronal volumes and densities. The left diagram shows how neurons would be viewed within a thick tissue section using 3D stereology. The right diagram shows how 2D analysis would result in inaccurate area measurements from profiles of each neuron, and demonstrates how larger neurons would be over-counted using this technique (3 neurons, 5 profiles).
64
3.2 Aims
This study investigated neuronal densities and volumes in hippocampal CA subfields
and entorhinal cortex layer V (ECV) in stroke survivors from the CogFAST cohort, using
3D stereological techniques, to determine whether neuronal volume or density
changes were related to post-stroke cognitive function. Hippocampal neurons in the
CA subfields are known to be differentially vulnerable to age-associated disease
processes. Therefore, I also analysed hippocampal neurons in elderly controls, VaD, AD
and MD subjects to provide insight into the role of different disease processes in
neuronal changes.
In addition, neuronal volumes and densities were analysed in a small number of
younger, cognitively normal controls to investigate the effect of ageing on neuronal
volumes. Normal ageing is associated with brain atrophy, however 3D stereological
studies have not found any evidence of neuron loss in healthy ageing, suggesting that
changes to neuronal morphology and function may contribute to normal age-
associated cognitive decline (West and Slomanka, 2001).
Neuronal volumes and densities were also measured in a non-human primate
(baboon) model of chronic cerebral hypoperfusion (described in full in section 2.9,
page 59), to gain insight into whether there were acute changes to neuronal volume or
density at different time points after hypoxic injury.
3.3 Methods
3.3.1 3D stereological analysis of neuronal volumes and densities
Neuronal volumes and densities were measured using the optical disector and
nucleator techniques in three 30µm thick hippocampal tissue sections per subject,
stained using cresyl fast violet (CFV) to view neuronal cell bodies and nucleoli
(described on page 44).
65
3.3.2 Statistical analyses
CA1 and CA2 neuronal volume and density data were not normally distributed, and
were therefore analysed using non-parametric tests; group means were compared
using the Kruskal-Wallis test and pairwise comparisons were performed using the
Mann-Whitney U test. CA3 and CA4 neuronal volumes and densities were normally
distributed and were analysed using one-way ANVOA with post-hoc Tukey’s test.
Relationships between variables were correlated using Spearman’s rank correlation.
3.4 Results
3.4.1 Subject demographics
Subject demographics are presented in Table 3.1. The control group had significantly
shorter PMD than PSND, PSD, VaD and AD groups, and longer fixation length than the
PSD and AD groups (p < 0.05). The mixed dementia (MD) group had a significantly
longer fixation length than PSND and PSD (p < 0.05). However, no relationships were
found between PMD or fixation length and neuronal volume or density results.
Coefficient of error values for neuronal volume and density measurements were within
the acceptable range in all regions, demonstrating a high level of precision: neuronal
volume in CA1 p = 0.04, CA2 p = 0.02, CA3 p=0.052 and CA4 p=0.073; neuronal density
in CA1 p = 0.06, CA2 p = 0.002, CA3 p=0.051 and CA4 p=0.07.
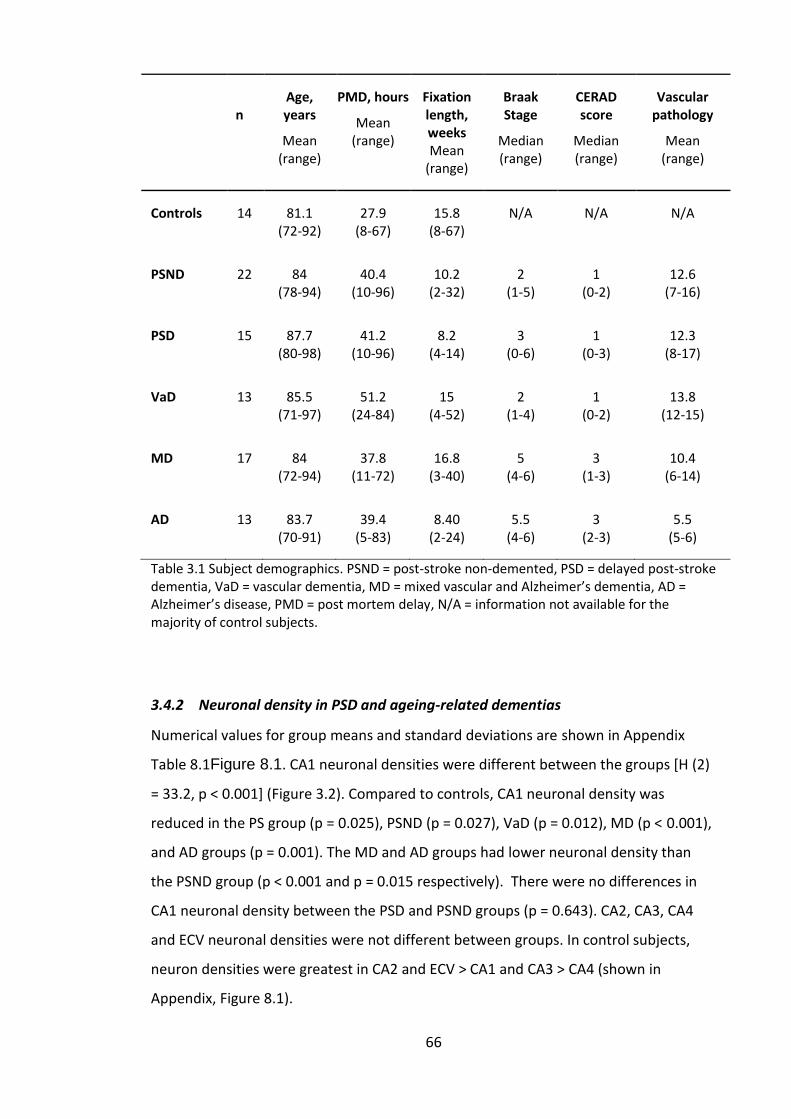
66
n
Age, years
Mean (range)
PMD, hours
Mean (range)
Fixation length, weeks Mean
(range)
Braak Stage
Median (range)
CERAD score
Median (range)
Vascular pathology
Mean (range)
Controls 14 81.1 (72-92)
27.9 (8-67)
15.8 (8-67)
N/A N/A N/A
PSND 22 84 (78-94)
40.4 (10-96)
10.2 (2-32)
2 (1-5)
1 (0-2)
12.6 (7-16)
PSD 15 87.7 (80-98)
41.2 (10-96)
8.2 (4-14)
3 (0-6)
1 (0-3)
12.3 (8-17)
VaD 13 85.5 (71-97)
51.2 (24-84)
15 (4-52)
2 (1-4)
1 (0-2)
13.8 (12-15)
MD 17 84 (72-94)
37.8 (11-72)
16.8 (3-40)
5 (4-6)
3 (1-3)
10.4 (6-14)
AD 13 83.7 (70-91)
39.4 (5-83)
8.40 (2-24)
5.5 (4-6)
3 (2-3)
5.5 (5-6)
Table 3.1 Subject demographics. PSND = post-stroke non-demented, PSD = delayed post-stroke dementia, VaD = vascular dementia, MD = mixed vascular and Alzheimer’s dementia, AD = Alzheimer’s disease, PMD = post mortem delay, N/A = information not available for the majority of control subjects.
3.4.2 Neuronal density in PSD and ageing-related dementias
Numerical values for group means and standard deviations are shown in Appendix
Table 8.1Figure 8.1. CA1 neuronal densities were different between the groups [H (2)
= 33.2, p < 0.001] (Figure 3.2). Compared to controls, CA1 neuronal density was
reduced in the PS group (p = 0.025), PSND (p = 0.027), VaD (p = 0.012), MD (p < 0.001),
and AD groups (p = 0.001). The MD and AD groups had lower neuronal density than
the PSND group (p < 0.001 and p = 0.015 respectively). There were no differences in
CA1 neuronal density between the PSD and PSND groups (p = 0.643). CA2, CA3, CA4
and ECV neuronal densities were not different between groups. In control subjects,
neuron densities were greatest in CA2 and ECV > CA1 and CA3 > CA4 (shown in
Appendix, Figure 8.1).

67
Neuronal densities were positively correlated between CA1 and CA2 (r = 0.311, p =
0.005), CA1 and CA4 (r = 0.317, p = 0.003), CA1 and ECV (r = 0.247, p = 0.037), CA3 and
ECV (r = 0.481, p < 0.001). In the post-stroke subjects only, CA3 neuronal densities
were only correlated with ECV neuronal density (r = 0.503, p = 0.02). There were
trends to negative correlations between neuronal volume and density in CA3 (r = -
0.373, p = 0.08) and CA4 (r = -0.403, p = 0.051).
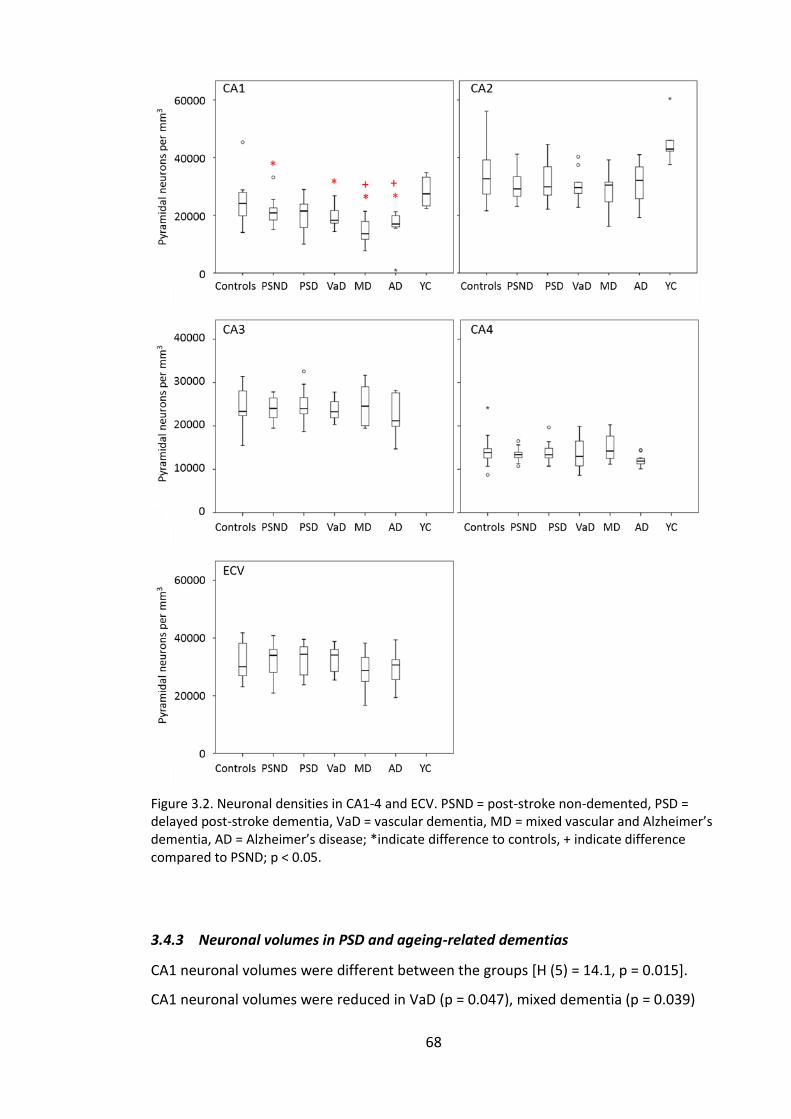
68
Figure 3.2. Neuronal densities in CA1-4 and ECV. PSND = post-stroke non-demented, PSD = delayed post-stroke dementia, VaD = vascular dementia, MD = mixed vascular and Alzheimer’s dementia, AD = Alzheimer’s disease; *indicate difference to controls, + indicate difference compared to PSND; p < 0.05.
3.4.3 Neuronal volumes in PSD and ageing-related dementias
CA1 neuronal volumes were different between the groups [H (5) = 14.1, p = 0.015].
CA1 neuronal volumes were reduced in VaD (p = 0.047), mixed dementia (p = 0.039)
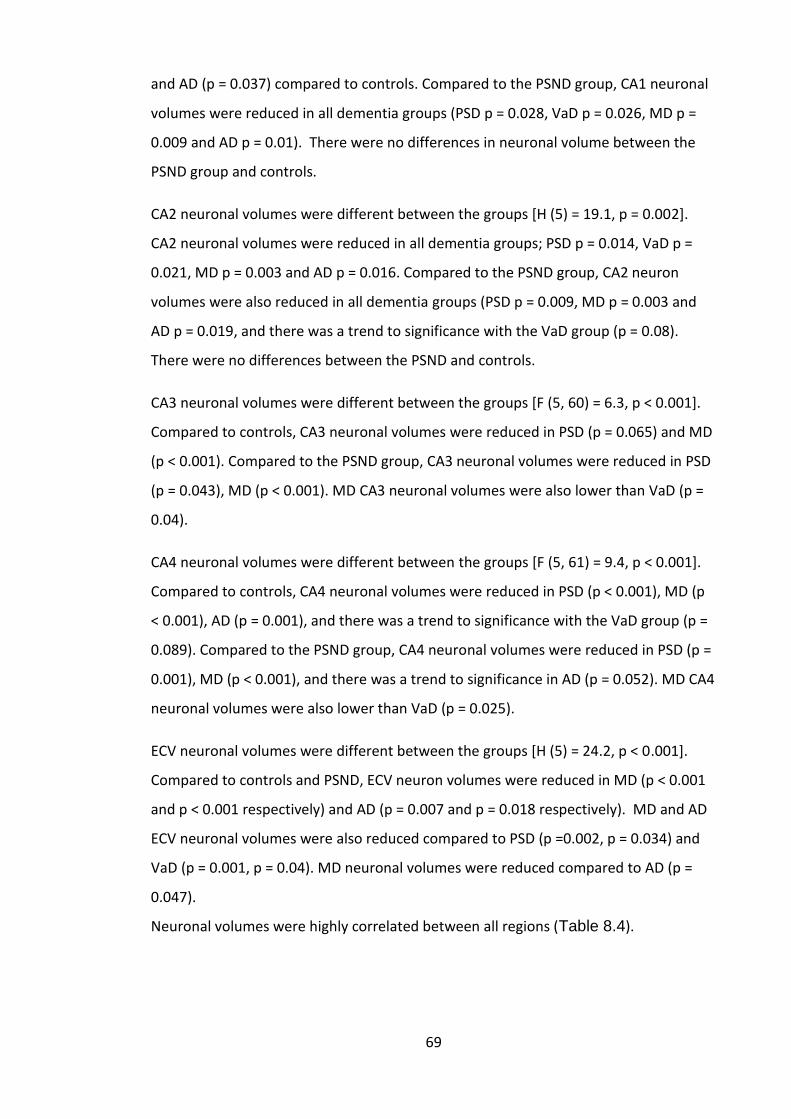
69
and AD (p = 0.037) compared to controls. Compared to the PSND group, CA1 neuronal
volumes were reduced in all dementia groups (PSD p = 0.028, VaD p = 0.026, MD p =
0.009 and AD p = 0.01). There were no differences in neuronal volume between the
PSND group and controls.
CA2 neuronal volumes were different between the groups [H (5) = 19.1, p = 0.002].
CA2 neuronal volumes were reduced in all dementia groups; PSD p = 0.014, VaD p =
0.021, MD p = 0.003 and AD p = 0.016. Compared to the PSND group, CA2 neuron
volumes were also reduced in all dementia groups (PSD p = 0.009, MD p = 0.003 and
AD p = 0.019, and there was a trend to significance with the VaD group (p = 0.08).
There were no differences between the PSND and controls.
CA3 neuronal volumes were different between the groups [F (5, 60) = 6.3, p < 0.001].
Compared to controls, CA3 neuronal volumes were reduced in PSD (p = 0.065) and MD
(p < 0.001). Compared to the PSND group, CA3 neuronal volumes were reduced in PSD
(p = 0.043), MD (p < 0.001). MD CA3 neuronal volumes were also lower than VaD (p =
0.04).
CA4 neuronal volumes were different between the groups [F (5, 61) = 9.4, p < 0.001].
Compared to controls, CA4 neuronal volumes were reduced in PSD (p < 0.001), MD (p
< 0.001), AD (p = 0.001), and there was a trend to significance with the VaD group (p =
0.089). Compared to the PSND group, CA4 neuronal volumes were reduced in PSD (p =
0.001), MD (p < 0.001), and there was a trend to significance in AD (p = 0.052). MD CA4
neuronal volumes were also lower than VaD (p = 0.025).
ECV neuronal volumes were different between the groups [H (5) = 24.2, p < 0.001].
Compared to controls and PSND, ECV neuron volumes were reduced in MD (p < 0.001
and p < 0.001 respectively) and AD (p = 0.007 and p = 0.018 respectively). MD and AD
ECV neuronal volumes were also reduced compared to PSD (p =0.002, p = 0.034) and
VaD (p = 0.001, p = 0.04). MD neuronal volumes were reduced compared to AD (p =
0.047).
Neuronal volumes were highly correlated between all regions (Table 8.4).
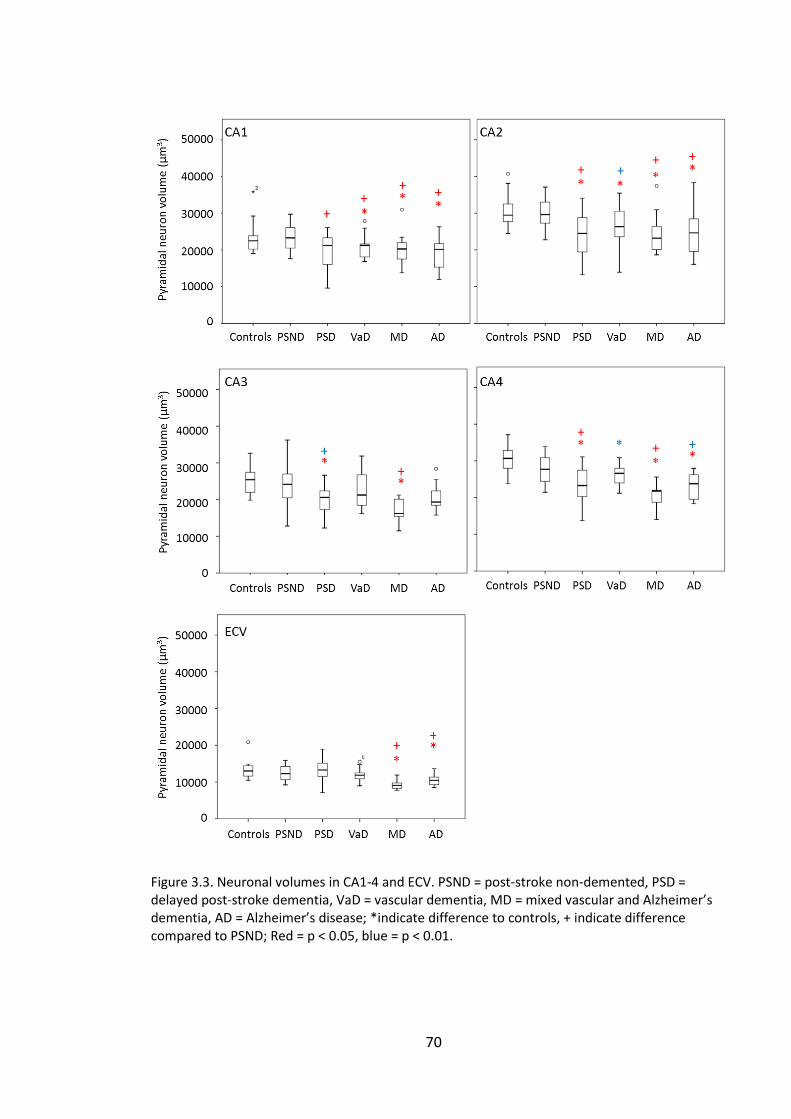
70
Figure 3.3. Neuronal volumes in CA1-4 and ECV. PSND = post-stroke non-demented, PSD = delayed post-stroke dementia, VaD = vascular dementia, MD = mixed vascular and Alzheimer’s dementia, AD = Alzheimer’s disease; *indicate difference to controls, + indicate difference compared to PSND; Red = p < 0.05, blue = p < 0.01.
71
When neuronal volumes were calculated as a percentage of control means they were
10-28% smaller in the disease groups (Figure 3.4) (values in Appendix Table 8.2).
Neuronal volumes were positively correlated between all regions (p < 0.05, values in
Appendix Table 8.4). There were no differences in neuronal volumes or densities
between male and female subjects in any subfield, or between results obtained from
the right and left hippocampus. CA2 neuronal volumes were weakly negatively
correlated with age (r = -0.226, p = 0.019). Control subjects neuronal volumes were
greatest in CA2 and CA4 > CA3 and CA1 > ECV (shown in Appendix Figure 8.1).
Figure 3.4. Neuronal volume as a percentage of control means.
3.4.4 Clinicopathological correlations
CAMCOG scores were positively correlated with neuronal volumes in CA1-4, and
memory sub-scores were correlated with CA2 neuronal volumes (Figure 3.5)(Table
3.2). When subjects with total CAMCOG < 40 (and any sub-scores = 0) were excluded
due to possible inaccurate cognitive test scorings, these correlations remained
significant at p > 0.05 (all r > 0.3). When subjects with memory sub-scores scores of 0
were excluded, memory sub-score correlations with CA2 neuronal volumes remained
significant (r > 0.4, p < 0.02) except learning (r = 0.352, p = 0.052). Neuronal densities
were not correlated with CAMCOG scores in any region.
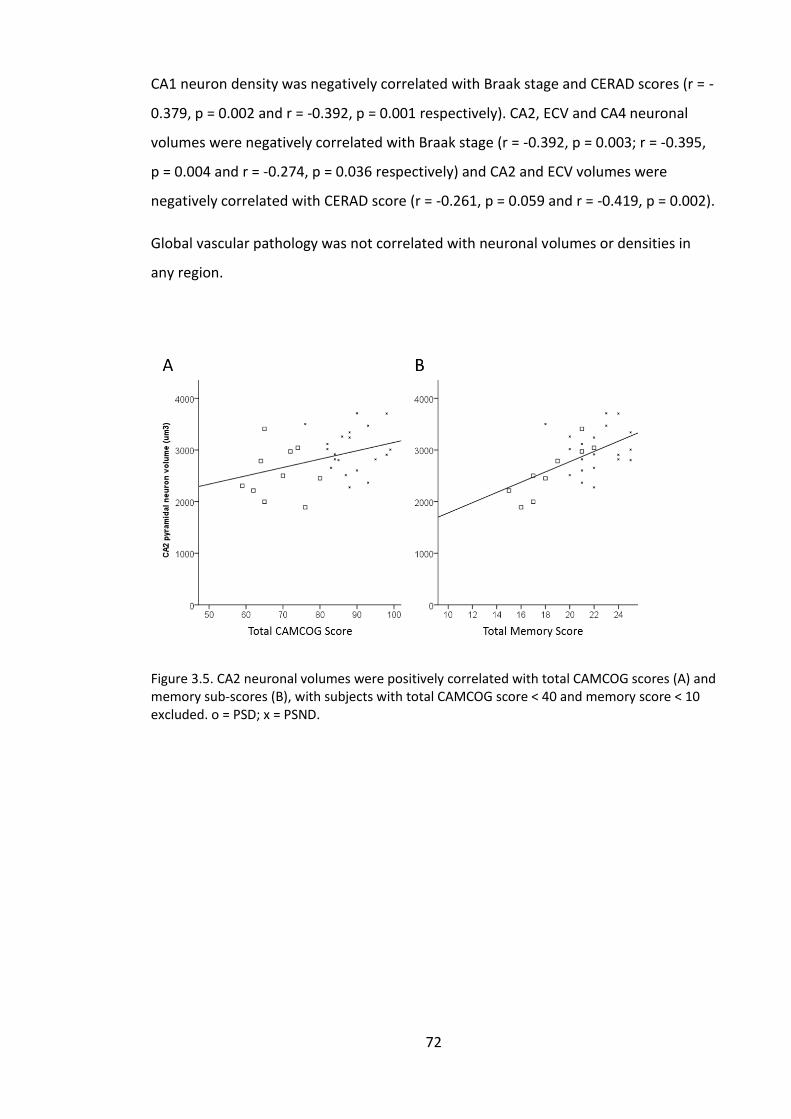
72
CA1 neuron density was negatively correlated with Braak stage and CERAD scores (r = -
0.379, p = 0.002 and r = -0.392, p = 0.001 respectively). CA2, ECV and CA4 neuronal
volumes were negatively correlated with Braak stage (r = -0.392, p = 0.003; r = -0.395,
p = 0.004 and r = -0.274, p = 0.036 respectively) and CA2 and ECV volumes were
negatively correlated with CERAD score (r = -0.261, p = 0.059 and r = -0.419, p = 0.002).
Global vascular pathology was not correlated with neuronal volumes or densities in
any region.
Figure 3.5. CA2 neuronal volumes were positively correlated with total CAMCOG scores (A) and memory sub-scores (B), with subjects with total CAMCOG score < 40 and memory score < 10 excluded. o = PSD; x = PSND.

73
CA1 Volume CA2 Volume CA3 Volume CA4 Volume
CAMCOG total R p
0.399, 0.01
0.445, 0.007
0.526, 0.012
0.572, 0.004
Memory total R p
Ns 0.481, 0.006
Ns Ns
Recent memory R p
Ns 0.692,
< 0.001 Ns Ns
Remote memory R p
Ns 0.428, 0.016
Ns Ns
Learning R p
Ns 0.352, 0.052
Ns Ns
Table 3.2. Correlations between CA neuronal volumes and CAMCOG scores and sub-scores. Ns = not significant. When correlations were corrected for multiple comparisons (20 tests), the cut-off for significance was reduced to p < 0.0025.
3.4.5 Neuronal changes in younger versus elderly controls
Elderly controls were significantly older than younger controls (p < 0.001). There were
no significant differences in PMD or Fixation length between groups (Table 3.3).
There were no significant differences in neuronal volume in younger compared to
elderly controls. CA2 neuronal density was greater in younger controls compared to
elderly controls (p = 0.009) (Figure 3.6).
n
Age, years Mean (range)
PMD, hours Mean (range)
Fixation, weeks Mean (range)
Elderly controls 14 81.1
(72-92) 27.9
(8-67) 15.8
(8-67)
Younger controls 5 48.8
(27-59) 32
(19-41) 59.8
(5-210)
Table 3.3. Subject demographics in elderly vs. younger controls.
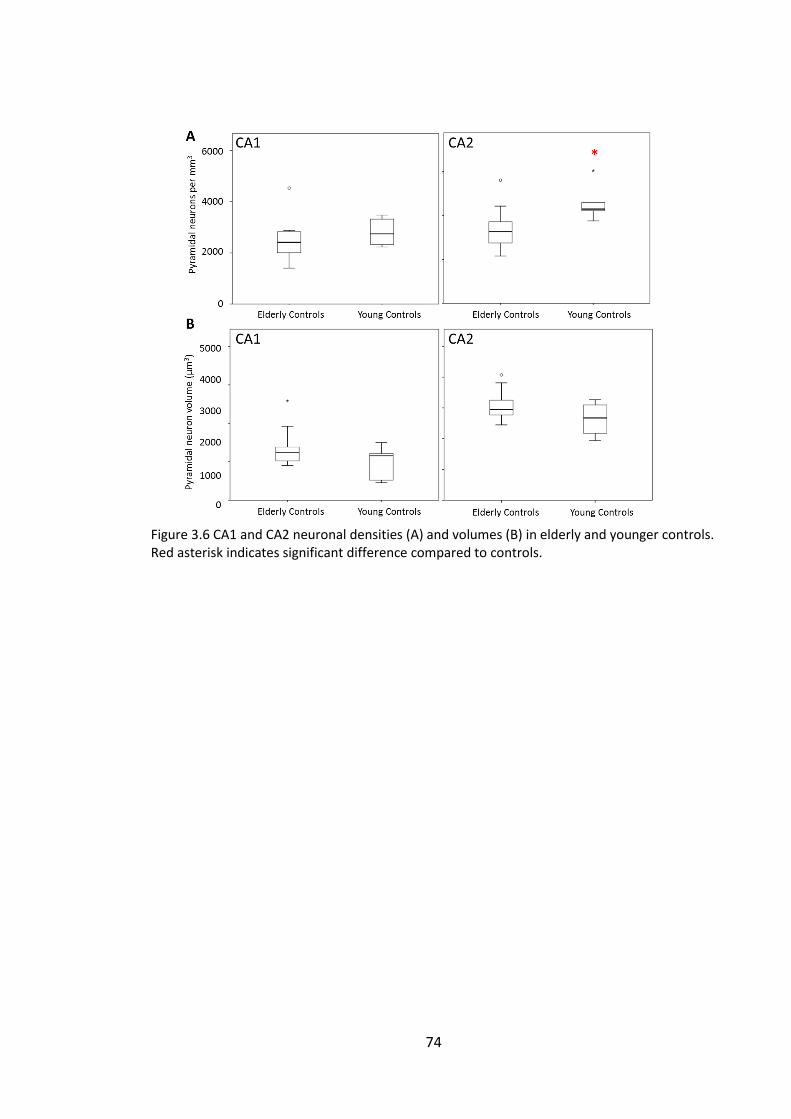
74
Figure 3.6 CA1 and CA2 neuronal densities (A) and volumes (B) in elderly and younger controls. Red asterisk indicates significant difference compared to controls.
75
3.4.6 Neuronal changes in a baboon model of acute cerebral hypoperfusion
Numerical values for mean neuronal volumes and densities are presented in Appendix
Table 8.5. When neuronal volume measurements from the left and right hemispheres
were combined, there was a difference in CA1 neuronal volumes between groups (H
(5) = 13.25, p = 0.021). The sham group had greater CA1 neuronal volumes than the 3
day (p = 0.041), 7 day (p = 0.026) and 14 day groups (p = 0.004). The 28 day group CA1
neuronal volumes were greater than 14 day (p = 0.002).
When results were separated by hemisphere, no statistical analyses were performed
between groups as there were only three animals per time point, limiting the validity
and interpretation of statistical analyses. Neuronal volumes were very similar in the
ipsi- and contra-lateral hemispheres (Figure 3.7 A), and the results indicated that
neuronal volumes in the CA1 and CA2 were reduced in both hemispheres in the 1 day,
3 day, 7 day and 14 day groups compared to the sham animals, whereas the 28 day
group had larger neuronal volumes equivalent to those in the sham group. Mean
neuronal densities were not different at different time points post-surgery (Appendix
Figure 8.2 ), although when statistical analyses were performed on the combined
hemisphere data, CA2 neuronal densities were lower in the 3 day group compared to
the sham group (p = 0.015).
Neuronal volumes were also related to data from a previous study using sections from
the same block, where all neurons within the CA1 were rated as appearing ‘pyknotic’
or ‘healthy’ (Figure 3.7 B)(unpublished results). From this, the percentage of pyknotic
neurons within the CA1 was calculated. CA1 and CA2 neuronal volumes were
negatively correlated with the percentage of pyknotic neurons (CA1 r = -0.654,
p < 0.001; CA2 r = -0.465, p = -0.465) (Figure 3.7 C).
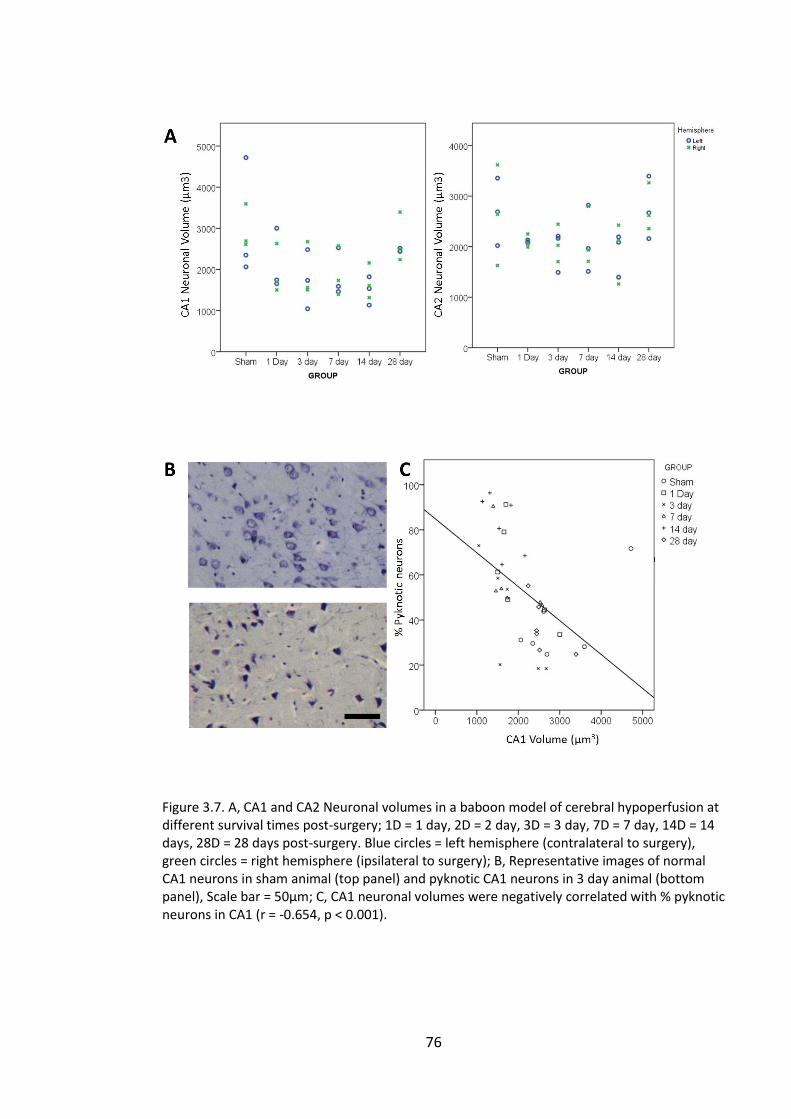
76
Figure 3.7. A, CA1 and CA2 Neuronal volumes in a baboon model of cerebral hypoperfusion at different survival times post-surgery; 1D = 1 day, 2D = 2 day, 3D = 3 day, 7D = 7 day, 14D = 14 days, 28D = 28 days post-surgery. Blue circles = left hemisphere (contralateral to surgery), green circles = right hemisphere (ipsilateral to surgery); B, Representative images of normal CA1 neurons in sham animal (top panel) and pyknotic CA1 neurons in 3 day animal (bottom panel), Scale bar = 50µm; C, CA1 neuronal volumes were negatively correlated with % pyknotic neurons in CA1 (r = -0.654, p < 0.001).
77
3.5 Discussion
3.5.1 Reduced neuronal volumes in post-stroke and ageing-related dementias
Hippocampal neuronal volumes were reduced by 10-20% in the CA subfields of stroke
survivors who developed delayed PSD compared to PSND subjects, and decreased
neuronal volumes were related to lower CAMCOG scores in stroke survivors. These
results provide novel evidence that decreased neuronal volumes were associated with
post-stroke cognitive impairment, and suggest that decreased neuronal volumes
reflect mechanisms contributing to cognitive decline. This finding was supported by
similar observations in the other types of dementia, where neuronal volumes in CA1,
CA2 and CA4 were also ~20% reduced in AD, VaD and MD compared to PSND and
controls.
In contrast to the neuronal volumes, there were no differences in hippocampal
neuronal densities between PSND and PSD subjects, although both groups had lower
CA1 neuron density than controls. This finding was consistent with previous reports of
CA1 neuron loss after ischaemic stroke; however it was surprising not to find any
association between lower neuron density and lower CAMCOG scores or PSD, as I had
reasoned that neuron loss was likely to contribute to the observed MTL atrophy and
dementia in stroke survivors. Although unexpected, this finding complements the
neuronal volume results as it implies that differing mechanisms in the surviving
neurons were important in determining cognitive outcome after stroke.
It was surprising to find that only CA2 neuronal volumes were related to memory sub-
scores in stroke survivors, as neurons in the CA2 subfield are generally considered to
be the most resilient to injury. However, the CA2 subfield is also the least well studied,
and its role in cognitive processing has only recently begun to be understood (Jones
and McHugh, 2011). Interestingly, a neuroimaging study of early AD found that CA2
atrophy was more strongly associated with MCI and progression to dementia than CA1
atrophy (Apostolova et al., 2010). Together these findings suggest an important role
for CA2 neurons in cognitive function, and my results suggest that reduced neuronal
volume may be a mechanism relating this sub-regional hippocampal atrophy to
cognitive impairment in the early stages of dementia.
78
Corrections for multiple testing between the neuronal volume results and cognitive
scores using the Bonferroni adjustment resulted in only the correlation between CA2
neuronal volumes and recent memory achieving statistical significance. However, this
adjustment may be overly strict resulting in increased false-negative results . For this
reason, and because exploratory studies such as this require a flexible approach for
design and analysis resulting in large numbers of tests, the use of appropriate multiple
test adjustments in exploratory studies is difficult and controversial (Thomas, 1998).
Therefore, it has been suggested that in this kind of study, interpretation of
‘significant’ results may be considered as exploratory results which would require
further testing in confirmatory studies to confirm the hypotheses (Bender and Lange,
2001). Therefore, interpretation of the ‘significance’ of all results should be carefully
considered. However, in this situation, I believe the risk of dismissing potentially
important results when using strict multiple test adjustments in exploratory research
outweighs the implications of reporting a simple coincidence.
3.5.2 Neuronal volumes and densities in different disease processes
Braak stages and CERAD scores were negatively correlated with CA1 neuron density,
but there was no relationship between CA1 neuronal volume and AD pathology.
Conversely, CA2, CA4 and ECV neuronal volumes were negatively correlated with AD
pathology, but there was no relationship with neuron density. This is consistent with
the well documented loss of CA1 neurons in AD and literature suggesting tangle
burden is related to neuronal death (Zarow et al., 2005). The relationship between AD
burden and neuronal volumes, but not densities, in the other subfields indicates that
these neurons were affected by AD processes, but they did not cause neuronal death.
Reduced neuronal volume may simply reflect damage to neurons caused by disease
processes, or alternatively they may reflect increased damage to remote susceptible
neurons which communicate with these neurons (i.e. CA1), resulting in loss of targets
and deafferentation. This may have caused the retraction of processes and loss of axo-
dendritic arbour from the CA2/CA3/CA4 neurons, which has previously been
implicated in the cause of neuronal volume loss (Hanks and Flood, 1991; Harrison and
Eastwood, 2001).
79
There were no relationships between neuronal volumes or densities and ratings of
CVD burden, which was surprising as neuronal volumes and densities were significantly
decreased in pathologically confirmed PSD (VaD) and VaD subjects who had no other
significant neurodegenerative disease pathology. This may therefore reflect limitations
of the rating system which was not able to detect subtle changes in local vasculature
which may have had a direct impact on hippocampal neurons. Alternatively, volume
loss may have developed in neurons that lost inputs from cells that died as a result of
spatially and temporally distant ischaemic lesions, which would be difficult to relate to
hippocampal neuronal changes.
Neuronal volumes and densities were consistently most severely reduced in the MD
group in all regions analysed, indicating that the presence of multiple disease
processes exacerbated the mechanisms causing neuronal volume loss. These findings
therefore suggest a possible mechanism through which coexistence of these
pathologies can have an additive effect on cognitive decline (Snowdon et al., 1997;
Pasquier et al., 1998). Furthermore, my findings of reduced neuronal volumes in
different causes of dementia build on previous research which has found decreased
neuronal volumes in the hippocampus in AIDS dementia and in the prefrontal cortex in
late-life depression (Sá et al., 2000; Khundakar et al., 2009). Together, these studies
suggest that reduced neuronal volumes are associated with cognitive dysfunction
caused by various different disease aetiologies.
It was reassuring to find that ECV neuronal volumes were only reduced in MD and AD
groups compared to controls, as this was consistent with the well-described
involvement of the entorhinal cortex in AD (Schönheit et al., 2004). The clear
distinction between the disease groups studied confirmed the robustness of the 3D
stereological technique as it clearly identified the differential vulnerability of different
neurons within the hippocampal formation to AD and CVD processes.
3.5.3 Comparison with previous studies
CA1 neuronal volumes were 28.3% reduced in AD subjects compared to controls,
which falls within the range of previous reports in AD (25% - 39%) (Rinne et al., 1987;
Riudavets et al., 2007). Riudavets et al. found that CA1 neuronal volumes were only
9.8% reduced in MCI patients compared to controls, suggesting that the degree of
80
neuronal volume loss was related to severity of cognitive impairment, in agreement
with the findings of negative relationships between CAMCOG scores and neuronal
volumes in this study. Neuronal volumes in AIDS dementia subjects were found to be
31% reduced in CA3 and 30% reduced in CA1 compared to controls, without any
neuron loss (Sá et al., 2000). My results therefore provide further evidence that
neuronal volume loss can occur in regions without neurodegeneration.
Only one previous study had investigated neuronal volumes in VaD using 3D
stereological techniques prior to this study. Zarow et al. found a non-significant (6%)
reduction in CA1 neuronal volume in AD compared to non-AD subjects, but no
reduction in neuronal volume in VaD subjects (Zarow et al., 2005). However they
analysed only six VaD cases, compared to the 15 PSD and 22 PSND subjects in this
project, which may have limited detection of statistically significant results.
Furthermore, this study generally found greater differences in neuronal volumes
between controls and dementia groups. This may have also contributed towards their
finding of no relationship between neuronal volumes and cognitive function in AD,
whereas I found neuronal volumes in the CogFAST subjects were positively correlated
with CAMCOG scores. However, there was an average of 2 years between cognitive
testing and death in the study by Zarow et al.; compared to just 7.6 months ( ±2SE =
1.7) in the CogFAST study, which meant CAMCOG scores from the CogFAST study were
a more reliable indicator of cognitive status at death, and were more likely to relate to
the observed neuronal changes.
Neuron density in the CA1 subfield was reduced in stroke survivors, VaD, MD and AD
groups, in agreement with previous literature describing loss of CA1 neurons in AD and
VaD (West et al., 1994; Kril et al., 2002b; Rössler et al., 2002).
3.5.4 Limitations of neuronal volume and density measurements
Neuron density was used as a measure of neuron loss because tissue sections were
only able to be taken from predefined paraffin-embedded blocks with a fixed starting
point, which prevented the strict sampling procedure necessary to conduct Cavalieri
calculations and estimate the total cell number within the whole hippocampus using
the ‘fractionator’ method (Gundersen et al., 1988). Density measures are based on the
relationship between the numerator (the cell counts) and denominator (the
81
extracellular matrix), so the effect of differential tissue processing cannot be ruled out.
However, all sections were processed and handled in a standardized manner allowing
comparisons to be made between subjects.
Another possible factor confounding neuronal density results is the influence of tissue
atrophy (Rössler et al., 2002). All the dementia types studied are associated with MTL
atrophy. Therefore, if tissue atrophy had influenced results by bringing surviving
neurons closer together then my findings would have underestimated neuron loss.
Despite these limitations, my results were consistent with the literature describing
significant loss of CA1, but not CA2 neurons in VaD and AD (West et al., 1994; Kril et
al., 2002b). Previous reports of neuron loss in AD have ranged from 12% to 86%
(Rössler et al., 2002). I found CA1 neuronal densities were 33% reduced in AD (17%
reduced in both PSND and PSD subjects, 22% reduced in VaD, and 44% reduced in MD)
which lies near the middle of this range.
A further potentially confounding variable was variation in the coronal level at which
sections were cut. As hippocampal tissue is highly sought after, in some situations
sections had to be taken from more posterior blocks nearer level 20-21 according to
the Newcastle Brain Map. However, when neuronal density and volume were
compared in control sections from level 18 and level 21, there was no indication of any
relationship between neuronal measurements and coronal level. Further studies to
investigate changes in neuronal volume and density throughout the hippocampus
would be required to establish the influence of coronal level on neuronal density and
volume in healthy controls.
3.5.5 Neuronal volumes in middle-aged and elderly controls
It was surprising not to find any differences in neuronal volumes between middle-aged
and elderly controls. I had reasoned that pathological processes of ageing; such as
accumulation of neurodegenerative and vascular disease pathology and hippocampal
atrophy, would have resulted in reduced neuronal volumes with age. Additionally, age-
associated neuronal atrophy had previously been reported in aged primates (Smith et
al., 1999). However, my study was limited as it only sampled a very small and quite
variable group of ‘younger’ controls, ranging from 27 – 59 years old. To establish
whether neuronal volumes are affected with increasing age would require a larger
82
study of subjects under 40 years old, ideally without any age-associated
neurodegenerative pathology. It would be interesting to compare ‘pathology free’ and
‘normal ageing pathology’ cognitively normal controls at all ages, to explore whether
age-associated pathology influences neuronal volumes. As elderly subjects can have
significant Alzheimer’s-type pathology without cognitive decline (Esiri et al., 2001), one
could postulate that these individuals would maintain neuronal volumes as a
mechanism to maintain cognitive function.
3.5.6 Neuronal volumes were reversibly reduced in acute cerebral hypoperfusion
In the baboon model of acute cerebral hypoperfusion, CA1 and CA2 neuronal volumes
were reduced from 1 – 14 days after the occlusion surgery, whereas 28 day neuronal
volumes were similar to sham animals. This suggests that neuronal volumes were
initially reduced in response to the hypoxic insult, but recovered normal neuronal
volumes by 28 days. The relationship between the percentage of pyknotic neurons and
neuronal volume suggested that the reduction in neuronal volume reflected a
reversible pyknotic change, which was not surprising as one of the criteria for
identifying pyknotic neurons was a shrunken cytoplasm. Interestingly, there did not
appear to be any differences in neuronal volumes between the ipsi- and contra-lateral
hemispheres, indicating that CA1 and CA2 neurons in both hemispheres were affected
by cerebral hypoperfusion. There did not appear to be any significant loss of CA1
neurons within this time period.
Interpretation of these findings was limited due to the lack of statistical analysis and
small numbers investigated. This model was also not a true model of stroke, so cannot
be directly related to the long-term changes observed in the CogFAST cohort. Despite
this, these results provide further evidence that cerebrovascular disease could cause
neuronal volume loss, and indicate that hippocampal neuronal volume loss occurs as a
reversible acute response to hypoxia. However, it is not known whether these volume
changes were associated with cognitive decline, or whether there were long-term
changes in neuronal volume or density.
83
3.6 Conclusions
These observations provide novel evidence that reduced hippocampal neuronal
volumes in CA1-4 were associated with cognitive impairment in post-stroke survivors,
and were likely to reflect mechanistic changes contributing to cognitive decline. As
neuronal volumes were also reduced in CA subfields in AD, VaD and mixed dementia,
this mechanism appears to be involved in cognitive decline in brain disorders with CVD
and AD. Subjects with mixed dementia had greater neuronal volume and density loss,
indicating that co-existence of both disease mechanisms exacerbated neuronal
damage.
These results also suggest that reduced neuronal volume may be an important cellular
substrate of hippocampal atrophy observed in neuroimaging studies of these
disorders, occurring independently to or preceding neurodegeneration.
84
Chapter 4. Neurodegenerative Processes in Stroke Survivors
4.1 Introduction
The previous chapter described how reductions in hippocampal neuronal volumes
were associated with dementia caused by CVD and AD, and that neuronal volumes
were correlated with post-stroke cognitive function. As all dementia groups exhibited
neuron loss and reduced neuronal volumes in the CA1 subfield this suggested that
dysfunctional and degenerating neurons in this subfield contributed to cognitive
impairment. Although no significant neuron loss was observed in CA2, CA3 or CA4 in
dementia subjects, reduced neuronal volumes in these subfields were also associated
with poorer cognitive function, suggesting that neuronal function in these regions was
also impaired.
All the dementia subjects studied had CVD or AD which suggests that vascular or
neurodegenerative disease mechanisms caused these neuronal changes. CA1 neuronal
densities, and CA2, CA4 and ECV neuronal volumes were related to Braak stage and/or
CERAD scores, indicating that the burden of AD pathology may have contributed to
neurodegeneration and neuronal dysfunction in these subjects. However, these
neuropathological ratings were derived from global assessment of the whole brain,
and did not reflect subtle differences in local pathological burden within the
hippocampus. Therefore, the next stage of this project aimed to further elucidate the
role of neurodegenerative disease mechanisms in the hippocampus in causing
neuronal volume and density changes and contributing to post-stroke cognitive
decline.
4.1.1 Hippocampal Alzheimer’s-type pathology
I reasoned that AD pathology may be related to neuronal volume loss through the
pathogenic effects of Aβ and hyperphosphorylated tau on neuronal processes and
synapses. Neuronal soma shrinkage is thought to reflect a loss of axo-dendritic arbour,
as neuronal soma size is related to amount of cellular machinery needed to support
the neuronal processes (Harrison and Eastwood, 2001). Both Aβ plaques and tau
pathology are associated with damage to neuronal processes and synapse loss.
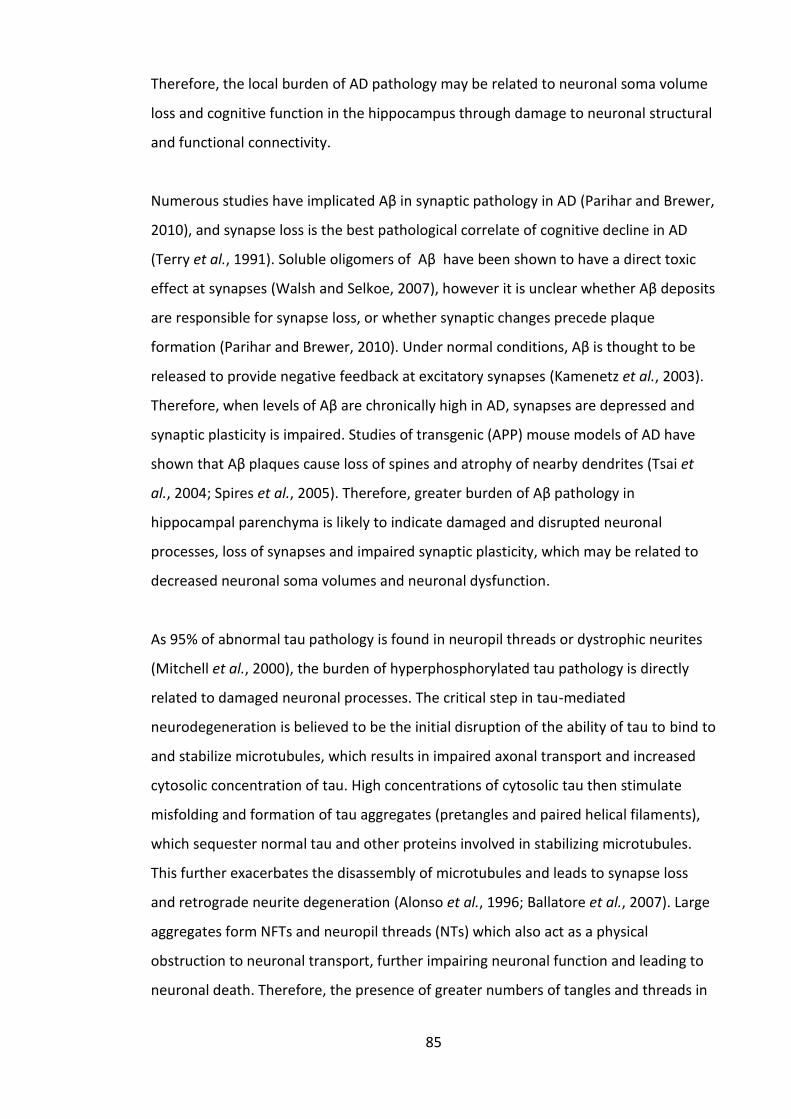
85
Therefore, the local burden of AD pathology may be related to neuronal soma volume
loss and cognitive function in the hippocampus through damage to neuronal structural
and functional connectivity.
Numerous studies have implicated Aβ in synaptic pathology in AD (Parihar and Brewer,
2010), and synapse loss is the best pathological correlate of cognitive decline in AD
(Terry et al., 1991). Soluble oligomers of Aβ have been shown to have a direct toxic
effect at synapses (Walsh and Selkoe, 2007), however it is unclear whether Aβ deposits
are responsible for synapse loss, or whether synaptic changes precede plaque
formation (Parihar and Brewer, 2010). Under normal conditions, Aβ is thought to be
released to provide negative feedback at excitatory synapses (Kamenetz et al., 2003).
Therefore, when levels of Aβ are chronically high in AD, synapses are depressed and
synaptic plasticity is impaired. Studies of transgenic (APP) mouse models of AD have
shown that Aβ plaques cause loss of spines and atrophy of nearby dendrites (Tsai et
al., 2004; Spires et al., 2005). Therefore, greater burden of Aβ pathology in
hippocampal parenchyma is likely to indicate damaged and disrupted neuronal
processes, loss of synapses and impaired synaptic plasticity, which may be related to
decreased neuronal soma volumes and neuronal dysfunction.
As 95% of abnormal tau pathology is found in neuropil threads or dystrophic neurites
(Mitchell et al., 2000), the burden of hyperphosphorylated tau pathology is directly
related to damaged neuronal processes. The critical step in tau-mediated
neurodegeneration is believed to be the initial disruption of the ability of tau to bind to
and stabilize microtubules, which results in impaired axonal transport and increased
cytosolic concentration of tau. High concentrations of cytosolic tau then stimulate
misfolding and formation of tau aggregates (pretangles and paired helical filaments),
which sequester normal tau and other proteins involved in stabilizing microtubules.
This further exacerbates the disassembly of microtubules and leads to synapse loss
and retrograde neurite degeneration (Alonso et al., 1996; Ballatore et al., 2007). Large
aggregates form NFTs and neuropil threads (NTs) which also act as a physical
obstruction to neuronal transport, further impairing neuronal function and leading to
neuronal death. Therefore, the presence of greater numbers of tangles and threads in
86
the neuropil is a sign of greater damage to hippocampal neuronal circuitry, which is
likely to be reflected in reduced neuronal volumes and neuron loss.
Figure 4.1. Diagram of the key mechanisms in cerebrovascular disease, Aβ and tau pathology relating to neuronal dysfunction and autophagy.
4.1.2 Dysfunctional autophagy in AD and CVD
Dysfunctional autophagy has been implicated in AD, ischemia and ageing, and
autophagy has a role in maintaining neuronal function and morphology. Autophagy
may influence neuronal soma volume through its role in regulating the morphology of
neuronal processes and synapses (Xu et al., 2012). For example, autophagy has been
87
shown to be involved in axonal remodelling under normal and excitotoxic conditions
(Wang et al., 2006). In healthy neurons, AVs form at synapses and carry proteins along
neurites to be degraded in lysosomes in the soma. If the transport system becomes
impaired, for example due to development of NTs and microtubule dissociation, this
leads to swellings and build-up of AVs in axons and dendrites (Nixon, 2007). There is
considerable evidence that AD is associated with deficiencies in autophagy, with AV
build-up particularly evident in hippocampal neurons (Nixon and Yang, 2011). In AD
subjects, accumulated autophagic markers have been shown to co-localise with tau-
immunopositive dystrophic neurites and NFTs (Ma et al., 2010). Therefore,
accumulation of AVs in AD is thought to be due to impaired transport and clearance
(Nixon, 2006; Nixon, 2007), indicative of defects in the autophagic pathway rather than
upregulated autophagy. The pathological effect of accumulated of AVs in AD is
exacerbated as AV membranes are thought to be a source of increased Aβ production
(Yu et al., 2005). Several mechanisms have been implicated in the cause of autophagic
dysfunction and pathology in AD, including reduced levels of Beclin-1 (Pickford et al.,
2008), autophagy proteins being sequestered by abnormal protein aggregates,
impaired trafficking and fusion with the lysosome, and impaired autophagolysosomal
maturation (Levine and Kroemer, 2008).
Another protein which has been suggested to have a pathogenic role in autophagy
dysfunction and Alzheimer’s disease is P62, a regulatory protein involved in protein
homeostasis (Salminen et al., 2012). P62 binds directly to LC3 and can target organelles
for autophagic degradation, and has a role in regulating the degradation of
ubiquitinated tau (Ramesh Babu et al., 2008). A recent study has shown that increased
levels of LC3 and P62 in hippocampal neurons and neuronal processes were associated
with memory impairments in aged mice (Soontornniyomkij et al., 2012), providing
further evidence for a relationship between autophagy dysfunction and
neurodegeneration in ageing and cognitive decline. Studies also indicate that P62 has a
role in synaptic plasticity, as P62 knock-out mice have significantly reduced levels of
pre-synaptic protein synaptophysin, develop NFTs, and exhibit memory impairment
after six months (Ramesh Babu et al., 2008). Another study has shown that P62 is
involved in surface translocation of receptors in hippocampal synaptic plasticity (Jiang
88
et al., 2009). However, it is not known whether the pathological involvement of P62 in
autophagic and neuronal dysfunction is only related to AD processes, or whether it is
also involved in pathogenesis of CVD-mediated neurodegeneration.
Autophagy in CVD
Although there have been numerous recent studies of autophagy in AD, there are
fewer studies of autophagy in relation to CVD and no previous studies in post-stroke
dementia. Despite the relative lack of studies of autophagy in CVD, there is growing
evidence that autophagy is enhanced following cerebral ischemia, and is stimulated in
response to energy deficits, hypoxia, endoplasmic reticulum stress and oxidative stress
(Xu et al., 2012). Cell culture studies have shown that cells lose mass by autophagy
when subjected to prolonged glucose, oxygen and growth factor withdrawal, and then
fully recover when they were returned to optimal conditions (Lum et al., 2005; Levine
and Kroemer, 2008). As CVD causes similar conditions by restricting blood supply to
neurons, autophagy could be a mechanism contributing to reduced neuronal volume
in dementia. A study using a rat two vessel occlusion (2-VO) model of transient
forebrain ischemia found a pathological increase in autophagic vacuoles in
hippocampal neurons after ischemia, and suggested that the resultant accumulation of
proteins could be a possible cause multiple organelle damage and delayed neuronal
death (Liu et al., 2010). This suggests that hippocampal neurons are particularly
susceptible to autophagic dysfunction in ischemia, and supports my hypothesis that
autophagy may contribute to neuronal changes in stroke survivors and VaD.
Autophagic dysfunction in hippocampal neurons during cerebral ischemia has also
been reported in models of neonatal hypoxia-ischemia, where levels of LC3-II and
Beclin-1 were increased (Zhu et al., 2005; Carloni et al., 2008; Xu et al., 2012).
Increased Beclin-1 was also reported in the penumbra of a rat MCAO model, although
not all Beclin-1 upregulating cells also showed increases in LC3 (Rami et al., 2008).
However, interpretation of these results is difficult as it is unclear whether an increase
or decrease in autophagy markers reflects mechanisms contributing to cell death or
survival. Studies have suggested that the role of autophagy in neurodegeneration after
ischemia is likely to depend on the brain region affected, maturity, severity of ischemia
and timing of therapeutic interventions (Xu et al., 2012).
89
4.2 Aims
This study compared the burden of amyloid-β and hyperphosphorylated tau pathology
in the hippocampus of stroke survivors, controls, VaD and AD subjects, to determine
whether AD processes were related to neuronal morphological and density changes in
non-demented and demented stroke survivors, VaD, MD and AD subjects.
Although the role of autophagy dysfunction in AD is becoming well studied, fewer
studies have investigated the role of autophagy in cerebrovascular disease. As
autophagy is involved in regulating neuronal morphology, is implicated in ageing and
the pathogenesis of AD, and is altered after ischemia, levels of autophagy proteins LC3,
Beclin-1 and P62 were investigated to explore dysfunctional autophagy as a possible
mechanism causing neuronal soma shrinkage and cognitive impairment in post-stroke
dementia. This study compared changes to CA1 and CA2 neurons as they are
differentially vulnerable to neurodegenerative disease processes.
4.3 Materials and methods
4.3.1 IHC and image analysis
Immunohistochemical staining for AT8, 4G8, LC3, Beclin-1 and P62 was carried out
according to the protocol described in section 2.6 (Table 2.3). The antibody to LC3
recognised both LC3-I and LC3-II. Image analysis of LC3, Beclin-1 and P62
immunostaining was carried out using Image Pro as described in section 2.7.2 (page
48), generating values for percent per area (%PA) stained and mean integrated optical
density (IOD, stain intensity). Images were taken at 10X magnification with a numerical
aperture 0.3. Six images of the CA1 were taken where possible, evenly distributed
across the proximal-distal axis. The whole CA2 subfield was imaged.
4.3.2 Semi-quantitative rating of hippocampal Aβ pathology
A parallel study had previously quantified burden of hippocampal AD pathology in
CogFAST subjects using image analysis techniques (unpublished data). Therefore, I
used established semi-quantitative methods to quickly rate hippocampal AD
pathological burden.
90
The burden of Aβ pathology was rated in sections stained using the 4G8 antibody,
using a 0-4 scoring system described by (Thal et al., 2006) (Figure 4.2 A). This method
involved rating and characterising the development of Aβ in the MTL, which mirrors
the development of Aβ pathology throughout the brain (Thal et al., 2006). This system
took into account the type of amyloid pathology, location and total amount of Aβ:
Neuritic plaques were rated in layers III and V of the neocortex, the EC,
pyramidal layers of the hippocampus and subiculum, and molecular layer of the
dentate gyrus.
Fleecy amyloid was rated in the inner layers of the EC, the CA1 and subiculum.
Band-like amyloid was rated in the subpial temporal and entorhinal molecular
layers.
Whilst applying these criteria it became clear that within each phase, particularly 3 and
4, there was a great deal of variation in the burden of Aβ deposition. Therefore, I
further sub-divided each phase to generate an intuitive 12 stage rating system,
allowing more sensitive detection of differences between cases whilst maintaining
quick and easy rating of pathology (Figure 4.2 B). Representative images of Aβ
pathology at each stage are shown in Figure 4.3...
4.3.3 Semi-quantitative rating of hippocampal tau pathology
Hyperphosphorylated tau pathology was semi-quantitatively rated in sections stained
for AT8 using criteria described in (Lace et al., 2009) (Error! Reference source not
found.). Ratings were based on a 0-3 scale (none, mild, moderate, severe) in the DG,
CA4, CA3, CA2, CA1, subiculum, EC and transentorhinal cortex, taking into account:
Tau positive neuropil threads
Tau positive neurons (tangles and pretangles)
Neuritic plaques
White matter neuropil threads
4.3.4 Statistical analyses
Ordinal data (AD pathology ratings) were compared using Mann-Whitney U test and
Spearman’s rank correlation. LC3 and Beclin-1 data were normally distributed whereas
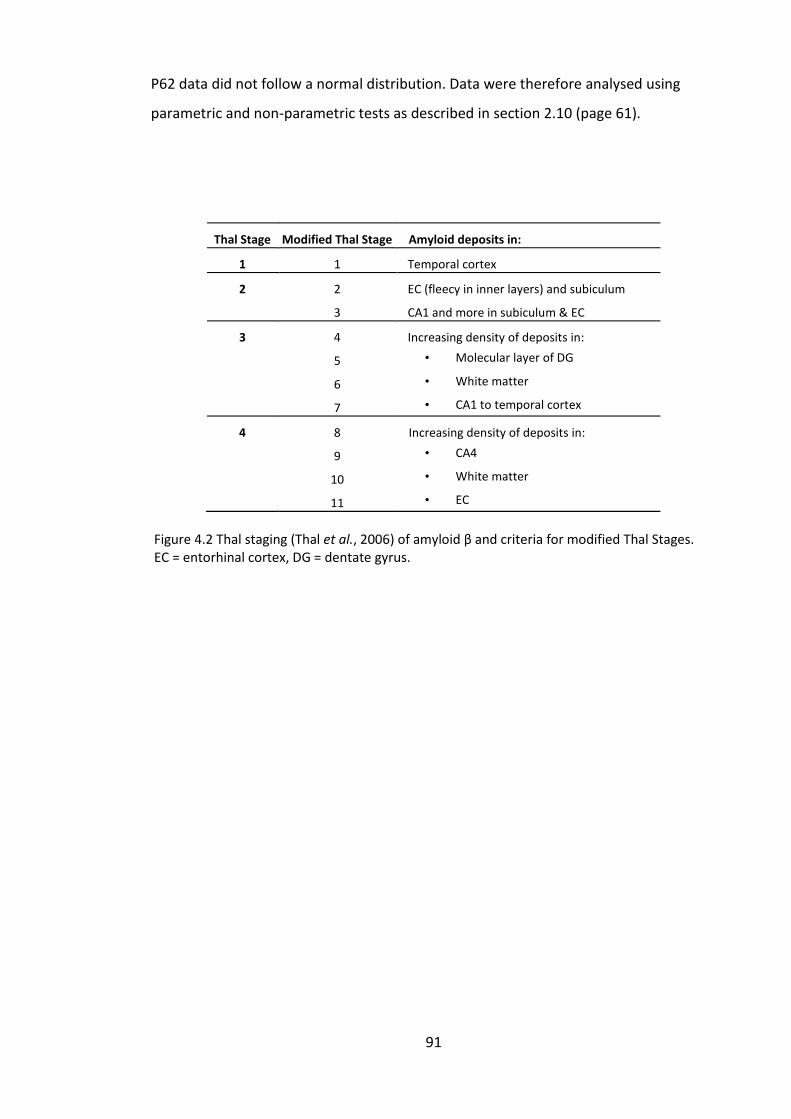
91
P62 data did not follow a normal distribution. Data were therefore analysed using
parametric and non-parametric tests as described in section 2.10 (page 61).
Thal Stage Modified Thal Stage Amyloid deposits in:
1 1 Temporal cortex
2 2 EC (fleecy in inner layers) and subiculum
3 CA1 and more in subiculum & EC
3 4 Increasing density of deposits in:
5 • Molecular layer of DG
6 • White matter
7 • CA1 to temporal cortex
4 8 Increasing density of deposits in:
9 • CA4
10 • White matter
11 • EC
Figure 4.2 Thal staging (Thal et al., 2006) of amyloid β and criteria for modified Thal Stages. EC = entorhinal cortex, DG = dentate gyrus.
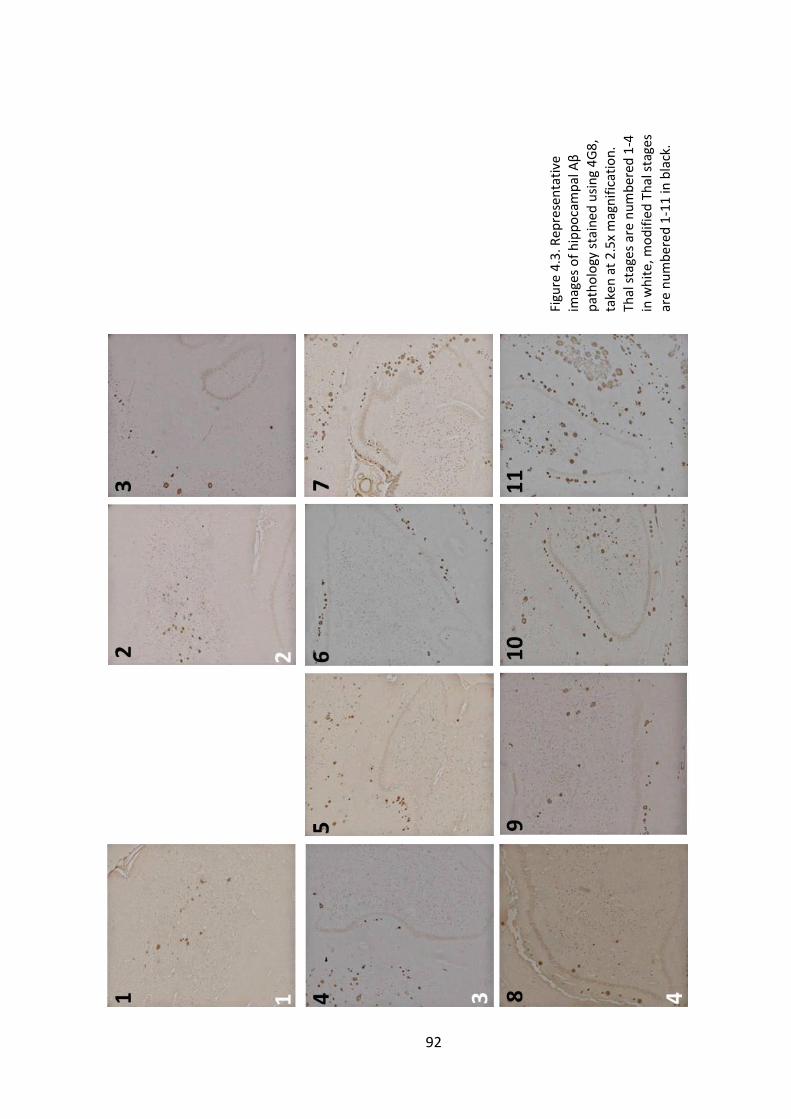
92
Figu
re 4
.3. R
epre
sen
tati
ve
imag
es o
f h
ipp
oca
mp
al A
β
pat
ho
logy
sta
ined
usi
ng
4G
8,
take
n a
t 2
.5x
mag
nif
icat
ion
. Th
al s
tage
s ar
e n
um
ber
ed 1
-4
in w
hit
e, m
od
ifie
d T
hal
sta
ges
are
nu
mb
ered
1-1
1 in
bla
ck.
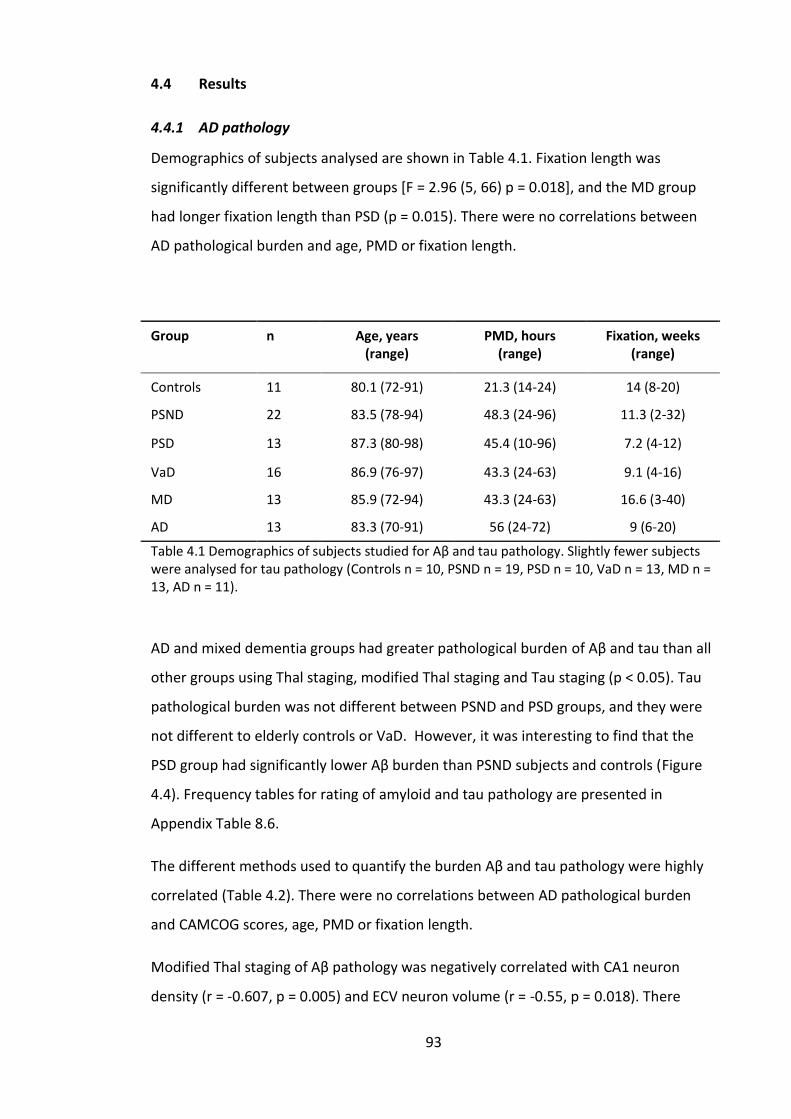
93
4.4 Results
4.4.1 AD pathology
Demographics of subjects analysed are shown in Table 4.1. Fixation length was
significantly different between groups [F = 2.96 (5, 66) p = 0.018], and the MD group
had longer fixation length than PSD (p = 0.015). There were no correlations between
AD pathological burden and age, PMD or fixation length.
Group n Age, years (range)
PMD, hours (range)
Fixation, weeks (range)
Controls 11 80.1 (72-91) 21.3 (14-24) 14 (8-20)
PSND 22 83.5 (78-94) 48.3 (24-96) 11.3 (2-32)
PSD 13 87.3 (80-98) 45.4 (10-96) 7.2 (4-12)
VaD 16 86.9 (76-97) 43.3 (24-63) 9.1 (4-16)
MD 13 85.9 (72-94) 43.3 (24-63) 16.6 (3-40)
AD 13 83.3 (70-91) 56 (24-72) 9 (6-20)
Table 4.1 Demographics of subjects studied for Aβ and tau pathology. Slightly fewer subjects were analysed for tau pathology (Controls n = 10, PSND n = 19, PSD n = 10, VaD n = 13, MD n = 13, AD n = 11).
AD and mixed dementia groups had greater pathological burden of Aβ and tau than all
other groups using Thal staging, modified Thal staging and Tau staging (p < 0.05). Tau
pathological burden was not different between PSND and PSD groups, and they were
not different to elderly controls or VaD. However, it was interesting to find that the
PSD group had significantly lower Aβ burden than PSND subjects and controls (Figure
4.4). Frequency tables for rating of amyloid and tau pathology are presented in
Appendix Table 8.6.
The different methods used to quantify the burden Aβ and tau pathology were highly
correlated (Table 4.2). There were no correlations between AD pathological burden
and CAMCOG scores, age, PMD or fixation length.
Modified Thal staging of Aβ pathology was negatively correlated with CA1 neuron
density (r = -0.607, p = 0.005) and ECV neuron volume (r = -0.55, p = 0.018). There
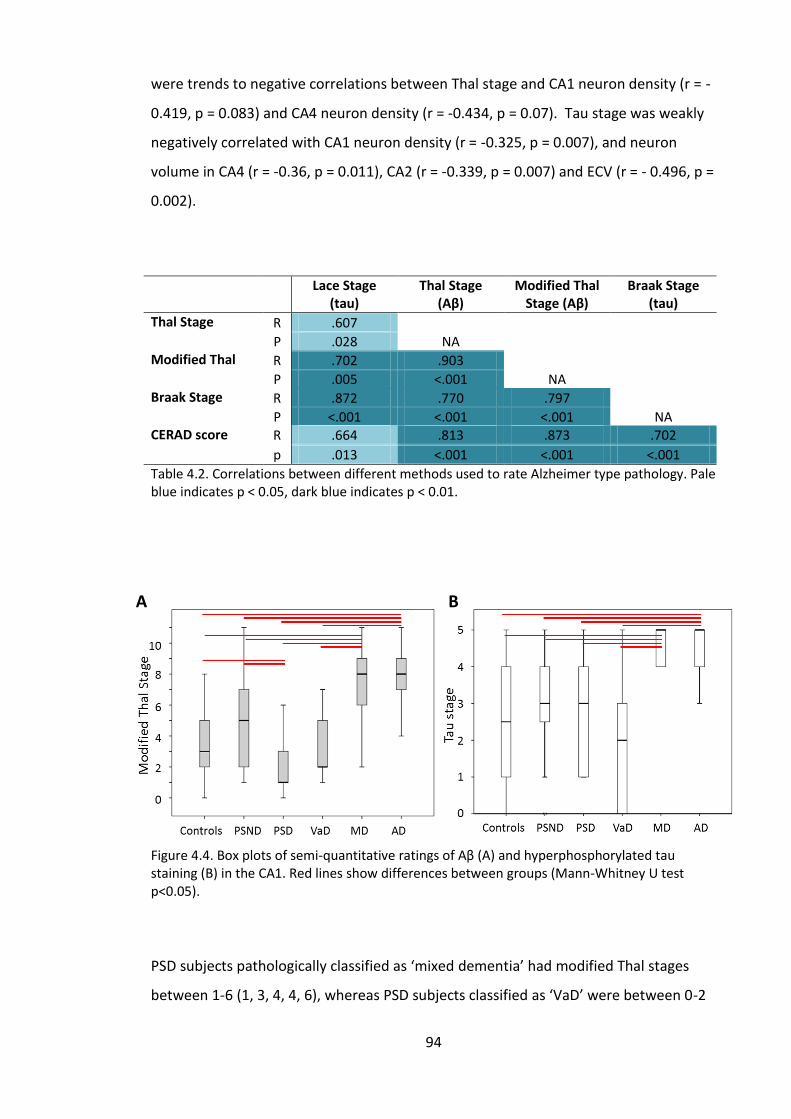
94
were trends to negative correlations between Thal stage and CA1 neuron density (r = -
0.419, p = 0.083) and CA4 neuron density (r = -0.434, p = 0.07). Tau stage was weakly
negatively correlated with CA1 neuron density (r = -0.325, p = 0.007), and neuron
volume in CA4 (r = -0.36, p = 0.011), CA2 (r = -0.339, p = 0.007) and ECV (r = - 0.496, p =
0.002).
Lace Stage
(tau) Thal Stage
(Aβ) Modified Thal
Stage (Aβ) Braak Stage
(tau)
Thal Stage
R .607
NA P .028 Modified Thal R .702 .903
NA P .005 <.001 Braak Stage
R .872 .770 .797
NA P <.001 <.001 <.001 CERAD score R .664 .813 .873 .702
p .013 <.001 <.001 <.001
Table 4.2. Correlations between different methods used to rate Alzheimer type pathology. Pale blue indicates p < 0.05, dark blue indicates p < 0.01.
Figure 4.4. Box plots of semi-quantitative ratings of Aβ (A) and hyperphosphorylated tau staining (B) in the CA1. Red lines show differences between groups (Mann-Whitney U test p<0.05).
PSD subjects pathologically classified as ‘mixed dementia’ had modified Thal stages
between 1-6 (1, 3, 4, 4, 6), whereas PSD subjects classified as ‘VaD’ were between 0-2
A B
95
(0, 0, 1, 1, 1, 1, 2, 2). The MD group generally had much higher modified Thal stages
than the PSD ‘MD’ (2, 5, 6, 6, 7, 8, 8, 9 9, 9, 11, 11, 11), indicating that the PSD MD
subjects did not have equivalent levels of amyloid deposition in the hippocampus as
the stroke-free MD subjects.
It was also interesting to observe that Braak staging did not always reflect burden of
hippocampal tau pathology, demonstrated in Figure 4.5 where a PSND subject with
Braak stage 1 had greater number of tau immunopositive neurons and neurites than a
PSND subject with Braak stage 5.
Figure 4.5. Representative images demonstrating the variability of AT8-positive staining in the CA1 in subjects with different Braak scores. A = PSND, Braak stage 1; B = PSND, Braak stage 5, C = PSD, Braak stage 3; D = AD, Braak stage =6.Scale bar = 50um.
96
4.4.2 Autophagy markers
Group demographics for subjects analysed using LC3 and Beclin-1 are shown in Table
4.3, and P62 in Table 4.4. There were no significant differences in age, PMD or fixation
length between groups studied for LC3, Beclin-1 or P62 analysis.
Group n Age, years
Mean (range) PMD, hours
Mean (range) Fixation, weeks Mean (range)
Controls 8 82.4 (74-94) 34 (15-67) 9 (1-16)
PSND 8 83.1 (78-89) 32 (11-48) 3(2-5)
PSD 8 84 (80-89) 47 (10-81) 3 (2-5)
AD 6 81 (70-91) 35 (6-72) 8 (5-20)
Table 4.3 Demographics of subjects investigated using LC3 and Beclin-1.
Table 4.4. Demographics of subjects investigated using P62.
There were no significant differences in LC3 or Beclin-1 %PA or IOD between groups in
CA1 or CA2 (Figure 4.6 A and B). Numerical values of mean IOD and %PA are presented
in Appendix Table 8.7. P62 CA1 %PA was significantly different across all groups [H (3)
= 7.934, p = 0.047] (Figure 4.6 C). The AD group had significantly greater P62 CA1 %PA
than controls (p = 0.012) and trends to greater %PA compared to PSND (p = 0.081) and
PSD (p = 0.094). However, when one outlier in the AD group was removed, these
differences were no longer significant (p = 0.093). CA2 P62 mean IOD was also
significantly different across all groups [H (3) = 5.04, p = 0.007]. AD had significantly
greater CA2 IOD than PSND and PSD (p = 0.021 and p = 0.007 respectively). When the
PSD group was divided based upon pathological diagnosis, there was a trend to PSD
(MD) subjects having higher CA2 mean IOD than PSD (VaD) (p = 0.072).
Group n Age, years
Mean (range) PMD, hours
Mean (range) Fixation, weeks Mean (range)
Controls 6 82.4 (74-94) 34 (15-67) 10 (6-16)
PSND 6 83.4 (78-89) 37 (11-76) 9 (3-20)
PSD 10 84.1 (76-93) 42 (10-81) 9 (2-26)
AD 7 82.4 (70-91) 40 (6-72) 9 (6-20)
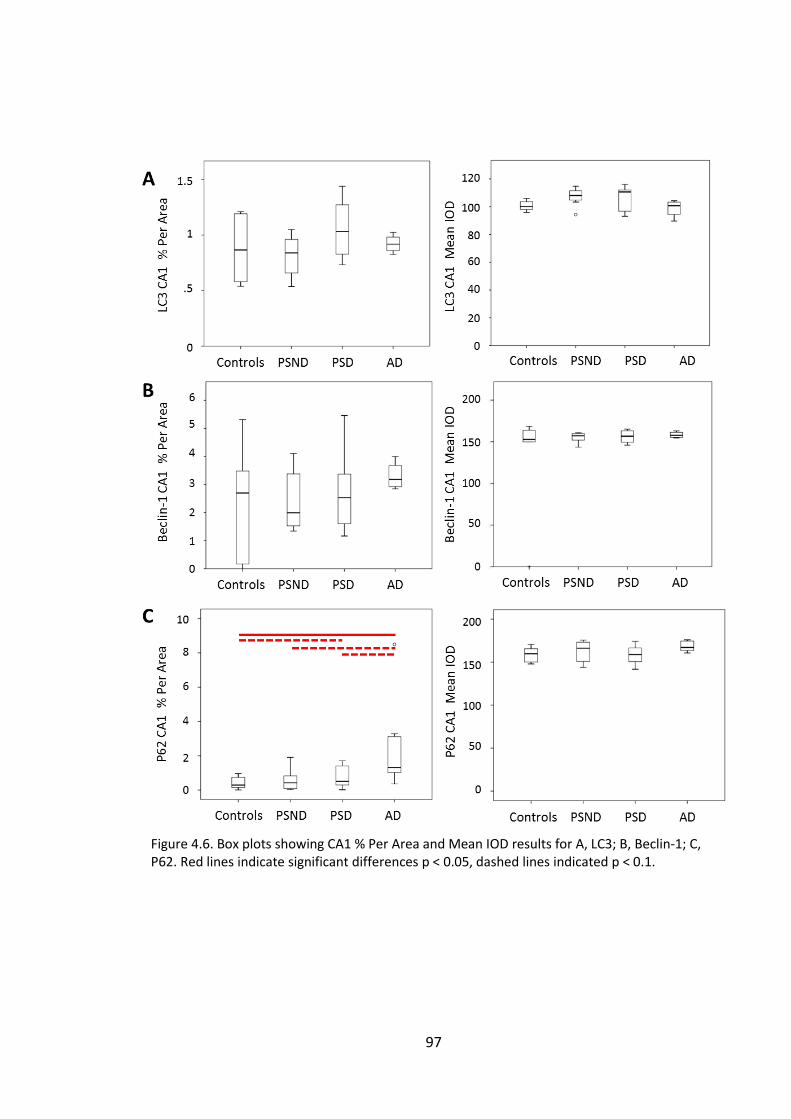
97
Figure 4.6. Box plots showing CA1 % Per Area and Mean IOD results for A, LC3; B, Beclin-1; C, P62. Red lines indicate significant differences p < 0.05, dashed lines indicated p < 0.1.
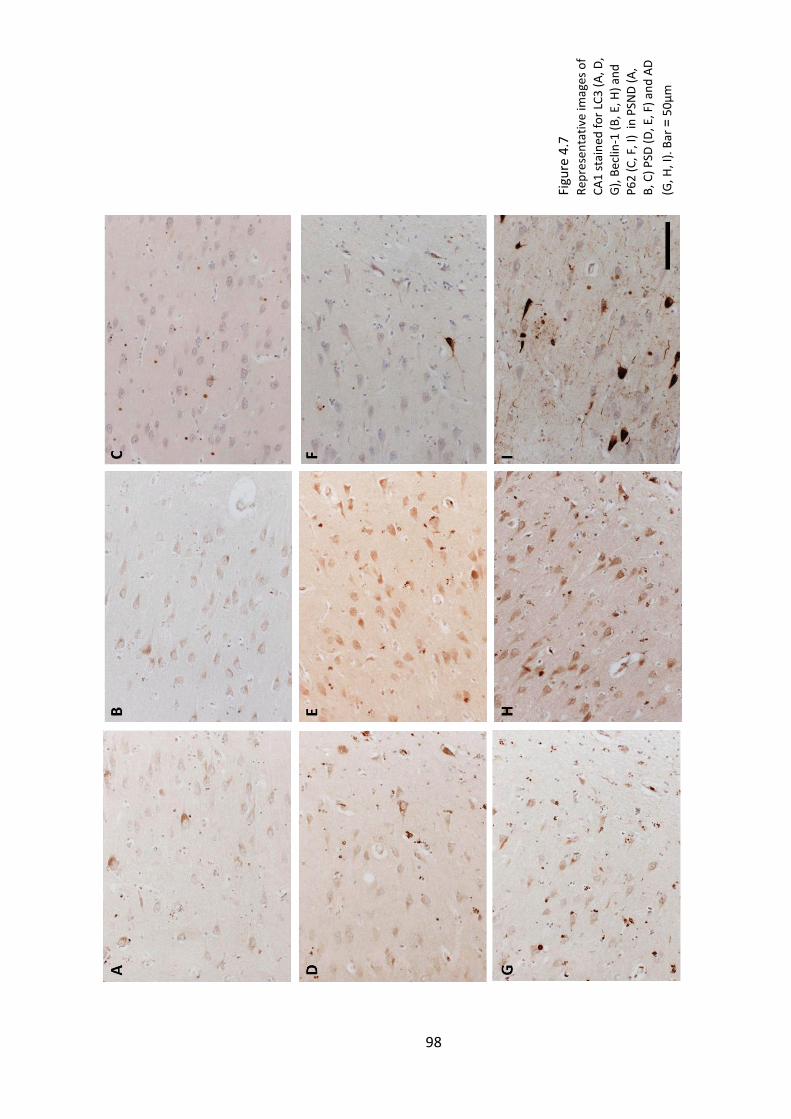
98
Figu
re 4
.7
Rep
rese
nta
tive
imag
es
of
CA
1 s
tain
ed f
or
LC3
(A
, D,
G),
Be
clin
-1 (
B, E
, H)
and
P6
2 (
C, F
, I)
in P
SND
(A
,
B, C
) P
SD (
D, E
, F)
and
AD
(G, H
, I).
Bar
= 5
0µ
m
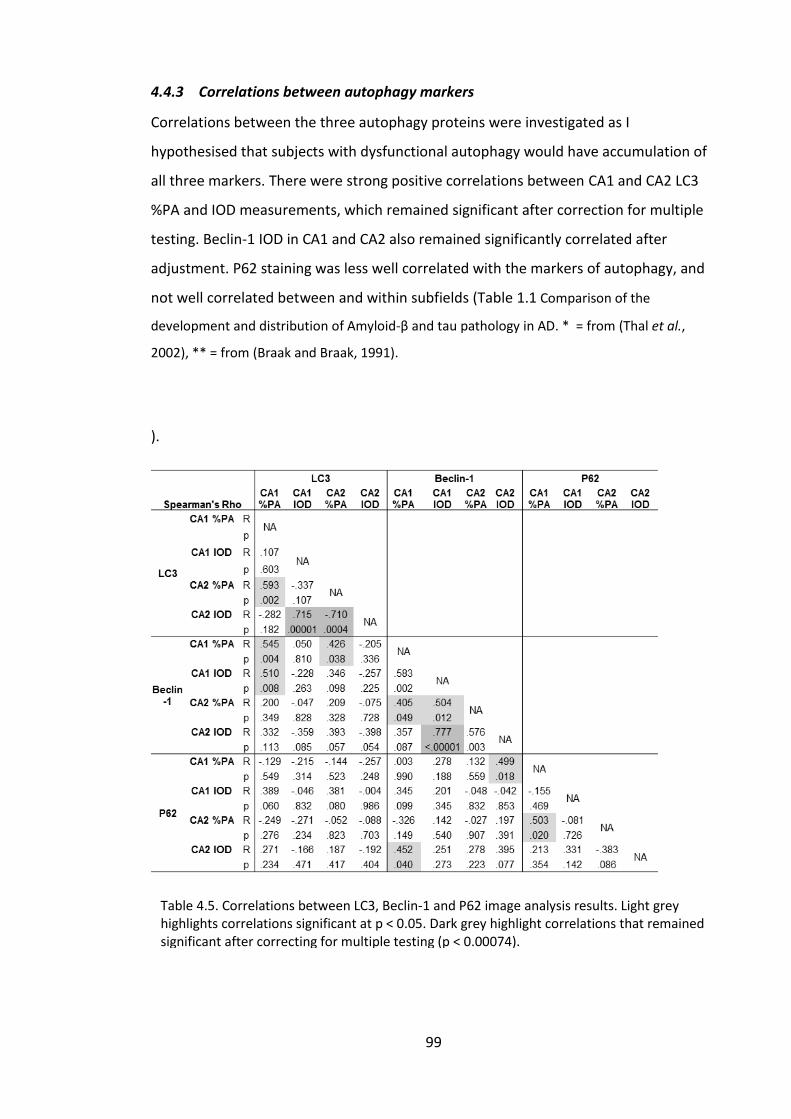
99
4.4.3 Correlations between autophagy markers
Correlations between the three autophagy proteins were investigated as I
hypothesised that subjects with dysfunctional autophagy would have accumulation of
all three markers. There were strong positive correlations between CA1 and CA2 LC3
%PA and IOD measurements, which remained significant after correction for multiple
testing. Beclin-1 IOD in CA1 and CA2 also remained significantly correlated after
adjustment. P62 staining was less well correlated with the markers of autophagy, and
not well correlated between and within subfields (Table 1.1 Comparison of the
development and distribution of Amyloid-β and tau pathology in AD. * = from (Thal et al.,
2002), ** = from (Braak and Braak, 1991).
).
Table 4.5. Correlations between LC3, Beclin-1 and P62 image analysis results. Light grey highlights correlations significant at p < 0.05. Dark grey highlight correlations that remained significant after correcting for multiple testing (p < 0.00074).
Dark blue highlights p < 0.01, mid blue highlights p < 0.05, pale blue highlights trends p < 0.1.
100
4.4.4 Clinicopathological correlations
P62 CA1 IOD was negatively correlated with modified Thal score (r = -0.651, p = 0.03)
and there was a trend to a positive correlation with Tau stage (Lace) (r = 0.581, p =
0.078). When the outlier in the AD group was removed, P62 CA1 IOD was positively
correlated with Tau stage (r = 0.621, p = 0.006) and CERAD score (r = 0.513, p = 0.004).
P62 CA2 IOD was correlated with Braak stage (r = 0.496, p = 0.022), and there were
trends to significant correlations with CERAD score (r = 0.418, p = 0.067), and modified
Thal score (r = 0.639, p = 0.064). LC3 CA2 IOD was negatively correlated with CERAD
score (r = -0.444, p = 0.038), and modified Thal score (r = -0.651, p = 0.03) and there
was a trend to negative correlation with tau stage (r = -0.589, p = 0.073). There were
no correlations between Beclin-1 and AD pathology.
Global vascular pathology scores were negatively correlated with Beclin-1 CA1 IOD (r =
-0.849, p = 0.004) and there was a trend with P62 CA2 %PA (r = -0.721, p = 0.068). LC3
CA1 IOD was positively correlated with vascular pathology scores (r = 0.689, p = 0.04).
CAMCOG scores were negatively correlated with LC3 CA1 IOD (r = -0.715, p = 0.03) and
memory scores were negatively correlated with LC3 CA1 %PA (r = -0.528, p = 0.052),
and there was a trend with P62 CA1 IOD (r = -0.621, 0 = 0.074). There were no
correlations between autophagy markers and age or fixation, however PMD was
positively correlated with LC3 IOD in CA1 and CA2 (r = 0.398, p = 0.044 and r = 0.569, p
= 0.004 respectively).
4.5 Discussion
4.5.1 Hippocampal AD pathology
As expected, hippocampal Alzheimer’s pathological burden was highest in the AD and
MD groups. However, it was surprising to find that the PSD group had significantly
lower amyloid-β pathology than PSND and control groups, and that amyloid-β and tau
pathology were not related to post-stroke cognitive impairment. This may be because
stroke survivors with significant pre-existing AD pathology were less likely to be
included in the CogFAST study, as they were less likely to recover full cognitive function
after stroke. The higher mean amyloid burden in PSND group may reflect better
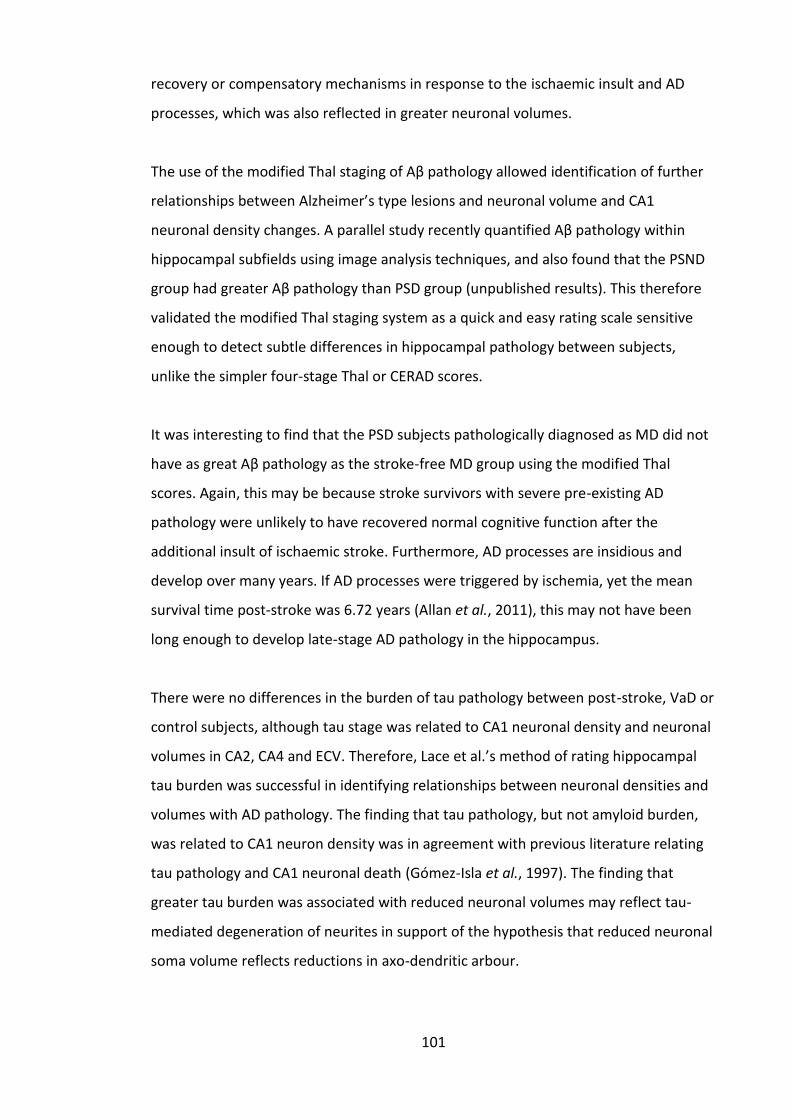
101
recovery or compensatory mechanisms in response to the ischaemic insult and AD
processes, which was also reflected in greater neuronal volumes.
The use of the modified Thal staging of Aβ pathology allowed identification of further
relationships between Alzheimer’s type lesions and neuronal volume and CA1
neuronal density changes. A parallel study recently quantified Aβ pathology within
hippocampal subfields using image analysis techniques, and also found that the PSND
group had greater Aβ pathology than PSD group (unpublished results). This therefore
validated the modified Thal staging system as a quick and easy rating scale sensitive
enough to detect subtle differences in hippocampal pathology between subjects,
unlike the simpler four-stage Thal or CERAD scores.
It was interesting to find that the PSD subjects pathologically diagnosed as MD did not
have as great Aβ pathology as the stroke-free MD group using the modified Thal
scores. Again, this may be because stroke survivors with severe pre-existing AD
pathology were unlikely to have recovered normal cognitive function after the
additional insult of ischaemic stroke. Furthermore, AD processes are insidious and
develop over many years. If AD processes were triggered by ischemia, yet the mean
survival time post-stroke was 6.72 years (Allan et al., 2011), this may not have been
long enough to develop late-stage AD pathology in the hippocampus.
There were no differences in the burden of tau pathology between post-stroke, VaD or
control subjects, although tau stage was related to CA1 neuronal density and neuronal
volumes in CA2, CA4 and ECV. Therefore, Lace et al.’s method of rating hippocampal
tau burden was successful in identifying relationships between neuronal densities and
volumes with AD pathology. The finding that tau pathology, but not amyloid burden,
was related to CA1 neuron density was in agreement with previous literature relating
tau pathology and CA1 neuronal death (Gómez-Isla et al., 1997). The finding that
greater tau burden was associated with reduced neuronal volumes may reflect tau-
mediated degeneration of neurites in support of the hypothesis that reduced neuronal
soma volume reflects reductions in axo-dendritic arbour.
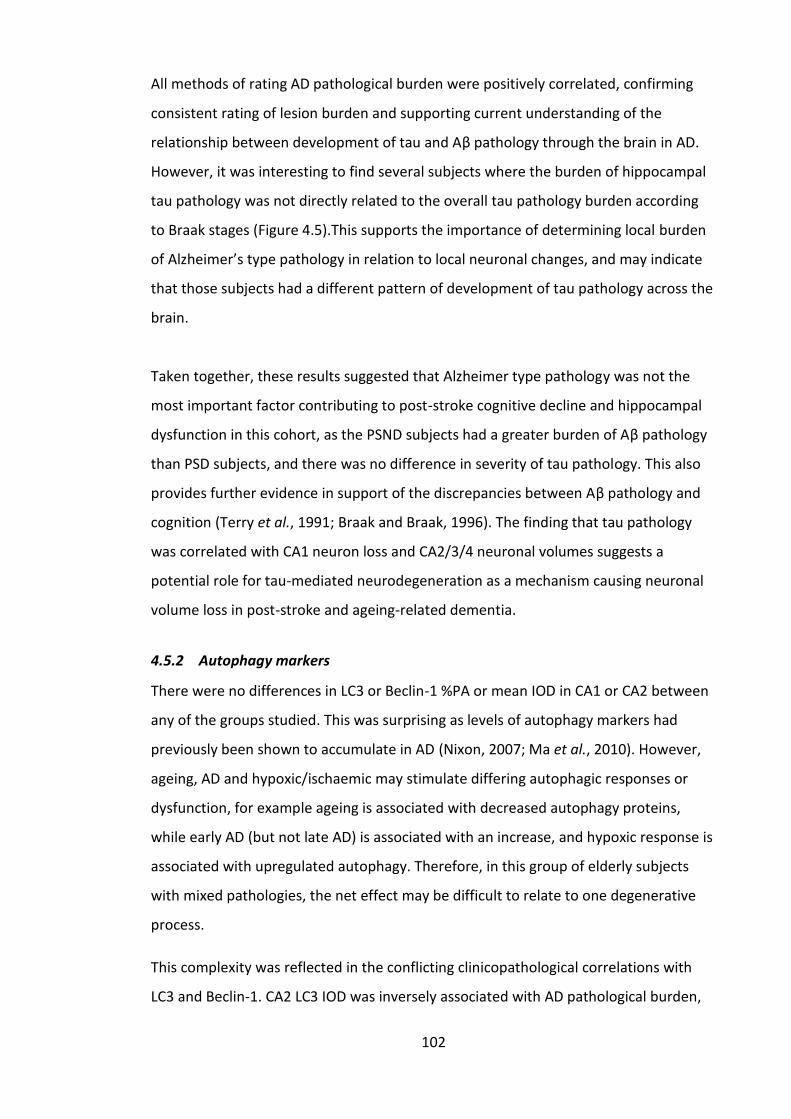
102
All methods of rating AD pathological burden were positively correlated, confirming
consistent rating of lesion burden and supporting current understanding of the
relationship between development of tau and Aβ pathology through the brain in AD.
However, it was interesting to find several subjects where the burden of hippocampal
tau pathology was not directly related to the overall tau pathology burden according
to Braak stages (Figure 4.5).This supports the importance of determining local burden
of Alzheimer’s type pathology in relation to local neuronal changes, and may indicate
that those subjects had a different pattern of development of tau pathology across the
brain.
Taken together, these results suggested that Alzheimer type pathology was not the
most important factor contributing to post-stroke cognitive decline and hippocampal
dysfunction in this cohort, as the PSND subjects had a greater burden of Aβ pathology
than PSD subjects, and there was no difference in severity of tau pathology. This also
provides further evidence in support of the discrepancies between Aβ pathology and
cognition (Terry et al., 1991; Braak and Braak, 1996). The finding that tau pathology
was correlated with CA1 neuron loss and CA2/3/4 neuronal volumes suggests a
potential role for tau-mediated neurodegeneration as a mechanism causing neuronal
volume loss in post-stroke and ageing-related dementia.
4.5.2 Autophagy markers
There were no differences in LC3 or Beclin-1 %PA or mean IOD in CA1 or CA2 between
any of the groups studied. This was surprising as levels of autophagy markers had
previously been shown to accumulate in AD (Nixon, 2007; Ma et al., 2010). However,
ageing, AD and hypoxic/ischaemic may stimulate differing autophagic responses or
dysfunction, for example ageing is associated with decreased autophagy proteins,
while early AD (but not late AD) is associated with an increase, and hypoxic response is
associated with upregulated autophagy. Therefore, in this group of elderly subjects
with mixed pathologies, the net effect may be difficult to relate to one degenerative
process.
This complexity was reflected in the conflicting clinicopathological correlations with
LC3 and Beclin-1. CA2 LC3 IOD was inversely associated with AD pathological burden,
103
in agreement with previous studies demonstrating that the accumulation of
autophagic markers is highest earlier in AD (Ma et al., 2010). However, Beclin-1 levels
were not associated with AD pathology, and there were conflicting correlations
between LC3 and Beclin-1 levels and global CVD burden; increased LC3 CA1 IOD but
decreased Beclin-1 CA1 IOD were associated with greater burden of CVD lesions.
Furthermore, there were surprisingly few correlations between autophagy markers, as
I had hypothesised that dysfunctional autophagy would result in increased levels of all
autophagy markers. This suggests that there may have been differential effects at
different stages of the autophagy pathway. As LC3 and Beclin-1 are involved in the
early stages of autophagy, it remains unclear whether autophagy was upregulated or
impaired in relation to CVD processes in these dementia subjects. Furthermore, the
correlations between LC3 IOD and PMD suggests that LC3 may have had been affected
during cell death processes, which should be taken into consideration when
attempting to draw conclusions from these results.
An additional factor that made these results difficult to interpret was the loss of
neurons in CA1. As subjects in the disease groups had significantly reduced CA1
neuronal density, autophagy marker %PA measurements could appear reduced even if
they were actually present in a high proportion of the surviving neurons. A previous
study has suggested that autophagy markers build up in neurons targeted for
neurodegeneration (Ma et al., 2010), implying that surviving neurons have non-
impaired autophagy and therefore low levels of autophagy markers. This may be one
reason why few differences or correlations were found with %PA results, as neurons
with pathological autophagy dysfunction may have already been lost.
P62 levels were related to AD pathology but not cerebrovascular disease. The AD
group had greater P62 %PA in CA1 and IOD in CA2 than the other groups studied, and
P62 levels were related tau stages, modified Thal scores and CERAD scores in the CA1
and CA2. However, greater burden of Aβ pathology was associated with more intense
P62 staining in CA2, but less intense P62 staining in CA1. This apparent disparity may
be due to more severe AD pathology causing neurodegeneration in CA1 but not CA2.
Greater burden of AD processes would result in loss of severely impaired neurons in
CA1 and therefore loss of intense P62 staining, whereas CA2 neurons appear to resist
neurodegeneration, despite development of intracellular NFT and P62 aggregates.
104
PSD cases pathologically diagnosed as MD had greater P62 IOD than PSD-VaD subjects.
Together with the finding of greater intensity of P62 staining in AD subjects this
support previous studies which have found that P62 is robustly present in tau
aggregates (Kuusisto et al., 2002; Salminen et al., 2012). Although in most subjects P62
staining was restricted to intense cytoplasmic staining, some AD cases also had thread-
like positive staining in the neuropil (Appendix Figure 8.3). Furthermore, some subjects
had darkly stained extracellular circular structures similar to those seen in argyrophilic
grain disease (Scott and Lowe, 2007). This wasn’t limited to cases with AD or mixed
dementia, as it was also observed in two controls (Braak 3 and 2), one PSND (Braak 1),
and three PSD subjects (two MD and one VaD), suggesting different disease
mechanisms may also be involved in these subjects.
4.6 Conclusions
These results suggest that Alzheimer’s type pathology was not the most important
disease mechanism contributing to post-stroke cognitive decline in this cohort, as
although there were no differences in tau pathology burden, PSND subjects had
greater Aβ pathology than PSD. Investigation of autophagy as a potential mechanism
relating disease pathology to neuronal volume and density changes yielded
contradictory results that were difficult to interpret. In agreement with previous
studies, LC3 was higher in early stages of AD, however the relationship between LC3,
Beclin-1 and vascular lesions appears to be complex. P62 was associated with AD
pathology, but not necessarily related to markers of autophagy LC3 or Beclin-1.
Determining the role of autophagy in CVD will require strictly controlled experiments
without effects of other neurodegenerative or cellular stress mechanisms such as post-
mortem delay which may influence up- or down-regulation of autophagy markers.
105
Chapter 5. Hippocampal Dendritic Changes in Post-Stroke and Ageing-
Related Dementias
5.1 Introduction
Neuronal soma volume is thought to reflect the amount of cellular machinery needed
to support the axonal and dendritic arbour (Harrison and Eastwood, 2001). I therefore
hypothesised that the observed decreases in neuronal soma volumes in post-stroke
and ageing related dementia were associated with a loss of or reduced complexity of
dendritic arbour. Other studies have previously suggested that reduced neuronal soma
volume is related to dendrite loss and tissue atrophy even without neuron loss
(Selemon and Goldman-Rakic, 1999). This ‘reduced neuropil hypothesis’ proposed that
cortical tissue atrophy in schizophrenia was caused by shrinkage of neuronal soma
volumes and interneuronal space, as studies had reported neuronal soma volume loss
(Rajkowska et al., 1998) and dendritic spine loss in association with thinning of the
prefrontal cortex (Selemon and Goldman-Rakic, 1999). As PSD subjects in the CogFAST
study were found to have greater MTL atrophy and smaller hippocampal neuronal
volumes than PSND (Firbank et al., 2007), I reasoned that dendritic arbour and synapse
loss may have contributed to neuronal volume reductions and cognitive impairment
after stroke.
5.1.1 Dendrites and dendritic spines
Dendrites are the major site of neuronal excitatory inputs and make thousands of
dynamic connections with other neurons. Dendrites of hippocampal pyramidal
neurons contain numerous characteristic small protrusions called dendritic spines,
which are the sites of excitatory synapses with passing axons Error! Reference source
not found.(Harris et al., 1992). Dendritic spines are typically characterized by a
mushroom shape, with a fine neck and bulbous head which contains the post-synaptic
sites of excitatory synapses (Harris, 1999). The number and morphology of dendritic
spines is related to afferent activity (Jia et al., 2012), and reflects the stability and
strength of responses (Holtmaat et al., 2006). This structural plasticity of dendritic
spines therefore mirrors synapse function and plasticity, where long term potentiation
is associated with spine enlargement and long-term depression with spine shrinkage
106
(Kasai et al., 2010). It is now widely believed that dynamic changes in spine density,
size and strength form the biological bass of learning and memory in the brain
(Spronsen and Hoogenraad, 2010).
As the size, extent and branching patters of dendrites directly influences the number
and function of synapses, it is unsurprising that human and animal studies have found
that dendritic alterations are important pathological features contributing to cognitive
dysfunction and dementia (Cotter et al., 2000; Penzes et al., 2011). Indeed,
dysfunctional neuronal communication has been suggested to be the underlying cause
of many psychiatric and neurological diseases (Selkoe, 2002; Spronsen and
Hoogenraad, 2010). This theory has been supported by numerous reports of
disruptions to spine size, shape and number in disorders associated with deficits in
information processing (Penzes et al., 2011). However, dendrites and dendritic spines
are highly dynamic which presents particular challenges to studying them in post-
mortem tissue.
5.1.2 Techniques used to study dendrite morphology: Golgi staining
The Golgi method remains the preferred method for visualizing the fine structure of
dendrites and dendritic spines (Golgi, 1873). The Golgi method is now broadly used to
describe a group of techniques based on the original silver impregnation method.
These techniques use potassium dichromate in the first step of impregnation, then
tissue is immersed in silver nitrate and fine crystals of silver chromate are formed
within the tissue, resulting in dark brown/black staining of <5% of neurons Error!
Reference source not found.(Rosoklija et al., 2003). This technique allows unique
visualisation of the profile of the entire dendritic arbour and dendritic spine
morphology in fixed tissue, and has been a vital tool in our understanding of dendrites
in health and dendritic changes in disease. However, the chemical basis of Golgi
staining remains poorly understood, raising concerns about the capricious and
inconsistent staining results, and the apparently random selective staining of only ~5%
of neurons (Špaček, 1989). These inconsistencies have been suggested to be due to
factors affecting Golgi impregnation such as pre-mortem agonal state (Flood, 1993) or
post-mortem delay (Buell, 1982).
107
Studies aspiring to use Golgi staining in human post-mortem studies are limited by the
availability of entire blocks of appropriate tissue which has been briefly fixed but not
paraffin-embedded. Sufficient quantities of appropriate tissue are therefore scarce in
brain bank settings where tissue is stored for long periods of time, although recent
advances have been made in using Golgi techniques in thin tissue sections rather than
whole blocks (Levine et al., 2013). However, hippocampal tissue from the CogFAST
cohort was stored frozen or in paraffin-embedded blocks and was therefore
inappropriate for a Golgi study of dendritic changes in delayed PSD. Therefore,
alternative methods to investigate dendrites and dendritic spines were explored.
5.1.3 Techniques used to study dendrite morphology: MAP2 IHC
Immunohistochemical staining for the dendritic protein microtubule-associated
protein 2 (MAP2) allows visualization of dendrites in paraffin-embedded tissue for
morphological and quantitative investigation. Microtubule associated proteins (MAPs)
are a major group of cytoskeletal proteins involved in regulating neuronal morphology,
of which MAP2 is the most abundant in the brain. MAP2 has a critical role in regulating
the structure and function of dendrites, as it stabilizes dendritic microtubules by
forming cross-bridges between microtubules and other cytoskeletal components
(Yanagihara et al., 1990; Conde and Cáceres, 2009). MAP2 therefore has an important
role in determining the number, stability and location of synapses, and MAP2
expression has been shown to be related to dendritic outgrowth, branching and
remodelling (Liu et al., 2005). Changes to MAP2 have been suggested to underlie
pathological alterations in neuronal morphology (Cotter et al., 2000), as degraded or
dysfunctional MAP2 would result in impaired interactions between cytoskeletal
proteins, leading to microtubule disassembly and degradation of dendrites (Liu et al.,
2005).
5.1.4 Dendritic changes after ischemia
Studies have reported a reduction in hippocampal MAP2 immunoreactivity in human
and animal models of hypoxia; including after transient global ischemia caused by
cardiac arrest in patients (Akulinin and Dahlstrom, 2003), in a gerbil model of transient
cerebral ischemia (Kitagawa et al., 1989; Yanagihara et al., 1990; Yoshimi et al., 1991),
and in a two-vessel occlusion (2-VO) rat model, where reduced hippocampal MAP2
108
mRNA and protein levels were also related to spatial memory impairments (Liu et al.,
2005). Rapid loss of MAP2 immunoreactivity has also been reported in damaged brain
areas following hypoxia and ischemia in rodent models of stroke (Zhang et al., 1999;
Kitano et al., 2004), and in an in vitro model of acute transient focal ischemia (Pastori
et al., 2007).
MAP2 is known to be particularly vulnerable in ischaemic injury, which indicates that
dendrites are particularly susceptible to ischaemic damage (Yan et al., 2013). The
vulnerability of dendrites to ischaemic injury has been suggested to be related to
excitotoxic increases in intracellular calcium concentration, which activates calcium-
dependent proteases which degrade MAP2, leading to a rapid disassembly of
microtubules (Yanagihara et al., 1990). However, some evidence suggests the acute
loss of MAP2 immunoreactivity in dendrites after hypoxia reflects MAP2 relocation to
neuronal soma rather than degradation (Hoskison and Shuttleworth, 2006), although
either response indicates dendritic dysfunction. Therefore, I hypothesised that greater
loss of MAP2 immunoreactivity would indicate greater hypoxic injury to neurons, and
may be a mechanism related to cognitive impairment in PSD and ageing-related
dementias.
In contrast to dendritic MAP2 studies, an in-vivo intracellular recording and staining
methods in rat model of transient forebrain ischemia reported acute increases in
dendritic length up to 48 hours after ischemia, finding significant outgrowth of mid-
section dendrites from CA1 neurons after ischemia (Ruan et al., 2006). As 90% of CA1
neurons were previously shown to undergo delayed neuronal death under these
experimental conditions, dendritic outgrowth was suggested to contribute to
excitotoxic cell death due to the increased receptive field of CA1 neurons. This
outgrowth was suggested to be stimulated by increased CA3 activity activating NMDA
receptors on mid-section CA1 dendrites via the Schaeffer collaterals, which is known to
promote dendritic branching (Ruan et al., 2006). They also found a dramatic increase
in the number of neurons with disoriented dendrites after ischemia (i.e. basal
dendrites arising from apical dendritic trunks and vice versa), suggesting that
mechanisms involved in regulating dendritic outgrowth were impaired.
109
These findings appear to contradict those from studies demonstrating a loss of
hippocampal MAP2 after ischemia. Furthermore, a Golgi study of chronic cerebral
hypoperfusion in 2-vessel occlusion (2VO) rats found that CA1 dendritic length and
arborization started to decrease four weeks after surgery, while spine loss and
memory impairments were detectable two weeks post-surgery (Jia et al., 2012).
Although not entirely contradictory, these inconsistent reports of dendritic increases
and decreases after hypoxic-ischaemic injury may reflect differences in the methods
and time courses used in these studies to quantify dendrites. As the loss of MAP2
indicates disintegration of dendritic microtubules and therefore dendritic dysfunction,
MAP2 may allow more insight into the functionality of dendrites after ischemia than
simple structural observations.
Interestingly, Golgi studies have reported increases in dendritic arborization in the CA1
neurons of diabetic rats (Martanez-Tellez et al., 2005) and pyramidal neurons of the
prefrontal cortex in rat model of chronic hypertension (Vega et al., 2004), suggesting a
possible vascular mechanism causing dendritic outgrowth. Studies have also reported
increased MAP2 immunoreactive dendritic length in the CA1, CA2, CA3 and subiculum
in schizophrenia (Cotter et al., 2000), but reduced MAP2 neuronal expression and
reduced dendrite numbers in dlPFC in autism (Mukaetova-Ladinska et al., 2004).
These variable findings of relationships between MAP2 levels in relation to cognitive
dysfunction and ischemia suggested interpretation of studies using MAP2 would be
challenging. However, the MAP2 was the best available marker to study dendrites in
the tissue available, and was therefore the best way to continue investigations into the
cause of neuronal volume reductions. To complement this work, I therefore also began
investigation into post-synaptic proteins that would be found in dendrites and
dendritic spines.
5.1.5 Synapse loss in AD and stroke
There is considerable evidence supporting synaptic dysfunction as an important
mechanism preceding and contributing to neuronal death in AD (Selkoe, 2002; Arendt,
2009), also discussed in Chapter 4. The hippocampus is particularly vulnerable to
synapse loss, with numbers of synapses in the hippocampus of AD patients reported to
be reduced by 44-55%, and 18% reduced in MCI patients (Scheff et al., 2007). There is
110
consistent evidence of dendritic spine loss in AD (Penzes et al., 2011), and a recent
protein immunoblot study found reduced levels of hippocampal PSD-95 in patients
with amnestic MCI (Sultana et al., 2010), in agreement with previous studies also
reporting decreased PSD-95 in AD (Gylys et al., 2004; Love et al., 2006). However, a
quantitative immunohistochemical study in AD reported an increase in entorhinal
cortex PSD-95, and more punctate and filamentous staining particularly in the CA1
(Leuba et al., 2008).
The relationship between synapse loss and cognition in AD may not be as
straightforward as initially thought. There is evidence of a biphasic change in pre- and
post-synaptic markers in AD, as studies have found an initial increase in synaptic
markers in early stages of AD followed by a decrease as the disease progresses
(Arendt, 2009). Increases in presynaptic protein synaptophysin (Mukaetova-Ladinska
et al., 2000), postsynaptic protein drebrin (Counts et al., 2006), and postsynaptic
protein PSD-95 (Leuba et al., 2008) have been found in early AD and amnestic MCI and
were suggested to indicate synaptic reorganization as a possible compensatory
response to maintain neuronal function. However, other studies have found levels of
pre-synaptic proteins such as SNAP25 and synaptophysin were reduced in the brains of
AD patients (Schnaider Beeri et al., 2012).
Few studies have investigated synaptic changes post-stroke. A recent study of a rodent
stroke mode (rat transient middle cerebral artery occlusion) did not find any neuron
loss or synaptic marker changes in the hippocampus 30 days post-stroke, although
hippocampal long-term-potentiation was reduced and correlated with impairments in
learning and memory (Li et al., 2013). A study of a mouse model of stroke found that
even after severe ischemia (<10% blood supply), spine and dendrite structure could be
mostly recovered when reperfusion occurred within 60 minutes (Zhang et al., 2005),
indicating that dendritic damage caused by ischemia/hypoxia can be reversed if blood
flow is promptly restored. In a model of chronic cerebral hypoperfusion, memory
deficits were related to reduced levels of post-synaptic protein PSD-95 and pre-
synaptic marker synaptophysin 30 days after the occlusion surgery (Wang et al., 2010),
indicating that chronic hypoxia resulted in reduced synapse density. A previous
quantitative immunohistochemical study within the CogFAST cohort found lower levels
of the dendritic spine protein drebrin in the hippocampus of PSD compared to non-
111
demented stroke survivors, indicating loss of dendritic spines (A. Hamdan, unpublished
data). However, it was unclear whether the loss of drebrin was due to loss of dendritic
spines, loss of dendrites or both.
5.2 Aims
This project aimed to investigate dendritic changes in the hippocampus in order to
establish whether loss of dendritic extent was related to neuronal volume loss and
cognitive impairment in delayed PSD. As it was not possible to assess the dendritic
arbour using Golgi techniques, IHC for the dendrite-specific protein MAP2 was used to
visualize and quantify dendrites. 2D image analysis techniques were used to
investigate neuronal immunoreactivity in the pyramidal layer of CA1 and CA2.
During image analysis of CA1 and CA2 neuronal soma it became apparent that there
were differences in MAP2 dendritic staining in the stratum radiatum, where the
greatest density of dendrites are found in the hippocampus. Furthermore, 2D analysis
at low magnification was not able to distinguish staining of fine dendrites from
background staining. Therefore, a novel 3D technique was used to quantify dendritic
length-density in the CA1 stratum radiatum at 100x magnification. The CA1 stratum
radiatum contains the apical dendrites of CA1 neurons, which generally receive inputs
through the Perforant path (from EC) and from CA3 neurons more distant from the
CA1 (Ishizuka et al., 1990). Synapses in this regions are highly plastic and are thought
to have an critical mechanistic role in memory and learning (Kerchner et al., 2012).
Therefore, a reduction in MAP2 immunopositive dendrites in this region would reflect
a fundamental disruption to the hippocampal circuitry resulting in impaired function.
Patterns of immunohistochemical staining for post-synaptic proteins PSD-95 and
drebrin were also investigated in relation to MAP2 dendritic staining, to explore
whether there was any relationship between MAP2 staining and other post-synaptic
proteins found in dendrites. Immunohistochemical staining for these proteins was also
investigated in tissue from the perfusion-fixed baboon model to investigate how post-
mortem delay may have influenced staining and results. Levels of PSD-95 and
presynaptic proteins synaptophysin and SNAP-25 were quantified in subjects from the
CogFAST cohort using protein immunoblotting techniques, as accurate quantification
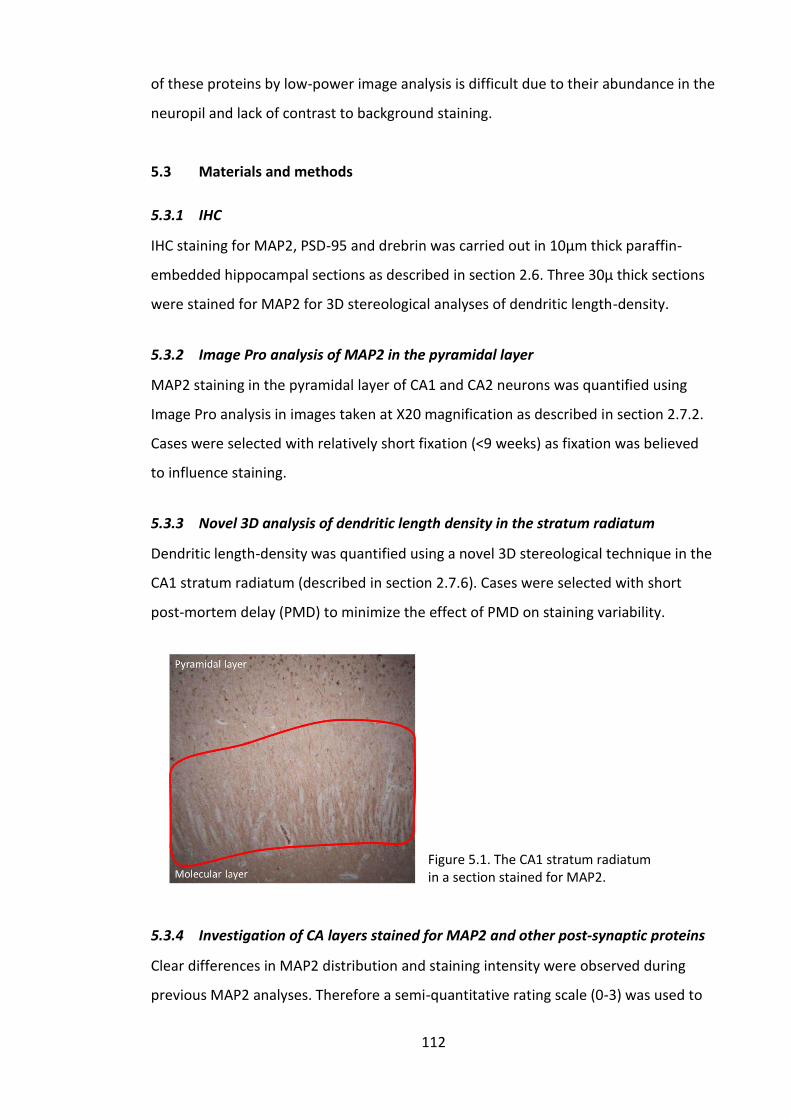
112
of these proteins by low-power image analysis is difficult due to their abundance in the
neuropil and lack of contrast to background staining.
5.3 Materials and methods
5.3.1 IHC
IHC staining for MAP2, PSD-95 and drebrin was carried out in 10µm thick paraffin-
embedded hippocampal sections as described in section 2.6. Three 30µ thick sections
were stained for MAP2 for 3D stereological analyses of dendritic length-density.
5.3.2 Image Pro analysis of MAP2 in the pyramidal layer
MAP2 staining in the pyramidal layer of CA1 and CA2 neurons was quantified using
Image Pro analysis in images taken at X20 magnification as described in section 2.7.2.
Cases were selected with relatively short fixation (<9 weeks) as fixation was believed
to influence staining.
5.3.3 Novel 3D analysis of dendritic length density in the stratum radiatum
Dendritic length-density was quantified using a novel 3D stereological technique in the
CA1 stratum radiatum (described in section 2.7.6). Cases were selected with short
post-mortem delay (PMD) to minimize the effect of PMD on staining variability.
Figure 5.1. The CA1 stratum radiatum in a section stained for MAP2.
5.3.4 Investigation of CA layers stained for MAP2 and other post-synaptic proteins
Clear differences in MAP2 distribution and staining intensity were observed during
previous MAP2 analyses. Therefore a semi-quantitative rating scale (0-3) was used to
113
rate different patterns of staining in layers of the CA1 to quickly determine whether
unusual staining was associated with clinicopathological variables. Regions and
characteristics rated were:
Mottled/patchy stratum moleculare
‘Stringy’ stratum radiatum,
Intensity of soma staining in the pyramidal layer (Figure 5.5).
MAP2 staining patterns were also visually compared with sections stained for post-
synaptic proteins PSD-95 and drebrin in human tissue, and drebrin in baboon tissue.
Representative images are shown in results.
5.3.5 Protein immunoblots of synaptic markers
Levels of pre- and post-synaptic markers PSD-95, synaptophysin and SNAP-25 were
quantified by protein immunoblot according to protocols described in section 2.8.
20µg of protein was loaded into each well for each experiment.
5.3.6 Statistical analysis
Age, PMD and MAP2 staining data were normally distributed. Therefore, group means
were compared using ANOVA with post-hoc Tukey’s test for pairwise comparison.
Fixation length was analysed using non-parametric tests. Western blot results were
non-normally distributed and analysed using non-parametric tests.
114
5.4 Results
5.4.1 MAP2 2D image analysis
Demographic details of subjects analysed using MAP2 with 2D Image Pro techniques
are presented in Table 5.1. There were no significant differences in age, PMD or
fixation time between groups.
N Age, years
Mean (range) PMD, hrs
Mean (range) Fixation
time, weeks Mean (range)
Braak stage Median (range)
CERAD, Median (range)
Controls 6 82 (72-98)
42 (23-59)
8 (8)
3 (1-3)
0.5 (0-1)
PSND 9 84 (78-89)
42 (19-96)
7 (5-12)
3 (1-5)
1 (0-2)
PSD 7 87 (80-96)
53 (10-96)
7 (6-8)
2 (0-4)
0 (0-1)
AD 9 83 (76-91) 47 (6-72)
7 (6-8)
5 (4-6)
3 (3)
Table 5.1 Demographics of subjects analysed with 2D Image Pro analysis of MAP2 immunostaining.
There were no differences in MAP2 %PA (% of stained pixels in the area of interest) or
IOD (intensity of stain) in neuronal soma in the CA1 or CA2 between controls, PSND,
PSD and AD groups. Group means are presented in Appendix Table 8.8. CA2 IOD
appeared to be reduced in the PSND group compared to PSD and other groups,
however this did not reach significance (Figure 5.2A). There was considerable variation
in neuronal MAP2 staining within groups (demonstrated in Figure 5.3 and Appendix
Figure 8.4). MAP2 CA1 %PA was positively correlated with CA2 %PA (r = 0.596, p =
0.003). CAMCOG scores were negatively correlated with MAP2 CA2 IOD (r = -0.603, p =
0.02) and there was a trend to negative correlation with CA1 IOD (r = -0.473, p =
0.075). MAP2 CA1 and CA2 %PA were negatively correlated with PMD (r = -0.444, p =
0.02 and r = -0.473, p = 0.02 respectively) (Figure 5.2 B). There were no correlations
with AD pathology, fixation or age.
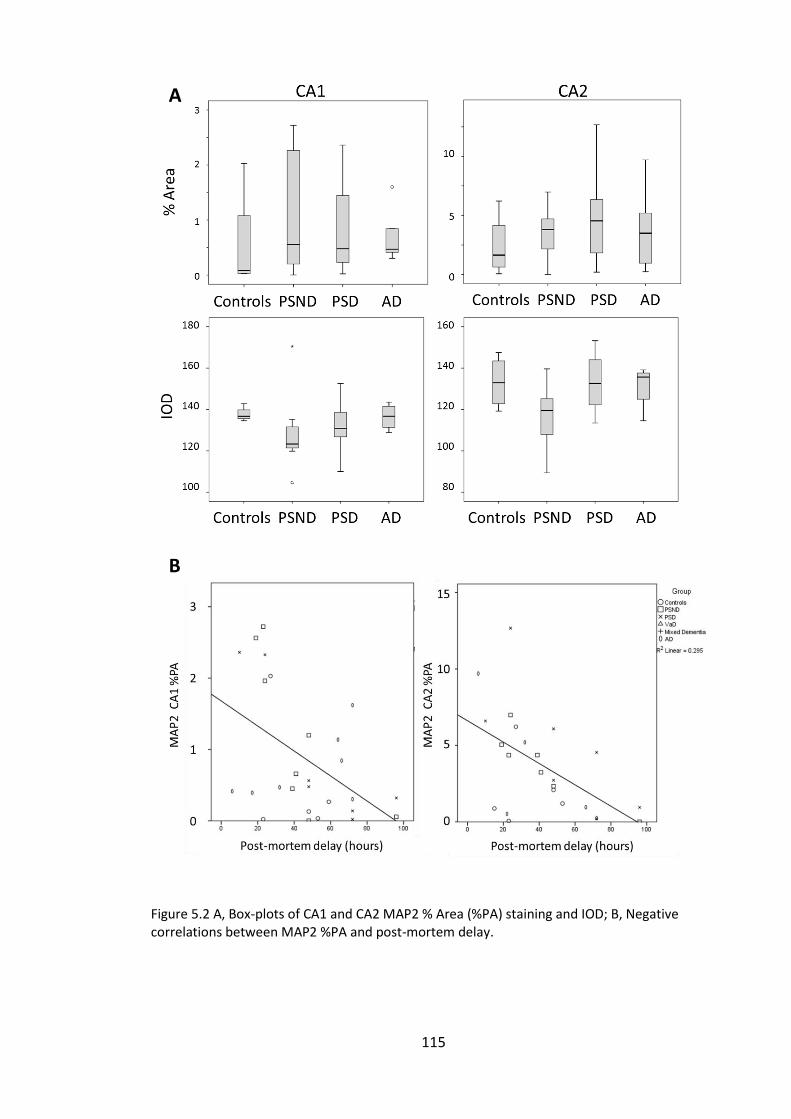
115
Figure 5.2 A, Box-plots of CA1 and CA2 MAP2 % Area (%PA) staining and IOD; B, Negative correlations between MAP2 %PA and post-mortem delay.
A
B
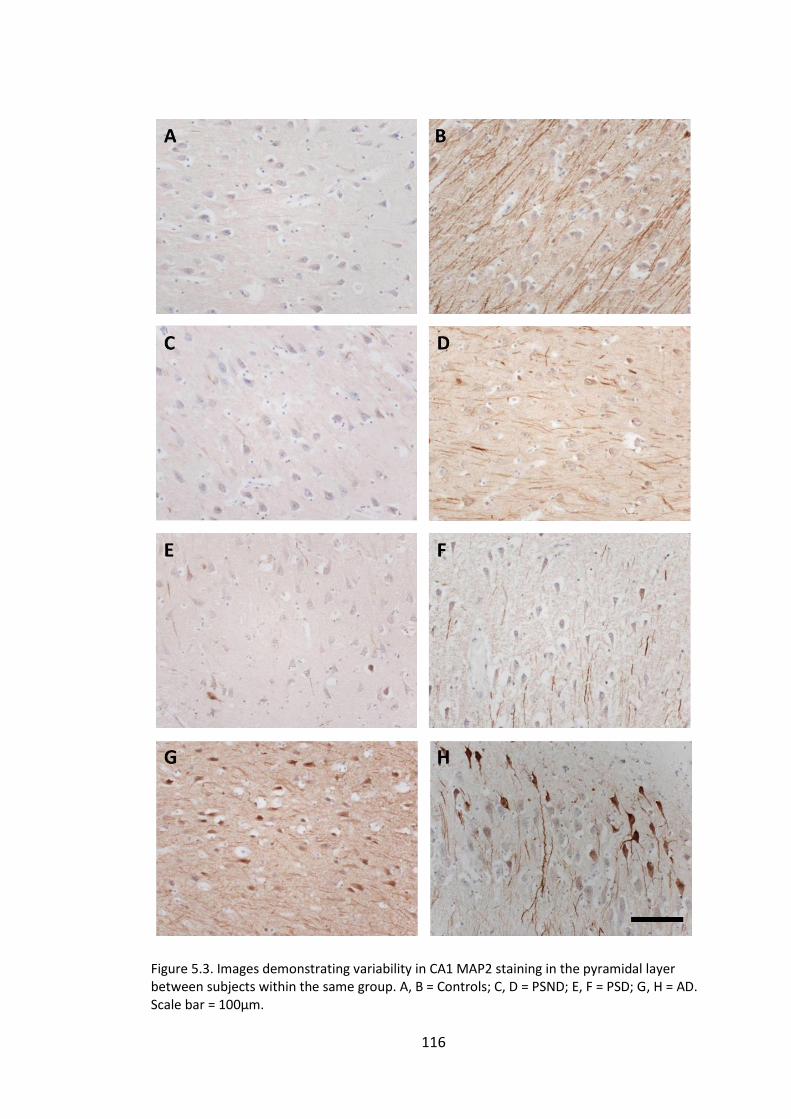
116
Figure 5.3. Images demonstrating variability in CA1 MAP2 staining in the pyramidal layer between subjects within the same group. A, B = Controls; C, D = PSND; E, F = PSD; G, H = AD. Scale bar = 100µm.
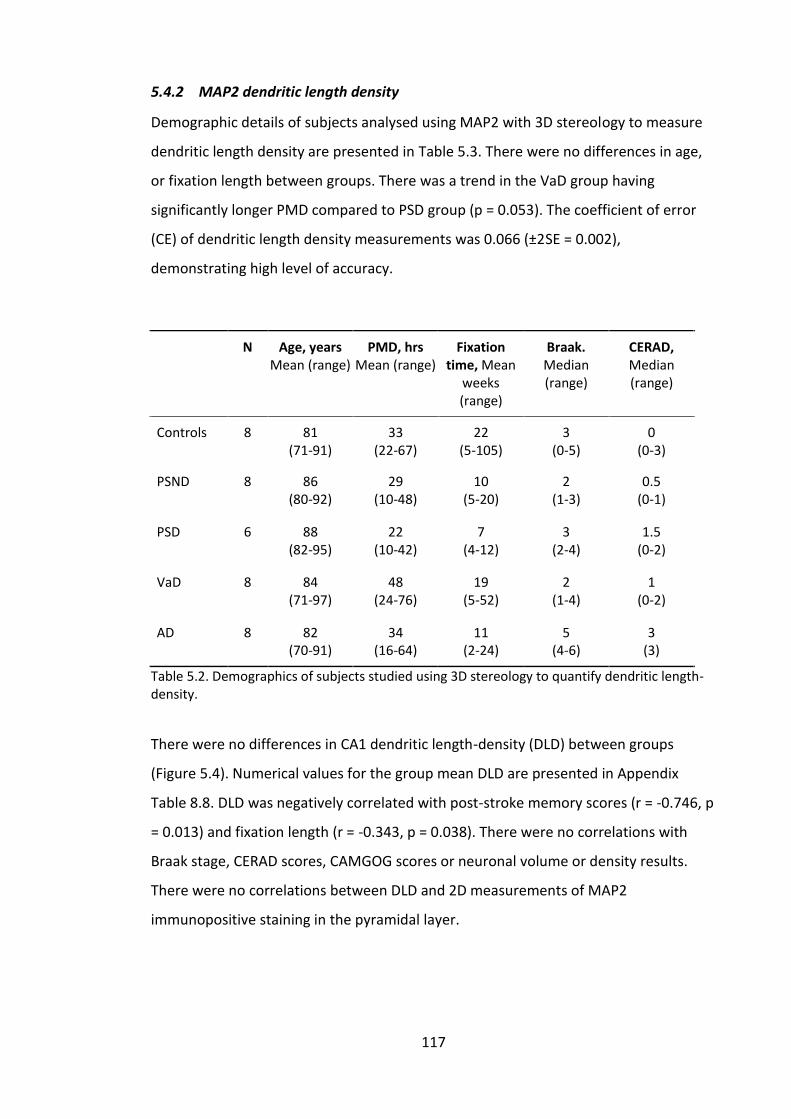
117
5.4.2 MAP2 dendritic length density
Demographic details of subjects analysed using MAP2 with 3D stereology to measure
dendritic length density are presented in Table 5.3. There were no differences in age,
or fixation length between groups. There was a trend in the VaD group having
significantly longer PMD compared to PSD group (p = 0.053). The coefficient of error
(CE) of dendritic length density measurements was 0.066 (±2SE = 0.002),
demonstrating high level of accuracy.
N Age, years Mean (range)
PMD, hrs Mean (range)
Fixation time, Mean
weeks (range)
Braak. Median (range)
CERAD, Median (range)
Controls 8 81 (71-91)
33 (22-67)
22 (5-105)
3 (0-5)
0 (0-3)
PSND 8 86 (80-92)
29 (10-48)
10 (5-20)
2 (1-3)
0.5 (0-1)
PSD 6 88 (82-95)
22 (10-42)
7 (4-12)
3 (2-4)
1.5 (0-2)
VaD 8 84 (71-97)
48 (24-76)
19 (5-52)
2 (1-4)
1 (0-2)
AD 8 82 (70-91)
34 (16-64)
11 (2-24)
5 (4-6)
3 (3)
Table 5.2. Demographics of subjects studied using 3D stereology to quantify dendritic length-density.
There were no differences in CA1 dendritic length-density (DLD) between groups
(Figure 5.4). Numerical values for the group mean DLD are presented in Appendix
Table 8.8. DLD was negatively correlated with post-stroke memory scores (r = -0.746, p
= 0.013) and fixation length (r = -0.343, p = 0.038). There were no correlations with
Braak stage, CERAD scores, CAMGOG scores or neuronal volume or density results.
There were no correlations between DLD and 2D measurements of MAP2
immunopositive staining in the pyramidal layer.
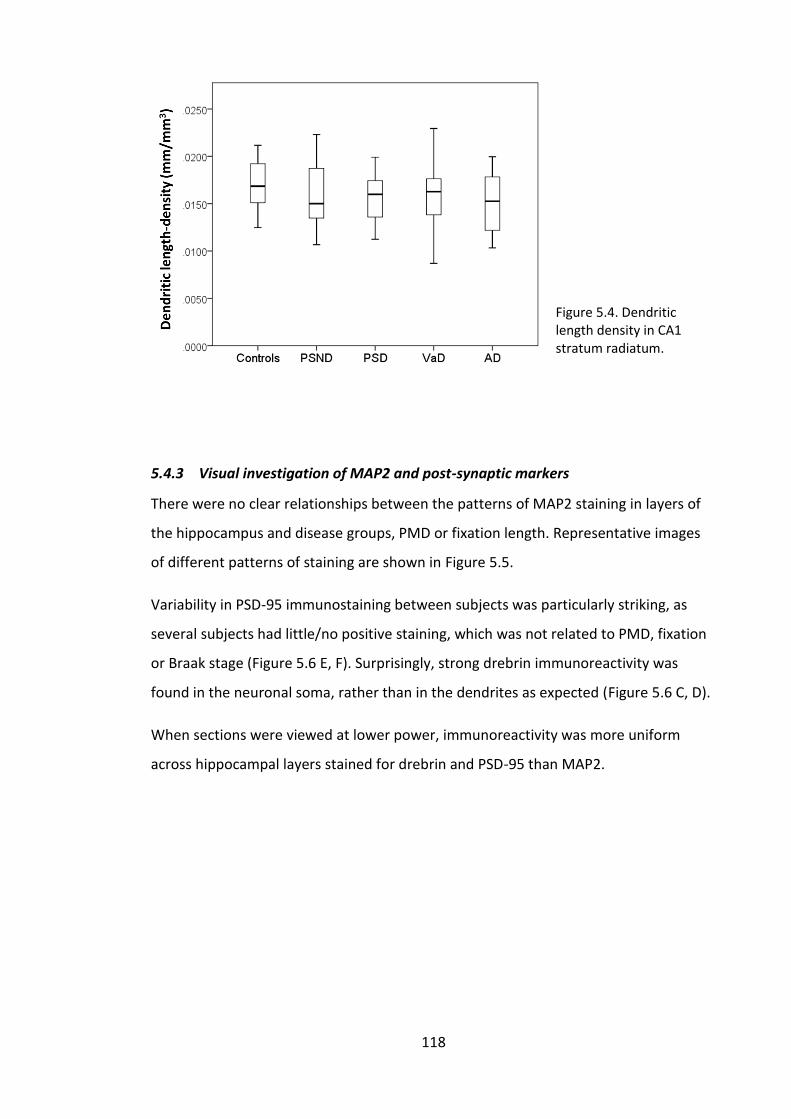
118
Figure 5.4. Dendritic length density in CA1 stratum radiatum.
5.4.3 Visual investigation of MAP2 and post-synaptic markers
There were no clear relationships between the patterns of MAP2 staining in layers of
the hippocampus and disease groups, PMD or fixation length. Representative images
of different patterns of staining are shown in Figure 5.5.
Variability in PSD-95 immunostaining between subjects was particularly striking, as
several subjects had little/no positive staining, which was not related to PMD, fixation
or Braak stage (Figure 5.6 E, F). Surprisingly, strong drebrin immunoreactivity was
found in the neuronal soma, rather than in the dendrites as expected (Figure 5.6 C, D).
When sections were viewed at lower power, immunoreactivity was more uniform
across hippocampal layers stained for drebrin and PSD-95 than MAP2.
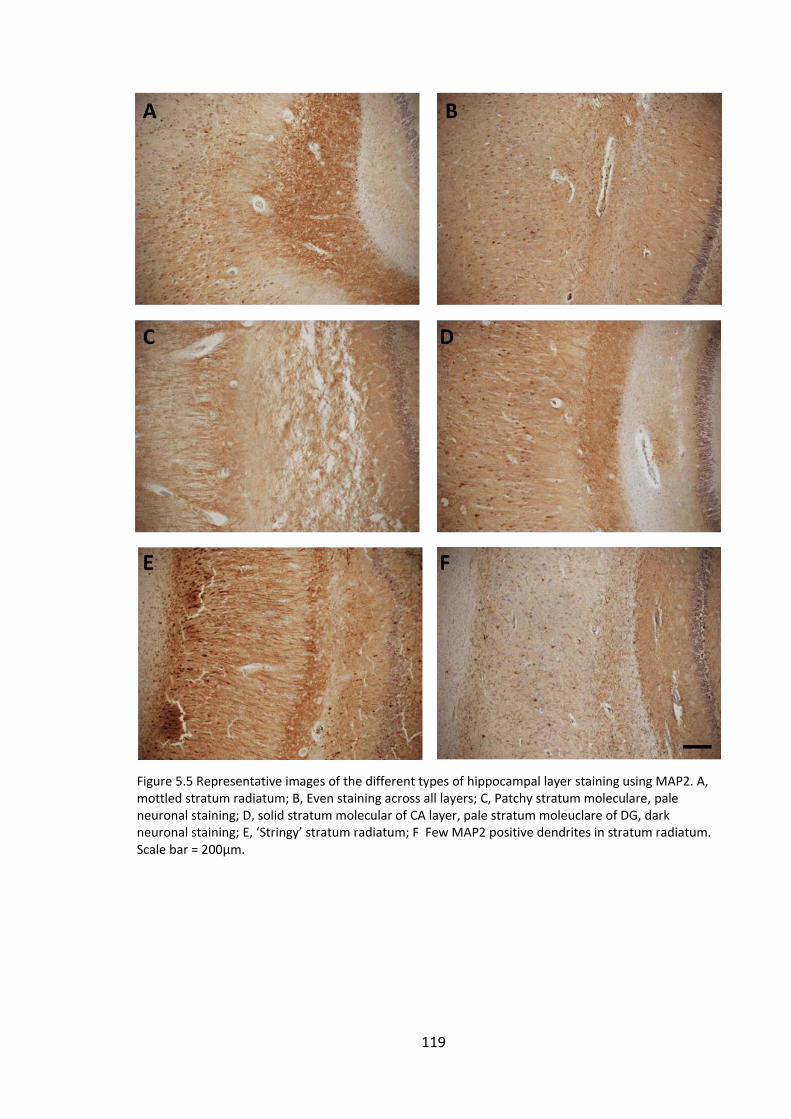
119
Figure 5.5 Representative images of the different types of hippocampal layer staining using MAP2. A, mottled stratum radiatum; B, Even staining across all layers; C, Patchy stratum moleculare, pale neuronal staining; D, solid stratum molecular of CA layer, pale stratum moleuclare of DG, dark neuronal staining; E, ‘Stringy’ stratum radiatum; F Few MAP2 positive dendrites in stratum radiatum. Scale bar = 200µm.
120
Figure 5.6 Variability in pyramidal layer staining for MAP2 (A, B), Drebrin (C, D) and PSD-95 (E, F) in two PSND subjects with similar PMD, fixation length and Braak stage; A, C, E PMD = 48h, Fixation = 7 weeks, Braak stage = 3; B, D, F PMD = 46h, Fixation = 12 weeks, Braak stage = 3. Scale bar = 100µm
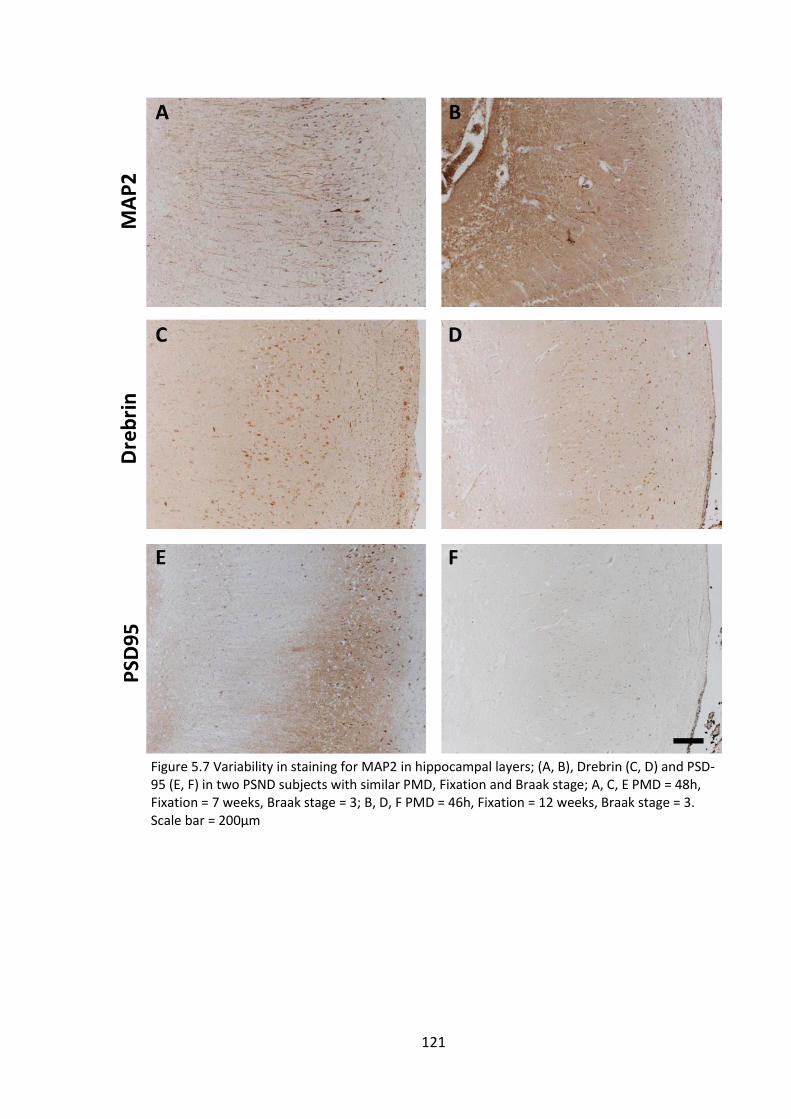
121
Figure 5.7 Variability in staining for MAP2 in hippocampal layers; (A, B), Drebrin (C, D) and PSD-95 (E, F) in two PSND subjects with similar PMD, Fixation and Braak stage; A, C, E PMD = 48h, Fixation = 7 weeks, Braak stage = 3; B, D, F PMD = 46h, Fixation = 12 weeks, Braak stage = 3. Scale bar = 200µm
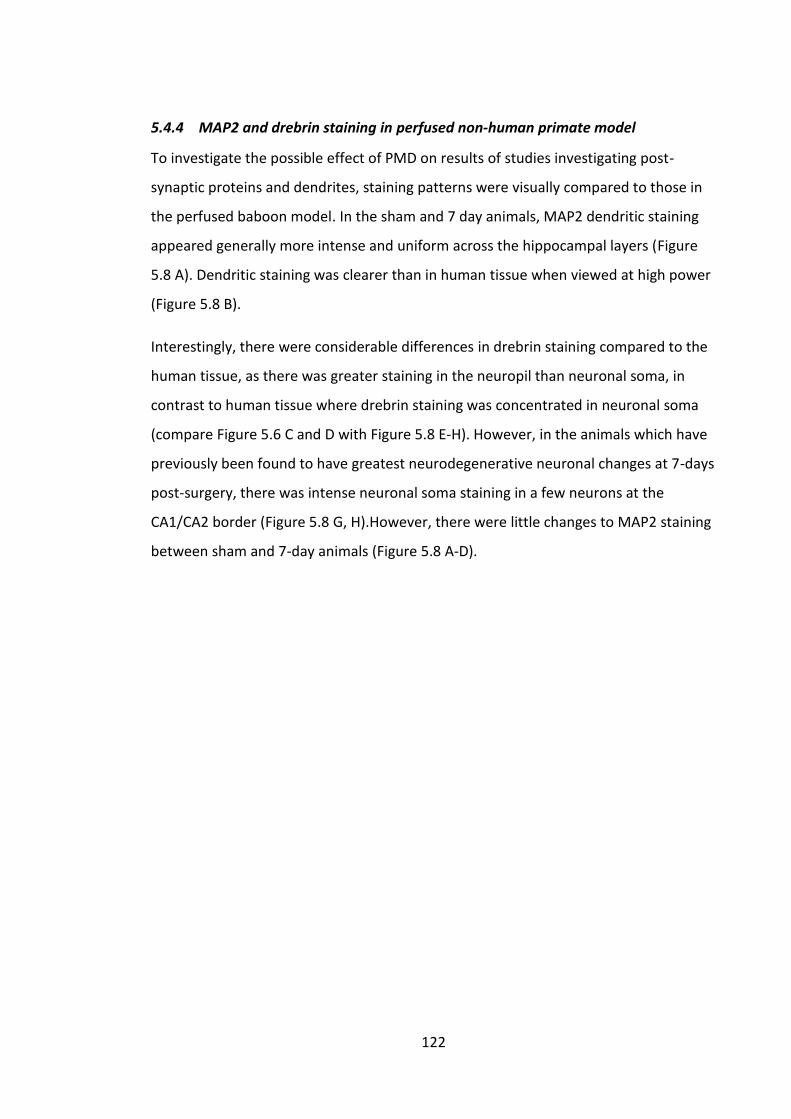
122
5.4.4 MAP2 and drebrin staining in perfused non-human primate model
To investigate the possible effect of PMD on results of studies investigating post-
synaptic proteins and dendrites, staining patterns were visually compared to those in
the perfused baboon model. In the sham and 7 day animals, MAP2 dendritic staining
appeared generally more intense and uniform across the hippocampal layers (Figure
5.8 A). Dendritic staining was clearer than in human tissue when viewed at high power
(Figure 5.8 B).
Interestingly, there were considerable differences in drebrin staining compared to the
human tissue, as there was greater staining in the neuropil than neuronal soma, in
contrast to human tissue where drebrin staining was concentrated in neuronal soma
(compare Figure 5.6 C and D with Figure 5.8 E-H). However, in the animals which have
previously been found to have greatest neurodegenerative neuronal changes at 7-days
post-surgery, there was intense neuronal soma staining in a few neurons at the
CA1/CA2 border (Figure 5.8 G, H).However, there were little changes to MAP2 staining
between sham and 7-day animals (Figure 5.8 A-D).
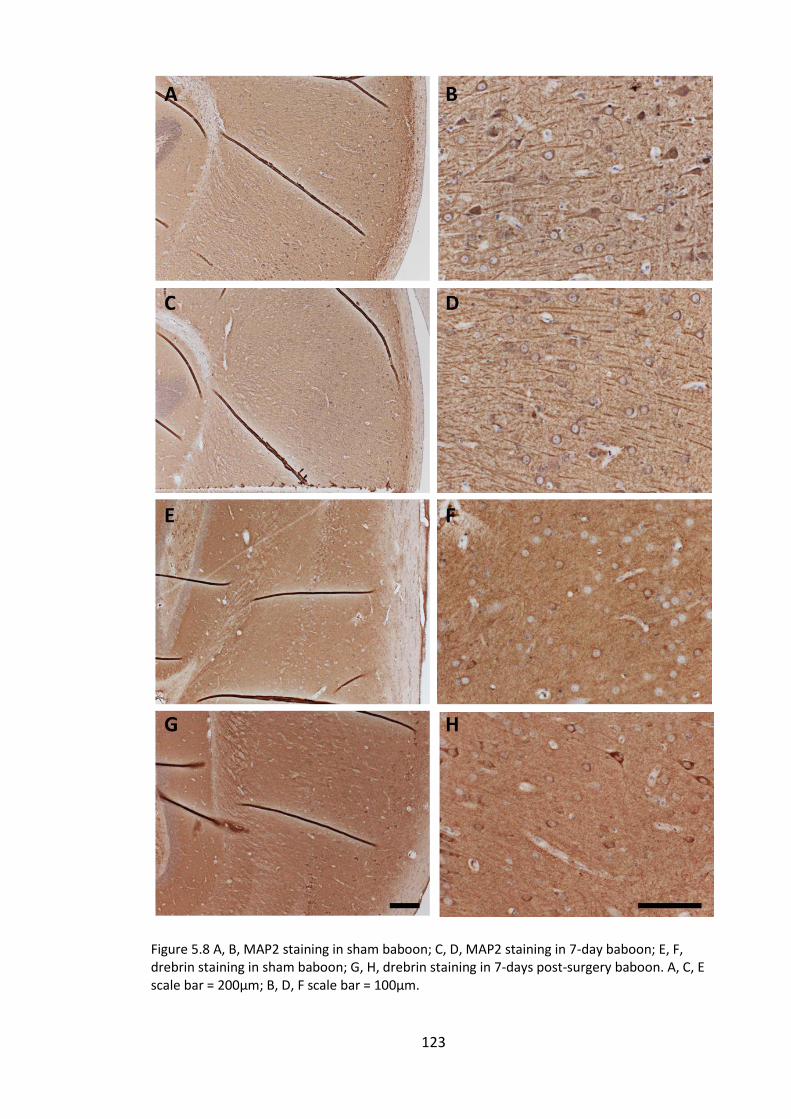
123
Figure 5.8 A, B, MAP2 staining in sham baboon; C, D, MAP2 staining in 7-day baboon; E, F, drebrin staining in sham baboon; G, H, drebrin staining in 7-days post-surgery baboon. A, C, E scale bar = 200µm; B, D, F scale bar = 100µm.
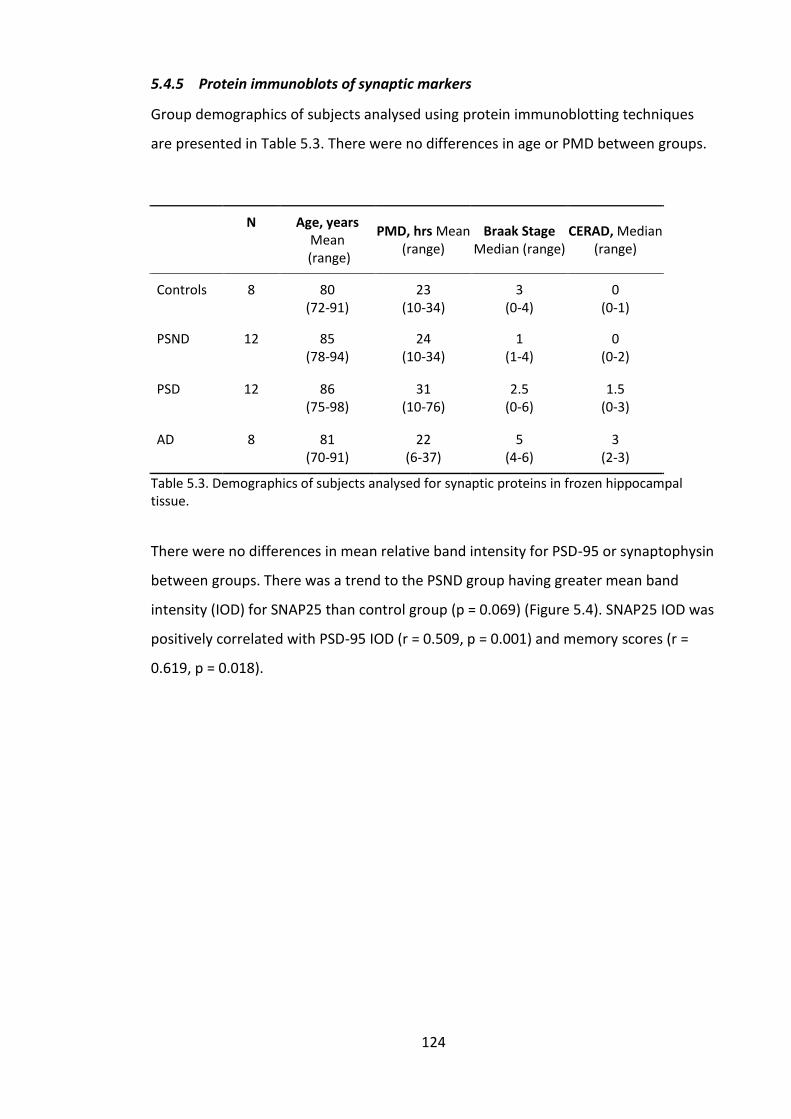
124
5.4.5 Protein immunoblots of synaptic markers
Group demographics of subjects analysed using protein immunoblotting techniques
are presented in Table 5.3. There were no differences in age or PMD between groups.
N Age, years
Mean (range)
PMD, hrs Mean (range)
Braak Stage Median (range)
CERAD, Median (range)
Controls 8 80 (72-91)
23 (10-34)
3 (0-4)
0 (0-1)
PSND 12 85 (78-94)
24 (10-34)
1 (1-4)
0 (0-2)
PSD 12 86 (75-98)
31 (10-76)
2.5 (0-6)
1.5 (0-3)
AD 8 81 (70-91)
22 (6-37)
5 (4-6)
3 (2-3)
Table 5.3. Demographics of subjects analysed for synaptic proteins in frozen hippocampal tissue.
There were no differences in mean relative band intensity for PSD-95 or synaptophysin
between groups. There was a trend to the PSND group having greater mean band
intensity (IOD) for SNAP25 than control group (p = 0.069) (Figure 5.4). SNAP25 IOD was
positively correlated with PSD-95 IOD (r = 0.509, p = 0.001) and memory scores (r =
0.619, p = 0.018).
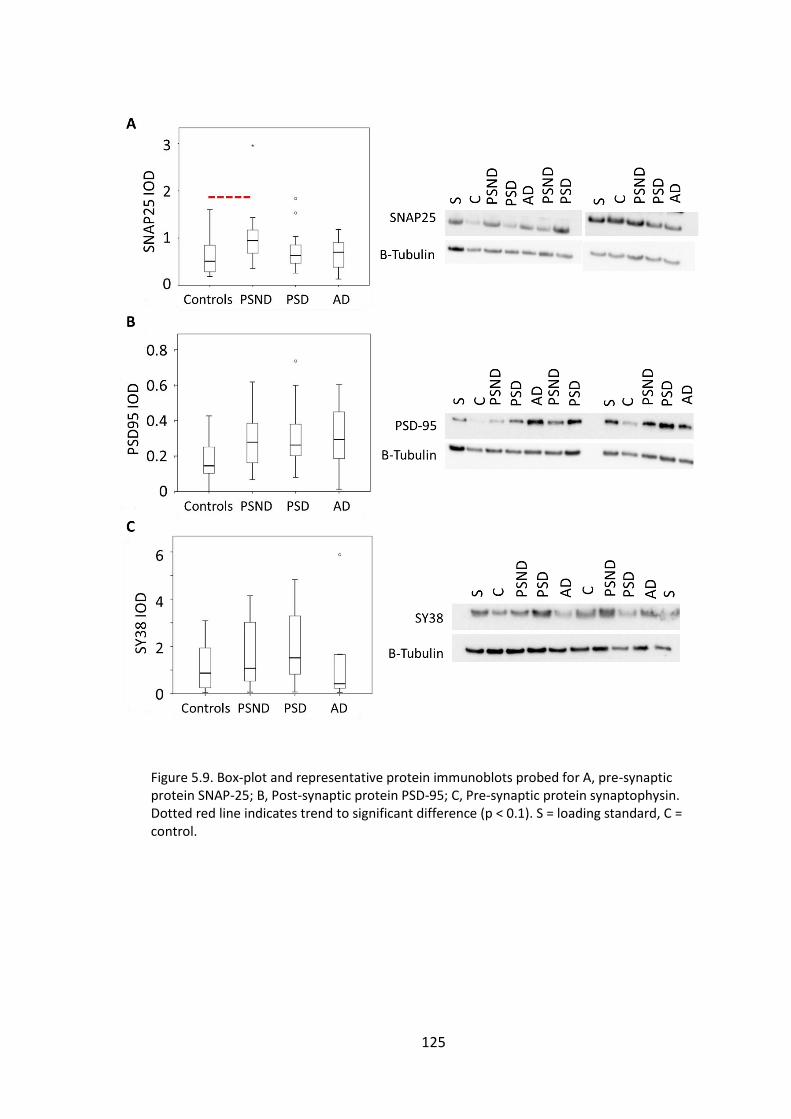
125
Figure 5.9. Box-plot and representative protein immunoblots probed for A, pre-synaptic protein SNAP-25; B, Post-synaptic protein PSD-95; C, Pre-synaptic protein synaptophysin. Dotted red line indicates trend to significant difference (p < 0.1). S = loading standard, C = control.
126
5.5 Discussion
5.5.1 MAP2 in the pyramidal layer
This investigation revealed that there was considerable variation in MAP2
immunopositive staining in the pyramidal layer between subjects, as demonstrated in
Figure 5.3 and reflected in the broad spread of area positively stained for MAP2 (% PA)
between subjects. These results were surprising as I expected to find a reduction in
MAP2 staining in the post-stroke groups compared to controls and AD, reflecting
dendritic damage due to the effects of hypoxic/ischaemic injury from the stroke or
other cerebrovascular disease mechanisms. I reasoned that as analysis was restricted
to the pyramidal layer of CA1 and CA2, this may be because results were largely based
on soma staining rather than dendritic staining. Therefore, it was surprising to find
negative correlations between CA1 and CA2 %PA and PMD, as increasing PMD has
previously been shown to cause reduced dendritic MAP2 staining but increased soma
staining (Schwab et al., 1994). However, Schwab et al.’s study of MAP2 and PMD only
examined changes up to 8 hours post-mortem; therefore loss of MAP2 may continue in
neuronal soma during longer PMD, as PMD in these subjects reached up to 96 hours.
This study was also limited as quantification of MAP2 immunopositive staining using
standard image analysis techniques was difficult at 20X magnification as it was
impossible to distinguish background staining from fine dendrites in the neuropil.
5.5.2 MAP2 dendritic length density in the stratum radiatum
To address these issues, I adapted a 3D stereological technique previously used to
quantify vascular length density (Burke et al., 2013), to quantify dendritic length
density of MAP2 positive dendrites in the stratum radiatum. To my knowledge, this
technique had not previously been attempted. In contrast to the 2D analysis at low
power, even small MAP2 positive dendrites were easily identifiable at 100x
magnification, appearing as fine dark brown threads running through the tissue (Figure
2.7). Dendrites in the stratum radiatum were numerous, permitting analysis of large
numbers of dendrites to achieve acceptable coefficient of error values.
Although the variability of results within groups was reduced compared to 2D
methods, no significant differences in dendritic length density were detected between
127
groups. However, the disease group means were lower than the control group mean in
agreement with previous studies which have reported loss of MAP2 immunoreactivity
after ischemia and in AD. Due to the time-consuming nature of the study, exclusion of
subjects with longer post-mortem delay, and requirement of relatively large amounts
of tissue, numbers of subjects analysed were small. Addition of greater numbers of
subjects to be analysed using this technique may improve the power to generate
statistically significant differences.
However, addition of further subjects for analysis may not easily resolve significant
differences between groups as the issue of variability in MAP2 staining between
subjects within the same disease group remains. Visual inspection of different patterns
and intensity of staining in the different hippocampal layers did not reveal any
relationships with disease groups, fixation or PMD. As there is considerable literature
describing rapid loss of hippocampal MAP2 after ischaemic injury, these differences
may result from other factors causing hypoxic/ischaemic damage and subsequent
changes to MAP2 distribution in the CA1. Possible factors likely to affect MAP2 staining
include subsequent strokes, cause of death and pre-mortem agonal state.
Furthermore, few previous studies have reported long-term changes to MAP2 after
ischemia. Although loss of MAP2 immunoreactivity may be an early marker of
ischaemic damage (Kühn et al., 2005), long-term compensatory mechanisms involving
dendritic plasticity may restore MAP2 levels in some stroke survivors.
Furthermore, ageing and neurodegenerative diseases have been associated with
increased MAP-2, which in turn has also been associated with cognitive impairment
(Mukaetova-Ladinska et al., 2000; Haley et al., 2010; VanGuilder et al., 2011). The
conflicting effects of reduced MAP2 immunoreactivity after ischemia or post-mortem
interval may be countered by increases in MAP2 immunoreactivity in response to
other neurodegenerative disease or age-related mechanisms. Currently, the
relationship between MAP2 immunoreactivity, dendrite loss or dysfunction, post-
mortem delay, ischemia and cognitive function is not well understood. The unknown
influence of these factors on these results therefore limits the interpretation of these
findings.
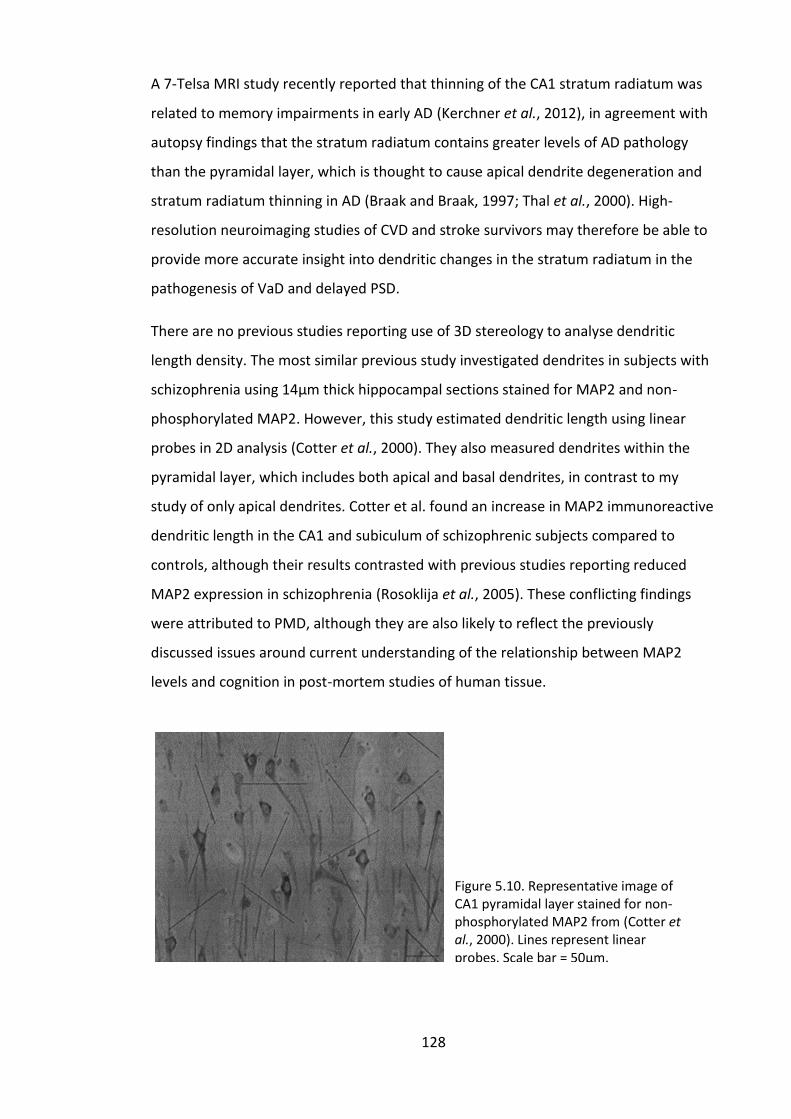
128
A 7-Telsa MRI study recently reported that thinning of the CA1 stratum radiatum was
related to memory impairments in early AD (Kerchner et al., 2012), in agreement with
autopsy findings that the stratum radiatum contains greater levels of AD pathology
than the pyramidal layer, which is thought to cause apical dendrite degeneration and
stratum radiatum thinning in AD (Braak and Braak, 1997; Thal et al., 2000). High-
resolution neuroimaging studies of CVD and stroke survivors may therefore be able to
provide more accurate insight into dendritic changes in the stratum radiatum in the
pathogenesis of VaD and delayed PSD.
There are no previous studies reporting use of 3D stereology to analyse dendritic
length density. The most similar previous study investigated dendrites in subjects with
schizophrenia using 14µm thick hippocampal sections stained for MAP2 and non-
phosphorylated MAP2. However, this study estimated dendritic length using linear
probes in 2D analysis (Cotter et al., 2000). They also measured dendrites within the
pyramidal layer, which includes both apical and basal dendrites, in contrast to my
study of only apical dendrites. Cotter et al. found an increase in MAP2 immunoreactive
dendritic length in the CA1 and subiculum of schizophrenic subjects compared to
controls, although their results contrasted with previous studies reporting reduced
MAP2 expression in schizophrenia (Rosoklija et al., 2005). These conflicting findings
were attributed to PMD, although they are also likely to reflect the previously
discussed issues around current understanding of the relationship between MAP2
levels and cognition in post-mortem studies of human tissue.
Figure 5.10. Representative image of CA1 pyramidal layer stained for non-phosphorylated MAP2 from (Cotter et al., 2000). Lines represent linear probes. Scale bar = 50µm.
129
5.5.3 MAP2 and AD pathology
Results from 2D and 3D analysis of MAP2 immunopositive dendrites were not related
to AD pathology (Braak stage or CERAD score) (as demonstrated in Figure 8.5).
However, previous studies have reported a biphasic change in MAP-2 levels in AD
where subjects with Braak stage 4 had the highest MAP-2 staining before it dropped
off in Braak stages 5 and 6 (Mukaetova-Ladinska et al., 2000), which would hinder the
detection of a linear relationship between MAP2 and AD pathology stage. When the
MAP2 data were divided by Braak stage, there was no evidence of a biphasic change
although MAP2 was generally lower in Braak stages greater than 4. This is likely to be
due to the greater loss of CA1 neurons in subjects with greater tau pathology burden.
Previous studies have also suggested that abnormally hyperphosphorylated tau
sequesters MAP2 in aggregates, however I did not find evidence of this as intensity of
MAP2 staining was not related to Braak stage (Iqbal and Grundke-Iqbal, 1997).
5.5.4 Visual investigation of MAP2, drebrin and PSD-95 staining
There were sometimes striking differences in the appearance of MAP2 staining
between subjects. This was due to darker, lighter, or patchier staining in different
layers of the CA subfields and dentate gyrus. I initially thought this may reflect loss of
MAP2 immunoreactivity due to the effect of PMD; however I could not find a
consistent effect related to PMD. I was then interested to know whether staining for
other dendritic proteins, specifically post-synaptic proteins involved in the structure
and function of dendritic spines, would also display similar staining patterns within and
between subjects.
Drebrin staining was relatively consistent and restricted to neuronal soma, which was
surprising as drebrin is a protein involved in regulating dendritic spine morphology and
function (Ivanov et al., 2009). PSD-95 staining was also unusual. As PSD-95 is the most
abundant scaffolding protein found at dendritic spines, I expected to find high density
of staining in all CA layers (Chen et al., 2011b). However, PSD-95 staining ranged from
dark staining of the pyramidal layer and molecular layer, to almost non-existent
staining. This did not appear to be directly related to PMD, fixation or Braak stage,
suggesting that other factors, such as additional disease mechanisms or pre-mortem
agonal state may have had significant impact on these proteins.
130
To further elucidate the importance of PMD in the distribution of immunoreactive
staining for MAP2 and drebrin, I compared the staining patterns with those in
hippocampal sections from the perfused baboon cohort. Identical antibodies and IHC
protocols were used for human and baboon tissue, and generated similar staining
results. Therefore it is unlikely that any differences observed were due to differences
in species. The MAP2 staining appeared fairly similar to human staining, although the
sham animals had very even staining across all layers, suggesting that the appearance
of clearly defined layers reflects pathological change in the human tissue. Although it is
difficult to draw any conclusions from the MAP2 work, these differences suggest that
the loss of uniform staining in the human cohort may reflect a change in connectivity
in response to disease mechanisms.
The drebrin staining was completely different in the baboon hippocampus, with very
little staining in neuronal soma and intense staining in the neuropil. In the 7-day
animals, where greatest neuronal volume loss was observed, a few neurons at the
CA1/CA2 border had dark staining in the soma which suggests that appearance of
drebrin in the soma may reflect pathological response to hypoxic damage.
Interestingly, a stereological study of Golgi stained neurons found that CA1 neurons
near CA2 had significant loss of total dendritic length and branching in AD (Hanks and
Flood, 1991), suggesting that these neurons may be particularly vulnerable to dendritic
damage.
A previous study investigated drebrin immunoreactivity in pyramidal layers of CA1 and
CA2 in stroke survivors from the CogFAST cohort. This study indicated that there were
reduced levels of drebrin in PSD compared to PSND subjects. However, interpretation
of these results is limited as the study did not investigate levels of drebrin in the
stratum radiatum, where the level of protein would be assumed to reflect the number
of dendritic spines and therefore synapses. Further studies would be required to
determine whether the accumulation of drebrin in neuronal soma reflects a post-
mortem artefact or pathological response.
5.5.5 Pre- and post-synaptic proteins in frozen hippocampal tissue
Levels of proteins determined by immunoblot analysis also demonstrated variability
between groups which prevented the detection of statistically significant differences
131
between groups. Although analysis of frozen tissue removes the possibility of tissue
fixation and processing affecting protein immunogenicity, these dynamic synaptic
proteins are likely to be more significantly affected by post-mortem delay or other
factors that could have influenced protein levels. A previous immunoblot study of
glutamatergic synaptic proteins in VaD and PSND also did not find any differences in
the levels of pre-synaptic protein synaptophysin, in agreement with my results (Kirvell
et al., 2010). They reported correlations between CAMCOG scores and VGLUT1
(vesicular glutamate transporter 1) concentration in the dlPFC and inferior temporal
cortex (Kirvell et al., 2010). VGLUT1 is a pre-synaptic protein involved in long-term
potentiation and memory, therefore the authors suggested that upregulation of
VGLUT1 was associated with preserved cognitive function in patients with CVD.
I found that SNAP-25 levels were increased in PSND compared to control subjects, and
appeared higher in PSND compared to PSD subjects. Therefore, upregulation of SNAP-
25 may have occurred as a compensatory response to maintain connectivity in
surviving hippocampal neurons. However, previous studies have suggested that SNAP-
25 may be deposited at degenerating presynaptic terminals (Ishimaru et al., 2001).
Previous studies have also shown that synaptophysin and SNAP-25 levels fluctuated in
a gerbil model of stroke (5 minutes bilateral common carotid artery occlusion).
Western blot and immunohistochemical quantification of these proteins in the CA1
found that protein levels were decreased at day 2 post-surgery, but increased (130-
140%) of control levels at day 14 (Ishimaru et al., 2001), in agreement with previous
studies reporting increased SNAP-25 immunoreactivity after hippocampal injury,
including ischemia and kainite-induced neuronal damage, that resulted in selective
neuronal loss (Marti et al., 1998). Therefore, the functional consequences of the
perceived increase in SNAP-25 in PSND subjects are unclear.
Interpretation of my findings in frozen hippocampal tissue were limited as it is
assumed that the ratio of the area of different subfields was the same between all
subjects studied. However, depending on the shape, size and plane that the
hippocampal sections were taken from, some subjects may have had a greater amount
of tissue from the CA1, whereas others may have had a larger CA4 etc. Therefore,
although these results inform us on the level of each protein within the hippocampal
formation at that coronal level, they do not indicate changes to specific regions or

132
subregions such as the CA1 or stratum radiatum. When planning this study, I had
initially hoped to sub-dissect the CA1 subfield only. However, this would not have
generated great enough protein yields for analysis. A future study could try laser
capture microdissection of neurons to establish protein or mRNA levels within neurons
from specific subfields. However, this will not eliminate the issues associated with
post-mortem delay, and as only the neuronal soma could easily be dissected (i.e. not
the dendrites), results will still require careful interpretation.
5.6 Conclusions
Dendrites, dendritic spines and synapses may be one of the most challenging
structures to study due to their dynamic plasticity. The changes that these structures
undergo during post-mortem interval before fixation, and during different pre-mortem
agonal conditions, are not well characterized or understood. This makes it very difficult
to draw any specific conclusions from post-mortem studies attempting to quantify
dendrites and synaptic markers, and is likely to be major contributor to the conflicting
findings in the literature. Furthermore, it has been suggested that measuring dendritic
extent at one point in time may not accurately reflect neuronal function, as the ability
of dendrites and spines to remain plastic is critical to maintaining neuronal function.
Therefore, the measured extent of dendrites in static post-mortem material may not
be a useful measure of the functional integrity of that neuron (Flood, 1993).
This study did not find any differences in dendritic proteins or dendritic length-density
between PSD and PSND subjects or in VaD or AD. Results suggested that MAP2
immunostaining may be affected by PMD; however there were no differences in mean
PMD between groups, and differences in MAP2 staining intensity and distribution
could not be solely attributed to PMD. Therefore, these differences may also reflect
reorganization of dendrites in response to pathogenic processes associated with
disease, cause of death or pre-mortem agonal state. Difficulties interpreting these
results were compounded by poor understanding of the functional implications of
increased/decreased MAP-2 immunoreactivity on cognitive function. Similar results
were found with post-synaptic markers drebrin and PSD-95 using both IHC and
133
molecular techniques. Further studies to establish the stability of these proteins during
the post mortem interval would ensure correct interpretation of findings.
This study established a new technique to quantify dendritic changes using a 3D
stereological technique to measure dendritic length density in 30µm thick sections
stained for MAP2. However, the usefulness of this technique relies on being able to
correctly interpret the findings. Therefore, future studies using this technique could be
tested in brain tissue from rapid autopsies or carried out in perfusion fixed tissue from
animal models where post-mortem autolysis can be controlled, to ensure that changes
to dendritic length density accurately reflect pathogenic processes.
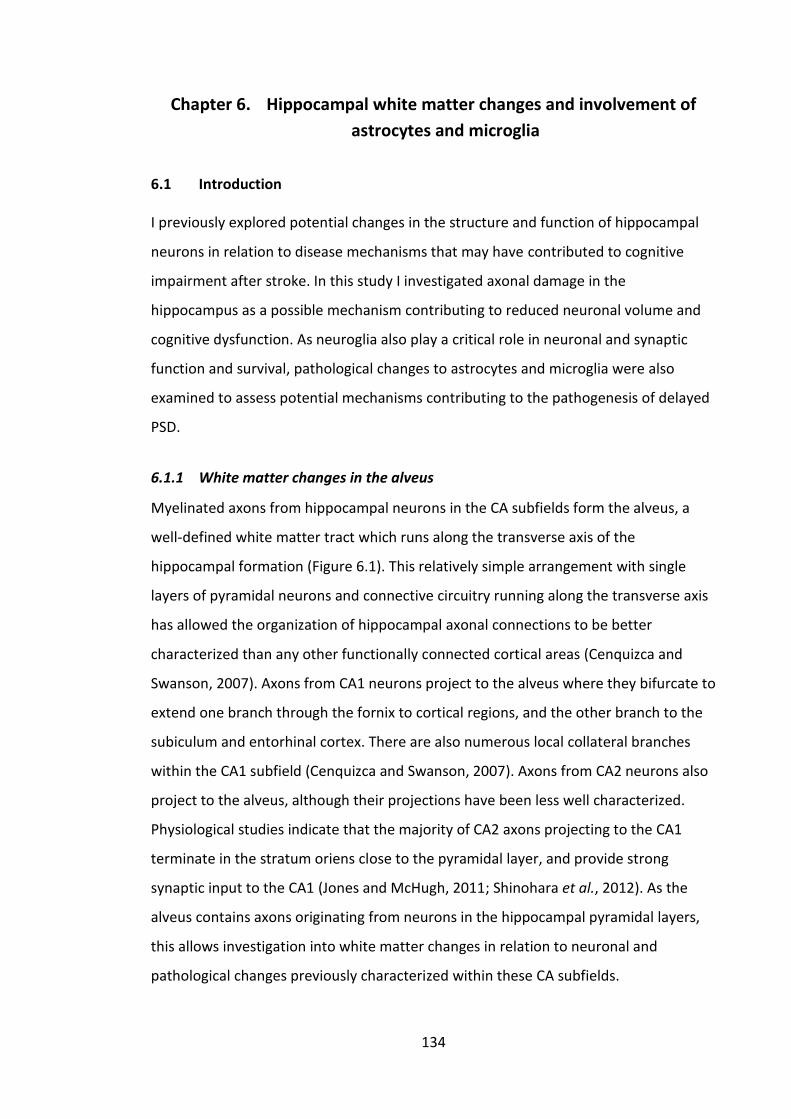
134
Chapter 6. Hippocampal white matter changes and involvement of
astrocytes and microglia
6.1 Introduction
I previously explored potential changes in the structure and function of hippocampal
neurons in relation to disease mechanisms that may have contributed to cognitive
impairment after stroke. In this study I investigated axonal damage in the
hippocampus as a possible mechanism contributing to reduced neuronal volume and
cognitive dysfunction. As neuroglia also play a critical role in neuronal and synaptic
function and survival, pathological changes to astrocytes and microglia were also
examined to assess potential mechanisms contributing to the pathogenesis of delayed
PSD.
6.1.1 White matter changes in the alveus
Myelinated axons from hippocampal neurons in the CA subfields form the alveus, a
well-defined white matter tract which runs along the transverse axis of the
hippocampal formation (Figure 6.1). This relatively simple arrangement with single
layers of pyramidal neurons and connective circuitry running along the transverse axis
has allowed the organization of hippocampal axonal connections to be better
characterized than any other functionally connected cortical areas (Cenquizca and
Swanson, 2007). Axons from CA1 neurons project to the alveus where they bifurcate to
extend one branch through the fornix to cortical regions, and the other branch to the
subiculum and entorhinal cortex. There are also numerous local collateral branches
within the CA1 subfield (Cenquizca and Swanson, 2007). Axons from CA2 neurons also
project to the alveus, although their projections have been less well characterized.
Physiological studies indicate that the majority of CA2 axons projecting to the CA1
terminate in the stratum oriens close to the pyramidal layer, and provide strong
synaptic input to the CA1 (Jones and McHugh, 2011; Shinohara et al., 2012). As the
alveus contains axons originating from neurons in the hippocampal pyramidal layers,
this allows investigation into white matter changes in relation to neuronal and
pathological changes previously characterized within these CA subfields.
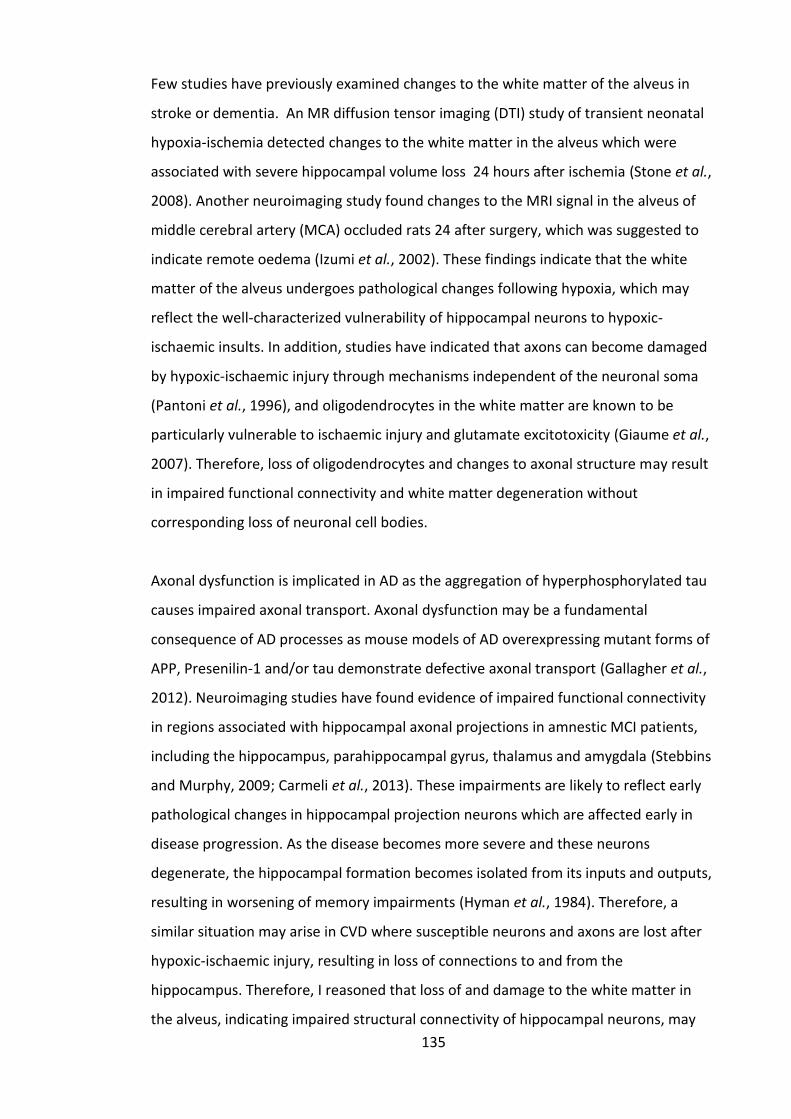
135
Few studies have previously examined changes to the white matter of the alveus in
stroke or dementia. An MR diffusion tensor imaging (DTI) study of transient neonatal
hypoxia-ischemia detected changes to the white matter in the alveus which were
associated with severe hippocampal volume loss 24 hours after ischemia (Stone et al.,
2008). Another neuroimaging study found changes to the MRI signal in the alveus of
middle cerebral artery (MCA) occluded rats 24 after surgery, which was suggested to
indicate remote oedema (Izumi et al., 2002). These findings indicate that the white
matter of the alveus undergoes pathological changes following hypoxia, which may
reflect the well-characterized vulnerability of hippocampal neurons to hypoxic-
ischaemic insults. In addition, studies have indicated that axons can become damaged
by hypoxic-ischaemic injury through mechanisms independent of the neuronal soma
(Pantoni et al., 1996), and oligodendrocytes in the white matter are known to be
particularly vulnerable to ischaemic injury and glutamate excitotoxicity (Giaume et al.,
2007). Therefore, loss of oligodendrocytes and changes to axonal structure may result
in impaired functional connectivity and white matter degeneration without
corresponding loss of neuronal cell bodies.
Axonal dysfunction is implicated in AD as the aggregation of hyperphosphorylated tau
causes impaired axonal transport. Axonal dysfunction may be a fundamental
consequence of AD processes as mouse models of AD overexpressing mutant forms of
APP, Presenilin-1 and/or tau demonstrate defective axonal transport (Gallagher et al.,
2012). Neuroimaging studies have found evidence of impaired functional connectivity
in regions associated with hippocampal axonal projections in amnestic MCI patients,
including the hippocampus, parahippocampal gyrus, thalamus and amygdala (Stebbins
and Murphy, 2009; Carmeli et al., 2013). These impairments are likely to reflect early
pathological changes in hippocampal projection neurons which are affected early in
disease progression. As the disease becomes more severe and these neurons
degenerate, the hippocampal formation becomes isolated from its inputs and outputs,
resulting in worsening of memory impairments (Hyman et al., 1984). Therefore, a
similar situation may arise in CVD where susceptible neurons and axons are lost after
hypoxic-ischaemic injury, resulting in loss of connections to and from the
hippocampus. Therefore, I reasoned that loss of and damage to the white matter in
the alveus, indicating impaired structural connectivity of hippocampal neurons, may
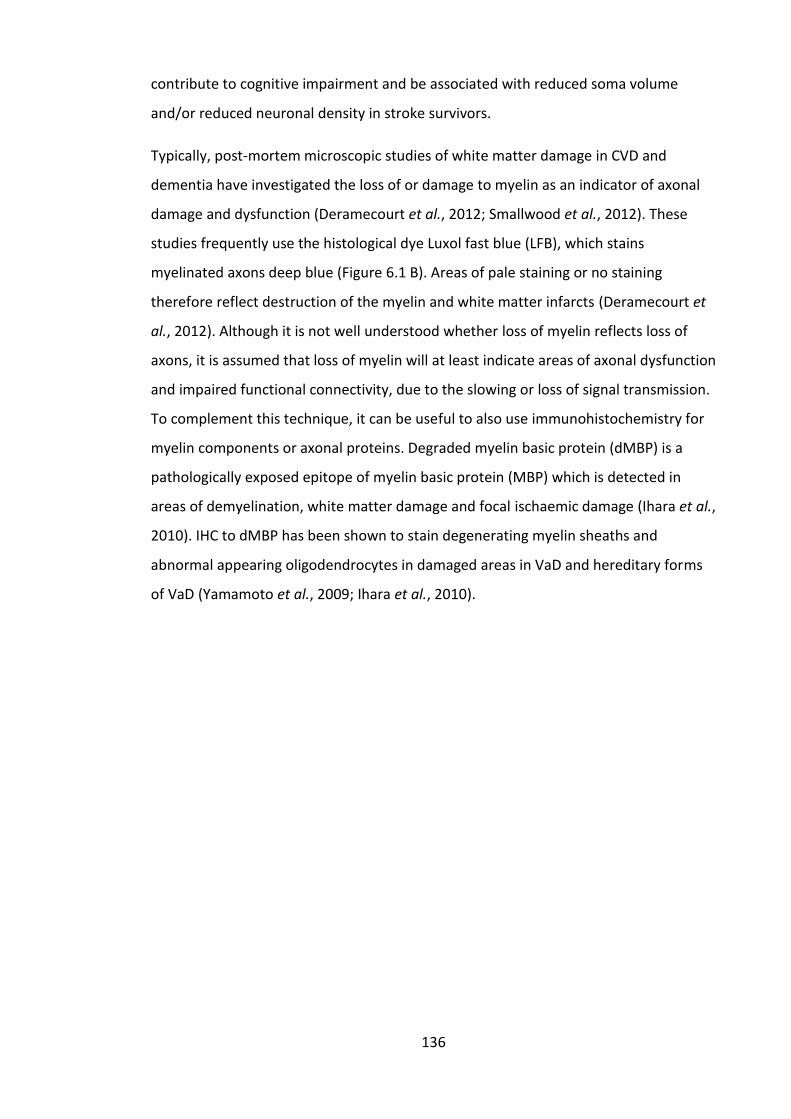
136
contribute to cognitive impairment and be associated with reduced soma volume
and/or reduced neuronal density in stroke survivors.
Typically, post-mortem microscopic studies of white matter damage in CVD and
dementia have investigated the loss of or damage to myelin as an indicator of axonal
damage and dysfunction (Deramecourt et al., 2012; Smallwood et al., 2012). These
studies frequently use the histological dye Luxol fast blue (LFB), which stains
myelinated axons deep blue (Figure 6.1 B). Areas of pale staining or no staining
therefore reflect destruction of the myelin and white matter infarcts (Deramecourt et
al., 2012). Although it is not well understood whether loss of myelin reflects loss of
axons, it is assumed that loss of myelin will at least indicate areas of axonal dysfunction
and impaired functional connectivity, due to the slowing or loss of signal transmission.
To complement this technique, it can be useful to also use immunohistochemistry for
myelin components or axonal proteins. Degraded myelin basic protein (dMBP) is a
pathologically exposed epitope of myelin basic protein (MBP) which is detected in
areas of demyelination, white matter damage and focal ischaemic damage (Ihara et al.,
2010). IHC to dMBP has been shown to stain degenerating myelin sheaths and
abnormal appearing oligodendrocytes in damaged areas in VaD and hereditary forms
of VaD (Yamamoto et al., 2009; Ihara et al., 2010).
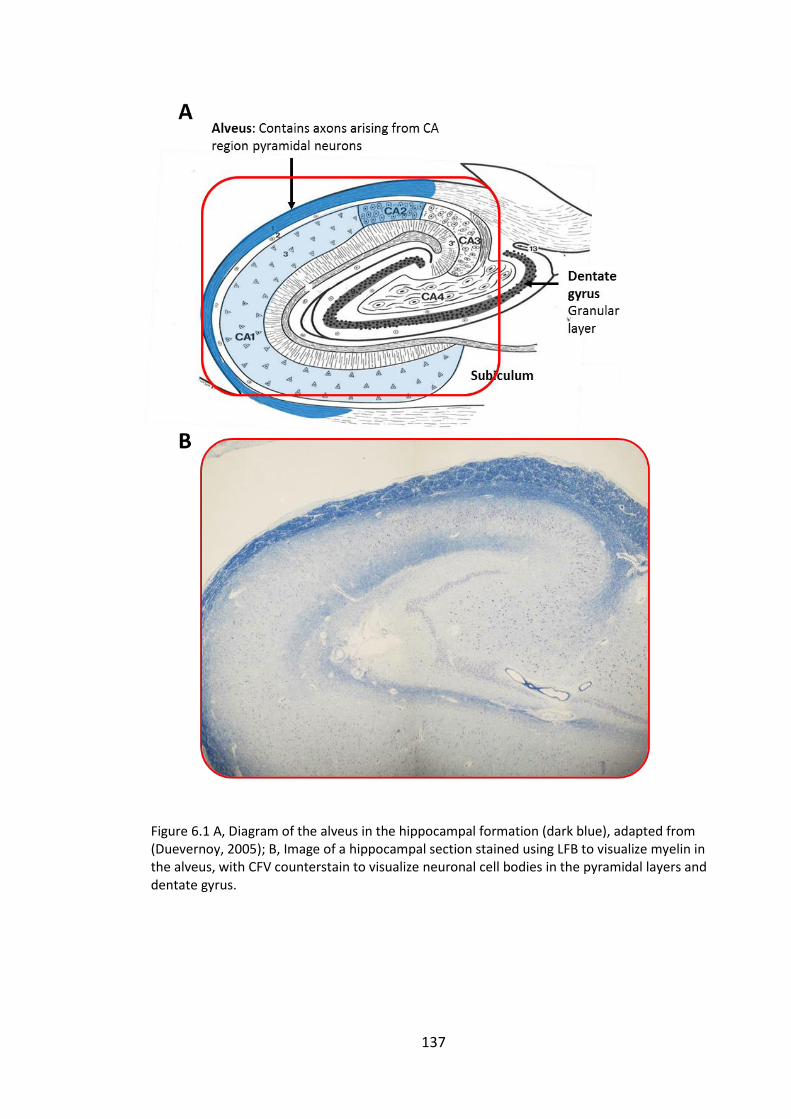
137
Figure 6.1 A, Diagram of the alveus in the hippocampal formation (dark blue), adapted from (Duevernoy, 2005); B, Image of a hippocampal section stained using LFB to visualize myelin in the alveus, with CFV counterstain to visualize neuronal cell bodies in the pyramidal layers and dentate gyrus.
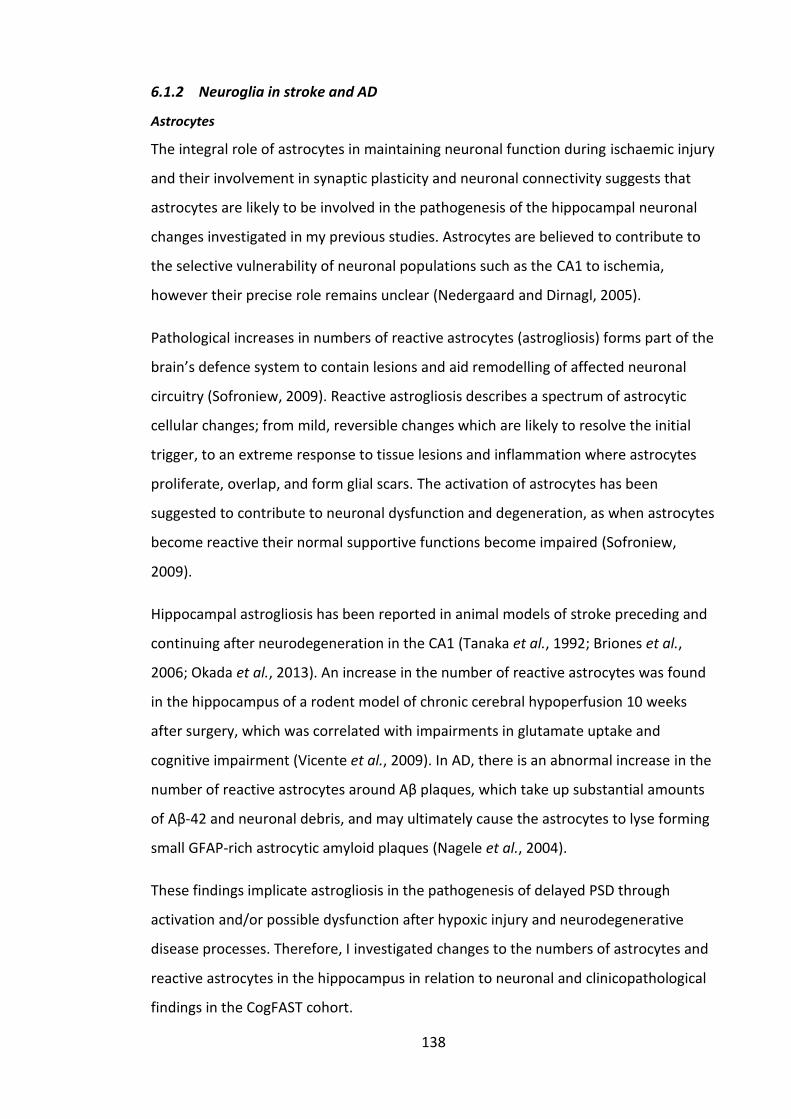
138
6.1.2 Neuroglia in stroke and AD
Astrocytes
The integral role of astrocytes in maintaining neuronal function during ischaemic injury
and their involvement in synaptic plasticity and neuronal connectivity suggests that
astrocytes are likely to be involved in the pathogenesis of the hippocampal neuronal
changes investigated in my previous studies. Astrocytes are believed to contribute to
the selective vulnerability of neuronal populations such as the CA1 to ischemia,
however their precise role remains unclear (Nedergaard and Dirnagl, 2005).
Pathological increases in numbers of reactive astrocytes (astrogliosis) forms part of the
brain’s defence system to contain lesions and aid remodelling of affected neuronal
circuitry (Sofroniew, 2009). Reactive astrogliosis describes a spectrum of astrocytic
cellular changes; from mild, reversible changes which are likely to resolve the initial
trigger, to an extreme response to tissue lesions and inflammation where astrocytes
proliferate, overlap, and form glial scars. The activation of astrocytes has been
suggested to contribute to neuronal dysfunction and degeneration, as when astrocytes
become reactive their normal supportive functions become impaired (Sofroniew,
2009).
Hippocampal astrogliosis has been reported in animal models of stroke preceding and
continuing after neurodegeneration in the CA1 (Tanaka et al., 1992; Briones et al.,
2006; Okada et al., 2013). An increase in the number of reactive astrocytes was found
in the hippocampus of a rodent model of chronic cerebral hypoperfusion 10 weeks
after surgery, which was correlated with impairments in glutamate uptake and
cognitive impairment (Vicente et al., 2009). In AD, there is an abnormal increase in the
number of reactive astrocytes around Aβ plaques, which take up substantial amounts
of Aβ-42 and neuronal debris, and may ultimately cause the astrocytes to lyse forming
small GFAP-rich astrocytic amyloid plaques (Nagele et al., 2004).
These findings implicate astrogliosis in the pathogenesis of delayed PSD through
activation and/or possible dysfunction after hypoxic injury and neurodegenerative
disease processes. Therefore, I investigated changes to the numbers of astrocytes and
reactive astrocytes in the hippocampus in relation to neuronal and clinicopathological
findings in the CogFAST cohort.
139
Historically, immunohistochemical studies on astrocytes have used antibodies to GFAP,
a cyto-architectural protein found in the main branches of reactive astrocytes, to
detect astrocytes. However, GFAP is therefore not a marker of all astrocytes as it is not
expressed in non-reactive astrocytes in healthy brain tissue (Sofroniew and Vinters,
2010). Studies using GFAP may have led to the over-estimation of the proliferation of
astrocytes in response to brain lesions, as perceived increases in numbers of GFAP-
positive astrocytes may have simply reflected increased numbers of activated
astrocytes, though the total number remained unchanged (Barreto et al., 2011).
Recent studies have identified the protein Aldh1L1 (also known as 10-
formyltetrahydrofolate dehydrogenase (FDH)), as a highly specific marker for
astrocytes expressed in most if not all astrocytes in healthy tissue (Barres, 2008; Cahoy
et al., 2008). This relatively new marker therefore allows more reliable investigations
into astrocyte numbers in neurodegenerative disease (compare Figure 6.2 A and B).
However, no markers have yet been proven to be entirely specific for and ubiquitously
expressed in all astrocytes (Oberheim et al., 2012). At the time of planning this study,
there were no previous reports of Alhd1L1-posisitve astrocytes in dementia studies.
140
Figure 6.2. Comparing methods to identify astrocytes in the CA2 subfield of a control subject. A, using antibodies to Aldh1L1, DAB stained brown with a very pale hematoxylin counterstain; B, antibodies to GFAP, nickel-DAB stained black, with no counterstain although neurons are still visible in the pyramidal layer as pale brown. There are noticeably fewer astrocytes positive for GFAP (B) than Aldh1L1 (A), particularly in the pyramidal layer. SR = stratum radiatum, PL = pyramidal layer, A = alveus. Scale bar = 100µm.
Microglia
Microglia can also influence neuronal survival after injury through their dual role in
neuroprotective and neurotoxic processes. Ramified microglia have a neuroprotective
role in releasing neurotrophic factors and removing excess glutamate and cell debris
from the neuropil (Vinet et al., 2012), and when activated, microglia are involved in
lesion repair and tissue remodelling (Perego et al., 2011). However, activated microglia
can also promote neurotoxicity, blood-brain barrier dysfunction and oedema through
the release of inflammatory components such as IL-1β, TNF-α, proteases and reactive
oxygen species (Nedergaard and Dirnagl, 2005). Aβ plaques also stimulate a neurotoxic
141
inflammatory response in microglia, which is considered to have an important role in
causing neurodegeneration in AD (Akiyama et al., 2000; Meraz Rios et al., 2013). One
antigen commonly used to identify activated microglia is CD68, a lysosomal protein
expressed during active phagocytosis. Microglia have been shown to engulf Aβ (Meraz
Rios et al., 2013) and degenerating neurons, which may have a beneficial effect in
removing irreversibly damaged neurons after injury. I hypothesised that an increase in
CD68 immunoreactivity would be associated with poorer cognitive outcome after
stroke, reflecting activation of microglia in response to greater cerebrovascular and/or
neurodegenerative injury in elderly stroke survivors.
6.2 Aims
Damage to the white matter in the alveus was investigated using LFB stained sections
to assess myelin integrity and antibodies to dMBP to assess myelin breakdown and
pathological accumulation in oligodendrocytes. Based on the known vulnerability of
white matter to CVD, hippocampal neuron loss and volume reductions in PSD, VaD and
AD, and disruptions to hippocampal connectivity contributing to cognitive dysfunction
in these disorders, I reasoned that greater white matter damage would be found in
stroke subjects who developed delayed PSD compared to controls and non-demented
stroke survivors from the CogFAST cohort. I was also interested in determining
whether the white matter was differentially affected in CVD and AD.
As neuronal function is now widely believed to rely on neuroglial support, I
investigated astrocyte numbers and activation of astrocytes and microglia in the
hippocampus of post-stroke and ageing-related dementia subjects.
I hypothesised that loss of astrocytes may be related to secondary neuronal cell death
after stroke, and therefore investigated total astrocyte numbers using IHC to Aldh1L1
to visualize both activated and non-activated astrocytes. The number of activated
astrocytes was also investigated using IHC to GFAP, to elucidate whether there was
differential astrocyte activation in PSD and PSND subjects, and elderly subjects with
VaD and AD. As astrocytes have a critical role in regulating synapses and white matter
changes, Aldh1L1-positive and GFAP-positive astrocytes densities were separately

142
analysed for different layers of the hippocampus (the CA1 and CA2 pyramidal layer
(PL), stratum radiatum (SR), alveus, and CA3 and CA4 pyramidal subfields) to
determine whether astrocytes in different layers were differentially affected in post-
stroke survivors, VaD and AD.
Microglia are implicated in the pathogenesis of delayed neuronal death after ischemia
and in the pathogenesis of AD. Therefore, I investigated levels of reactive CD68-
positive microglia to assess whether differences in microglial responses were
associated with different cognitive outcomes and pathological processes in post-stroke
survivors, VaD and AD subjects.
6.3 Methods
6.3.1 Histological and IHC staining
Sections were stained using Luxol fast blue with Cresyl fast violet counterstain as
described in section 2.5.2. Immunohistochemistry for degraded myelin basic protein
(dMBP), astrocyte markers glial-fibrillary acidic protein (GFAP) and Aldh1L1, and
microglia marker CD68 were performed according to protocol described on 2.6. GFAP
was visualized using nickel-DAB to increase the contrast and make it easier to identify
astrocyte cell bodies.
6.3.2 Image analysis
LFB
LFB staining in the alveus was assessed using Image Pro to calculate %PA and IOD
staining in the CA1 and CA2 as described on section 2.7.3. Images were taken at 10X
magnification, and areas of a standardized size were analysed from the CA1 and CA2
alveus, and ECV white matter. Myelin index was also calculated as described on section
2.7.3 and in (Yamamoto et al., 2009), from low power scanned images of the
hippocampal formation, within which the white matter tract around the CA2-CA1 was
delineated for analysis as one region of interest.
dMBP in the alveus and neurons
dMBP staining was assessed in the alveus using Image Pro as described in section 2.7.2
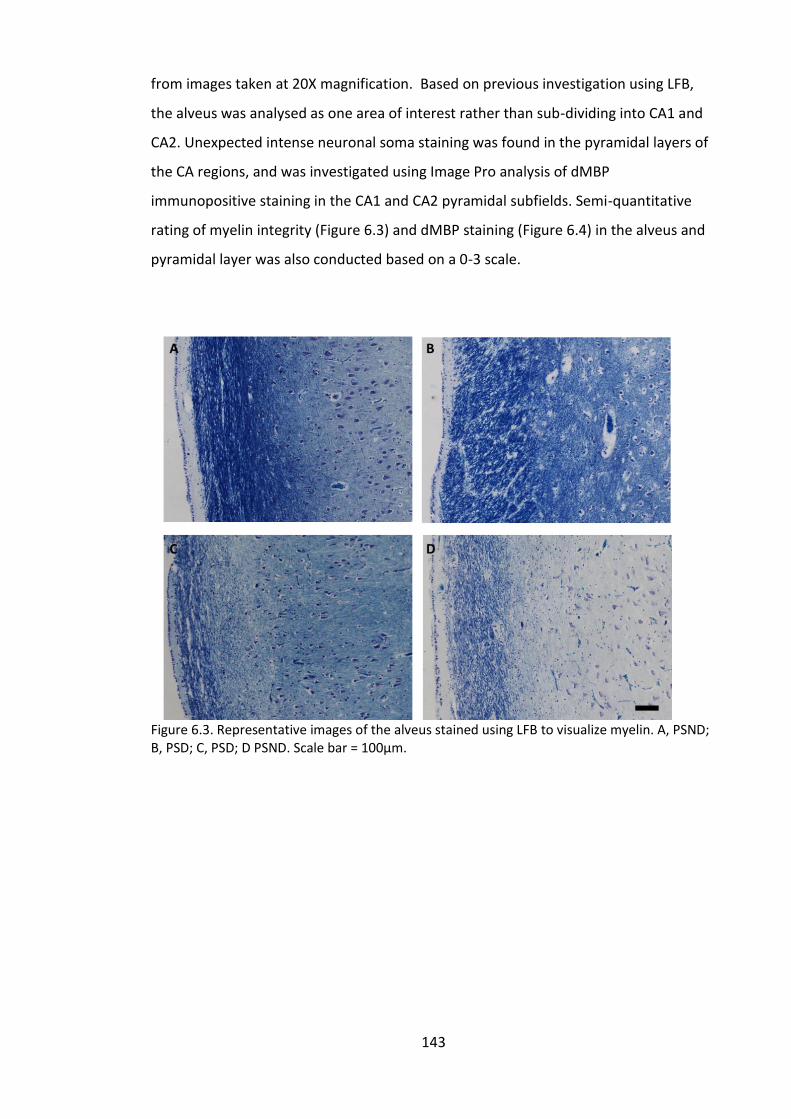
143
from images taken at 20X magnification. Based on previous investigation using LFB,
the alveus was analysed as one area of interest rather than sub-dividing into CA1 and
CA2. Unexpected intense neuronal soma staining was found in the pyramidal layers of
the CA regions, and was investigated using Image Pro analysis of dMBP
immunopositive staining in the CA1 and CA2 pyramidal subfields. Semi-quantitative
rating of myelin integrity (Figure 6.3) and dMBP staining (Figure 6.4) in the alveus and
pyramidal layer was also conducted based on a 0-3 scale.
Figure 6.3. Representative images of the alveus stained using LFB to visualize myelin. A, PSND; B, PSD; C, PSD; D PSND. Scale bar = 100µm.
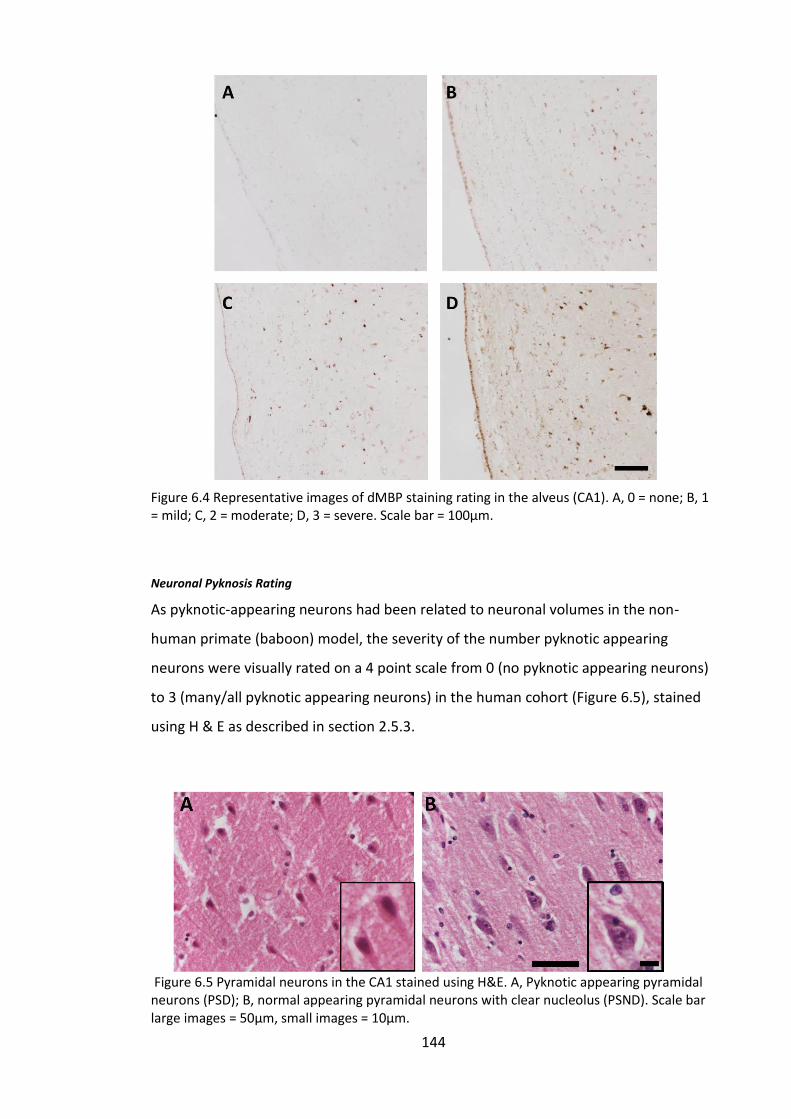
144
Figure 6.4 Representative images of dMBP staining rating in the alveus (CA1). A, 0 = none; B, 1 = mild; C, 2 = moderate; D, 3 = severe. Scale bar = 100µm.
Neuronal Pyknosis Rating
As pyknotic-appearing neurons had been related to neuronal volumes in the non-
human primate (baboon) model, the severity of the number pyknotic appearing
neurons were visually rated on a 4 point scale from 0 (no pyknotic appearing neurons)
to 3 (many/all pyknotic appearing neurons) in the human cohort (Figure 6.5), stained
using H & E as described in section 2.5.3.
Figure 6.5 Pyramidal neurons in the CA1 stained using H&E. A, Pyknotic appearing pyramidal neurons (PSD); B, normal appearing pyramidal neurons with clear nucleolus (PSND). Scale bar large images = 50µm, small images = 10µm.

145
Astrocyte Density
Astrocyte density was calculated using a counting grid as described in section 2.7.4,
where each grid square had an area equivalent to 0.08mm2 (283.3 x 283.3µm) (Figure
2.5). Astrocyte counts were performed in the CA1 and CA2 alveus, pyramidal layer and
stratum radiatum, the CA3 pyramidal layer and whole CA4 subfield. The mean number
of astrocytes per grid square was calculated from which the number of astrocytes per
0.8mm2 was calculated and expressed as astrocyte density.
6.3.3 Statistical analysis
PMD, fixation length and measures of LFB and dMBP staining were not normally
distributed and were therefore analysed using non-parametric tests. Associations
between ratings and dementia status were analysed using χ² test with Phi and
Cramer’s V. GFAP-positive astrocyte counts were normally distributed and analysed
using parametric tests, whereas Aldh1L1-positive astrocyte counts were non-normally
distributed and analysed using non-parametric tests. CD68 group demographics and
data were normally distributed and analysed using parametric tests as described in
section 2.1.
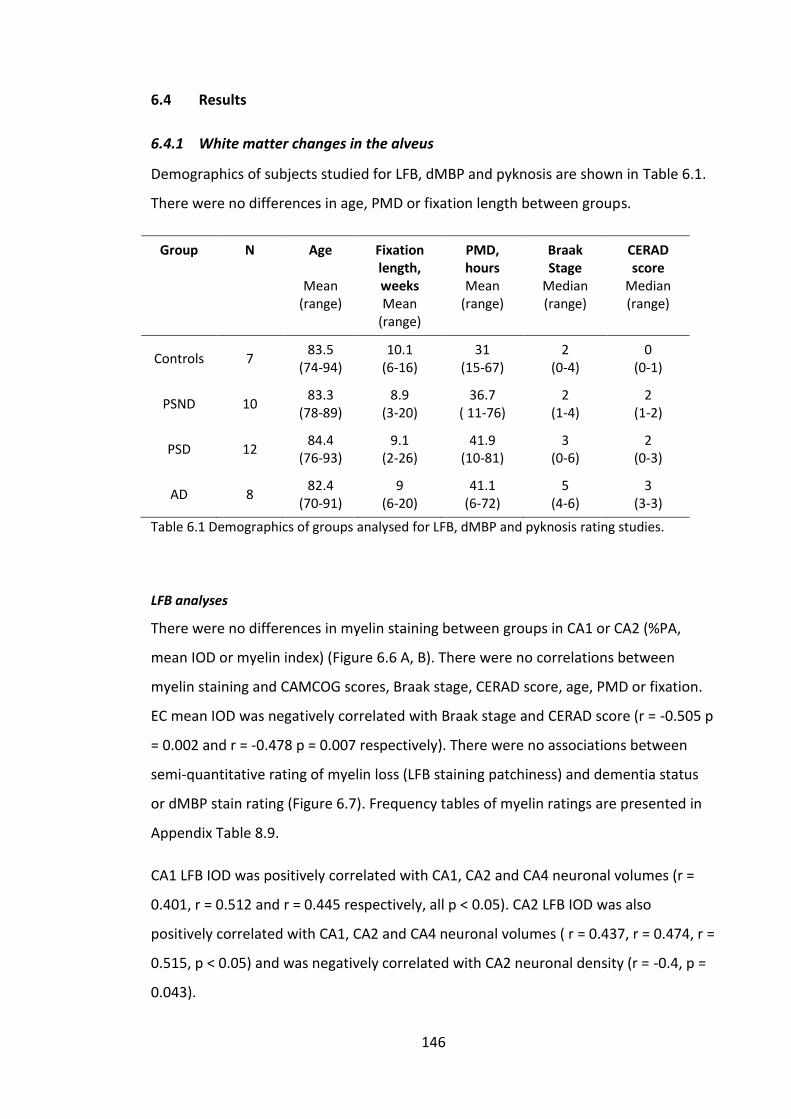
146
6.4 Results
6.4.1 White matter changes in the alveus
Demographics of subjects studied for LFB, dMBP and pyknosis are shown in Table 6.1.
There were no differences in age, PMD or fixation length between groups.
Group N Age
Mean (range)
Fixation length, weeks Mean
(range)
PMD, hours Mean
(range)
Braak Stage
Median (range)
CERAD score
Median (range)
Controls 7 83.5
(74-94) 10.1
(6-16) 31
(15-67) 2
(0-4) 0
(0-1)
PSND 10 83.3
(78-89) 8.9
(3-20) 36.7
( 11-76) 2
(1-4) 2
(1-2)
PSD 12 84.4
(76-93) 9.1
(2-26) 41.9
(10-81) 3
(0-6) 2
(0-3)
AD 8 82.4
(70-91) 9
(6-20) 41.1
(6-72) 5
(4-6) 3
(3-3)
Table 6.1 Demographics of groups analysed for LFB, dMBP and pyknosis rating studies.
LFB analyses
There were no differences in myelin staining between groups in CA1 or CA2 (%PA,
mean IOD or myelin index) (Figure 6.6 A, B). There were no correlations between
myelin staining and CAMCOG scores, Braak stage, CERAD score, age, PMD or fixation.
EC mean IOD was negatively correlated with Braak stage and CERAD score (r = -0.505 p
= 0.002 and r = -0.478 p = 0.007 respectively). There were no associations between
semi-quantitative rating of myelin loss (LFB staining patchiness) and dementia status
or dMBP stain rating (Figure 6.7). Frequency tables of myelin ratings are presented in
Appendix Table 8.9.
CA1 LFB IOD was positively correlated with CA1, CA2 and CA4 neuronal volumes (r =
0.401, r = 0.512 and r = 0.445 respectively, all p < 0.05). CA2 LFB IOD was also
positively correlated with CA1, CA2 and CA4 neuronal volumes ( r = 0.437, r = 0.474, r =
0.515, p < 0.05) and was negatively correlated with CA2 neuronal density (r = -0.4, p =
0.043).
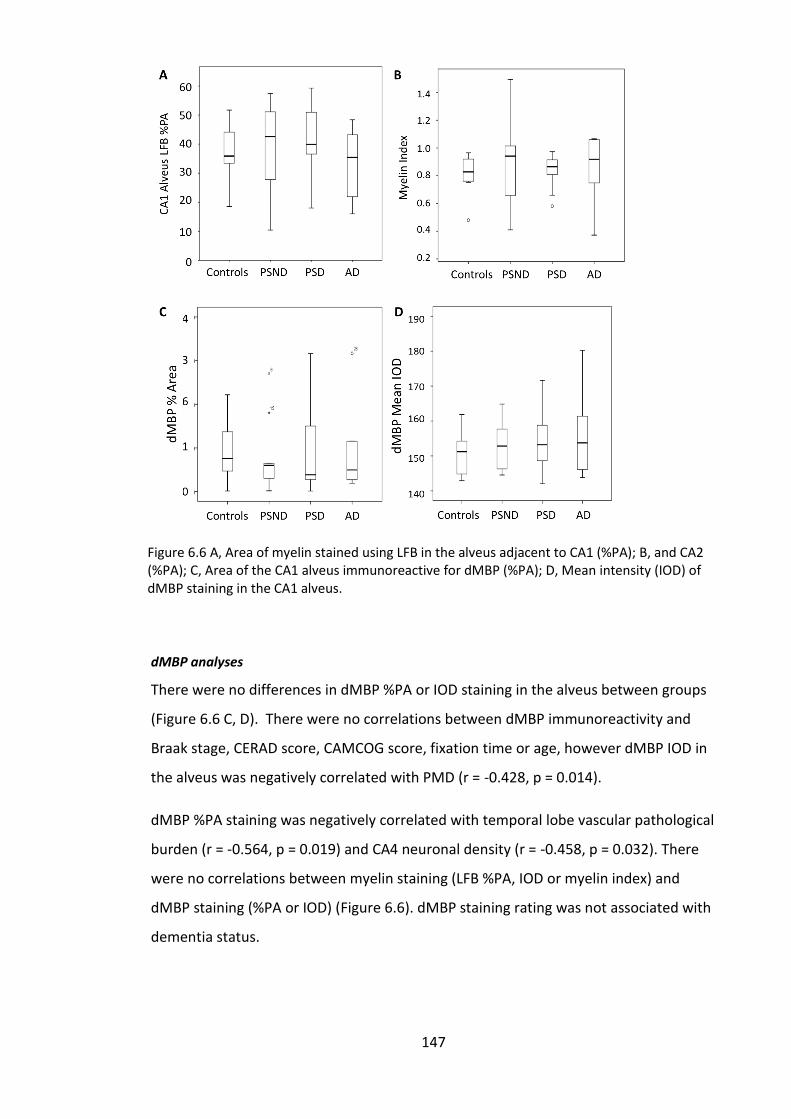
147
dMBP analyses
There were no differences in dMBP %PA or IOD staining in the alveus between groups
(Figure 6.6 C, D). There were no correlations between dMBP immunoreactivity and
Braak stage, CERAD score, CAMCOG score, fixation time or age, however dMBP IOD in
the alveus was negatively correlated with PMD (r = -0.428, p = 0.014).
dMBP %PA staining was negatively correlated with temporal lobe vascular pathological
burden (r = -0.564, p = 0.019) and CA4 neuronal density (r = -0.458, p = 0.032). There
were no correlations between myelin staining (LFB %PA, IOD or myelin index) and
dMBP staining (%PA or IOD) (Figure 6.6). dMBP staining rating was not associated with
dementia status.
Figure 6.6 A, Area of myelin stained using LFB in the alveus adjacent to CA1 (%PA); B, and CA2 (%PA); C, Area of the CA1 alveus immunoreactive for dMBP (%PA); D, Mean intensity (IOD) of dMBP staining in the CA1 alveus.
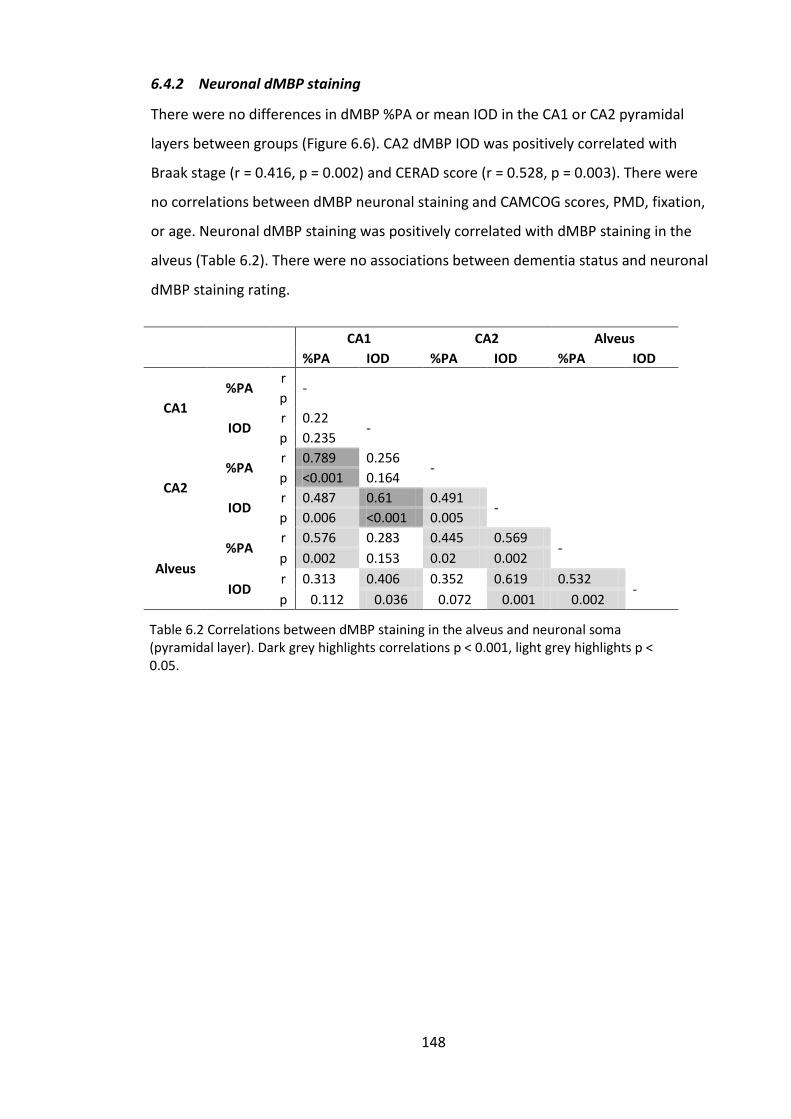
148
6.4.2 Neuronal dMBP staining
There were no differences in dMBP %PA or mean IOD in the CA1 or CA2 pyramidal
layers between groups (Figure 6.6). CA2 dMBP IOD was positively correlated with
Braak stage (r = 0.416, p = 0.002) and CERAD score (r = 0.528, p = 0.003). There were
no correlations between dMBP neuronal staining and CAMCOG scores, PMD, fixation,
or age. Neuronal dMBP staining was positively correlated with dMBP staining in the
alveus (Table 6.2). There were no associations between dementia status and neuronal
dMBP staining rating.
CA1 CA2 Alveus
%PA IOD %PA IOD %PA IOD
CA1
%PA r
-
p
IOD r 0.22
-
p 0.235
CA2
%PA r 0.789 0.256
-
p <0.001 0.164
IOD r 0.487 0.61 0.491
-
p 0.006 <0.001 0.005
Alveus
%PA r 0.576 0.283 0.445 0.569
-
p 0.002 0.153 0.02 0.002
IOD r 0.313 0.406 0.352 0.619 0.532
- p 0.112 0.036 0.072 0.001 0.002
Table 6.2 Correlations between dMBP staining in the alveus and neuronal soma (pyramidal layer). Dark grey highlights correlations p < 0.001, light grey highlights p < 0.05.
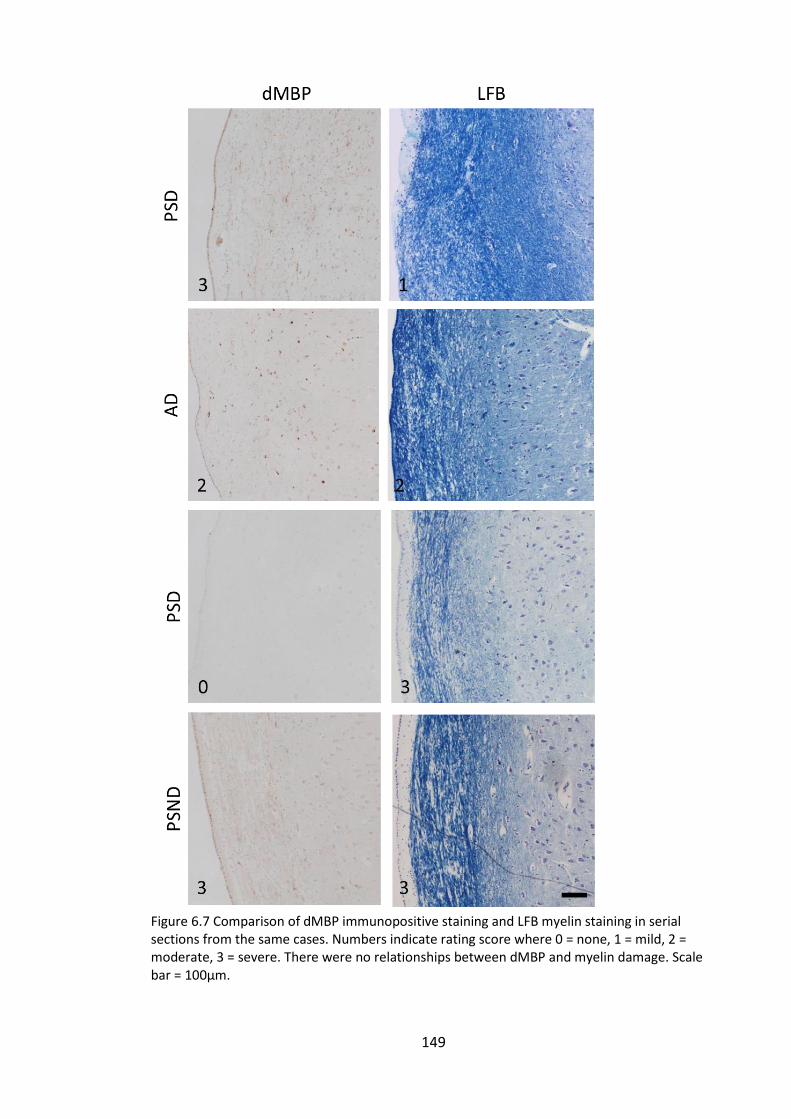
149
Figure 6.7 Comparison of dMBP immunopositive staining and LFB myelin staining in serial sections from the same cases. Numbers indicate rating score where 0 = none, 1 = mild, 2 = moderate, 3 = severe. There were no relationships between dMBP and myelin damage. Scale bar = 100µm.
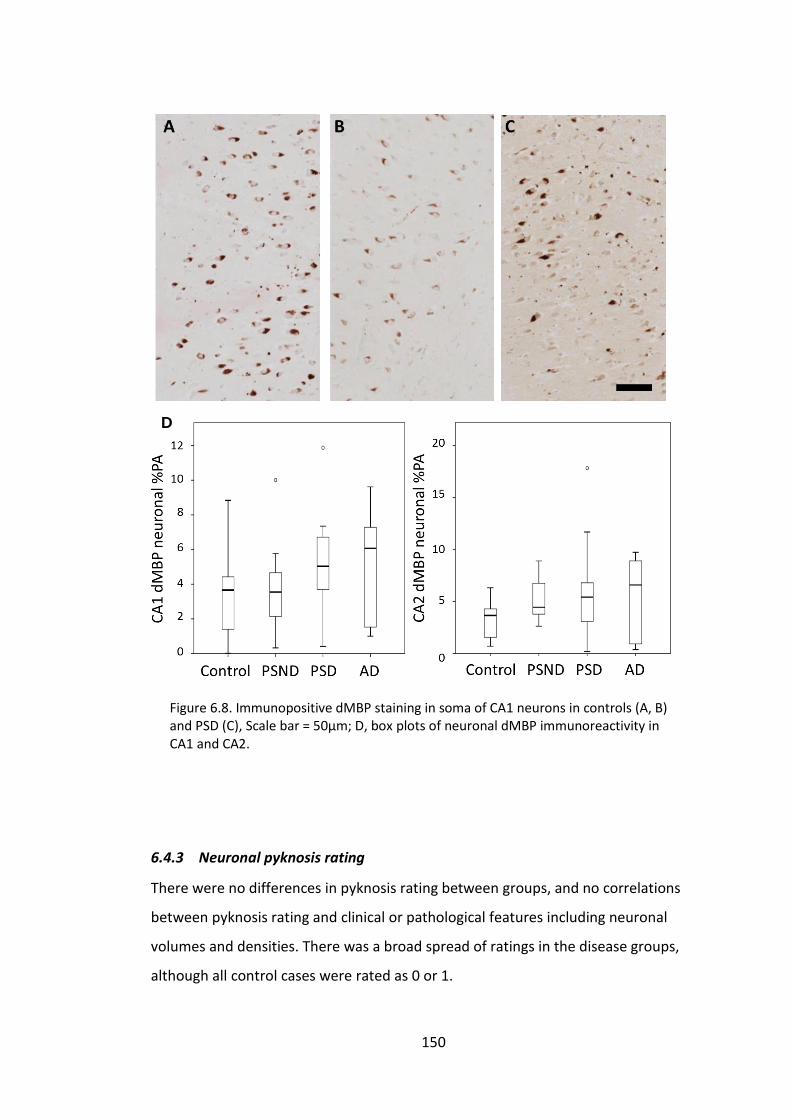
150
6.4.3 Neuronal pyknosis rating
There were no differences in pyknosis rating between groups, and no correlations
between pyknosis rating and clinical or pathological features including neuronal
volumes and densities. There was a broad spread of ratings in the disease groups,
although all control cases were rated as 0 or 1.
D
Figure 6.8. Immunopositive dMBP staining in soma of CA1 neurons in controls (A, B) and PSD (C), Scale bar = 50µm; D, box plots of neuronal dMBP immunoreactivity in CA1 and CA2.
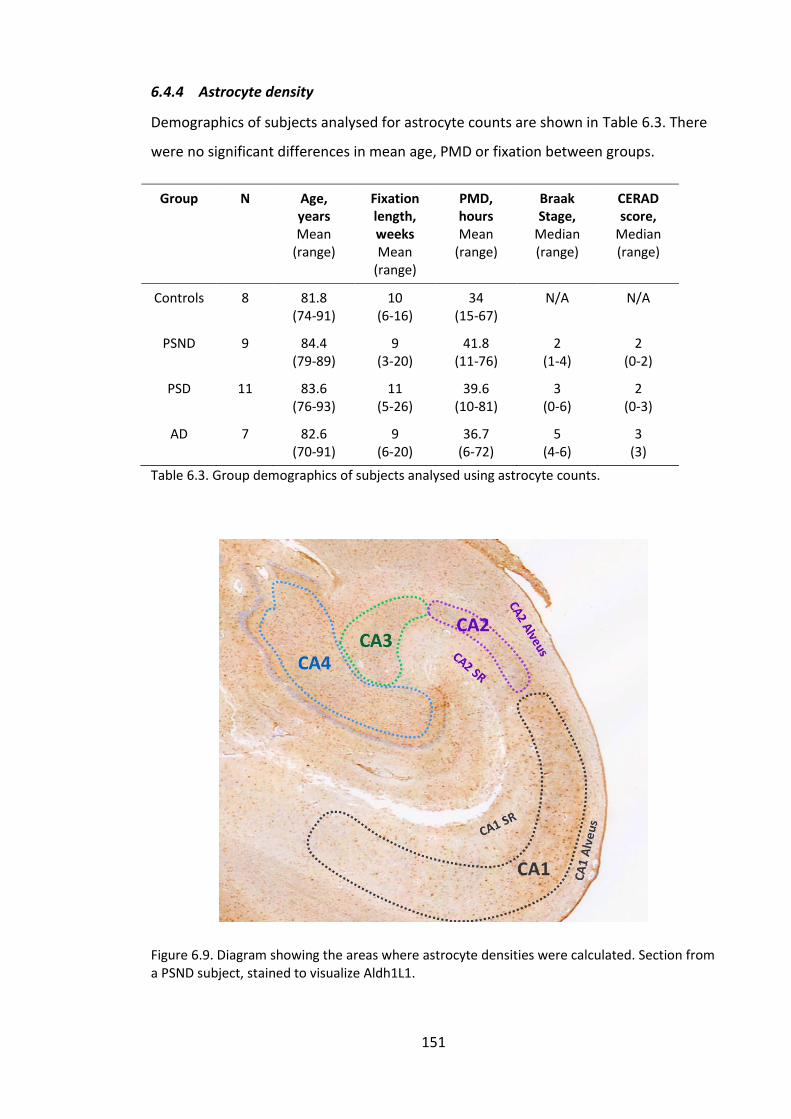
151
6.4.4 Astrocyte density
Demographics of subjects analysed for astrocyte counts are shown in Table 6.3. There
were no significant differences in mean age, PMD or fixation between groups.
Group N Age, years Mean
(range)
Fixation length, weeks Mean
(range)
PMD, hours Mean
(range)
Braak Stage,
Median (range)
CERAD score,
Median (range)
Controls 8 81.8 (74-91)
10 (6-16)
34 (15-67)
N/A N/A
PSND 9 84.4 (79-89)
9 (3-20)
41.8 (11-76)
2 (1-4)
2 (0-2)
PSD 11 83.6 (76-93)
11 (5-26)
39.6 (10-81)
3 (0-6)
2 (0-3)
AD 7 82.6 (70-91)
9 (6-20)
36.7 (6-72)
5 (4-6)
3 (3)
Table 6.3. Group demographics of subjects analysed using astrocyte counts.
Figure 6.9. Diagram showing the areas where astrocyte densities were calculated. Section from a PSND subject, stained to visualize Aldh1L1.
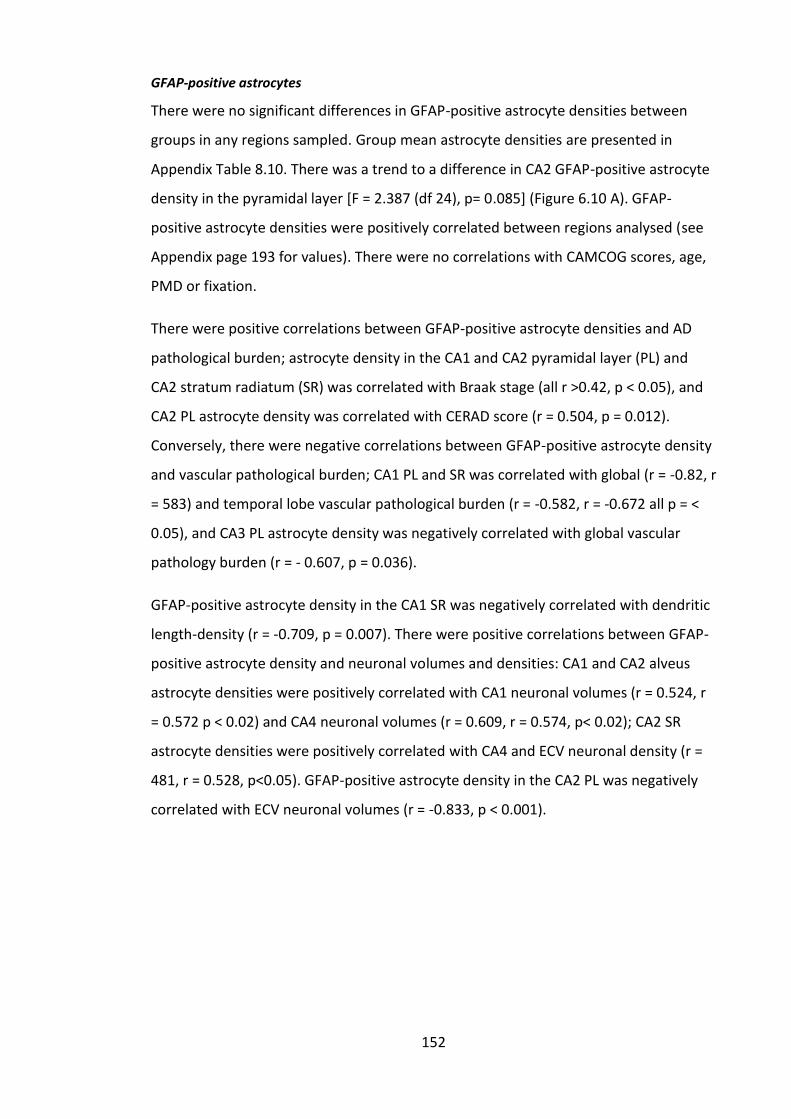
152
GFAP-positive astrocytes
There were no significant differences in GFAP-positive astrocyte densities between
groups in any regions sampled. Group mean astrocyte densities are presented in
Appendix Table 8.10. There was a trend to a difference in CA2 GFAP-positive astrocyte
density in the pyramidal layer [F = 2.387 (df 24), p= 0.085] (Figure 6.10 A). GFAP-
positive astrocyte densities were positively correlated between regions analysed (see
Appendix page 193 for values). There were no correlations with CAMCOG scores, age,
PMD or fixation.
There were positive correlations between GFAP-positive astrocyte densities and AD
pathological burden; astrocyte density in the CA1 and CA2 pyramidal layer (PL) and
CA2 stratum radiatum (SR) was correlated with Braak stage (all r >0.42, p < 0.05), and
CA2 PL astrocyte density was correlated with CERAD score (r = 0.504, p = 0.012).
Conversely, there were negative correlations between GFAP-positive astrocyte density
and vascular pathological burden; CA1 PL and SR was correlated with global (r = -0.82, r
= 583) and temporal lobe vascular pathological burden (r = -0.582, r = -0.672 all p = <
0.05), and CA3 PL astrocyte density was negatively correlated with global vascular
pathology burden (r = - 0.607, p = 0.036).
GFAP-positive astrocyte density in the CA1 SR was negatively correlated with dendritic
length-density (r = -0.709, p = 0.007). There were positive correlations between GFAP-
positive astrocyte density and neuronal volumes and densities: CA1 and CA2 alveus
astrocyte densities were positively correlated with CA1 neuronal volumes (r = 0.524, r
= 0.572 p < 0.02) and CA4 neuronal volumes (r = 0.609, r = 0.574, p< 0.02); CA2 SR
astrocyte densities were positively correlated with CA4 and ECV neuronal density (r =
481, r = 0.528, p<0.05). GFAP-positive astrocyte density in the CA2 PL was negatively
correlated with ECV neuronal volumes (r = -0.833, p < 0.001).
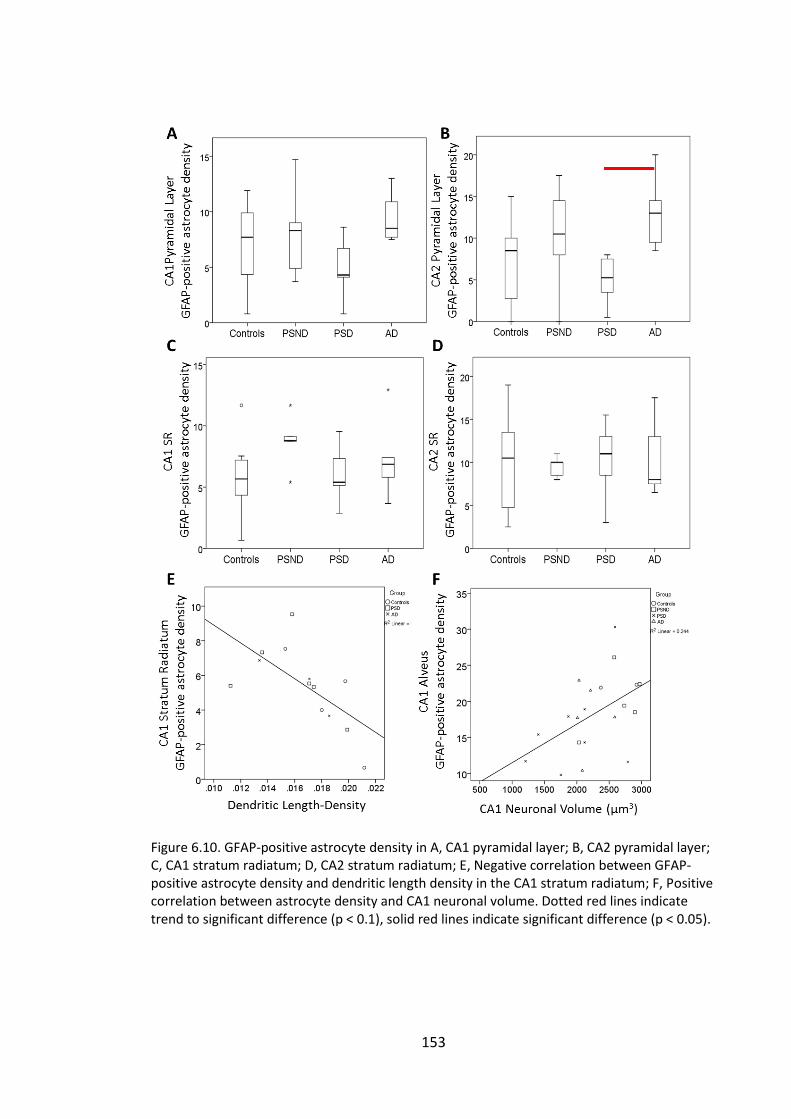
153
Figure 6.10. GFAP-positive astrocyte density in A, CA1 pyramidal layer; B, CA2 pyramidal layer; C, CA1 stratum radiatum; D, CA2 stratum radiatum; E, Negative correlation between GFAP-positive astrocyte density and dendritic length density in the CA1 stratum radiatum; F, Positive correlation between astrocyte density and CA1 neuronal volume. Dotted red lines indicate trend to significant difference (p < 0.1), solid red lines indicate significant difference (p < 0.05).

154
Figure 6.11 Representative images of Aldh1L1-positive astrocytes stained brown using DAB (A, C, E) and GFAP-positive astrocytes stained black using nickel-DAB (B, D, F). A and B are from the CA1 stratum radiatum / moleculare of an AD subject; C and D are from the CA1 stratum radiatum / moleculare of a PSND subject; E and F are high-power representative images of Aldh1L1-positive astrocytes and GFAP-positive astrocytes in the CA1 of the PSND subject. Scale bar in A-D = 100µm, E-F = 50µm.
155
Aldh1L1-positive astrocyte density
There were no differences in Aldh1L1-positive astrocyte densities between groups in
any of the regions studied (Figure 6.12). There was a trend to the PSD group having
greater Aldh1L1-positive astrocyte density than controls in the CA1 stratum radiatum
(p = 0.069), and the AD group having greater astrocyte density than PSND in the CA4 (p
= 0.054) (Figure 6.10 C). Aldh1L1-positive astrocyte densities were positively correlated
between regions (see Appendix page 193 for values). There were no correlations with
CAMCOG scores, Braak stage, CERAD score, age, PMD or fixation.
Aldh1L1-positive astrocyte densities were negatively correlated with vascular
pathological burden; CA1 and CA2 pyramidal layer astrocyte density with global
vascular pathology (r = -0.487, p = 0.04 and r = -0.603, <0.001) (Figure 6.12 D), and CA2
pyramidal layer with temporal lobe vascular pathological burden (r = -0.595, p =
0.009).
Figure 6.12. Aldh1L1-positive astrocyte densities in the CA1 stratum radiatum (A) and pyramidal layer (B), and CA4 (C); D, Correlation between CA1 pyramidal layer Aldh1L1-positive astrocyte density and global vascular pathological burden.
156
Aldh1L1 versus GFAP-positive astrocyte densities
Aldh1L1-positive astrocyte densities were different to GFAP-positive astrocyte
densities in all layers analysed (p < 0.001). In the CA1 SR, CA1 PL and CA2 SR, Aldh1L1
positive astrocyte densities were 2-3 fold greater than GFAP, whereas in the CA1 and
CA2 alveus GFAP-positive densities were around twice as high as Aldh1-L1 (Figure
6.13).The ratio of Aldh1L1 : GFAP – positive astrocyte densities in the CA1 SR and PL
were higher in the PSD group than the PSND group (p = 0.012 and p = 0.06), and higher
than the AD group in the CA1 PL (p = 0.004)(Figure 6.13 ).
Aldh1L1-positive astrocyte densities in the CA1 pyramidal layer (PL) were positively
correlated with GFAP-positive astrocyte densities in the CA1 PL, SR, and CA2 PL (r > 0.4,
p < 0.5). Aldh1L1-positive astrocyte densities in the CA2 PL were positively correlated
with GFAP-positive astrocyte densities in the CA1 and CA2 PL, and CA1 and CA2 SR (r >
0.4, p < 0.05).
GFAP-positive and Aldh1L1-positive astrocyte densities were significantly greater in the
CA1 and CA2 pyramidal layer than the alveus (p < 0.001), though there was no
difference in densities between the CA1 and CA2 pyramidal layer and the stratum
radiatum.
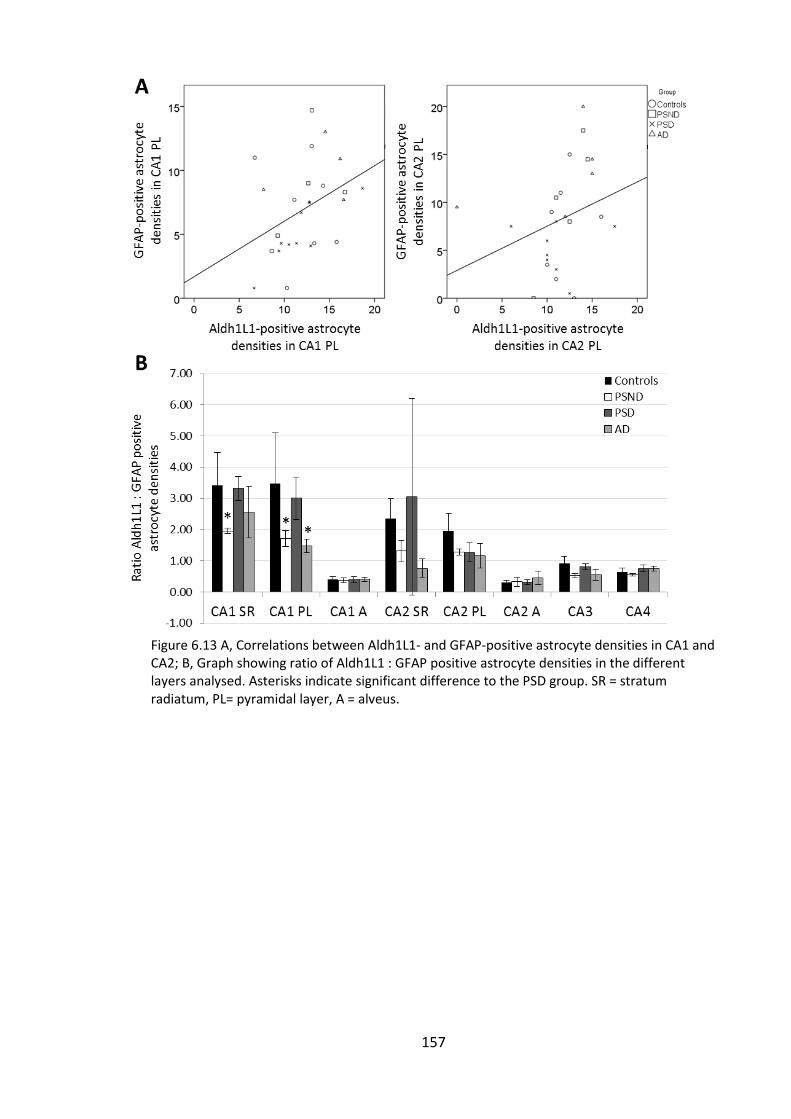
157
Figure 6.13 A, Correlations between Aldh1L1- and GFAP-positive astrocyte densities in CA1 and CA2; B, Graph showing ratio of Aldh1L1 : GFAP positive astrocyte densities in the different layers analysed. Asterisks indicate significant difference to the PSD group. SR = stratum radiatum, PL= pyramidal layer, A = alveus.
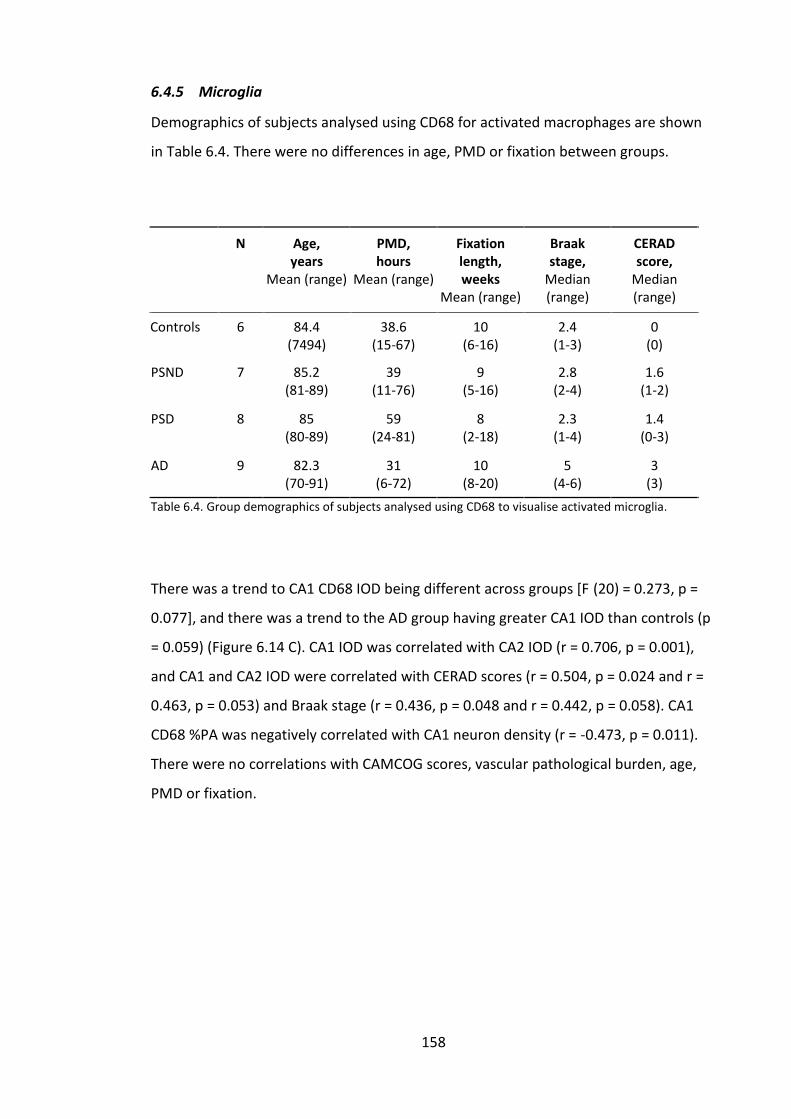
158
6.4.5 Microglia
Demographics of subjects analysed using CD68 for activated macrophages are shown
in Table 6.4. There were no differences in age, PMD or fixation between groups.
N Age, years
Mean (range)
PMD, hours
Mean (range)
Fixation length, weeks
Mean (range)
Braak stage,
Median (range)
CERAD score,
Median (range)
Controls 6 84.4 (7494)
38.6 (15-67)
10 (6-16)
2.4 (1-3)
0 (0)
PSND 7 85.2 (81-89)
39 (11-76)
9 (5-16)
2.8 (2-4)
1.6 (1-2)
PSD 8 85 (80-89)
59 (24-81)
8 (2-18)
2.3 (1-4)
1.4 (0-3)
AD 9 82.3 (70-91)
31 (6-72)
10 (8-20)
5 (4-6)
3 (3)
Table 6.4. Group demographics of subjects analysed using CD68 to visualise activated microglia.
There was a trend to CA1 CD68 IOD being different across groups [F (20) = 0.273, p =
0.077], and there was a trend to the AD group having greater CA1 IOD than controls (p
= 0.059) (Figure 6.14 C). CA1 IOD was correlated with CA2 IOD (r = 0.706, p = 0.001),
and CA1 and CA2 IOD were correlated with CERAD scores (r = 0.504, p = 0.024 and r =
0.463, p = 0.053) and Braak stage (r = 0.436, p = 0.048 and r = 0.442, p = 0.058). CA1
CD68 %PA was negatively correlated with CA1 neuron density (r = -0.473, p = 0.011).
There were no correlations with CAMCOG scores, vascular pathological burden, age,
PMD or fixation.
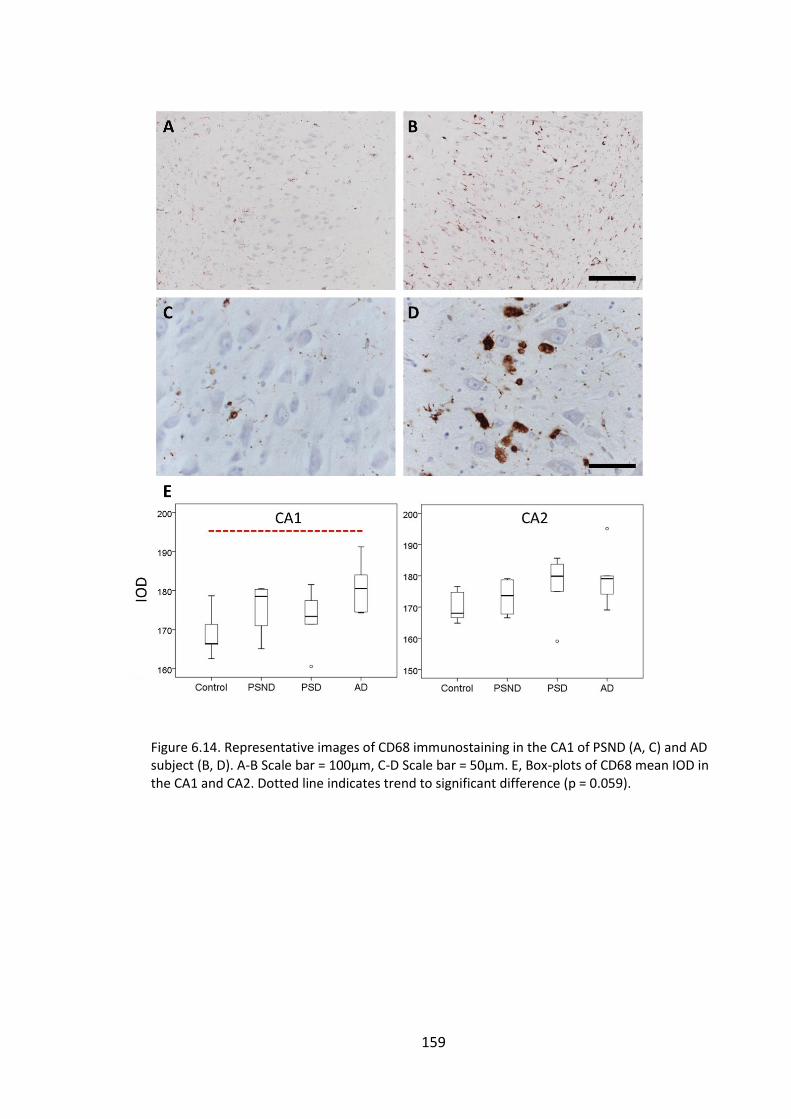
159
Figure 6.14. Representative images of CD68 immunostaining in the CA1 of PSND (A, C) and AD subject (B, D). A-B Scale bar = 100µm, C-D Scale bar = 50µm. E, Box-plots of CD68 mean IOD in the CA1 and CA2. Dotted line indicates trend to significant difference (p = 0.059).
160
6.5 Discussion
6.5.1 White matter damage
This study did not find any differences in myelin integrity in the alveus between the
PSD and PSND groups using LFB staining for myelin or dMBP for degraded myelin basic
protein. Furthermore, myelin and dMBP levels were not related to post-stroke
CAMCOG scores or dementia status. The considerable variation in myelin staining
between subjects within groups, particularly the controls, may have masked actual
disease related differences. Some subjects in the elderly control group exhibited
similar pathological white matter changes in the alveus to post-stroke and AD subjects,
which may have reflected age-associated white matter damage. Histopathological
studies have shown white matter damage, including myelin pallor, loss of white matter
fibres, and malformation of myelin sheaths, is a common feature in normal ageing
(Marner et al., 2003; Gunning-Dixon et al., 2009). As there does not appear to be
significant neuron loss with ageing, damage to white matter is therefore likely to
underlie the general slowing of cognition consistently found with increasing age
(Marner et al., 2003). Memory function declines with age (Peich et al., 2013), therefore
this may be related to myelin loss in the alveus causing slowing or loss of axonal
communication in the hippocampal circuitry.
Although there were no clear associations between LFB myelin staining and cognitive
status, there was considerable variability in myelin staining between subjects. Myelin
staining was positively correlated with neuronal volumes in the CA1, CA2 and CA4,
which suggests that subjects with reduced neuronal volumes had fewer myelinated
axons in the alveus, in agreement with my hypothesis that reduced neuronal volumes
may be related to axonal arbour. The AD group had the lowest mean LFB %PA staining
in CA1 and CA2, which is likely to reflect secondary axonal degeneration due to
hippocampal neurodegeneration and axonal damage caused by AD pathology.
Similarly, Braak and CERAD scores were only related to LFB staining in the EC white
matter, reflecting the well-described selective vulnerability of EC neurons to AD
processes.
Mean dMBP immunostaining was also similar between groups with a broad spread of
results within each group. Levels of dMBP did not appear to be directly related to
161
neuronal volumes or AD pathology, which may be because dMBP staining in white
matter is more closely related to oligodendrocyte than neuronal dysfunction.
Furthermore, areas with low LFB staining may have already undergone severe myelin
loss and axon degeneration, therefore there was less myelin was available to be
degraded and accumulate as dMBP. Therefore, accumulation of greater amounts of
dMBP may precede myelin loss after white matter injury. Interestingly, the area
stained for dMBP was related to temporal lobe vascular pathological burden, which fits
with current understanding of axonal and oligodendrocyte susceptibility to
hypoxic/ischaemic damage (Giaume et al., 2007), as subjects with greater
cerebrovascular pathology had greater dMBP. A previous study found that dMBP levels
were inversely related to the size of oligodendrocytes in the frontal white matter of
VaD subjects (Ihara et al., 2010). It would therefore be interesting to determine
whether there were reductions in oligodendrocyte number and/or size in the alveus of
subjects with greater myelin damage. However, dMBP levels were negatively
correlated with PMD, which suggests results may be influenced by PMD and should
therefore be interpreted with caution.
It was surprising to find intense dMBP staining in the soma of neurons in the CA
subfields. This staining was also not found to be different between disease groups or
related to cognitive status; however the stain intensity was related to AD pathological
burden in the CA2, and was positively correlated with dMBP levels in the alveus. This
suggests that dMBP may be taken up by neurons and accumulated in the neuronal
soma, possibly becoming sequestered with protein aggregates associated with AD
processes. DMBP-positive immunostaining was also found in neuronal soma in the
cortex, and appeared more intense in subjects with more intense hippocampal staining
(as shown in Appendix Figure 8.6). However, neuronal staining using dMBP has not
previously been reported and was expected to only be found in the white matter and
oligodendrocytes, therefore the functional implications of these findings are unclear.
LFB analyses were limited as the hematoxylin counterstain meant that oligodendrocyte
and astrocyte nuclei within the alveus were included in the myelin stain analyses.
However, the presence/absence of these nuclei also reflects mechanisms contributing
to myelin and axonal integrity, as loss of oligodendrocytes would result in
demyelination and axonal dysfunction. Variability in the intensity of LFB stain may have
162
influenced results, although the myelin index calculations were carried out to
normalize LFB staining differences. Stains for axonal proteins such as tau may be useful
markers to complement studies of this kind and determine whether myelin loss
reflects axon degeneration.
Pyknosis ratings were variable within groups, although all control subjects were rated
as 0 or 1. It was interesting not to find any relationship between the severity of
pyknotic-appearing neurons and neuronal volume or density measures, as reduced
neuronal volumes in the baboon model were related to pyknosis and cytoplasm
shrinkage was a possible mechanism contributing to neuronal volume loss in the
dementia subjects. Further investigation of markers of degenerating neurons, such as
poly (ADP-ribose) polymerase 1 (PARP) or Fluoro-Jade C, would be needed to establish
whether neuronal volume changes indicated cell death mechanisms. However, the
finding of neuronal volume loss without significant reductions in neuronal density
suggested that these neurons were not degenerating.
6.5.2 Astrocyte densities
Immunohistochemical staining for Aldh1L1 revealed greater numbers of astrocytes
than GFAP in the CA1 and CA2 pyramidal layers and stratum radiatum, which
confirmed that Aldh1L1 was a broader maker for astrocytes than GFAP. Aldh1L1-
positive protoplasmic astrocytes were evenly distributed across the hippocampus, in
agreement with the literature describing astrocytes completely tiling the brain and
occupying non-overlapping domains (Ogata and Kosaka, 2002; Sofroniew and Vinters,
2010). Surprisingly, the density of GFAP-positive astrocytes in the alveus was greater
than Aldh1L1-positive astrocytes. This may suggest that non-astrocytic GFAP-positive
cells were counted, as it is known that not all cells that express GFAP are astrocytes
(Oberheim et al., 2012). However, GFAP-positive staining was often intense in the
white matter of the alveus and close to the surface, making identification of astrocytic
cell bodies considerably more challenging (as shown in appendix Figure 8.8), therefore
astrocyte counts in the alveus may not have been accurate using GFAP.
There were no significant differences in Aldh1L1-positive astrocytes between groups,
although mean densities appeared higher in the CA1 in disease groups than controls.
Immunohistochemical staining for GFAP revealed greater differences in reactive
163
astrocyte densities between groups. The highest density of reactive astrocytes was
found in the AD subjects, and GFAP-positive astrocyte density was correlated with AD
pathology in the CA1 and CA2 pyramidal layers and stratum radiatum. These findings
are in agreement with previous studies demonstrating hippocampal astrogliosis in
response to AD pathology, although the precise role of astrocytes in the pathogenesis
of AD remains unknown (Grolla et al., 2013).
Conversely, increased vascular pathological burden was related to lower reactive
astrocyte density in the CA1 and CA3 pyramidal layers and the CA1 stratum radiatum.
As Aldh1L1-positive astrocyte density was also negatively correlated with vascular
pathological burden in the CA1 and CA2 pyramidal layers, these findings suggest that
CVD processes may result in loss of hippocampal astrocytes. This opposing effect of AD
and CVD processes on astrocyte densities may have prevented the detection of clear
differences in astrocyte densities in the groups studied, which are likely to have had
some degree of both cerebrovascular and neurodegenerative disease pathology.
The ratio of Aldh1L1- to GFAP-positive astrocyte density in the CA1 stratum radiatum
and pyramidal layer was greater in the PSD group compared to PSND, with PSD
subjects having a similar ratio to controls, whereas the PSND group were similar to AD.
This was surprising, as I had hypothesised that PSND would be more similar to
controls, reflecting the neuronal volume findings observed in chapter 1. This may
therefore reflect differing astrocytic response in the stroke survivors contributing to
cognitive decline, or be related to astrocytic activation by greater Aβ pathology in the
PSND group. Further investigation of reactive astrocytes in relation to AD pathology
may determine whether the density of GFAP-positive astrocytes was primarily
influenced by Aβ plaque density.
It was interesting to discover that GFAP-positive astrocyte density was inversely
related to dendritic length-density in the CA1 stratum radiatum as I had previously
failed to find any markers or factors related to dendritic length density. This finding
suggests that astrocytes within this subfield were responding to local dendritic
pathological changes, possibly through dendritic remodelling and synaptic function,
although reactive astrocytes have also previously been implicated in contributing to
neurodegeneration (Tanaka et al., 1992). However, due to the previously discussed
164
issues using MAP2, this relationship should be considered with caution. The finding
that GFAP-positive astrocyte density in the alveus and stratum radiatum was positively
correlated with neuronal volumes in CA1, CA2 and CA4, and that astrocyte density in
the CA2 stratum radiatum was related to CA1 and ECV neuronal density, suggests that
increased numbers of reactive astrocytes were associated with a neuroprotective
response to restore neuronal function, in agreement with previous studies (Briones et
al., 2006).
This investigation into astrocyte density was limited by the previously discussed
limitations associated with 2D estimates of cell densities, and could not take into
account possible variations in tissue atrophy. However, due to time constraints, full
investigation using 3D stereological analyses was not possible. These results indicate
that it would be extremely interesting to use a 3D stereological method to quantify
hippocampal astrocyte density and cell body size. Shrinkage of astrocyte volumes and
arbour have previously been reported in the EC in models of AD and were suggested to
be contribute to the selective vulnerability of the EC to AD pathology (Yeh et al., 2011),
whereas reactive astrogliosis is associated with increased astrocyte diameter
(Sofroniew, 2009). Double staining using immunofluorescence could be used to
identify the number of astrocytes that express both GFAP and Aldh1L1 for further
investigation into differences in reactive astrocyte densities between subjects and
hippocampal regions in different disease aetiologies. The use of additional astrocyte
markers such as S100β and glutamine synthetase will also allow further insight into
mechanistic changes to the hetereogeneous population of astrocytes in the
hippocampus after stroke.
6.5.3 Microglia
In agreement with published observations, activated microglial markers were related
to AD pathological burden. Although there were no significant differences in CD68
immunoreactivity between groups, the AD group had more intense staining than
controls and post-stroke subjects in CA1, and staining intensity in CA1 and CA2 was
correlated with AD pathology, in agreement with previous studies reporting microglial
activation in response to Aβ deposits in the neuropil and vessel walls (Meraz Rios et
al., 2013). The finding that greater CD68 staining was related to lower CA1 neuron
165
density may reflect the role of CD68-positive microglia in phagocytosing neurons in AD
(Neher et al., 2012). Based on these observations in CA1, it was therefore surprising to
find mean CD68 was highest in the PSD group in the CA2. I did not find any
relationships between CD68 and vascular pathology, suggesting that the microglial
activation was more closely related to AD pathology. This was supported by the (non-
significant) increase in mean CD68 levels in PSND subjects compared to PSD in the CA1,
which may reflect the greater burden of Aβ pathology I previously found in the PSND
group.
6.6 Conclusions
This study found considerable variation in myelin integrity in the alveus in elderly
subjects with and without dementia. Although myelin density and dMBP staining was
not related to cognitive status, loss of myelin staining in the alveus was related to
neuronal volumes in CA1, CA2, and CA4. This supported my hypothesis that there may
be a relationship between neuronal volume loss and impairment in neuronal
connectivity, as reduced myelin integrity is likely to reflect loss of, or dysfunctional
axonal connections. Conversely, dMBP immunoreactivity was not related to neuronal
volumes or LFB staining, but was related to vascular pathological burden in the medial
temporal lobe. This suggests that oligodendrocyte damage was greater in subjects with
more severe CVD, which is in agreement with literature describing the particular
susceptibility of oligodendrocytes to hypoxic-ischaemic damage.
There were no differences in astrocyte or reactive astrocyte densities between the PSD
and PSND groups, and they were not related to post-stroke cognitive function.
However, IHC to Aldh1L1 identified 2-3 times more astrocytes in the pyramidal layer
and stratum radiatum than GFAP, and they were distributed in a homogeneous
manner throughout all layers confirming that Aldh1L1 is a more reliable marker for
astrocytes. Interestingly, the PSD group had a higher ratio of Aldh1L1 to GFAP-positive
astrocytes than the PSND group, which had greater proportion of GFAP-positive
astrocytes similarly to AD subjects. This may have reflected the positive relationship
between increased density of reactive astrocytes and AD pathology, in agreement with
previous studies (Grolla et al., 2013). Astrocyte densities may also have been affected
by CVD, as they were negatively correlated with increasing vascular pathology. CD68-

166
positive microglial immunoreactivity was also related to AD pathology in agreement
with previous studies (Nagele et al., 2004; Bolmont et al., 2008).
167
Chapter 7. Discussion
7.1 Introduction
This study investigated neuronal morphological changes, neurodegenerative
pathological mechanisms, and neuroglial responses in the hippocampus of stroke
survivors from the CogFAST cohort and attempted to elucidate mechanisms
contributing to delayed post-stroke dementia. The key findings of this study are listed
below and discussed in detail in the following subsections:
Hippocampal neuronal soma volumes were 10 – 20% reduced in post-stroke
and ageing-related dementia subjects compared to non-demented stroke
survivors and controls. Surprisingly, CA1 neuron density was not related to
post-stroke cognitive status, and all stroke survivors had reduced neuron
density in the CA1 compared to controls. The degree of neuronal atrophy was
related to:
o severity of post-stroke cognitive impairment (CAMCOG scores)
o burden of hippocampal hyperphosphorylated tau pathology and Braak
stage
o reactive astrocyte density in the alveus and stratum radiatum
o myelin density in the alveus
Amyloid-β pathology was not related to cognitive function, and the non-
demented stroke survivors had a greater burden of Aβ pathology than PSD
subjects.
Reactive astrocytes and microglia were associated with greater burden of AD
pathology. Conversely, astrocyte density was inversely related to the CVD
pathological burden.
Greater burden of CVD pathology in the temporal lobe was related to
accumulation of degraded myelin basic protein in the alveus.
Interpretation of differences in dendritic and synaptic marker levels and
distribution were limited due to the poor understanding of the influence of
ischemia, agonal and post-mortem conditions.
168
Standard markers of autophagy appeared to be differentially affected in AD
and CVD; but were not related to cognitive status.
7.2 Neuronal atrophy as a mechanism contributing to cognitive impairment
This study provided novel evidence that neuronal volume reductions were associated
with cognitive impairment in PSD, AD, VaD and mixed dementia. As non-demented
stroke survivors maintained neuronal volumes similar to controls, and neuronal
volumes were related to cognitive test scores, this suggests that reduced neuronal
volumes reflected mechanistic changes contributing to cognitive decline. There were
no differences in CA1 neuron density between non-demented and demented stroke
survivors, which was surprising as neuron loss is believed to contribute to cognitive
dysfunction. However, this finding supported the hypothesis that dysfunction in the
surviving neurons was an important determinant of cognitive function.
Since the publication of these findings (Gemmell et al., 2012), further studies from
other members of the neurovascular research group have found that neuronal
volumes were similarly reduced in layers III and V of the dorsolateral pre-frontal cortex
(dlPFC) in PSD subjects from the CogFAST cohort , VaD and AD subjects compared to
controls and PSND subjects (manuscript in preparation). Neurons in the CA1/subiculum
directly innervate the prefrontal cortex via the hippocampo-prefrontal pathway, and
the prefrontal cortex is known to have an important role in learning and memory
formation (Laroche et al., 2000). Therefore, neuronal volume reductions in the dlPFC
may reflect deafferentation from hippocampal neurons lost or impaired by ischaemic-
hypoxic or neurodegenerative insults. However, neuronal volumes in the anterior
cingulate cortex and orbitofrontal cortex, regions also involved in memory processing
and long-term storage, were not reduced in subjects with dementia. Together with my
finding that EC neuronal volumes were only reduced in subjects with severe AD
pathology, this suggests that neuronal atrophy is not a global effect, but that neurons
in different areas of the brain are differentially vulnerable to mechanisms causing
these morphological changes.
These findings have interesting therapeutic implications, as they suggest that cognitive
function may be preserved or recovered even after significant loss of neurons, when
169
the surviving neurons maintain normal volumes. Studies to determine the mechanisms
protecting neurons from structural and functional decline in stroke survivors may
therefore provide the basis for the development of therapeutic strategies to prevent
or slow cognitive decline after stroke and in other age-related dementias.
7.3 Investigating mechanisms causing neuronal atrophy
My subsequent studies built on these findings to explore possible mechanisms causing
or contributing to neuronal atrophy and dysfunction.
7.3.1 Alzheimer’s disease pathology
Hyperphosphorylated tau pathology was related to neuronal densities in CA1 and
neuronal volumes in CA2, CA4 and ECV. These findings suggested that tau pathology
contributed to neurodegeneration in the CA1 and neuronal dysfunction in the other
subfields, which may be due to loss of neuronal connectivity due to CA1 target loss or
tau pathology causing neurite dysfunction. These results were in agreement with
previous studies demonstrating relationships between tau pathology, CA1 neuron loss
and cognitive impairment (Gómez-Isla et al., 1997; Giannakopoulos et al., 2003), but
no relationship with amyloid-β pathological burden (Braak and Braak, 1991). The
finding that PSND subjects had maintained neuronal volumes despite greater burden
of Aβ pathology suggests that neuronal volume could be an indicator of brain reserve,
where the surviving neurons had maintained functional connectivity or had
upregulated compensatory mechanisms which protected against neuronal dysfunction
and loss caused by disease processes. Anatomical differences in dendritic spines and
synapses have previously been suggested as possible quantitative measures of brain
reserve (Barulli and Stern, 2013), therefore neuronal volumes may reflect similar
mechanisms.
7.3.2 Autophagy
As autophagy is highly efficient in healthy neurons, I reasoned that increased staining
for autophagy proteins LC3 and Beclin-1 would be associated with cognitive
dysfunction in PSD. Accumulation of autophagic vacuoles indicates autophagic stress,
neurite damage caused by impaired protein degradation and trafficking, and leads to
structural changes and neuronal dysfunction. My findings were generally in agreement
170
with previous studies demonstrating increased build-up of AVs in subjects with AD
(Nixon and Yang, 2011). However the conflicting correlations between LC3 and Beclin-1
with global pathological burden were difficult to interpret. Imbalanced autophagy is
implicated in neurodegeneration, and autophagy can become imbalanced due to
down- or up-regulation or impaired clearance. Previous studies have suggested that
activation of autophagy can promote neuronal survival in the initial stages of ischaemic
brain injury (Carloni et al., 2008), although increased LC3 and Beclin-1 are more
commonly associated with neuron death due to excessive activation of autophagy
(Cherra III and Chu, 2008). Furthermore, chronic impairment in autophagy has been
shown to cause axonal and synaptic degeneration, while increased autophagy can lead
to neurite retraction and reduced neuronal communication (Cherra III and Chu, 2008).
Therefore, the functional significance of finding increased levels of autophagy markers
in CVD is unclear. Studies will first need to establish the role of autophagy in
hippocampal neurodegeneration and cognitive dysfunction in carefully controlled
animal models of stroke and hypoxia, to allow insight into the effects of CVD in the
absence of other age-associated disease processes.
7.3.3 Neuronal connectivity; dendrites, dendritic spines and synapses
Neurons represent the fundamental information processing unit in the brain, and their
structure influences how information is received and processed to generate action
potentials. Therefore, dysfunctional neuronal communication can be assessed through
changes to neurite structure or abnormal expression of proteins involved in synaptic
transmission. As the extent and complexity of the axo-dendritic arbour is believed to
influence neuronal soma volume (Harrison and Eastwood, 2001), and contribute to
loss of neuropil volume and tissue atrophy in cognitive impairment (Selemon and
Goldman-Rakic, 1999), changes to dendrites and axons were investigated as putative
mechanisms contributing to soma volume loss, neuronal dysfunction, hippocampal
atrophy, brain reserve and cognitive impairment in stroke survivors who developed
delayed PSD.
I hypothesised that dendrites and/or synaptic markers in the stratum radiatum would
be reduced in relation to cognitive impairment and neuronal loss and/or neuron
atrophy. However, finding an appropriate technique to investigate dendritic changes in
171
human post-mortem material was particularly challenging. Previous studies of
dendrites in human tissue have generally attributed surprising or conflicting findings to
post-mortem delay (Schwab et al., 1994; Cotter et al., 2000). This is a reasonable
assumption, as it is hard to believe that such plastic structures specialized to constantly
dynamically adapt for learning and memory formation do not also undergo significant
changes or degradation during the interval between death and fixation. However, the
precise effects of post-mortem autolytic processes on dendritic and synaptic markers
are not well characterised. One study, (Siew et al., 2004), has previously investigated
the stability of synaptic proteins after post-mortem delay up to 72 hours at 20°C and
4°C in rodent and human post-mortem tissue using ELISAs (enzyme-linked
immunosorbent assays). They found that synaptophysin levels were stable in rodent
and human tissue post-mortem, while levels of PSD-95 and pre-synaptic protein
syntaxin were considerably reduced in human frontal cortex from 24 hours post-
mortem. This demonstrated that post-mortem delay longer than 24 hours resulted in
inter-species and regional differences in synaptic marker stability, and that different
synaptic markers may be degraded at different rates. The authors attributed the
greater stability of synaptophysin to its multi-transmembrane structure which make it
more resistant to degradation (Siew et al., 2004). Further investigation would be
required to determine the reliability of interpreting changes in levels of other synaptic
markers using IHC in tissue with varying post-mortem delays. In human tissue, I found
that the dendritic spine protein drebrin was concentrated in neuronal soma with very
little in the stratum radiatum or moleculare. In contrast, drebrin levels were
concentrated in the neuropil in the perfusion-fixed non-human primate model,
suggesting that drebrin may be moved from dendritic spines to accumulate in the cell
body during the post-mortem interval. This has previously been shown with MAP2 and
tau, and further demonstrates that microtubules are not stable post-mortem (Schwab
et al., 1994).
MAP2 is also known to be particularly sensitive to hypoxic-ischaemic injury, which
further complicated interpretation of changes to MAP2-positive dendrites in stroke
survivors. Despite these limitations, I used MAP2 as it was the best marker to assess
dendritic changes in the paraffin-embedded tissue available. As expected,
interpretation of results using MAP2 was difficult. Differences in distribution patterns
172
and intensity were clearly visible by eye, but did not appear to be directly related to
disease pathology, cognitive function, neuronal volume/density changes, or PMD.
Similarly, there was variation in the distribution of post-synaptic proteins drebrin and
PSD-95 staining. Further work is required to determine the stability of these proteins
post-mortem and determine whether these differences reflect disease processes.
Despite these limitations, this study demonstrated a successful new 3D stereological
method to assess MAP2-positive dendritic length-density using a spherical probe.
Further work will be required to validate the even penetrance of the
immunohistochemical stain in 30µm thick sections, as variable staining has been
documented as a potential confounding factor for 3D stereology (Mouton, 2002;
Melvin and Sutherland, 2010). However, for studies such as mine which compared
differences between groups rather than determining absolute numbers of particles, as
all sections were processed and stained in the same way, any differences would have
affected all sections equally, allowing fair comparisons between subjects. Although
interpretation of these results in human post-mortem material face limitations
described previously, this technique could be applied to elucidate changes to dendritic
length and complexity in relation to neuronal volumes and memory impairments in
animal models of stroke with no PMD.
7.3.4 White matter changes in ageing and CVD
Myelin density in the alveus was correlated with neuronal volumes, suggesting that
reduced neuronal volume was associated with axon loss or dysfunction. Myelinated
axons do not undergo the dynamic plastic changes that dendrites do, therefore
allowing more reliable reflection of structures in life. However, myelin density was not
related to cognitive status or disease pathology in this study. This was apparent from
inspecting only the control group, where there was considerable variation in myelin
staining between subjects. Variability in white matter changes in controls has also
recently been shown in a DTI study which reported “tremendous individual variation
within a single control group” (Aine et al., 2014). Aine et al. also found that control
subjects often had a range of vascular risk factors, which had robust effects on brain
anatomy and function. This therefore highlights the current lack of understanding of
173
the functional impact of cerebrovascular lesions and white matter pathology on
cognition.
Myelin density was not related to levels of degraded myelin basic protein, although
accumulation of dMBP was associated with CVD burden in the temporal lobe. As
previously discussed, this may be because reduced myelin staining reflects myelin loss,
therefore there is less myelin left to become degraded. The relationship between
dMBP and CVD supports current understanding of the particular vulnerability of
oligodendrocytes to hypoxic-ischaemic injury. Further studies to investigate the
number and functionality of oligodendrocytes may elucidate relationships between
myelin staining and dMBP levels, as loss of myelin indicates loss of oligodendrocytes.
7.3.5 Role of astrocytes and microglial activation
The pivotal role of astrocytes in synaptic transmission, vessel function, and the
pathogenesis of neurological diseases have only recently begun to be recognized
(Sofroniew, 2009; Oberheim et al., 2012). As my central hypothesis focussed on loss of
hippocampal neuronal connectivity as a mechanism contributing to delayed PSD, I
reasoned that pathological changes to astrocytes were likely to be involved in neuronal
and cognitive dysfunction. Therefore, I investigated total astrocyte density using IHC to
a new specific marker of astrocytes (Aldh1L1) and reactive astrocytes using GFAP.
Astrocyte densities were not related to post-stroke cognitive function or different
between PSD and PSND groups, however the positive correlations between reactive
astrocyte densities in the alveus and stratum radiatum and neuronal volumes
suggested that reactive astrocytes had a neuroprotective role in maintaining neuronal
connections. Reactive astrocyte densities were also related to AD pathology, although
they were related to Braak stage more than CERAD score, which was surprising as
previous studies have reported accumulation of astrocytes undergoing gliosis around
Aβ plaques (Rodríguez et al., 2009). There was also increased activation microglia in
subjects with greater AD pathology, in agreement with the literature describing
increased gliosis in AD (Meraz Rios et al., 2013).
Interestingly, studies of AD have found that astrocytes distant from amyloid plaques
develop atrophy, which has been suggested to result in impaired synapse support,
synaptic remodelling and disrupted neuronal circuitry (Rodríguez et al., 2009). As my
174
findings indicated there may be a role for astrocytic activation and/or dysfunction in
relation to neuronal changes in post-stroke subjects, it would be interesting to conduct
a 3D stereological study of astrocyte density and volumes in the hippocampus of these
stroke survivors, for more accurate investigation into the relationships between
neuronal volume, connectivity and astrocytes.
7.4 General strengths and limitations
7.4.1 Unique strengths of the CogFAST cohort
The CogFAST cohort is a unique prospective study allowing insight into the disease
mechanisms causing delayed post-stroke dementia in elderly subjects. The extensive
detailed clinicopathological information made it possible to deduce relationships
between neuronal changes and clinical or pathological features. As all subjects were
recruited, assessed and all tissue was processed under the same conditions, this allows
for reliable comparison between subjects. The large numbers of subjects within the
cohort allowed my studies to have good statistical power.
The mean interval between last cognitive test and death was 7.6 months (± 2SE = 1.7),
providing a fairly accurate estimate of cognitive status at death. However, it is
impossible to know precisely how accurate these measures were, as subjects may have
experienced further or rapid cognitive decline between assessment and death.
Variability in degree of cognitive impairment in PSD subjects ranged from CAMCOG
scores 24 – 80 and PSND subjects from 76 – 99. Therefore, variability in pathological
changes would be expected within these groups to account for the variability in
cognition. However, this variability may have prevented detection of statistically
significant differences between groups, although providing a good range for
correlation analyses.
7.4.2 Additional factors to consider
Hippocampal tissue was randomly taken from either the right or left hemisphere
depending on which was available. There were no differences in neuronal volumes or
densities when data obtained from the right hippocampus was compared to that from
175
the left (p > 0.05). However, the hemisphere tested may have influenced the strength
of relationships between memory dysfunction and pathological changes, as studies
have found that different aspects of memory processing are more strongly associated
with the left or right hippocampus, with the left hippocampus being more involved in
context-dependent episodic memory, whereas the right is particularly involved in
memory for locations (Burgess et al., 2002).
Although none of the subjects studied had significant hippocampal vascular lesions,
there may have been asymmetrical damage to brain tissue caused by larger vascular
lesions such as the initial stroke. Therefore, it is possible that the hippocampus on the
contralateral hemisphere may have been less damaged by the more distant lesion.
However, no significant differences were found between the volumes of left and right
hippocampus of subjects who received volumetric MRI (Firbank, M. et al., unpublished
data), suggesting that both hemispheres were equally affected.
Furthermore, the number of risk factors (such as hypertension, cardiovascular events
etc.) and treatments (antihypertensive, antidepressants, anti-inflammatories) may
have also impacted on brain mechanisms contributing to pathological changes.
Although assessment of these variables was beyond the scope of my PhD, the detailed
information available in the CogFAST cohort allows the influence of these factors to be
investigated in future studies.
7.4.3 Limitations associated with human post-mortem studies of age-associated
dementia
The use of age-matched controls may limit detection of significant changes compared
to disease groups, as elderly cognitively normal subjects can have varying degrees of
physiological brain changes due to age-associated vascular lesions or
neurodegenerative pathology (Riley et al., 2002; Aine et al., 2014). It is therefore
critical that wherever possible, full clinical and neuropathological reports should be
available for control subjects to allow selection of appropriate subjects for studies into
disease mechanisms. However, although selection of ‘pathology-free’ controls may
provide more insight into disease mechanisms, it will not further current
understanding of why some elderly people maintain cognition despite significant
‘disease’ pathology. The contribution of variation in the burden of age-associated
176
pathology in different control subjects may have resulted in the often broad spread of
results within the control group in my studies. For example, atrophy of the CA1
subfield, which I reasoned may be due to loss of neurons or neuronal volume, has
been shown to also occur in cognitively normal elderly individuals (Wang et al., 2003;
Mueller et al., 2007).
The limitations of studying tissue with long or variable post-mortem interval were
discussed previously, and are not unique to this study. The use of PMD as a measure of
autolysis is also limited, as it does not take into account important factors such as
temperature (i.e. room temperature compared to storage in a mortuary refrigerator)
and tissue pH, which will influence the impact that duration of the interval between
death and fixation had on tissue degradation. Therefore, although studies of dendritic
and synaptic changes do appear to yield interesting results, interpretation of these
findings should be carefully considered and compared with findings in perfusion-fixed
animal models to ensure they are not reflecting artefacts of cell death and post-
mortem interval.
As with all post-mortem studies we also cannot rule out the possibility that tissue
morphology was affected during tissue processing. However all cases in the present
study were treated and analysed the same way, particularly the CogFAST subjects
which were recruited and processed as one cohort, therefore all groups should have
been equally affected allowing valid comparisons to be made.
7.5 Future Directions
7.5.1 Short-term studies
There are still many unanswered questions regarding neuronal volume changes
in ageing and dementia. Further 3D stereological analysis of neurons in young
subjects, without age-associated neuropathology or confounding cause of
death (e.g. cardiovascular or respiratory disease) will determine whether
hippocampal neuronal volume loss also occurs in normal ageing and may
contribute to age-associated brain atrophy.
177
Investigation of neuronal volumes in cortical regions of the brain that would be
expected to have little involvement in pathogenesis of dementia may provide
further evidence to determine whether neuronal atrophy only selectively
affects vulnerable regions of the brain.
Three-dimensional stereological analysis of Aldh1L1-positive hippocampal
astrocytes in the CA1 pyramidal layer and stratum radiatum will allow more
sensitive detection of subtle differences in astrocyte density between subjects
and disease states, to determine whether astrocyte densities are reduced in
CVD. Analysis of astrocyte volumes may also indicate whether astrocyte
function was impaired, as astrocyte shrinkage has been associated with
astrocyte and neuronal dysfunction in AD (Rodríguez et al., 2009), or whether
astrocytes were reactive with larger soma diameters.
Immunofluorescent double labelling of astrocytes with antibodies to Aldh1L1
and GFAP will allow further investigation into the putative protective role of
reactive astrocytes. This may also indicate whether there is astrocyte
proliferation or loss in specific regions such as vulnerable CA subfields or
around Aβ plaques.
7.5.2 Medium-term studies
To investigate differential changes to protein expression within the CA
subfields, laser-capture microdissection of individual neurons and/or astrocytes
could be used to select individual cells from frozen tissue. However, as only the
soma could be expected to be extracted, this method would be suited for
comparison of mRNA levels using RT-PCR (reverse transcription polymerase
chain reaction). This may allow insight into different gene expression in
different neuronal populations and between disease groups. It would be
particularly useful to determine the expression of genes involved in dendrite,
axonal and synaptic structure and function.
Changes to protein expression and distribution assessed using IHC techniques
within sections with increasing post-mortem delay should be investigated to
aid appropriate use of these techniques and more reliable interpretation of
findings. Ideally, this should be carried out in subjects with minimal disease
pathology, and post-mortem delays up to at least 72 hours. Results should also
178
be compared with a rodent model to investigate the effects of increasing post-
mortem delay as described by (Siew et al., 2004), at 4C and 20C, and perfusion-
fixed rodent tissue. Commonly used synaptic and dendritic proteins should be
investigated, as well as markers of cell stress and death mechanisms. This
resource would also then allow all markers to be assessed before carrying out
studies into mechanisms that are likely to be affected by death, PMD or tissue
fixation.
7.5.3 Long-term studies
To establish whether neuronal volumes are related to changes in dendritic
arbour after stroke will require tissue from a perfusion-fixed animal model of
stroke. Perfusion fixation will allow rapid and uniform preservation of the tissue
as close to its natural state as possible. The tissue can then be fixed under the
optimal conditions for the technique chosen.
o Despite the capricious nature of Golgi silver-impregnation techniques,
they remain one of the best ways to visualize dendrites and dendritic
spines. Recently, Golgi-Cox methods have been optimised for use in 60
– 100µm thick sections (Levine et al., 2013), which could then be used
for 3D analysis of dendritic spine length and complexity, in combination
with neuronal soma volume measurements. In addition, serial sections
could be taken for IHC analysis of local pathological burden.
o Fluorescent dyes may be used to trace neurite structure in fixed tissue,
through electroporation of Lucifer Yellow or biotin analogues or the
more recent “DiOlistic labelling”, where microparticles coated with a
lipophilic dye are fired at tissue sections. When a particle is embedded
in a neuron, the dye diffuses throughout the cell producing fluorescent
labelling of the entire structure (Staffend and Meisel, 2001).
o Following any of the above techniques, computer assisted dendrite and
spine tracing through thick tissue sections can be used to generate 3D
reconstructions of neuron and dendrite structure for quantitative
assessment of dendrite complexity and branching patterns using Sholl
analysis (Milosevic and Ristanovic, 2007).
179
Ideally, the animal model of stroke would also undergo cognitive testing at
different time points after surgery to assess acute and chronic hippocampal
morphological changes in relation to memory impairment.
7.6 Conclusions
This project provided novel evidence that reduced hippocampal neuronal soma
volume is a pathological substrate of cognitive impairment in post-stroke and ageing-
related dementias. Neuronal volumes were reduced ~20% in CA1, CA2, and CA4 in PSD
and VaD, and EC layer V neuronal volumes were also reduced in AD and MD subjects.
Both cerebrovascular and Alzheimer’s disease processes appeared to contribute to this
loss of neuronal volume, therefore this study provided novel evidence for a vascular
basis of hippocampal neurodegeneration.
Hippocampal neuronal volumes were related to hippocampal tau pathology burden,
but amyloid burden was not related to neuronal volumes or post-stroke cognitive
function. Greater neuronal volumes were associated with the density of reactive
astrocytes in the stratum radiatum and alveus, suggesting that astrocytes had a
protective role in maintaining neurite structure and function. This was further
supported by the finding of a relationship between reactive astrocyte density in the
stratum radiatum and dendritic length-density, although interpretation of dendrite
measures was limited by the influence of post-mortem interval and other unknown
variables on staining patterns.
Future studies to investigate the role of astrocytes in the pathogenesis of delayed PSD
may provide further evidence of a mechanism contributing to neuronal and vascular
dysfunction in stroke survivors. Perfusion-fixed animal models of stroke will be
required to determine the precise relationship between neuronal volume loss and axo-
dendritic arbour in CVD.
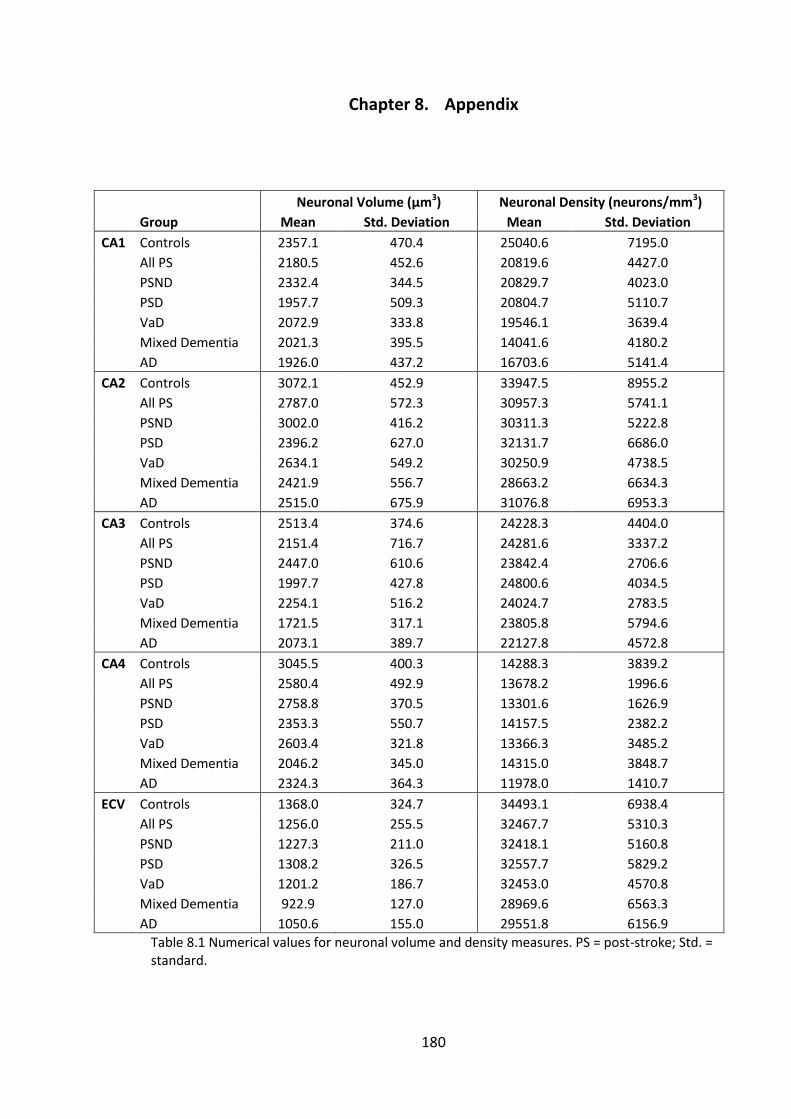
180
Chapter 8. Appendix
Neuronal Volume (µm3) Neuronal Density (neurons/mm3)
Group Mean Std. Deviation Mean Std. Deviation
CA1 Controls 2357.1 470.4 25040.6 7195.0
All PS 2180.5 452.6 20819.6 4427.0
PSND 2332.4 344.5 20829.7 4023.0
PSD 1957.7 509.3 20804.7 5110.7
VaD 2072.9 333.8 19546.1 3639.4
Mixed Dementia 2021.3 395.5 14041.6 4180.2
AD 1926.0 437.2 16703.6 5141.4
CA2 Controls 3072.1 452.9 33947.5 8955.2
All PS 2787.0 572.3 30957.3 5741.1
PSND 3002.0 416.2 30311.3 5222.8
PSD 2396.2 627.0 32131.7 6686.0
VaD 2634.1 549.2 30250.9 4738.5
Mixed Dementia 2421.9 556.7 28663.2 6634.3
AD 2515.0 675.9 31076.8 6953.3
CA3 Controls 2513.4 374.6 24228.3 4404.0
All PS 2151.4 716.7 24281.6 3337.2
PSND 2447.0 610.6 23842.4 2706.6
PSD 1997.7 427.8 24800.6 4034.5
VaD 2254.1 516.2 24024.7 2783.5
Mixed Dementia 1721.5 317.1 23805.8 5794.6
AD 2073.1 389.7 22127.8 4572.8
CA4 Controls 3045.5 400.3 14288.3 3839.2
All PS 2580.4 492.9 13678.2 1996.6
PSND 2758.8 370.5 13301.6 1626.9
PSD 2353.3 550.7 14157.5 2382.2
VaD 2603.4 321.8 13366.3 3485.2
Mixed Dementia 2046.2 345.0 14315.0 3848.7
AD 2324.3 364.3 11978.0 1410.7
ECV Controls 1368.0 324.7 34493.1 6938.4
All PS 1256.0 255.5 32467.7 5310.3
PSND 1227.3 211.0 32418.1 5160.8
PSD 1308.2 326.5 32557.7 5829.2
VaD 1201.2 186.7 32453.0 4570.8
Mixed Dementia 922.9 127.0 28969.6 6563.3
AD 1050.6 155.0 29551.8 6156.9
Table 8.1 Numerical values for neuronal volume and density measures. PS = post-stroke; Std. = standard.
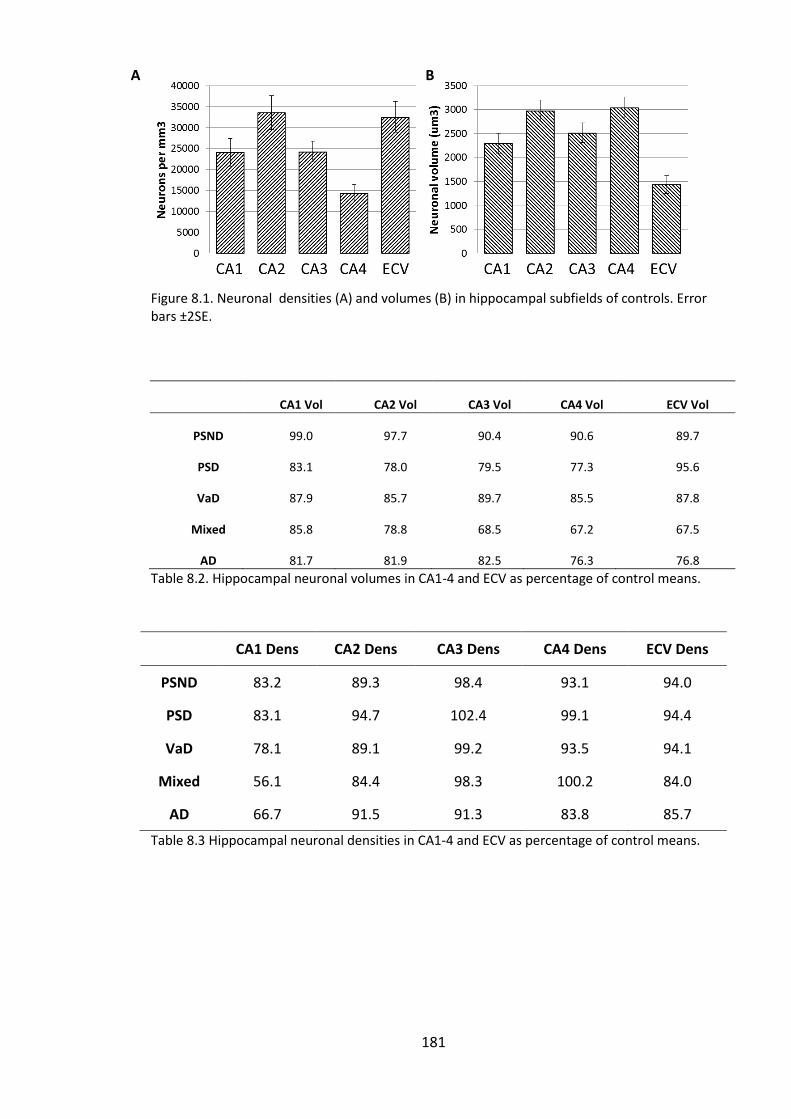
181
Figure 8.1. Neuronal densities (A) and volumes (B) in hippocampal subfields of controls. Error bars ±2SE.
CA1 Vol CA2 Vol CA3 Vol CA4 Vol ECV Vol
PSND 99.0 97.7 90.4 90.6 89.7
PSD 83.1 78.0 79.5 77.3 95.6
VaD 87.9 85.7 89.7 85.5 87.8
Mixed 85.8 78.8 68.5 67.2 67.5
AD 81.7 81.9 82.5 76.3 76.8
Table 8.2. Hippocampal neuronal volumes in CA1-4 and ECV as percentage of control means.
CA1 Dens CA2 Dens CA3 Dens CA4 Dens ECV Dens
PSND 83.2 89.3 98.4 93.1 94.0
PSD 83.1 94.7 102.4 99.1 94.4
VaD 78.1 89.1 99.2 93.5 94.1
Mixed 56.1 84.4 98.3 100.2 84.0
AD 66.7 91.5 91.3 83.8 85.7
Table 8.3 Hippocampal neuronal densities in CA1-4 and ECV as percentage of control means.
A B
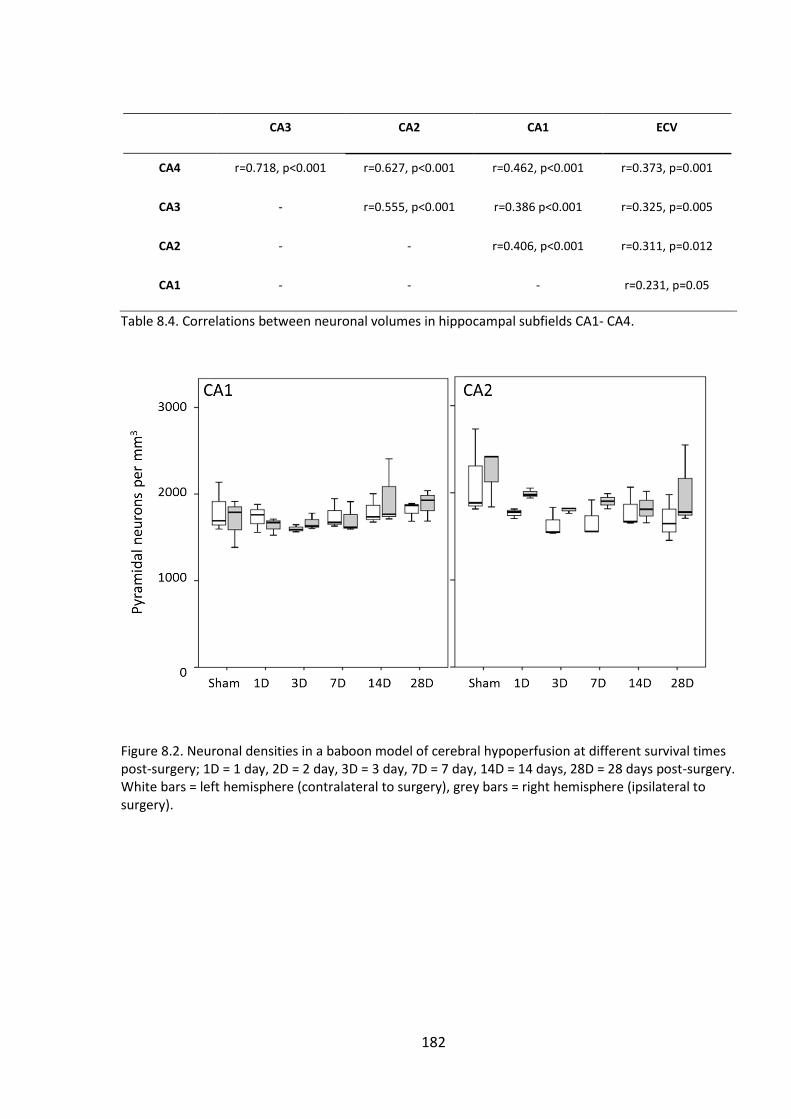
182
CA3 CA2 CA1 ECV
CA4 r=0.718, p<0.001 r=0.627, p<0.001 r=0.462, p<0.001 r=0.373, p=0.001
CA3 - r=0.555, p<0.001 r=0.386 p<0.001 r=0.325, p=0.005
CA2 - - r=0.406, p<0.001 r=0.311, p=0.012
CA1 - - - r=0.231, p=0.05
Table 8.4. Correlations between neuronal volumes in hippocampal subfields CA1- CA4.
Figure 8.2. Neuronal densities in a baboon model of cerebral hypoperfusion at different survival times post-surgery; 1D = 1 day, 2D = 2 day, 3D = 3 day, 7D = 7 day, 14D = 14 days, 28D = 28 days post-surgery. White bars = left hemisphere (contralateral to surgery), grey bars = right hemisphere (ipsilateral to surgery).
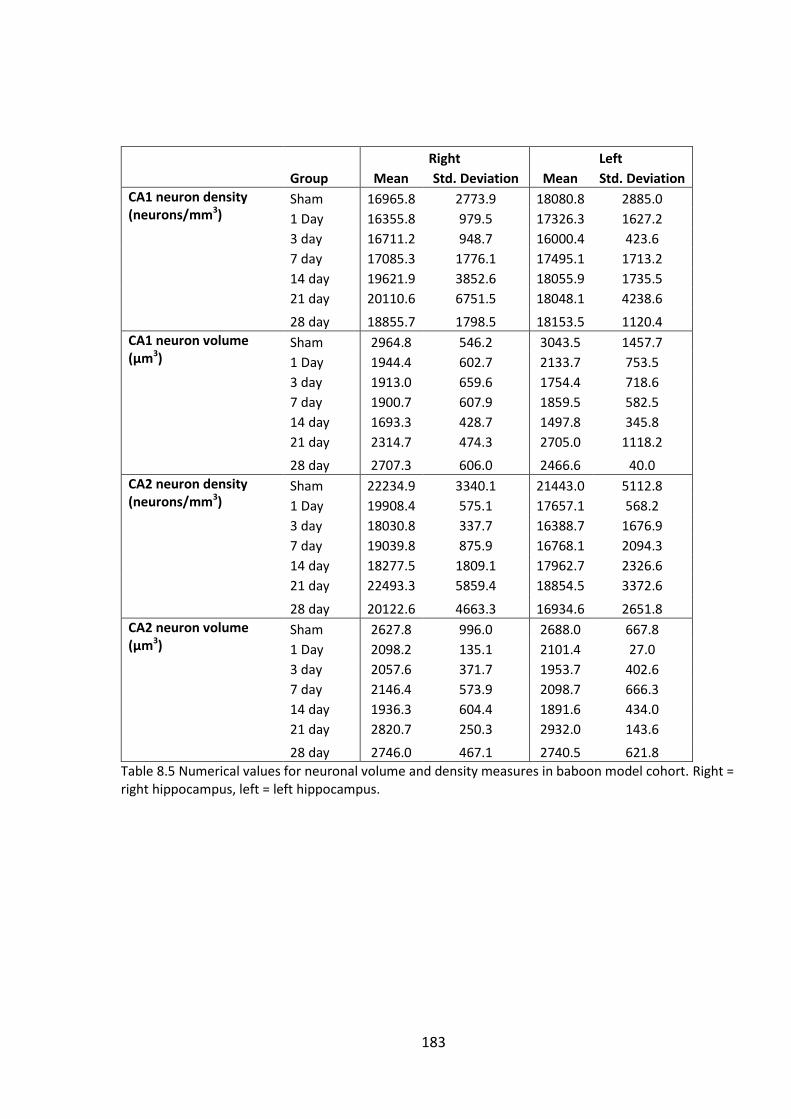
183
Right Left
Group Mean Std. Deviation Mean Std. Deviation
CA1 neuron density (neurons/mm3)
Sham 16965.8 2773.9 18080.8 2885.0
1 Day 16355.8 979.5 17326.3 1627.2
3 day 16711.2 948.7 16000.4 423.6
7 day 17085.3 1776.1 17495.1 1713.2
14 day 19621.9 3852.6 18055.9 1735.5
21 day 20110.6 6751.5 18048.1 4238.6
28 day 18855.7 1798.5 18153.5 1120.4
CA1 neuron volume (µm3)
Sham 2964.8 546.2 3043.5 1457.7
1 Day 1944.4 602.7 2133.7 753.5
3 day 1913.0 659.6 1754.4 718.6
7 day 1900.7 607.9 1859.5 582.5
14 day 1693.3 428.7 1497.8 345.8
21 day 2314.7 474.3 2705.0 1118.2
28 day 2707.3 606.0 2466.6 40.0
CA2 neuron density (neurons/mm3)
Sham 22234.9 3340.1 21443.0 5112.8
1 Day 19908.4 575.1 17657.1 568.2
3 day 18030.8 337.7 16388.7 1676.9
7 day 19039.8 875.9 16768.1 2094.3
14 day 18277.5 1809.1 17962.7 2326.6
21 day 22493.3 5859.4 18854.5 3372.6
28 day 20122.6 4663.3 16934.6 2651.8
CA2 neuron volume (µm3)
Sham 2627.8 996.0 2688.0 667.8
1 Day 2098.2 135.1 2101.4 27.0
3 day 2057.6 371.7 1953.7 402.6
7 day 2146.4 573.9 2098.7 666.3
14 day 1936.3 604.4 1891.6 434.0
21 day 2820.7 250.3 2932.0 143.6
28 day 2746.0 467.1 2740.5 621.8
Table 8.5 Numerical values for neuronal volume and density measures in baboon model cohort. Right = right hippocampus, left = left hippocampus.
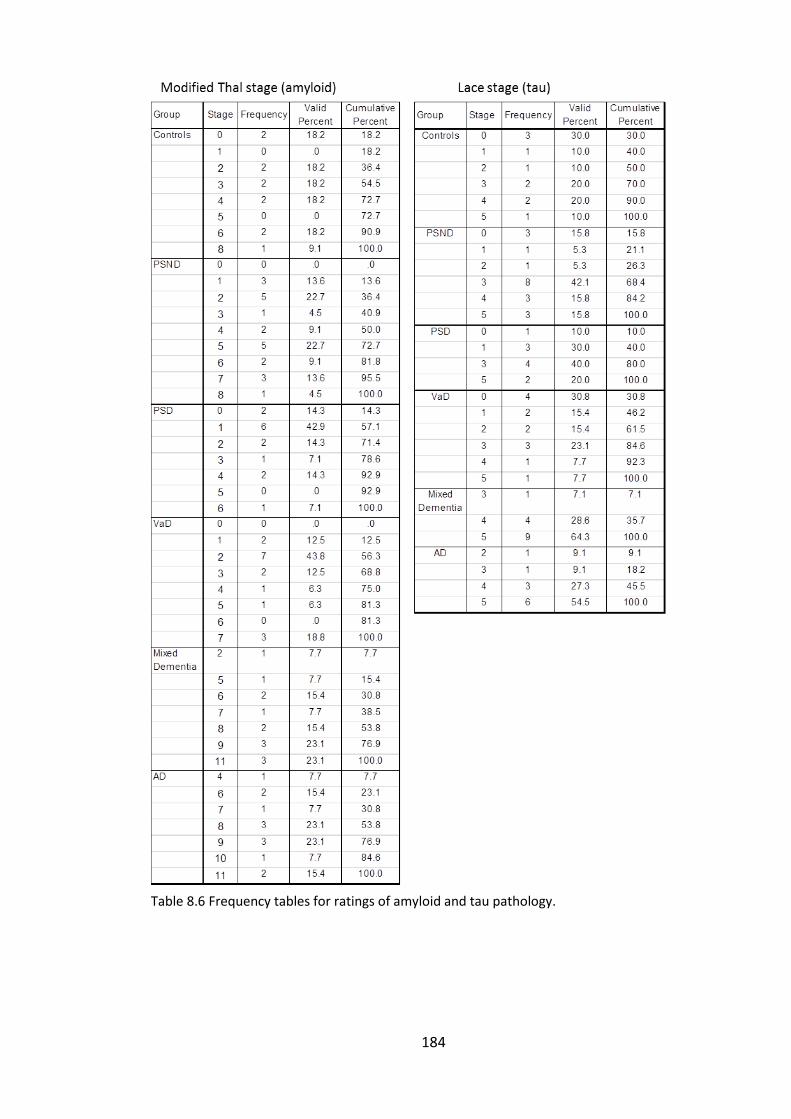
184
Table 8.6 Frequency tables for ratings of amyloid and tau pathology.
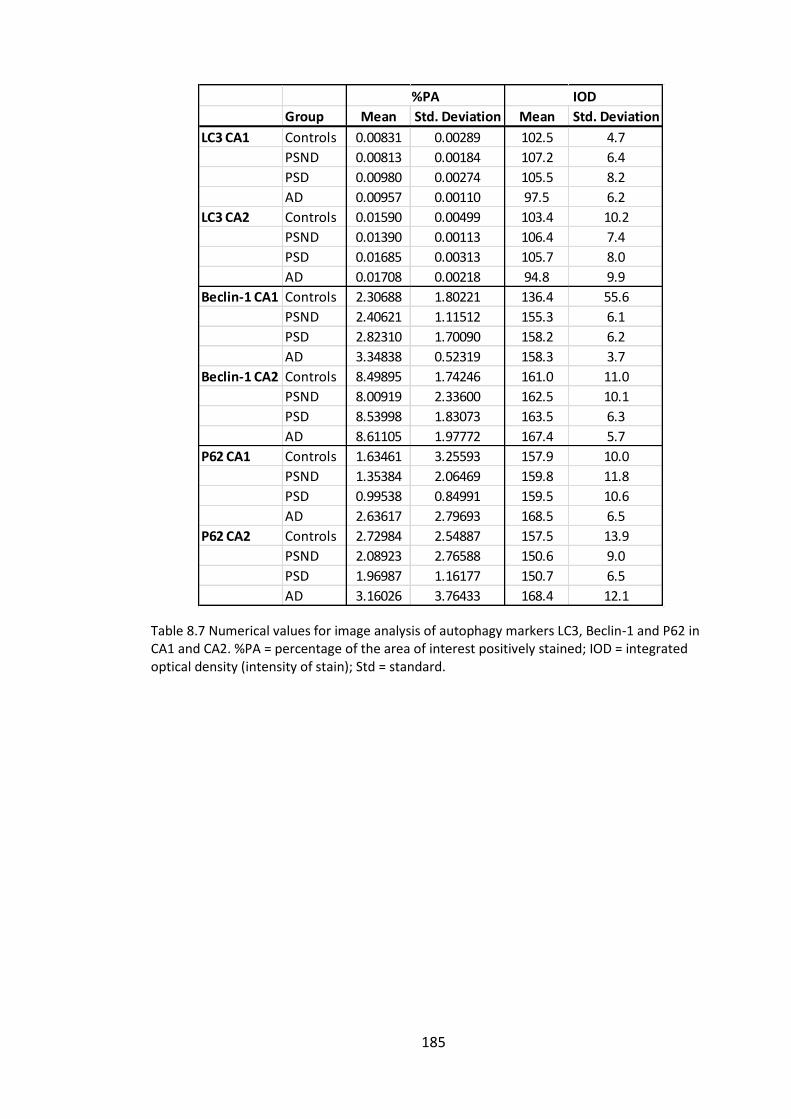
185
Table 8.7 Numerical values for image analysis of autophagy markers LC3, Beclin-1 and P62 in CA1 and CA2. %PA = percentage of the area of interest positively stained; IOD = integrated optical density (intensity of stain); Std = standard.
Group Mean Std. Deviation Mean Std. Deviation
LC3 CA1 Controls 0.00831 0.00289 102.5 4.7
PSND 0.00813 0.00184 107.2 6.4
PSD 0.00980 0.00274 105.5 8.2
AD 0.00957 0.00110 97.5 6.2
LC3 CA2 Controls 0.01590 0.00499 103.4 10.2
PSND 0.01390 0.00113 106.4 7.4
PSD 0.01685 0.00313 105.7 8.0
AD 0.01708 0.00218 94.8 9.9
Beclin-1 CA1 Controls 2.30688 1.80221 136.4 55.6
PSND 2.40621 1.11512 155.3 6.1
PSD 2.82310 1.70090 158.2 6.2
AD 3.34838 0.52319 158.3 3.7
Beclin-1 CA2 Controls 8.49895 1.74246 161.0 11.0
PSND 8.00919 2.33600 162.5 10.1
PSD 8.53998 1.83073 163.5 6.3
AD 8.61105 1.97772 167.4 5.7
P62 CA1 Controls 1.63461 3.25593 157.9 10.0
PSND 1.35384 2.06469 159.8 11.8
PSD 0.99538 0.84991 159.5 10.6
AD 2.63617 2.79693 168.5 6.5
P62 CA2 Controls 2.72984 2.54887 157.5 13.9
PSND 2.08923 2.76588 150.6 9.0
PSD 1.96987 1.16177 150.7 6.5
AD 3.16026 3.76433 168.4 12.1
%PA IOD
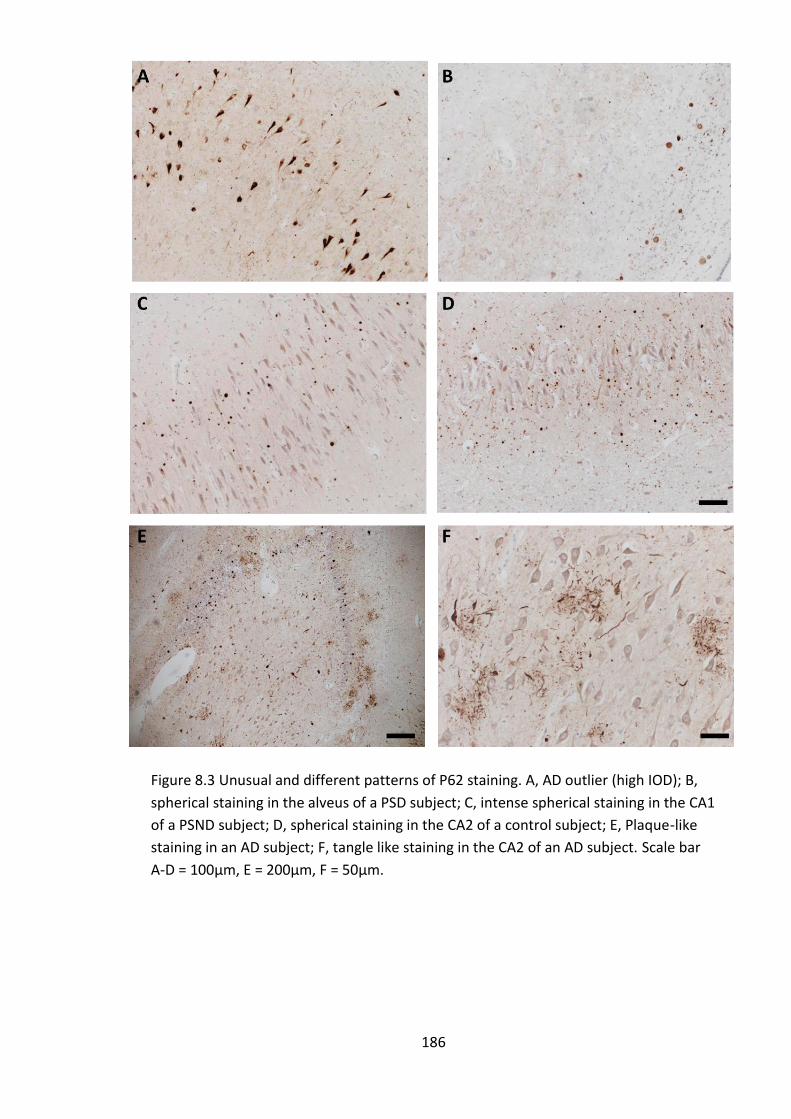
186
Figure 8.3 Unusual and different patterns of P62 staining. A, AD outlier (high IOD); B,
spherical staining in the alveus of a PSD subject; C, intense spherical staining in the CA1
of a PSND subject; D, spherical staining in the CA2 of a control subject; E, Plaque-like
staining in an AD subject; F, tangle like staining in the CA2 of an AD subject. Scale bar
A-D = 100µm, E = 200µm, F = 50µm.

187
Table 8.8 Numerical values for MAP2 dendritic length-density (DLD) and image analysis. %PA = percentage of area of interest positive stained; IOD = integrated optical density; Std. = standard.
Group MeanStd.
Deviation
CA1 DLD Controls .01700 .00289
PSND .01592 .00379
PSD .01569 .00301
VaD .01580 .00443
AD .01510 .00348
MAP2 CA1 %PA Controls .497 .862
PSND 1.202 1.092
PSD .887 1.012
AD .740 .489
MAP2 CA1 IOD Controls 140.3 6.7
PSND 131.2 19.7
PSD 132.1 13.8
AD 140.1 8.6
MAP2 CA2 %PA Controls 2.089 2.420
PSND 3.764 2.205
PSD 4.823 4.226
AD 3.326 4.095
MAP2 CA2 IOD Controls 133.6 11.0
PSND 116.4 16.4
PSD 133.1 15.0
AD 133.5 10.9
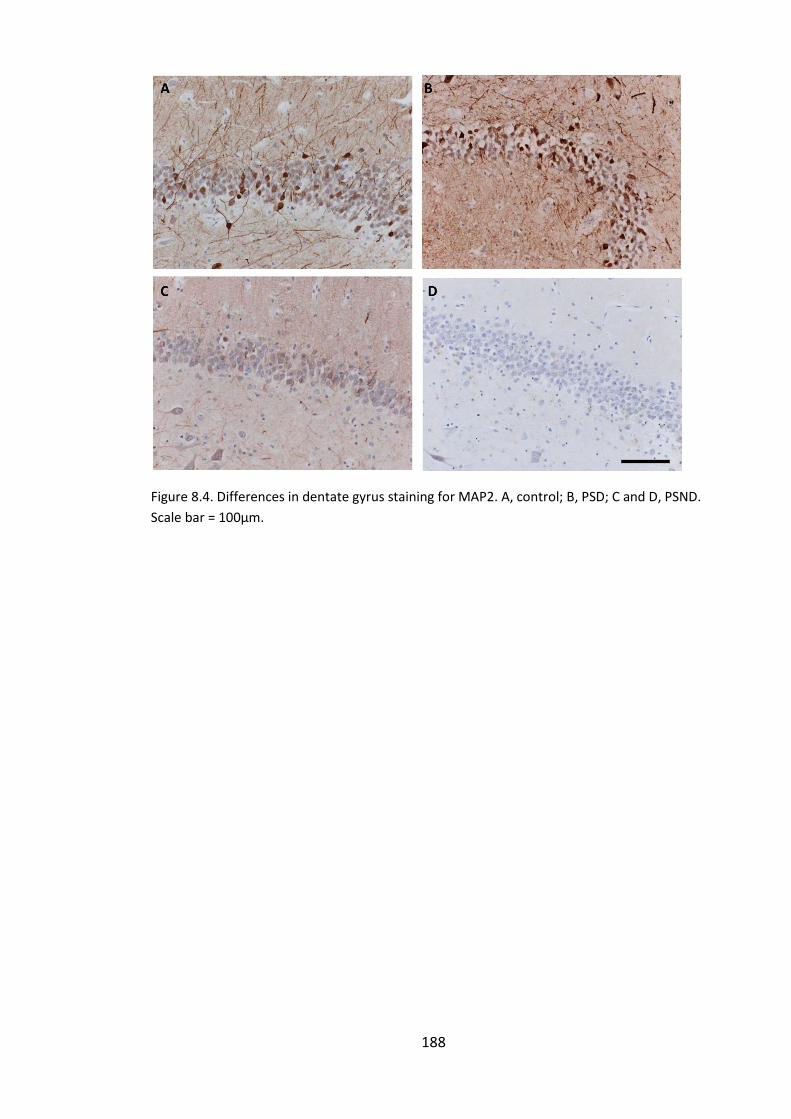
188
Figure 8.4. Differences in dentate gyrus staining for MAP2. A, control; B, PSD; C and D, PSND.
Scale bar = 100µm.
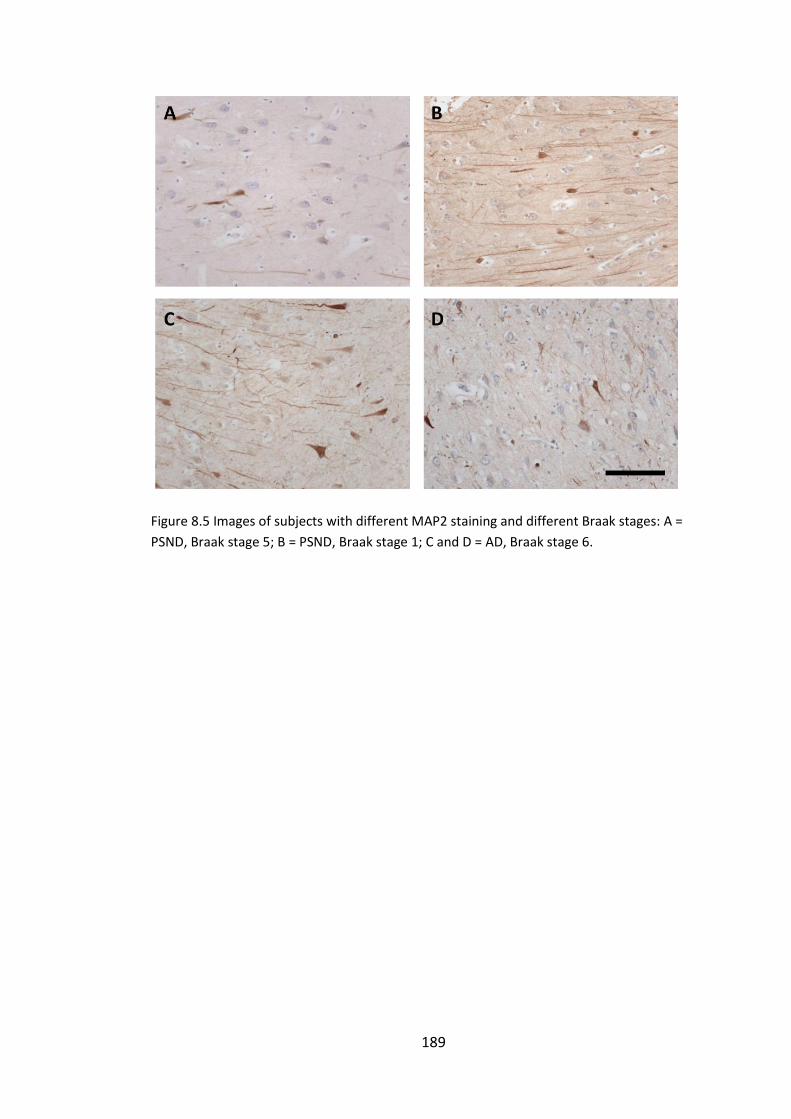
189
Figure 8.5 Images of subjects with different MAP2 staining and different Braak stages: A =
PSND, Braak stage 5; B = PSND, Braak stage 1; C and D = AD, Braak stage 6.
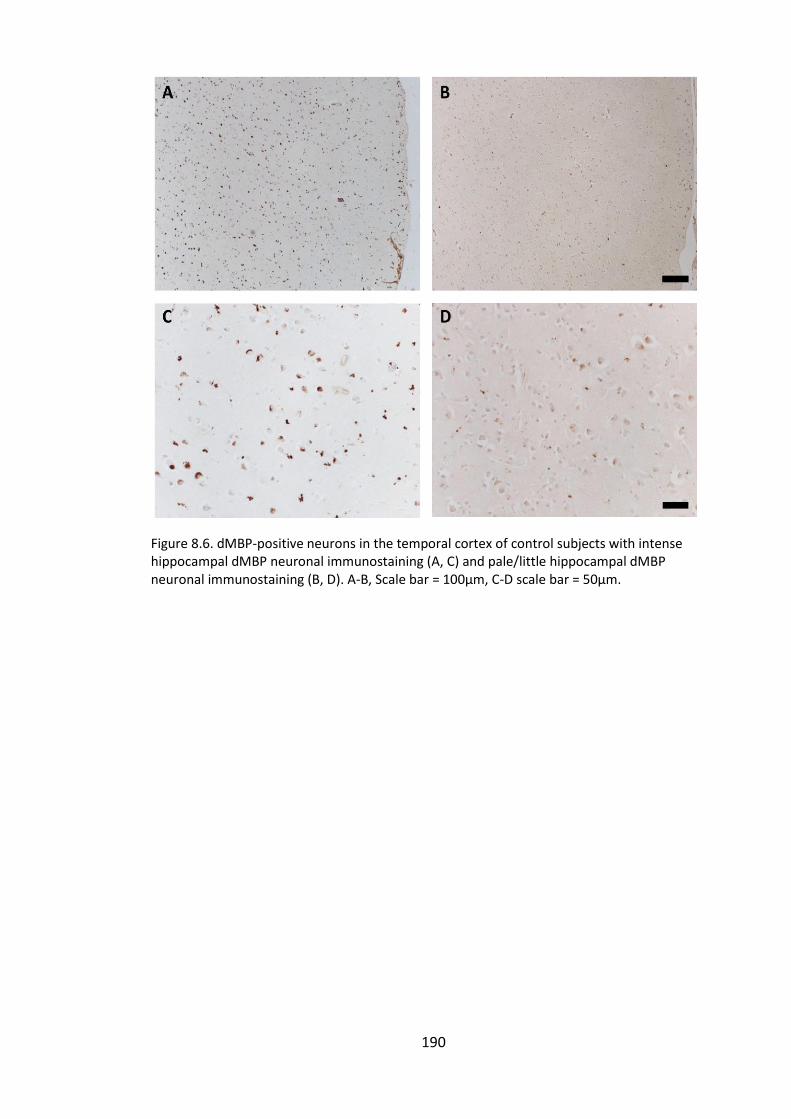
190
Figure 8.6. dMBP-positive neurons in the temporal cortex of control subjects with intense hippocampal dMBP neuronal immunostaining (A, C) and pale/little hippocampal dMBP neuronal immunostaining (B, D). A-B, Scale bar = 100µm, C-D scale bar = 50µm.
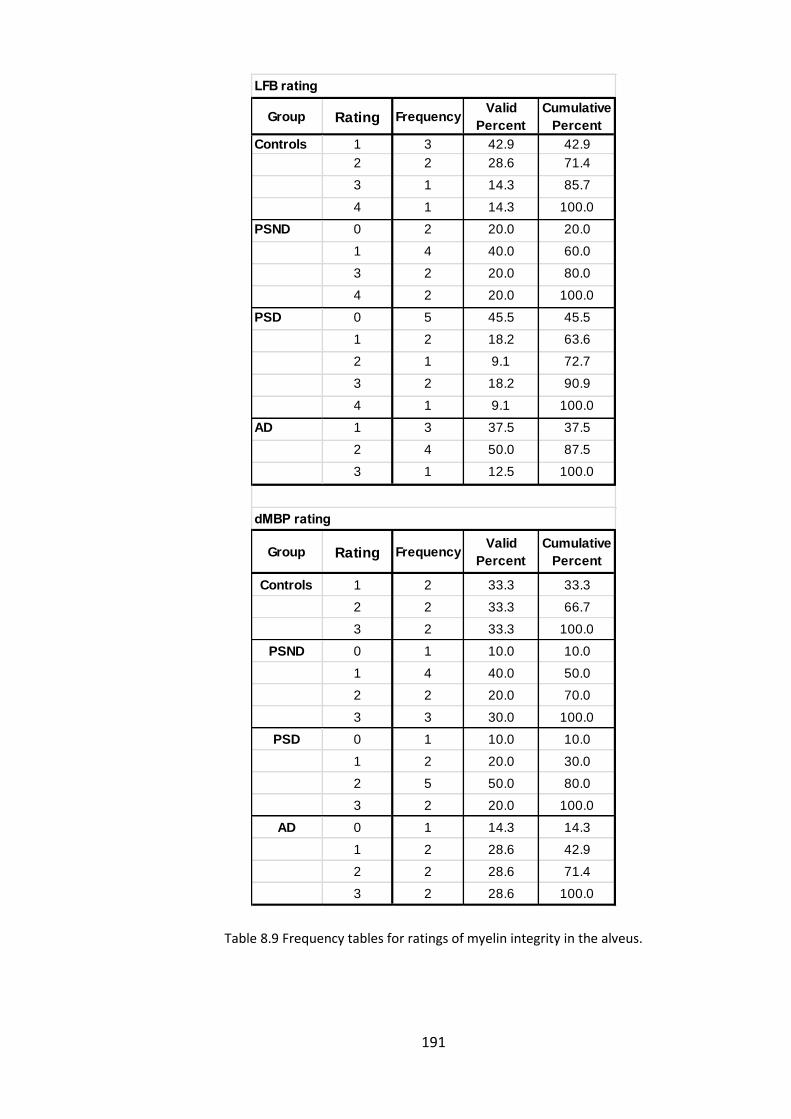
191
Group Rating FrequencyValid
Percent
Cumulative
Percent
Controls 1 3 42.9 42.9
2 2 28.6 71.4
3 1 14.3 85.7
4 1 14.3 100.0
PSND 0 2 20.0 20.0
1 4 40.0 60.0
3 2 20.0 80.0
4 2 20.0 100.0
PSD 0 5 45.5 45.5
1 2 18.2 63.6
2 1 9.1 72.7
3 2 18.2 90.9
4 1 9.1 100.0
AD 1 3 37.5 37.5
2 4 50.0 87.5
3 1 12.5 100.0
Group Rating FrequencyValid
Percent
Cumulative
Percent
Controls 1 2 33.3 33.3
2 2 33.3 66.7
3 2 33.3 100.0
PSND 0 1 10.0 10.0
1 4 40.0 50.0
2 2 20.0 70.0
3 3 30.0 100.0
PSD 0 1 10.0 10.0
1 2 20.0 30.0
2 5 50.0 80.0
3 2 20.0 100.0
AD 0 1 14.3 14.3
1 2 28.6 42.9
2 2 28.6 71.4
3 2 28.6 100.0
LFB rating
dMBP rating
Table 8.9 Frequency tables for ratings of myelin integrity in the alveus.
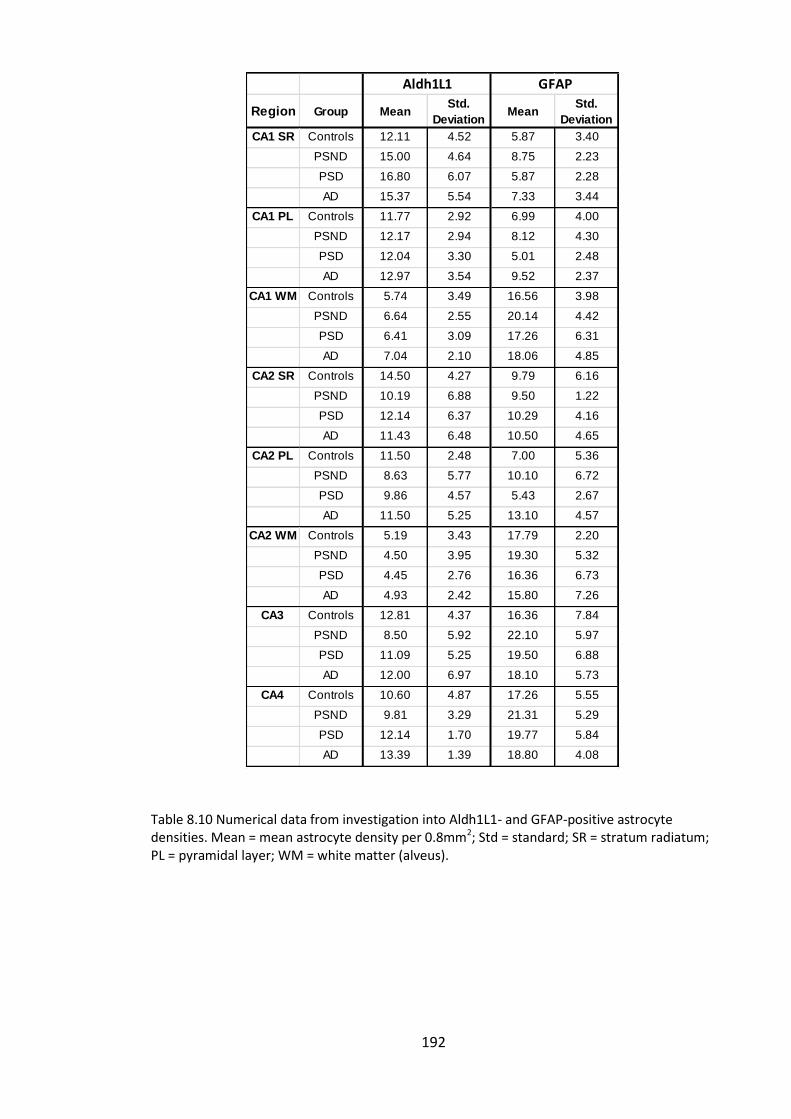
192
Table 8.10 Numerical data from investigation into Aldh1L1- and GFAP-positive astrocyte densities. Mean = mean astrocyte density per 0.8mm2; Std = standard; SR = stratum radiatum; PL = pyramidal layer; WM = white matter (alveus).
Region Group MeanStd.
DeviationMean
Std.
Deviation
CA1 SR Controls 12.11 4.52 5.87 3.40
PSND 15.00 4.64 8.75 2.23
PSD 16.80 6.07 5.87 2.28
AD 15.37 5.54 7.33 3.44
CA1 PL Controls 11.77 2.92 6.99 4.00
PSND 12.17 2.94 8.12 4.30
PSD 12.04 3.30 5.01 2.48
AD 12.97 3.54 9.52 2.37
CA1 WM Controls 5.74 3.49 16.56 3.98
PSND 6.64 2.55 20.14 4.42
PSD 6.41 3.09 17.26 6.31
AD 7.04 2.10 18.06 4.85
CA2 SR Controls 14.50 4.27 9.79 6.16
PSND 10.19 6.88 9.50 1.22
PSD 12.14 6.37 10.29 4.16
AD 11.43 6.48 10.50 4.65
CA2 PL Controls 11.50 2.48 7.00 5.36
PSND 8.63 5.77 10.10 6.72
PSD 9.86 4.57 5.43 2.67
AD 11.50 5.25 13.10 4.57
CA2 WM Controls 5.19 3.43 17.79 2.20
PSND 4.50 3.95 19.30 5.32
PSD 4.45 2.76 16.36 6.73
AD 4.93 2.42 15.80 7.26
CA3 Controls 12.81 4.37 16.36 7.84
PSND 8.50 5.92 22.10 5.97
PSD 11.09 5.25 19.50 6.88
AD 12.00 6.97 18.10 5.73
CA4 Controls 10.60 4.87 17.26 5.55
PSND 9.81 3.29 21.31 5.29
PSD 12.14 1.70 19.77 5.84
AD 13.39 1.39 18.80 4.08
Aldh1L1 GFAP
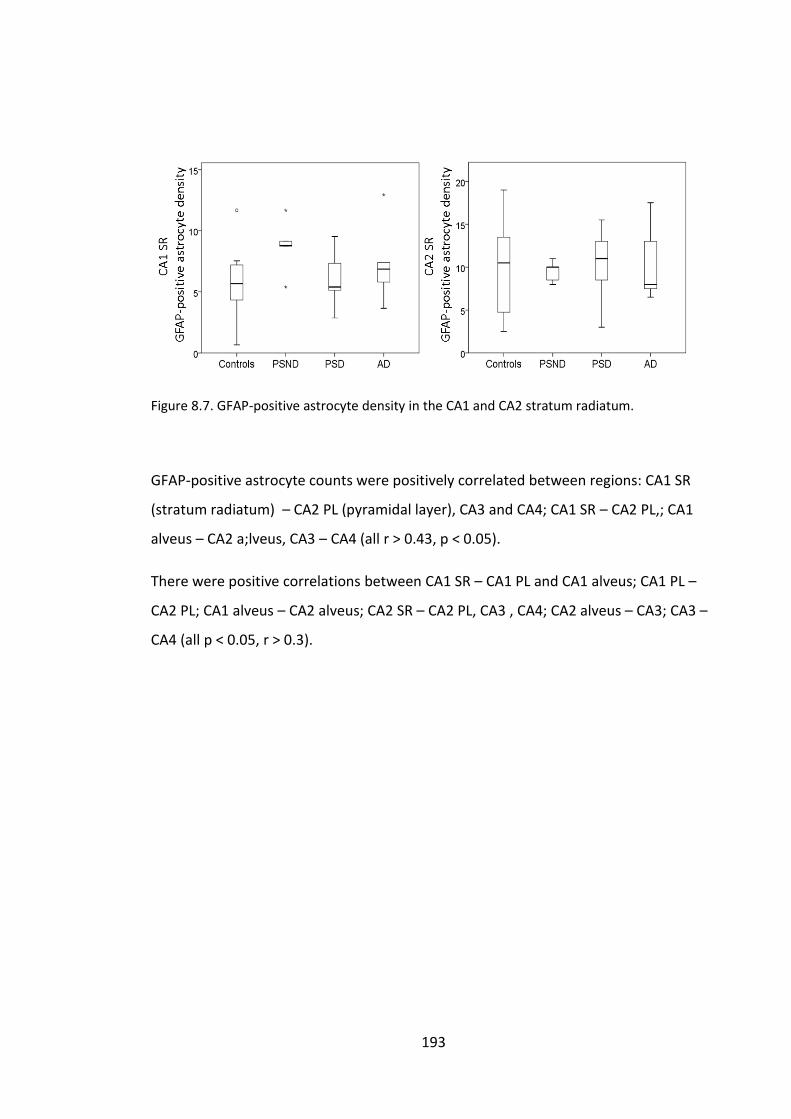
193
Figure 8.7. GFAP-positive astrocyte density in the CA1 and CA2 stratum radiatum.
GFAP-positive astrocyte counts were positively correlated between regions: CA1 SR
(stratum radiatum) – CA2 PL (pyramidal layer), CA3 and CA4; CA1 SR – CA2 PL,; CA1
alveus – CA2 a;lveus, CA3 – CA4 (all r > 0.43, p < 0.05).
There were positive correlations between CA1 SR – CA1 PL and CA1 alveus; CA1 PL –
CA2 PL; CA1 alveus – CA2 alveus; CA2 SR – CA2 PL, CA3 , CA4; CA2 alveus – CA3; CA3 –
CA4 (all p < 0.05, r > 0.3).
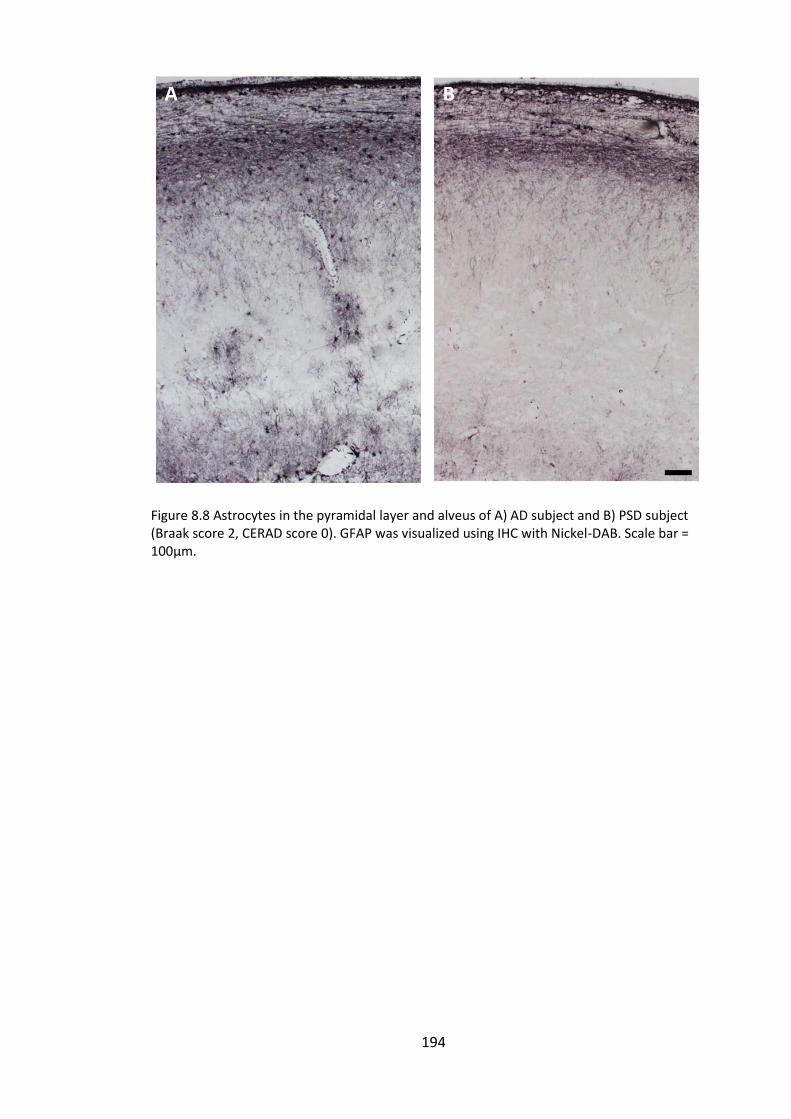
194
Figure 8.8 Astrocytes in the pyramidal layer and alveus of A) AD subject and B) PSD subject (Braak score 2, CERAD score 0). GFAP was visualized using IHC with Nickel-DAB. Scale bar = 100µm.
195
References
Aine, C.J., Sanfratello, L., Adair, J.C., Knoefel, J.E., Qualls, C., Lundy, S.L., Caprihan, A., Stone, D. and Stephen, J.M. (2014) 'Characterization of a normal control group: Are they healthy?', NeuroImage, 84(0), pp. 796-809.
Akiyama, H., Barger, S., Barnum, S., Bradt, B., Bauer, J., Cole, G.M., Cooper, N.R., Eikelenboom, P., Emmerling, M., Fiebich, B.L., Finch, C.E., Frautschy, S., Griffin, W.S.T., Hampel, H., Hull, M., Landreth, G., Lue, L.F., Mrak, R., Mackenzie, I.R., McGeer, P.L., O’Banion, M.K., Pachter, J., Pasinetti, G., Plata–Salaman, C., Rogers, J., Rydel, R., Shen, Y., Streit, W., Strohmeyer, R., Tooyoma, I., Van Muiswinkel, F.L., Veerhuis, R., Walker, D., Webster, S., Wegrzyniak, B., Wenk, G. and Wyss–Coray, T. (2000) 'Inflammation and Alzheimer’s disease', Neurobiology of Aging, 21(3), pp. 383-421.
Akulinin, V.A. and Dahlstrom, A. (2003) 'Quantitative Analysis of MAP2 Immunoreactivity in Human Neocortex of Three Patients Surviving After Brain Ischemia', Neurochemical Research, 28(2), pp. 373-378.
Alberdi, E., Sánchez-Gómez, M.V. and Matute, C. (2005) 'Calcium and glial cell death', Cell Calcium, 38(3–4), pp. 417-425.
Allan, L.M., Rowan, E.N., Firbank, M.J., Thomas, A.J., Parry, S.W., Polvikoski, T.M., O'Brien, J.T. and Kalaria, R.N. (2011) 'Long term incidence of dementia, predictors of mortality and pathological diagnosis in older stroke survivors', Brain, 134(12), pp. 3716-3727.
Alonso, A., Grundke-Iqbal, I. and Iqbal, K. (1996) 'Alzheimer's disease hyperphosphorylated tau sequesters normal tau into tangles of filaments and disassembles microtubules', Nature Medicine, 2, pp. 783-787.
Altieri, M., Di Piero, V., Pasquini, M., Gasparini, M., Vanacore, N., Vicenzini, E. and Lenzi, G.L. (2004) 'Delayed poststroke dementia: A 4-year follow-up study', Neurology, 62(12), pp. 2193-2197.
Amaral, D.G., Scharfman, H.E. and Lavenex, P. (2007) 'The dentate gyrus: fundamental neuroanatomical organization (dentate gyrus for dummies)', in Helen, E.S. (ed.) Progress in Brain Research. Elsevier, pp. 3-790.
Americal Psychiatric Association: Diagnostic and Statistical Manual of Mental Disorders, Fourth Edition (2000). 4th Edition edn. Washington, DC.: Americal Psychiatric Association.
Ankarcrona, M., Dypbukt, J.M., Bonfoco, E., Zhivotovsky, B., Orrenius, S., Lipton, S.A. and Nicotera, P. (1995) 'Glutamate-induced neuronal death: A succession of necrosis or apoptosis depending on mitochondrial function', Neuron, 15(4), pp. 961-973.
Apaydin, H., Ahlskog, J., Parisi, J.E., Boeve, B.F. and Dickson, D.W. (2002) 'Parkinson disease neuropathology: Later-developing dementia and loss of the levodopa response', Archives of Neurology, 59(1), pp. 102-112.
Apostolova, L.G., Green, A.E., Babakchanian, S., Hwang, K.S., Chou, Y.-Y., Toga, A.W. and Thompson, P.M. (2011) 'Hippocampal Atrophy and Ventricular Enlargement in Normal Aging, Mild Cognitive Impairment (MCI), andAlzheimer Disease', Alzheimer Disease and Associated Disorders, Publish Ahead of Print, p. 10.1097/WAD.0b013e3182163b62.
Apostolova, L.G., Mosconi, L., Thompson, P.M., Green, A.E., Hwang, K.S., Ramirez, A., Mistur, R., Tsui, W.H. and de Leon, M.J. (2010) 'Subregional hippocampal atrophy predicts Alzheimer's dementia in the cognitively normal', Neurobiology of Aging, 31(7), pp. 1077-1088.
Arendt, T. (2009) 'Synaptic degeneration in Alzheimer’s disease', Acta Neuropathologica, 118(1), pp. 167-179.
Attems, J. and Jellinger, K.A. (2012) Old Age Psychiatry. Oxford University Pres. Baddeley, A. (2001) 'Is stereology unbiased?', Trends in Neurosciences, 24(7), pp. 375-376. Bailey, E.L., Smith, C., Sudlow, C.L.M. and Wardlaw, J.M. (2012) 'Pathology of Lacunar Ischemic
Stroke in Humans—A Systematic Review', Brain Pathology, 22(5), pp. 583-591.
196
Ballard, C., Rowan, E., Stephens, S., Kalaria, R. and Kenny, R.A. (2003a) 'Prospective Follow-Up Study Between 3 and 15 Months After Stroke: Improvements and Decline in Cognitive Function Among Dementia-Free Stroke Survivors >75 Years of Age', Stroke, 34(10), pp. 2440-2444.
Ballard, C.G., Stephens, S., Kenny, R.A., Kalaria, R.N., Tovee, M. and O’Brien, J. (2003b) 'Profile of Neuropsychological Deficits in Older Stroke Survivors without Dementia', Dementia and Geriatric Cognitive Disorders, 16, pp. 52-56.
Ballatore, C., Lee, V.M.Y. and Trojanowski, J.Q. (2007) 'Tau-mediated neurodegeneration in Alzheimer's disease and related disorders', Nat Rev Neurosci, 8(9), pp. 663-672.
Banasiak, K.J., Xia, Y. and Haddad, G.G. (2000) 'Mechanisms underlying hypoxia-induced neuronal apoptosis', Progress in Neurobiology, 62(3), pp. 215-249.
Baneux, P.J., Garner, D., McIntyre, H.B. and Holshuh, H.J. (1986) 'Euthanasia of rabbits by intravenous administration of ketamine.', Journal of the American Veterinary Medical Association, 189(9), pp. 1038-9.
Barba, R., Martinez-Espinosa, S., Rodriguez-Garcia, E., Pondal, M., Vivancos, J. and Del Ser, T. (2000) 'Poststroke Dementia : Clinical Features and Risk Factors', Stroke, 31(7), pp. 1494-1501.
Barber, R., Ballard, C., McKeith, I.G., Gholkar, A. and O’Brien, J.T. (2000) 'MRI volumetric study of dementia with Lewy bodies: A comparison with AD and vascular dementia', Neurology, 54(6), pp. 1304-1309.
Barber, R., Gholkar, A., Scheltens, P., Ballard, C., McKeith, I.G. and O'Brien, J.T. (1999) 'Medial temporal lobe atrophy on MRI in dementia with Lewy bodies', Neurology, 52(6), pp. 1153-.
Barres, B.A. (2008) 'The Mystery and Magic of Glia: A Perspective on Their Roles in Health and Disease', Neuron, 60(3), pp. 430-440.
Barreto, G.E., Sun, X., Xu, L. and Giffard, R.G. (2011) 'Astrocyte Proliferation Following Stroke in the Mouse Depends on Distance from the Infarct', PLoS ONE, 6(11), p. e27881.
Barulli, D. and Stern, Y. (2013) 'Efficiency, capacity, compensation, maintenance, plasticity: emerging concepts in cognitive reserve', Trends in Cognitive Sciences, 17(10), pp. 502-509.
Bastos-Leite, A.J., van der Flier, W.M., van Straaten, E.C.W., Staekenborg, S.S., Scheltens, P. and Barkhof, F. (2007) 'The Contribution of Medial Temporal Lobe Atrophy and Vascular Pathology to Cognitive Impairment in Vascular Dementia', Stroke, 38(12), pp. 3182-3185.
Beauquis, J., Pavía, P., Pomilio, C., Vinuesa, A., Podlutskaya, N., Galvan, V. and Saravia, F. (2013) 'Environmental enrichment prevents astroglial pathological changes in the hippocampus of APP transgenic mice, model of Alzheimer's disease', Experimental Neurology, 239(0), pp. 28-37.
Bell, R. and Zlokovic, B. (2009) 'Neurovascular mechanisms and blood–brain barrier disorder in Alzheimer’s disease', Acta Neuropathologica, 118(1), pp. 103-113.
Bender, R. and Lange, S. (2001) 'Adjusting for multiple testing—when and how?', Journal of Clinical Epidemiology, 54(4), pp. 343-349.
Binder, J.R., Desai, R.H., Graves, W.W. and Conant, L.L. (2009) 'Where Is the Semantic System? A Critical Review and Meta-Analysis of 120 Functional Neuroimaging Studies', Cerebral Cortex, 19(12), pp. 2767-2796.
Bolmont, T., Haiss, F., Eicke, D., Radde, R., Mathis, C.A., Klunk, W.E., Kohsaka, S., Jucker, M. and Calhoun, M.E. (2008) 'Dynamics of the Microglial/Amyloid Interaction Indicate a Role in Plaque Maintenance', The Journal of Neuroscience, 28(16), pp. 4283-4292.
Braak, E. and Braak, H. (1997) 'Alzheimer’s disease: transiently developing dendritic changes in pyramidal cells of sector CA1 of the Ammon’s horn', Acta Neuropathologica, 93(323-325).
Braak, H. and Braak, E. (1991) 'Neuropathological stageing of Alzheimer-related changes', Acta Neuropathologica, 82(4), pp. 239-259.
Braak, H. and Braak, E. (1996) 'Evolution of the neuropathology of Alzheimer's disease.', Acta Neurologica Scandinavica Supplement, 165, pp. 3-12.
197
Briones, T.L., Woods, J., Wadowska, M., Rogozinska, M. and Nguyen, M. (2006) 'Astrocytic changes in the hippocampus and functional recovery after cerebral ischemia are facilitated by rehabilitation training', Behavioural Brain Research, 171(1), pp. 17-25.
Brown, A.M. and Ransom, B.R. (2007) 'Astrocyte glycogen and brain energy metabolism', Glia, 55(12), pp. 1263-1271.
Buell, S.J. (1982) 'Golgi-Cox and rapid golgi methods as applied to autopsied human brain tissue: widely disparate results.', Journal of Neuropathology & Experimental Neurology, 41(5),
pp. 500-507. Burgess, N., Maguire, E.A. and O'Keefe, J. (2002) 'The Human Hippocampus and Spatial and
Episodic Memory', Neuron, 35(4), pp. 625-641. Burke, M.C.J., Nelson, L., Slade, J.Y., Oakley, A.E., Khundakar, A.A. and Kalaria, R.N. (2013)
'Morphometry of the hippocampal microvasculature in post-stroke and age-related dementias', Neuropathology and Applied Neurobiology, pp. n/a-n/a.
Burke, S.N. and Barnes, C.A. (2006) 'Neural plasticity in the ageing brain', Nat Rev Neurosci, 7(1), pp. 30-40.
Burton, E.J., Kenny, R.A., O’Brien, J., Stephens, S., Bradbury, M., Rowan, E., Kalaria, R., Firbank, M., Wesnes, K. and Ballard, C. (2004) 'White Matter Hyperintensities Are Associated With Impairment of Memory, Attention, and Global Cognitive Performance in Older Stroke Patients', Stroke, 35(6), pp. 1270-1275.
Butler, T.R., Self, R.L., Smith, K.J., Sharrett-Field, L.J., Berry, J.N., Littleton, J.M., Pauly, J.R., Mulholland, P.J. and Prendergast, M.A. (2010) 'Selective vulnerability of hippocampal cornu ammonis 1 pyramidal cells to excitotoxic insult is associated with the expression of polyamine-sensitive N-methyl-d-asparate-type glutamate receptors', Neuroscience, 165(2), pp. 525-534.
Cahoy, J.D., Emery, B., Kaushal, A., Foo, L.C., Zamanian, J.L., Christopherson, K.S., Xing, Y., Lubischer, J.L., Krieg, P.A., Krupenko, S.A., Thompson, W.J. and Barres, B.A. (2008) 'A Transcriptome Database for Astrocytes, Neurons, and Oligodendrocytes: A New Resource for Understanding Brain Development and Function', The Journal of Neuroscience, 28(1), pp. 264-278.
Canto, C., Wouterlood, F.G. and Witter, M.P. (2008) 'What Does the Anatomical Organization of the Entorhinal Cortex Tell Us?', Neural Plasticity, 2008, Article ID 381243, p. 18 [Online] DOI: doi:10.1155/2008/381243.
Capizzano, A., Acion, L., Bekinschtein, T., Furman, M., Gomila, H., Martinez, A., Mizrahi, R. and Starkstein, S. (2004) 'White matter hyperintensities are significantly associated with cortical atrophy in Alzheimer's disease', Journal of Neurology Neurosurgery and Psychiatry, 75(6), pp. 822-827.
Carloni, S., Buonocore, G. and Balduini, W. (2008) 'Protective role of autophagy in neonatal hypoxia–ischemia induced brain injury', Neurobiology of Disease, 32(3), pp. 329-339.
Carmeli, C., Donati, A., Antille, V., Viceic, D., Ghika, J., von Gunten, A., Clarke, S., Meuli, R., Frackowiak, R.S. and Knyazeva, M.G. (2013) 'Demyelination in Mild Cognitive Impairment Suggests Progression Path to Alzheimer’s Disease', PLoS ONE, 8(8), p. e72759.
Cenquizca, L.A. and Swanson, L.W. (2007) 'Spatial organization of direct hippocampal field CA1 axonal projections to the rest of the cerebral cortex', Brain Research Reviews, 56(1), pp. 1-26.
Chen, J.J., Rosas, H.D. and Salat, D.H. (2011a) 'Age-associated reductions in cerebral blood flow are independent from regional atrophy', NeuroImage, 55(2), pp. 468-478.
Chen, Q., He, S., Hu, X.-L., Yu, J., Zhou, Y., Zheng, J., Zhang, S., Zhang, C., Duan, W.-H. and Xiong, Z.-Q. (2007) 'Differential Roles of NR2A- and NR2B-Containing NMDA Receptors in Activity-Dependent Brain-Derived Neurotrophic Factor Gene Regulation and Limbic Epileptogenesis', The Journal of Neuroscience, 27(3), pp. 542-552.
Chen, X., Nelson, C.D., Li, X., Winters, C.A., Azzam, R., Sousa, A.A., Leapman, R.D., Gainer, H., Sheng, M. and Reese, T.S. (2011b) 'PSD-95 Is Required to Sustain the Molecular
198
Organization of the Postsynaptic Density', The Journal of Neuroscience, 31(17), pp. 6329-6338.
Cherra III, S.J. and Chu, C.T. (2008) 'Autophagy in neuroprotection and neurodegeneration: A question of balance', Future Neuroloft, 3(3), pp. 309-323.
Christiansen, P., Larsson, H.B.W., Thomsen, C., Weislander, S.B. and Henriksen, O. (1994) 'Age-dependent white matter lesions and brain volume chanegs in healthy volunteers', Acta Radiologica, 35(2), pp. 117-122.
Colombo, J.A., Quinn, B. and Puissant, V. (2002) 'Disruption of astroglial interlaminar processes in Alzheimer’s disease', Brain Research Bulletin, 58(2), pp. 235-242.
Colombo, J.A. and Reisin, H.D. (2004) 'Interlaminar astroglia of the cerebral cortex: a marker of the primate brain', Brain Research, 1006(1), pp. 126-131.
Conde, C. and Cáceres, A. (2009) 'Microtubule assembly, organization and dynamics in axons and dendrites', Nature Reviews Neuroscience, 10(319-332).
Cotter, D., Wilson, S., Roberts, E., Kerwin, R. and Everall, I.P. (2000) 'Increased dendritic MAP2 expression in the hippocampus in schizophrenia', Schizophrenia Research, 41(2), pp. 313-323.
Counts, S.E., Nadeem, M., Lad, S.P., Wuu, J. and Mufson, E.J. (2006) 'Differential expression of synaptic proteins in the frontal and temporal cortex of elderly subjects with mild cognitive impairment.', Journal of Neuropathology & Experimental Neurology, 65, pp. 592-601.
Cuadros, M.A. and Navascués, J. (1998) 'The origin and differentiation of microglial cells during development', Progress in Neurobiology, 56(2), pp. 173-189.
Cumming, T.B. and Brodtmann, A. (2011) 'Can stroke cause neurodegenerative dementia?', International Journal of Stroke, 6(5), pp. 416-424.
Davalos, D., Grutzendler, J., Yang, G., Kim, J.V., Zuo, Y., Jung, S., Littman, D.R., Dustin, M.L. and Gan, W.B. (2005) 'ATP mediates rapid microglial response to local brain injury in vivo', Nature Neuroscience, 8(752-758).
Davis, R. and Huffman, R. (1968) A Stereotaxic Atlas of the Brain of the baboon (Papio). Department of Physiology, Southwest Foundation for Resrach and Education, San Antonio, Texas.
de Koning, I., van Kooten, F., Dippel, D.W.J., van Harskamp, F., Grobbee, D.E., Kluft, C. and Koudstaal, P.J. (1998) 'The CAMCOG: A Useful Screening Instrument for Dementia in Stroke Patients', Stroke, 29(10), pp. 2080-2086.
de la Torre, J.C. (2002) 'Alzheimer Disease as a Vascular Disorder: Nosological Evidence', Stroke, 33(4), pp. 1152-1162.
den Heijer, T., der Lijn, F.v., Vernooij, M.W., de Groot, M., Koudstaal, P.J., der Lugt, A.v., Krestin, G.P., Hofman, A., Niessen, W.J. and Breteler, M.M.B. (2012) 'Structural and diffusion MRI measures of the hippocampus and memory performance', NeuroImage, 63(4), pp. 1782-1789.
Den Heijer, T., Geerlings, M.I., Hoebeek, F.E., Hofman, A., Koudstaal, P.J. and Breteler, M.M.B. (2006) 'Use of hippocampal and amygdalar volumes on magnetic resonance imaging to predict dementia in cognitively intact elderly people', Archives of General Psychiatry, 63(1), pp. 57-62.
Deramecourt, V., Slade, J.Y., Oakley, A.E., Perry, R.H., Ince, P.G., Maurage, C.A. and Kalaria, R.N. (2012) 'Staging and natural history of cerebrovascular pathology in dementia', Neurology, 78(14), pp. 1043-1050.
Desmond, D.W., Erkinjuntti, T., Sano, M., Cummings, J.L., Bowler, J.V., Pasquier, F., Moroney, J.T., Ferris, S., Stern, Y., Sachdev, P.S. and Hachinski, V.C. (1999) 'The cognitive syndrome of vascular dementia: implications for clinical trials.', Alzheimer Disease & Associated Disorders, 13, pp. S21-9.
Desmond, D.W., Moroney, J.T., Paik, M.C., Sano, M., Mohr, J.P., Aboumatar, S., Tseng, C.L., Chan, S., Williams, J.B.W., Remien, R.H., Hauser, W.A. and Stern, Y. (2000) 'Frequency and clinical determinants of dementia after ischemic stroke', Neurology, 54(5), pp. 1124-1131.
199
Dihné, M., Block, F., Korr, H. and Töpper, R. (2001) 'Time course of glial proliferation and glial apoptosis following excitotoxic CNS injury', Brain Research, 902(2), pp. 178-189.
Doetsch, F., Caillé, I., Lim, D.A., García-Verdugo, J.M. and Alvarez-Buylla, A. (1999) 'Subventricular Zone Astrocytes Are Neural Stem Cells in the Adult Mammalian Brain', Cell, 97(6), pp. 703-716.
Duevernoy, H.M. (2005) The Human Hippocampus: Functional Anatomy, Vascularization and Serial Sections with MRI. Third edn. Springer-Verlag Berlin Heidelberg New York.
Eichenbaum, H. (2003) 'The hippocampus, episodic memory, declarative memory, spatial memory…where does it all come together?', International Congress Series, 1250(0), pp. 235-244.
Esiri, M.M., Matthews, F. and Brayne, C. (2001) 'Pathological correlates of late-onset dementia in a multicentre, community-based population in England and Wales', The Lancet, 357(9251), pp. 169-175.
'Factsheet: Rarer Causes of Dementia', (2012), www.alzheimers.org.uk [Online]. Available at: http://www.alzheimers.org.uk/site/scripts/download_info.php?fileID=1767.
Farkas, E. and Luiten, P.G.M. (2001) 'Cerebral microvascular pathology in aging and Alzheimer's disease', Progress in Neurobiology, 64(6), pp. 575-611.
Fellgiebel, A. and Yakushev, I. (2011) 'Diffusion tensor imaging of the hippocampus in MCI and early Alzheimer's disease.', Journal of Alzheimer's Disease, 26, pp. 257-62.
Ferrer, I., Kaste, M. and Kalimo, H. (2008) Greenfield's Neuropathology. Oxford, UK: Oxford University Press.
Fetler, L. and Amigorena, S. (2005) 'Brain Under Surveillance: The Microglia Patrol', Science, 309(5733), pp. 392-393.
Firbank, M.J., Burton, E.J., Barber, R., Stephens, S., Kenny, R.A., Ballard, C., Kalaria, R.N. and O'Brien, J.T. (2007) 'Medial temporal atrophy rather than white matter hyperintensities predict cognitive decline in stroke survivors', Neurobiology of Aging, 28(11), pp. 1664-1669.
Firbank, M.J., He, J., Blamire, A.M., Singh, B., Danson, P., Kalaria, R.N. and O’Brien, R. (2011) 'Cerebral blood flow by arterial spin labeling in poststroke dementia.', Neurology, 76(17), pp. 1478-84.
Fjell, A.M. and Walhovd, K.B. (2010) 'Structural Brain Changes in Aging: Courses, Causes and Cognitive Consequences', Reviews in the Neurosciences, 21(3), pp. 187-222.
Flood, D.G. (1993) 'Critical issues in the analysis of dendritic extent in aging humans, primates, and rodents', Neurobiology of Aging, 14(6), pp. 649-654.
Folstein, M.F., Folstein, S.E. and McHugh, P.R. (1975) '"Mini-mental state" : A practical method for grading the cognitive state of patients for the clinician', Journal of Psychiatric Research, 12(3), pp. 189-198.
Freeman, S., Kandel, R., Crus, L., Rozkalne, A., Newell, K., Frosch, M.P., Hedley-Whyte, E.T., Locascio, J.J., Lispitz, L. and Hyman, B.T. (2008) 'Preservation of Neuronal Number Despite Age-Related Cortical Brain Atrophy In Elderly Subjects Without Alzhiemer Disease', Journal of Neuropathology and Experimental Neurology, 67(12), pp. 1205-1212.
Frisoni, G.B., Fox, N.C., Jack, C.R., Scheltens, P. and Thompson, P.M. (2010) 'The clinical use of structural MRI in Alzheimer disease', Nat Rev Neurol, 6(2), pp. 67-77.
Gallagher, J.J., Zhang, X., Ziomek, G.J., Jacobs, R.E. and Bearer, E.L. (2012) 'Deficits in axonal transport in hippocampal-based circuitry and the visual pathway in APP knock-out animals witnessed by manganese enhanced MRI', NeuroImage, 60(3), pp. 1856-1866.
Gemmell, E., Bosomworth, H., Allan, L., Hall, R., Khundakar, A., Oakley, A.E., Deramecourt, V., Polvikoski, T.M., O'Brien, J.T. and Kalaria, R.N. (2012) 'Hippocampal Neuronal Atrophy and Cognitive Function in Delayed Poststroke and Aging-Related Dementias', Stroke, 43(3), pp. 808-814.
Giannakopoulos, P., Herrmann, F.R.B., T., Bouras, C., Kövari, E., Perl, D.P., Morrison, J.H., Gold, G. and Hof, P.R. (2003) 'Tangle and neuron numbers, but not amyloid load, predict cognitive status in Alzheimer's disease.', Neurology, May 13(60 (9)), pp. 1495-500.
200
Giannakopoulos, P., Hof, P.R., Kövari, E., Vallet, P.G., Herrmann, F.R. and Bouras, C. (1996) 'Distinct patterns of neuronal loss and Alzheimer's disease lesion distribution in elderly individuals older than 90 years', Journal of Neuropathology and Experimental Neurology, 55(12), pp. 1210-1220.
Giaume, C., Kirchoff, F., Matute, C., Reichenbach, A. and Verkhratsky, A. (2007) 'Glia: the fulcrum of brain diseases', Cell Death and Differentiation, 14(1324-1335).
Goedert, M.K., A. Crowther, R. A. (2006) 'Tau protein, the paired helical filament and Alzheimer's disease', Journal of Alzheimer's Disease, 9, pp. 195-207.
Gokhale, A.M. (1990) 'Unbiased estimation of curve length in 3-D using vertical slices', Journal of Microscopy, 159(2), pp. 133-141.
Golgi, C. (1873) 'Sulla struttura della sostanza grigia dell cervello', Gazz. Med. Lombarda, 33, pp. 224-246.
Gómez-Isla, T., Hollister, R., West, H., Mui, S., Growdon, J.H., Petersen, R.C., Parisi, J.E. and Hyman, B.T. (1997) 'Neuronal loss correlates with but exceeds neurofibrillary tangles in Alzheimer's disease', Annals of Neurology, 41(1), pp. 17-24.
Gorelick, P.B. (2004) 'Risk Factors for Vascular Dementia and Alzheimer Disease', Stroke, 35(11_suppl_1), pp. 2620-2622.
Gorelick, P.B. and Nyenhuis, D. (2013) 'Understanding and Treating Vascular Cognitive Impairment.', CONTINUUM: Lifelong Learning in Neurology, 19(2), pp. 425-437.
Gosche, K.M., Mortimer, J.A., Smith, C.D., Markesbery, W.R. and Snowdon, D.A. (2002) 'Hippocampal volume as an index of Alzheimer neuropathology: Findings from the Nun Study', Neurology, 58(10), pp. 1476-1482.
Grinberg, L.T. and Thal, D.R. (2010) 'Vascular Pathology in the aged human brain', Acta Neuropathologica, 119(3), pp. 277-290.
Grolla, A.A., Sim, J.A., Lim, D., Rodriguez, J.J., Genazzani, A.A. and Verkhratsky, A. (2013) 'Amyloid-β and Alzheimer's disease type pathology differentially affects the calcium signalling toolkit in astrocytes from different brain regions', Cell Death and Disease, 4(5), p. e623.
Grundman, M., Jack, C., Petersen, R., Kim, H., Taylor, C., Datvian, M., Weiner, M., DeCarli, C., DeKosky, S., Dyck, C., Darvesh, S., Yaffe, K., Kaye, J., Ferris, S., Thomas, R. and Thal, L. (2003) 'Hippocampal volume is associated with memory but not nonmemory cognitive performance in patients with mild cognitive impairment', Journal of Molecular Neuroscience, 20(3), pp. 241-248.
Grysiewicz, R. and Gorelick, P. (2012) 'Key Neuroanatomical Structures for Post-Stroke Cognitive Impairment', Current Neurology and Neuroscience Reports, 12(6), pp. 703-708.
Gundersen, H.J.G., Bagger, P., Bendtsen, T.F., Evans, S.M., Krobo, L., Marcussen, N., Moller, A., Nielsen, K., Nyengaard, J.R. and Pakkenberg, B. (1988) 'The New Stereological tools: disector, fractionator, nucleator and point sampled intercepts and their use in pathological research and diagnosis', Acta pathologica, microbiologica et imminologica Scandinavica, 96(10), pp. 857-81.
Gundersen, H.J.G. and Jensen, E.B. (1987) 'The Efficiency of Systematic Sampling in Stereology and its Prediction', Journal of Microscopy, 147, pp. 229-63.
Gunning-Dixon, F.M., Brickman, A.M., Cheng, J.C. and Alexopoulos, G.S. (2009) 'Aging of cerebral white matter: a review of MRI findings', International Journal of Geriatric Psychiatry, 24(2), pp. 109-117.
Gylys, K.H., Fein, J.A., Yang, F., Wiley, D.J., Miller, C.A. and Cole, G.M. (2004) 'Synaptic Changes in Alzheimer's Disease: Increased Amyloid-β and Gliosis in Surviving Terminals Is Accompanied by Decreased PSD-95 Fluorescence', The American Journal of Pathology, 165(5), pp. 1809-1817.
Halassa, M.M., Fellin, T., Takano, H., Dong, J. and Haydon, P.G. (2007) 'Synaptic Islands Defined by the Territory of a
Single Astrocyte', The Journal of Neuroscience, 27(24), pp. 6473-6477.
201
Haley, G., Kohama, S., Urbanski, H. and Raber, J. (2010) 'Age-related decreases in SYN levels associated with increases in MAP-2, apoE, and GFAP levels in the rhesus macaque prefrontal cortex and hippocampus', AGE, 32(3), pp. 283-296.
Hanks, S.D. and Flood, D.G. (1991) 'Region-specific stability of dendritic extent in normal human aging and regression in Alzheimer's disease. I. CA1 of hippocampus', Brain Research, 540(1-2), pp. 63-82.
Hara, A. and Mori, H. (2000) 'Novel Apoptotic Evidence for Delayed Neuronal Death in the Hippocampal CA1 Pyramidal Cells After Transient Ischemia', Stroke, 31(1), pp. 231-239.
Hardy, J. and Selkoe, D.J. (2002) 'The Amyloid Hypothesis of Alzheimer's Disease: Progress and Problems on the Road to Therapeutics', Science, 297(5580), pp. 353-356.
Hardy, J.A. and Higgins, G.A. (1992) 'Alzheimer's disease: the amyloid cascade hypothesis.', Science, 256, pp. 184-5.
Harris, K.M. (1999) 'Structure, development, and plasticity of dendritic spines', Current Opinion in Neurobiology, 9(3), pp. 343-348.
Harris, K.M., Jensen, F.E. and Tsao, B. (1992) 'Three-dimensional structure of dendritic spines and synapses in rat hippocampus (CA1) at postnatal day 15 and adult ages: implications for the maturation of synaptic physiology and long-term potentiation [published erratum appears in J Neurosci 1992 Aug;12(8):following table of contents]', The Journal of Neuroscience, 12(7), pp. 2685-2705.
Harrison, P.J. and Eastwood, S.L. (2001) 'Neuropathological studies of synaptic connectivity in the hippocampal formation in schizophrenia', Hippocampus, 11(5), pp. 508-519.
Hawkins, B.T. and Davis, T.P. (2005) 'The Blood-Brain Barrier/Neurovascular Unit in Health and Disease', Pharmacological Reviews, 57(2), pp. 173-185.
Holtmaat, A., Wilbrecht, L., Knott, G.W., Welker, E. and Svoboda, K. (2006) 'Experience-dependent and cell-type-specific spine growth in the neocortex', Nature, 441, pp. 979-983.
Hoskison, M.M. and Shuttleworth, C.W. (2006) 'Microtubule disruption, not calpain-dependent loss of MAP2, contributes to enduring NMDA-induced dendritic dysfunction in acute hippocampal slices', Experimental Neurology, 202(2), pp. 302-312.
Huang, K.-L., Lin, K.-J., Ho, M.-Y., Chang, Y.-J., Chang, C.-H., Wey, S.-P., Hsieh, C.-J., Yen, T.-C., Hsiao, I.-T. and Lee, T.-H. (2012) 'Amyloid deposition after cerebral hypoperfusion: Evidenced on [18F]AV-45 positron emission tomography', Journal of the Neurological Sciences, 319(1–2), pp. 124-129.
Hyman, B.T., Van Hoesen, G.W., Damasio, A.R. and Barnes, C.L. (1984) 'Alzheimer's Disease: Cell-Specific Pathology Isolates the Hippocampal Formation', Science, 225(225), pp. 1168-70.
Hynd, M.R., Scott, H.L. and Dodd, P.R. (2004) 'Glutamate-mediated excitotoxicity and neurodegeneration in Alzheimer’s disease', Neurochemistry International, 45(5), pp. 583-595.
Ihara, M., Polvikoski, T.M., Hall, R., Slade, J., Perry, R.H., Oakley, A.E., Englund, E., O'Brien, J.T., Ince, P.G. and Kalaria, R.N. (2010) 'Quantification of myelin loss in frontal lobe white matter in vascular dementia, Alzheimer’s disease, and dementia with Lewy bodies', Acta Neuropathologica, 119(5), pp. 579-589.
Imura, T., Nakano, I., Kornblum, H.I. and Sofroniew, M.V. (2006) 'Phenotypic and functional heterogeneity of GFAP-expressing cells in vitro: Differential expression of LeX/CD15 by GFAP-expressing multipotent neural stem cells and non-neurogenic astrocytes', Glia, 53(3), pp. 277-293.
Ince, P.G. (2001) 'Pathological correlates of late-onset dementia in a multicentre, community-based population in England and Wales', The Lancet, 357(9251), pp. 169-175.
Iqbal, K. and Grundke-Iqbal, I. (1997) 'Mechanism of Alzheimer neurofibrillary degeneration and the formation of tangles', Molecular Psychiatry, 2(3), pp. 178-180.
202
Ishimaru, H., Casamenti, F., Uéda, K., Maruyama, Y. and Pepeu, G. (2001) 'Changes in presynaptic proteins, SNAP-25 and synaptophysin, in the hippocampal CA1 area in ischemic gerbils', Brain Research, 903(1–2), pp. 94-101.
Ishizuka, N., Weber, J. and Amaral, D.G. (1990) 'Organization of intrahippocampal projections originating from CA3 pyramidal cells in the rat.', Joural of Computational Neurology, 295, pp. 580-623.
Ivanov, A., Esclapez, M., Pellegrino, C., Shirao, T. and Ferhat, L. (2009) 'Drebrin A regulates dendritic spine plasticity and synaptic function in mature cultured hippocampal neurons', Journal of Cell Science, 122(4), pp. 524-534.
Izumi, Y., Haida, M., Hata, T., Isozumi, K., Kurita, D. and Shinohara, Y. (2002) 'Distribution of brain oedema in the contralateral hemisphere after cerebral infarction: repeated MRI measurement in the rat', Journal of Clinical Neuroscience, 9(3), pp. 289-293.
Jellinger, K. (2007) 'The enigma of vascular cognitive disorder and vascular dementia', Acta Neuropathologica, 113(4), pp. 349-388.
Jia, H., Zhang, X., Zhang, B., Liu, Y. and Li, J. (2012) 'Dendritic morphology of neurons in medial prefrontal cortex and hippocampus in 2VO rats', Neurological Sciences, 33(5), pp. 1063-1070.
Jiang, J., Parameshwaran, K., Seibenhener, M.L., Kang, M.-G., Suppiramaniam, V., Huganir, R.L., Diaz-Meco, M.T. and Wooten, M.W. (2009) 'AMPA receptor trafficking and synaptic plasticity require SQSTM1/p62', Hippocampus, 19(4), pp. 392-406.
Johansen, T. and Lamark, T. (2011) 'Selective autophagy mediated by autophagic adapter proteins', Autophagy, 7(3), pp. 279-296.
Jokinen, H., Kalska, H., Ylikoski, R., Hietanen, M., Mäntylä, R., Pohjasvaara, T., Kaste, M. and Erkinjuntti, T. (2004) 'Medial temporal lobe atrophy and memory deficits in elderly stroke patients', European Journal of Neurology, 11(12), pp. 825-832.
Jones, M.W. and McHugh, T.J. (2011) 'Updating hippocampal representations: CA2 joins the circuit', Trends in Neurosciences, 34(10), pp. 526-535.
Jones, R.N., Manly, J., Glymour, M.M., Rentz, D.M., Jefferson, A.L. and Stern, Y. (2011) 'Conceptual and Measurement Challenges in Research on Cognitive Reserve', Journal of the International Neuropsychological Society, 17(04), pp. 593-601.
Kalaria, R.N. (2000) 'The role of cerebral ischemia in Alzheimer's disease', Neurobiology of Aging, 21(2), pp. 321-330.
Kalaria, R.N. (2010) 'Vascular basis for brain degeneration: faltering controls and risk factors for dementia', Nutrition Reviews, 68, pp. S74-S87.
Kalaria, R.N. (2012) 'Cerebrovascular Disease and Mechanisms of Cognitive Impairment: Evidence From Clinicopathological Studies in Humans', Stroke, 43(9), pp. 2526-2534.
Kalaria, R.N. and Ballard, C. (1999) 'Overlap between pathology of Alzheimer disease and vascular dementia', Alzheimer Disease and Associated Disorders, 13, pp. S115-23.
Kalaria, R.N. and Ihara, M. (2013) 'Dementia: Vascular and neurodegenerative pathways—will they meet?', Nature Reviews Neurology, 9, pp. 487-488.
Kalaria, R.N., Kenny, R.A., Ballard, C.G., Perry, R., Ince, P. and Polvikoski, T. (2004) 'Towards defining the neuropathological substrates of vascular dementia', Journal of the Neurological Sciences, 226(1–2), pp. 75-80.
Kamenetz, F., Tomita, T., Hsieh, H., Seabrook, G., Borchelt, D., Iwatsubo, T., Sisodia, S. and Malinow, R. (2003) 'APP Processing and Synaptic Function', Neuron, 37(6), pp. 925-937.
Karran, E., Mercken, M. and De Strooper, B. (2011) 'The amyloid cascade hypothesis for Alzheimer's disease: an appraisal for the development of therapeutics', Nature Reviews Drug Discovery, 10, pp. 698-712.
Kasai, H., Fukuda, M., Watanabe, S., Hayashi-Takagi, A. and Noguchi, J. (2010) 'Structural dynamics of dendritic spines in memory and cognition', Trends in Neurosciences, 33(3), pp. 121-129.

203
Kerchner, G.A., Deutsch, G.K., Zeineh, M., Dougherty, R.F., Saranathan, M. and Rutt, B.K. (2012) 'Hippocampal CA1 apical neuropil atrophy and memory performance in Alzheimer's disease', NeuroImage, 63(1), pp. 194-202.
Khundakar, A., Morris, C., Oakley, A., McMeekin, W. and Thomas, A.J. (2009) 'Morphometric analysis of neuronal and glial cell pathology in the dorsolateral prefrontal cortex in late-life depression', The British Journal of Psychiatry, 195(2), pp. 163-169.
Kirino, T. (1982) 'Delayed neuronal death in the gerbil hippocampus following ischemia', Brain Research, 239(1), pp. 57-69.
Kirvell, S.L., Elliott, M.S., Kalaria, R.N., Hortobágyi, T., Ballard, C.G. and Francis, P.T. (2010) 'Vesicular glutamate transporter and cognition in stroke: A case-control autopsy study', Neurology, 75(20), pp. 1803-1809.
Kitagawa, K., Matsumoto, M., Niinobe, M., Mikoshiba, K., Hata, R., Ueda, H., Handa, N., Fukunaga, R., Isaka, Y., Kimura, K. and Kamada, T. (1989) 'Microtubule-associated protein 2 as a sensitive marker for cerebral ischemic damage--Immunohistochemical investigation of dendritic damage', Neuroscience, 31(2), pp. 401-411.
Kitano, H., Nishimura, H., Tachibana, H., Yoshikawa, H. and Matsuyama, T. (2004) 'ORP150 ameliorates ischemia/reperfusion injury from middle cerebral artery occlusion in mouse brain', Brain Research, 1015(1–2), pp. 122-128.
Kling, M.A., Trojanowski, J.Q., Wolk, D.A., Lee, V.M.Y. and Arnold, S.E. (2013) 'Vascular disease and dementias: Paradigm shifts to drive research in new directions', Alzheimer's & Dementia, 9(1), pp. 76-92.
Koehler, R.C., Roman, R.J. and Harder, D.R. (2009) 'Astrocytes and the regulation of cerebral blood flow', Trends in Neurosciences, 32(3), pp. 160-169. Kokmen, E., Whisnant, J.P., O'Fallon, W.M., Chu, C.P. and Beard, C.M. (1996) 'Dementia after
ischemic stroke: A population-based study in Rochester, Minnesota (1960-1984)', Neurology, 46(1), pp. 154-159.
Korbo, L., Amrein, I., Lipp, H.P., Wolfer, D., Regeur, L., Oster, S. and Pakkenberg, B. (2004) 'No evidence for loss of hippocampal neurons in non-Alzheimer dementia patients', Acta Neurologica Scandinavica, 109(2), pp. 132-139.
Kragh, C.L., Ubhi, K., Wyss-Corey, T. and Masliah, E. (2012) 'Autophagy in Dementias', Brain Pathology, 22(1), pp. 99-109.
Kril, J., Patel, S., Harding, A. and Halliday, G. (2002a) 'Neuron loss from the hippocampus of Alzheimer's disease exceeds extracellular neurofibrillary tangle formation', Acta Neuropathologica, 103(4), pp. 370-376.
Kril, J.J., Hodges, J. and Halliday, G. (2004) 'Relationship between hippocampal volume and CA1 neuron loss in brains of humans with and without Alzheimer's disease', Neuroscience Letters, 361(1-3), pp. 9-12.
Kril, J.J., Patel, S., Harding, A.J. and Halliday, G.M. (2002b) 'Patients with vascular dementia due to microvascular pathology have significant hippocampal neuronal loss', Journal of Neurology, Neurosurgery & Psychiatry, 72(6), pp. 747-751.
Kühn, J., Meissner, C. and Oehmichen, M. (2005) 'Microtubule-associated protein 2 (MAP2)—a promising approach to diagnosis of forensic types of hypoxia-ischemia', Acta Neuropathologica, 110(6), pp. 579-586.
Kuusisto, E., Salminen, A. and Alafuzoff, I. (2002) 'Early accumulation of p62 in neurofibrillary tangles in Alzheimer's disease: possible role in tangle formation', Neuropathology and Applied Neurobiology, 28(3), pp. 228-237.
Lace, G., Savva, G.M., Forster, G., de Silva, R., Brayne, C., Matthews, F.E., Barclay, J.J., Dakin, L., Ince, P.G. and Wharton, S.B. (2009) 'Hippocampal tau pathology is related to neuroanatomical connections: an ageing population-based study', Brain.
Laroche, S., Davis, S. and Jay, T.M. (2000) 'Plasticity at hippocampal to prefrontal cortex synapses: Dual roles in working memory and consolidation', Hippocampus, 10(4), pp. 438-446.

204
Larsen, G.A., Skjellegrind, H.K., Berg-Johnsen, J., Moe, M.C. and Vinje, M.L. (2006) 'Depolarization of mitochondria in isolated CA1 neurons during hypoxia, glucose deprivation and glutamate excitotoxicity', Brain Research, 1077(1), pp. 153-160.
Leal, S.L. and Yassa, M.A. (2013) 'Perturbations of neural circuitry in aging, mild cognitive impairment, and Alzheimer's disease', Ageing Research Reviews, 12(3), pp. 823-831.
Lee, A., Lingwood, B.E., Bjorkman, S.T., Miller, S.M., Poronnik, P., Barnett, N.L., Colditz, P. and Pow, D.V. (2010) 'Rapid loss of glutamine synthetase from astrocytes in response to hypoxia: Implications for excitotoxicity', Journal of Chemical Neuroanatomy, 39(3), pp. 211-220.
Lee, P.H., Bang, O.Y., Hwang, E.M., Lee, J.S., Joo, U.S., Mook-Jung, I. and Huh, K. (2005) 'Circulating beta amyloid protein is elevated in patients with acute ischemic stroke', Journal of Neural Transmission, 112(10), pp. 1371-1379.
Lees, G.J. (1993) 'The possible contribution of microglia and macrophages to delayed neuronal death after ischemia', Journal of the Neurological Sciences, 114(2), pp. 119-122.
Leuba, G., Walzer, C., Vernay, A., Carnal, B., Kraftsik, R., Piotton, F., Marin, P., Bouras, C. and Savioz, A. (2008) 'Postsynaptic density protein PSD-95 expression in Alzheimer's disease and okadaic acid induced neuritic retraction', Neurobiology of Disease, 30(3), pp. 408-419.
Levine, B. and Kroemer, G. (2008) 'Autophagy in the Pathogenesis of Disease', Cell, 132(1), pp. 27-42.
Levine, N.D., Rademacher, D.J., Collier, T.J., O’Malley, J.A., Kells, A.P., San Sebastian, W., Bankiewicz, K.S. and Steece-Collier, K. (2013) 'Advances in thin tissue Golgi-Cox impregnation: Fast, reliable methods for multi-assay analyses in rodent and non-human primate brain', Journal of Neuroscience Methods, 213(2), pp. 214-227.
Leys, D., Erkinjuntti, T., Desmond, D.W., Schmidt, R., Englund, E., Pasquier, F., Parnetti, L., Ghika, J., Kalaria, R.N., Chabriat, H., Scheltens, P. and Bogousslavsky, J. (1999) 'Vascular dementia: the role of cerebral infarcts', Alzheimer's Disease and Associated Disorders, 13, pp. S38-48.
Leys, D., Hénon, H., Mackowiak-Cordoliani, M.-A. and Pasquier, F. (2005) 'Poststroke dementia', The Lancet Neurology, 4(11), pp. 752-759.
Li, W., Huang, R., Shetty, R.A., Thangthaeng, N., Liu, R., Chen, Z., Sumien, N., Rutledge, M., Dillon, G.H., Yuan, F., Forster, M.J., Simpkins, J.W. and Yang, S.-H. (2013) 'Transient focal cerebral ischemia induces long-term cognitive function deficit in an experimental ischemic stroke model', Neurobiology of Disease, 59(0), pp. 18-25.
Liu, C., Gao, Y., Barrett, J. and Hu, B. (2010) 'Autophagy and protein aggregation after brain ischemia', Journal of Neurochemistry, 115(1), pp. 68-78.
Liu, H.-x., Zhang, J.-j., Zheng, P. and Zhang, Y. (2005) 'Altered expression of MAP-2, GAP-43, and synaptophysin in the hippocampus of rats with chronic cerebral hypoperfusion correlates with cognitive impairment', Molecular Brain Research, 139(1), pp. 169-177.
Love, S., Siew, L.K., Dawbarn, D., Wilcock, G.K., Ben-Shlomo, Y. and Allen, S.J. (2006) 'Premorbid effects of APOE on synaptic proteins in human temporal neocortex', Neurobiology of Aging, 27(6), pp. 797-803.
Lowry, O.H., Rosebrough, N.J., Farr, A.L. and Randall, R.J. (1951) 'Protein Measurement with the Phenol Reagent', Journal of Biological Chemistry, 193, pp. 265-275.
Luengo-Fernandez, R., Leal, J. and Gray, A. (2010) 'Dementia 2010: The economic burden of dementia and associated research funding in the United Kingdom'.
Lum, J.J., Bauer, D.E., Kong, M., Harris, M.H., Li, C., Lindsten, T. and Thompson, C.B. (2005) 'Growth Factor Regulation of Autophagy and Cell Survival in the Absence of Apoptosis', Cell, 120(2), pp. 237-248.
Ma, J.F., Huang, Y., Chen, S.D. and Halliday, G. (2010) 'Immunohistochemical evidence for macroautophagy in neurones and endothelial cells in Alzheimer's disease', Neuropathology and Applied Neurobiology, 36(4), pp. 312-319.
Maiuri, M.C., Criollo, A. and Kroemer, G. (2010) 'Crosstalk between apoptosis and autophagy within the Beclin 1 interactome', The EMBO journal, 29, pp. 515-516.

205
Mandai, K., Matsumoto, M., Kitagawa, K., Matsushita, K., Ohtsuki, T., Mabuchi, T., Colman, D.R., Kamada, T. and Yanagihara, T. (1997) 'Ischemic damage and subsequent proliferation of oligodendrocytes in focal cerebral ischemia', Neuroscience, 77(3), pp. 849-861.
Mariño, G., Madeo, F. and Kroemer, G. (2011) 'Autophagy for tissue homeostasis and neuroprotection', Current Opinion in Cell Biology, 23(2), pp. 198-206.
Marner, L., Nyengaard, J.R., Tang, Y. and Pakkenberg, B. (2003) 'Marked loss of myelinated nerve fibers in the human brain with age', The Journal of Comparative Neurology, 462(2), pp. 144-152.
Martanez-Tellez, R., Gamez-Villalobos, M.D.J. and Flores, G. (2005) 'Alteration in dendritic morphology of cortical neurons in rats with diabetes mellitus induced by streptozotocin', Brain Research, 1048(1-2), pp. 108-115.
Marti, E., Ferrer, I., Ballabriga, J. and Blasi, J. (1998) 'Increase in SNAP-25 immunoreactivity in the mossy fibers following transient forebrain ischemia in the gerbil', Acta
Neuropathologica, 95, pp. 254-260. Mayeux, R., Denaro, J., Hemenegildo, N. and et al. (1992) 'A population-based investigation of
Parkinson's disease with and without dementia: Relationship to age and gender', Archives of Neurology, 49(5), pp. 492-497.
Mayhew, T.M. and Gundersen, H.J.G. (1996) ''If you assume, you can make an ass out of u and me': a decade of the disector for stereological counting of particles in 3D space.', Journal of Anatomy, 188, pp. 1-15.
Melkas, S., Oksala, N.K.J., Jokinen, H., Pohjasvaara, T., Vataja, R., Oksala, A., Kaste, M., Karhunen, P.J. and Erkinjuntti, T. (2009) 'Poststroke dementia predicts poor survival in long-term follow-up: influence of prestroke cognitive decline and previous stroke', Journal of Neurology, Neurosurgery & Psychiatry, 80(8), pp. 865-870.
Melvin, N.R. and Sutherland, R.J. (2010) 'Quantitative Caveats of Standard Immunohistochemical Procedures: Implications for Optical Disector–based Designs', Journal of Histochemistry & Cytochemistry, 58(7), pp. 577-584.
Meraz Rios, M.A., Toral-Rios, D., Franco-Bocanegra, D., Villeda-HernÁNdez, J. and Campos-PeÑA, V. (2013) 'Inflammatory Process in Alzheimer’s Disease', Frontiers in Integrative Neuroscience, 7.
Milosevic, N.T. and Ristanovic, D. (2007) 'The Sholl analysis of neuronal cell images: Semi-log or log-log method?', Journal of Theoretical Biology, 245(1), pp. 130-140.
Mirra, S.S., Heyman, A., McKeel, D., Sumi, S.M., Crain, B.J., Brownlee, L.M., Vogel, F.S., Hughes, J.P., Van Belle, G. and Berg, L. (1991) 'The Consortium to Establish a Registry for Alzheimer's Disease (CERAD). Part II. Standardization of the neuropathologic assessment of Alzheimer's disease', Neurology, 41(4), pp. 479-486.
Mishizen-Eberz, A.J., Rissman, R.A., Carter, T.L., Ikonomovic, M.D., Wolfe, B.B. and Armstrong, D.M. (2004) 'Biochemical and molecular studies of NMDA receptor subunits NR1/2A/2B in hippocampal subregions throughout progression of Alzheimer's disease pathology', Neurobiology of Disease, 15(1), pp. 80-92.
Mitchell, T.W., Nissanov, J., Han, L.-Y., Mufson, E.J., Schneider, J.A., Cochran, E.J., Bennett, D.A., Lee, V.M.Y., Trojanowski, J.Q. and Arnold, S.E. (2000) 'Novel Method to Quantify Neuropil Threads in Brains from Elders With or Without Cognitive Impairment', Journal of Histochemistry & Cytochemistry, 48(12), pp. 1627-1637.
Mizushima, N. (2004) 'Methods for monitoring autophagy', The International Journal of Biochemistry & Cell Biology, 36(12), pp. 2491-2502.
Montine, T., Phelps, C., Beach, T., Bigio, E., Cairns, N., Dickson, D., Duyckaerts, C., Frosch, M., Masliah, E., Mirra, S., Nelson, P., Schneider, J., Thal, D., Trojanowski, J., Vinters, H. and Hyman, B. (2012) 'National Institute on Aging–Alzheimer’s Association guidelines for the neuropathologic assessment of Alzheimer’s disease: a practical approach', Acta Neuropathologica, 123(1), pp. 1-11.
Moorhouse, P. and Rockwood, K. (2008) 'Vascular cognitive impairment: current concepts and clinical developments', The Lancet Neurology, 7(3), pp. 246-255.
206
Morrison, J.H., Hof, P.R. and Efrain, C. (2002) 'Chapter 37. Selective vulnerability of corticocortical and hippocampal circuits in aging and Alzheimer's disease', in Progress in Brain Research. Elsevier, pp. 467-486.
Mouton, P.R. (2002) Principles and practices of unbiased stereology. Baltimore: The John Hopkins University Press.
Mueller, S.G., Chao, L.L., Berman, B. and Weiner, M.W. (2010) 'Evidence for functional specialization of hippocampal subfields detected by MR subfield volumetry on high resolution images at 4 T', NeuroImage, 56(3), pp. 851-857.
Mueller, S.G., Stables, L., Du, A.T., Schuff, N., Truran, D., Cashdollar, N. and Weiner, M.W. (2007) 'Measurement of hippocampal subfields and age-related changes with high resolution MRI at 4 T', Neurobiology of Aging, 28(5), pp. 719-726.
Mukaetova-Ladinska, E.B., Arnold, H., Jaros, E., Perry, R. and Perry, E. (2004) 'Depletion of MAP2 expression and laminar cytoarchitectonic changes in dorsolateral prefrontal cortex in adult autistic individuals', Neuropathology and Applied Neurobiology, 30(6), pp. 615-623.
Mukaetova-Ladinska, E.B., Garcia-Siera, F., Hurt, J., Gertz, H.J., Xuereb, J.H., Hills, R., Brayne, C., Huppert, F.A., Paykel, E.S., McGee, M., Jakes, R., G. Honer, W., Harrington, C.R. and Wischik, C.M. (2000) 'Staging of Cytoskeletal and β-Amyloid Changes in Human Isocortex Reveals Biphasic Synaptic Protein Response during Progression of Alzheimer’s Disease', The American Journal of Pathology, 157(2), pp. 623-636.
Nagele, R.G., Wegiel, J., Venkataraman, V., Imaki, H., Wang, K.-C. and Wegiel, J. (2004) 'Contribution of glial cells to the development of amyloid plaques in Alzheimer’s disease', Neurobiology of Aging, 25(5), pp. 663-674.
Nagy, Z., Esiri, M.M., Jobst, K.A., Morris, J.H., F. King, E.M., McDonald, B., Joachim, C., Litchfield, S., Barnetson, L.I.N. and Smith, A.D. (1997) 'The Effects of Additional Pathology on the Cognitive Deficit in Alzheimer Disease', Journal of Neuropathology & Experimental Neurology, 56(2), pp. 165-170.
Nave, K. (2010) 'Myelination and support of axonal integrity by glia', Nature, 468, pp. 244-252. Nedergaard, M. and Dirnagl, U. (2005) 'Role of glial cells in cerebral ischemia', Glia, 50(4), pp.
281-286. Neher, J.J., Neniskyte, U. and Brown, G.C. (2012) 'Primary phagocytosis of neurons by inflamed
microglia: potential roles in neurodegeneration', Frontiers in Pharmacology, 3. Nimmerjahn, A., Kirchhoff, F. and Helmchen, F. (2005) 'Resting Microglial Cells Are Highly
Dynamic Surveillants of Brain Parenchyma in Vivo', Science, 308(5726), pp. 1314-1318. Nixon, R.A. (2006) 'Autophagy in neurodegenerative disease: friend, foe or turncoat?', Trends
in Neurosciences, 29(9), pp. 528-535. Nixon, R.A. (2007) 'Autophagy, amyloidogenesis and Alzheimer disease', Journal of Cell Science,
120(23), pp. 4081-4091. Nixon, R.A. and Yang, D.-S. (2011) 'Autophagy failure in Alzheimer's disease—locating the
primary defect', Neurobiology of Disease, 43(1), pp. 38-45. O'Brien, J.T., Erkinjuntti, T., Reisberg, B., Roman, G., Sawada, T., Pantoni, L., Bowler, J.V.,
Ballard, C., DeCarli, C., Gorelick, P.B., Rockwood, K., Burns, A., Gauthier, S. and DeKosky, S.T. (2003) 'Vascular cognitive impairment', The Lancet Neurology, 2(2), pp. 89-98.
O'Sullivan, M., Ngo, E., Viswanathan, A., Jouvent, E., Gschwendtner, A., Saemann, P.G., Duering, M., Pachai, C., Bousser, M.-G., Chabriat, H. and Dichgans, M. (2009) 'Hippocampal volume is an independent predictor of cognitive performance in CADASIL', Neurobiology of Aging, 30(6), pp. 890-897.
Oberheim, N., Goldman, S. and Nedergaard, M. (2012) 'Heterogeneity of Astrocytic Form and Function', in Milner, R. (ed.) Astrocytes. Humana Press, pp. 23-45.
Oberheim, N.A., Takano, T., Han, X., He, W., Lin, J.H.C., Wang, F., Xu, Q., Wyatt, J.D., Pilcher, W., Ojemann, J.G., Ransom, B.R., Goldman, S.A. and Nedergaard, M. (2009) 'Uniquely Hominid Features of Adult Human Astrocytes', The Journal of Neuroscience, 29(10), pp. 3276-3287.
207
Oberheim, N.A., Wang, X., Goldman, S. and Nedergaard, M. (2006) 'Astrocytic complexity distinguishes the human brain', Trends in Neurosciences, 29(10), pp. 547-553.
Ogata, K. and Kosaka, T. (2002) 'Structural and quantitative analysis of astrocytes in the mouse hippocampus', Neuroscience, 113(1), pp. 221-233.
Okada, T., Kataoka, Y., Takeshita, A., Mino, M., Morioka, H., Kusakabe, K.T. and Kondo, T. (2013) 'Effects of Transient Forebrain Ischemia on the Hippocampus of the Mongolian Gerbil (Meriones unguiculatus): An Immunohistochemical Study', Zoological Science, 30(6), pp. 484-489.
Olney, J.W. and Sharpe, L.G. (1969) 'Brain Lesions in an Infant Rhesus Monkey Treated with Monosodium Glutamate', Science, 166(3903), pp. 386-388.
Olson, E.E. and McKeon, R.J. (2004) 'Characterization of cellular and neurological damage following unilateral hypoxia/ischemia', Journal of the Neurological Sciences, 227(1), pp. 7-19.
Ong, W., Tanaka, K., Dawe, G.S., Ittner, L.M. and Farooqui, A.A. (2013) 'Slow Excitotoxicity in Alzheimer’s Disease', Journal of Alzheimer's Disease, 35, pp. 643-668.
Pakkenberg, B., Pelvig, D., Marner, L., Bundgaard, M.J., Gundersen, H.J.G., Nyengaard, J.R. and Regeur, L. (2003) 'Aging and the human neocortex', Experimental Gerontology, 38(1-2), pp. 95-99.
Pantoni, L. (2010) 'Cerebral small vessel disease: from pathogenesis and clinical characteristics to therapeutic challenges', The Lancet Neurology, 9(7), pp. 689-701.
Pantoni, L., Garcia, J.H. and Gutierrez, J.A. (1996) 'Cerebral White Matter Is Highly Vulnerable to Ischemia', Stroke, 27(9), pp. 1641-1647.
Parihar, M.S. and Brewer, G.J. (2010) 'Amyloid-β as a Modulator of Synaptic Plasticity', Journal of Alzheimer's Disease, 22(3), pp. 741-763.
Parkhurst, Christopher N., Yang, G., Ninan, I., Savas, Jeffrey N., Yates, John R., Lafaille, Juan J., Hempstead, Barbara L., Littman, Dan R. and Gan, W.-B. (2013) 'Microglia Promote Learning-Dependent Synapse Formation through Brain-Derived Neurotrophic Factor', Cell, 155(7), pp. 1596-1609.
Pasquier, F., Leys, D. and Scheltens, P. (1998) 'The influence of coincidental vascular pathology on symptomatology and course of Alzheimer's disease.', Journal of neural transmission, 54, pp. 117-27.
Pastori, C., Regondi, M.C., Librizzi, L. and de Curtis, M. (2007) 'Early excitability changes in a novel acute model of transient focal ischemia and reperfusion in the in vitro isolated guinea pig brain', Experimental Neurology, 204(1), pp. 95-105.
Peich, M.-C., Husain, M. and Bays, P.M. (2013) 'Age-related decline of precision and binding in visual working memory', Psychology and Aging, 28(3), pp. 729-743.
Pendelbury, S.T. (2009) 'Stroke-related dementia: Rates, risk factors and implications for future research', Maturitas, 64(3), pp. 165-171.
Pendlebury, S.T. and Rothwell, P.M. (2009) 'Prevalence, incidence, and factors associated with pre-stroke and post-stroke dementia: a systematic review and meta-analysis', The Lancet Neurology, 8, pp. 1006-18.
Penzes, P., Cahill, M.E., Jones, K.A., VanLeeuwen, J.-E. and Woolfrey, K.M. (2011) 'Dendritic spine pathology in neuropsychiatric disorders', Nat Neurosci, 14(3), pp. 285-293.
Perea, G., Navarrete, M. and Araque, A. (2009) 'Tripartite synapses: astrocytes process and control synaptic information', Trends in Neurosciences, 32(8), pp. 421-431.
Perego, C., Fumagalli, S. and De Simoni, M.-G. (2011) 'Temporal pattern of expression and colocalization of microglia/macrophage phenotype markers following brain ischemic injury in mice', Journal of Neuroinflammation, 8(1), p. 174.
Perry, R.H., Irving, D., Blessed, G., Fairbairn, A. and Perry, E.K. (1990) 'Senile dementia of Lewy body type: A clinically and neuropathologically distinct form of Lewy body dementia in the elderly', Journal of the Neurological Sciences, 95(2), pp. 119-139.
Perry, R.H. and Oakley, A.E. (1993) 'Newcastle Brain Map'. London: Wolfe.
208
Petito, C.K., Olarte, J.P., Roberts, B., Nowak, T.S. and Pulsinelli, W.A. (1998) 'Selective glial vulnerability following transient global ischemia in rat brain', Journal of Neuropathology and Experimental Neurology, 57(3), pp. 231-238.
Pickford, F., Masliah, E., Britschgi, M., Lucin, K., Narasimhan, R., Jaeger, P.A., Small, S.A., Spencer, B., Rockenstein, E., Levine, B. and Wyss-Corey, T. (2008) 'The autophagy-related protein beclin 1 shows reduced expression in early Alzheimer disease and regulates amyloid β accumulation in mice', Journal of Clinical Investigation, 118(6), pp. 2190-2199.
Porter, J.T. and McCarthy, K.D. (1996) 'Hippocampal Astrocytes In Situ Respond to Glutamate Released from Synaptic Terminals', The Journal of Neuroscience, 16(16), pp. 5073-5081.
Powell, E.M. and Geller, H.M. (1999) 'Dissection of astrocyte-mediated cues in neuronal guidance and process extension', Glia, 26(1), pp. 73-83.
Prince, M., Bryce, R., Albanese, E., Wimo, A., Ribeiro, W. and Ferri, C.P. (2013) 'The global prevalence of dementia: A systematic review and metaanalysis', Alzheimer's & Dementia, 9(1), pp. 63-75.e2.
Raivich, G. and Banati, R. (2004) 'Brain microglia and blood-derived macrophages: molecular profiles and functional roles in multiple sclerosis and animal models of autoimmune demyelinating disease', Brain Research Reviews, 46(3), pp. 261-281.
Rajkowska, G., Miguel-Hidalgo, J.J., Dubey, P., Stockmeier, C.A. and Krishnan, K.R.R. (2005) 'Prominent Reduction in Pyramidal Neurons Density in the Orbitofrontal Cortex of Elderly Depressed Patients', Biological Psychiatry, 58(4), pp. 297-306.
Rajkowska, G., Selemon, L.D. and Goldman-Rakic, P.S. (1998) 'Neuronal and glial somal size in the prefrontal cortex: A postmortem morphometric study of schizophrenia and huntington disease', Archives of General Psychiatry, 55(3), pp. 215-224.
Ramesh Babu, J., Lamar Seibenhener, M., Peng, J., Strom, A.-L., Kemppainen, R., Cox, N., Zhu, H., Wooten, M.C., Diaz-Meco, M.T., Moscat, J. and Wooten, M.W. (2008) 'Genetic inactivation of p62 leads to accumulation of hyperphosphorylated tau and neurodegeneration', Journal of Neurochemistry, 106(1), pp. 107-120.
Rami, A., Langhagen, A. and Steiger, S. (2008) 'Focal cerebral ischemia induces upregulation of Beclin 1 and autophagy-like cell death', Neurobiology of Disease, 29(1), pp. 132-141.
Redgrave, P., Prescott, T.J. and Gurney, K. (1999) 'The basal ganglia: a vertebrate solution to the selection problem?', Neuroscience, 89(4), pp. 1009-1023.
Riley, K.P., Snowdon, D.A. and Markesbery, W.R. (2002) 'Alzheimer's neurofibrillary pathology and the spectrum of cognitive function: Findings from the Nun Study', Annals of Neurology, 51(5), pp. 567-577.
Rinne, J.O., Paljärvi, L. and Rinne, U.K. (1987) 'Neuronal size and density in the nucleus basalis of Meynert in Alzheimer's disease.', Journal of Neurological Science, 79(1-2), pp. 67-76.
Riudavets, M.A., Iacono, D., Resnick, S.M., O'Brien, R., Zonderman, A.B., Martin, L.J., Rudow, G., Pletnikova, O. and Troncoso, J.C. (2007) 'Resistance to Alzheimer's pathology is associated with nuclear hypertrophy in neurons', Neurobiology of Aging, 28(10), pp. 1484-1492.
Rodríguez, J.J., Olabarria, M. and Chvtal, A.V., A. (2009) 'Astroglia in dementia and Alzheimer's disease', Cell Death and Differentiation, 16, pp. 378-385.
Rohn, T.T., Wirawan, E., Brown, R.J., Harris, J.R., Masliah, E. and Vandenabeele, P. (2011) 'Depletion of Beclin-1 due to proteolytic cleavage by caspases in the Alzheimer's disease brain', Neurobiology of Disease, 43(1), pp. 68-78.
Román, G.C. (2002a) 'Vascular dementia may be the most common form of dementia in the elderly', Journal of the Neurological Sciences, 203–204(0), pp. 7-10.
Román, G.C. (2002b) 'Vascular dementia revisited: diagnosis, pathogenesis, treatment, and prevention.', Medical Clinics of North America, (86), pp. 477-99.
Rosoklija, G., Mancevski, B., Ilievski, B., Perera, T., Lisanby, S.H., Coplan, J.D., Duma, A., Serafimova, T. and Dwork, A.J. (2003) 'Optimization of Golgi methods for impregnation of brain tissue from humans and monkeys', Journal of Neuroscience Methods, 131(1–2), pp. 1-7.
209
Rosoklija, G., Toomayan, G., Mancevski, B., Haroutunian, V., Liu, D., Malespina, D., Hays, A.P., Sadig, S., Latov, N. and Dwork, A.J. (2005) 'Altered subicular MAP2 immunoreactivity in schizophrenia.', Prilozi., 26, pp. 13-34.
Rössler, M., Zarski, R., Bohl, J. and Ohm, T. (2002) 'Stage-dependent and sector-specific neuronal loss in hippocampus during Alzheimer's disease', Acta Neuropathologica, 103(4), pp. 363-369.
Roth, M., Tym, E., Mountjoy, C.Q., Huppert, F.A., Hendrie, H., Verma, S. and Goddard, R. (1986) 'CAMDEX. A standardised instrument for the diagnosis of mental disorder in the elderly with special reference to the early detection of dementia', The British Journal of Psychiatry, 149(6), pp. 698-709.
Rouach, N., Koulakoff, A., Abudara, V., Willecke, K. and Giaume, C. (2008) 'Astroglial Metabolic Networks Sustain Hippocampal Synaptic Transmission', Science, 322(5907), pp. 1551-1555.
Ruan, Y.W., Zou, B., Fan, Y., Li, Y., Lin, N., Zeng, Y.S., Gao, T.M., Yao, Z. and Xu, Z.C. (2006) 'Dendritic plasticity of CA1 pyramidal neurons after transient global ischemia', Neuroscience, 140(1), pp. 191-201.
Ruitenberg, A., den Heijer, T., Bakker, S.L.M., van Swieten, J.C., Koudstaal, P.J., Hofman, A. and Breteler, M.M.B. (2005) 'Cerebral hypoperfusion and clinical onset of dementia: The Rotterdam study', Annals of Neurology, 57(6), pp. 789-794.
Sá, M.J., Madeira, M.D., Ruela, C., Volk, B., Mota-Miranda, A., Lecour, H., Gonçalves, V. and Paula-Barbosa, M.M. (2000) 'AIDS does not alter the total number of neurons in the hippocampal formation but induces cell atrophy: a stereological study', Acta Neuropathologica, 99(6), pp. 643-653.
Salminen, A. and Kaarniranta, K. (2009) 'Regulation of the aging process by autophagy', Trends in Molecular Medicine, 15(5), pp. 217-224.
Salminen, A., Kaarniranta, K., Haapasalo, A., Hiltunen, M., Soininen, H. and Alafuzoff, I. (2012) 'Emerging role of p62/sequestosome-1 in the pathogenesis of Alzheimer's disease', Progress in Neurobiology, 96(1), pp. 87-95.
Sánchez-Gómez, M.V., Alberdi, E., Ibarretxe, G., Torre, I. and Matute, C. (2003) 'Caspase-Dependent and Caspase-Independent Oligodendrocyte Death Mediated by AMPA and Kainate Receptors', The Journal of Neuroscience, 23(29), pp. 9519-9528.
Scheff, S.W., Price, D.A., Schmitt, F.A., Dekosky, S.T. and Mufson, E.J. (2007) 'Synaptic alterations in CA1 in mild Alzheimer disease and mild cognitive impairment', Neurology, 68(18), pp. 1501-1508.
Scher, A.I., Xu, Y., Korf, E.S.C., Hartley, S.W., Witter, M.P., Scheltens, P., White, L.R., Thompson, P.M., Toga, A.W., Valentino, D.J. and Launer, L.J. (2011) 'Hippocampal morphometry in population-based incident Alzheimer's disease and vascular dementia: the HAAS', Journal of Neurology, Neurosurgery & Psychiatry, 82(4), pp. 373-377.
Schmidt, B., Marrone, D.F. and Markus, E.J. (2012) 'Disambiguating the similar: The dentate gyrus and pattern separation', Behavioural Brain Research, 226(1), pp. 56-65.
Schmitz, C. and Hof, P.R. (2007) Brain Ageing: Design-Based Stereology in Brain Ageing Research. Taylor & Francis Group LLC.
Schnaider Beeri, M., Haroutunian, V., Schmeidler, J., Sano, M., Fam, P., Kavanaugh, A., Barr, A.M., Honer, W.G. and Katsel, P. (2012) 'Synaptic protein deficits are associated with dementia irrespective of extreme old age', Neurobiology of Aging, 33(6), pp. 1125.e1-1125.e8.
Schönheit, B., Zarski, R. and Ohm, T.G. (2004) 'Spatial and temporal relationships between plaques and tangles in Alzheimer-pathology', Neurobiology of Aging, 25(6), pp. 697-711.
Schousboe, A., Sickmann, H., Walls, A., Bak, L. and Waagepetersen, H. (2010) 'Functional Importance of the Astrocytic Glycogen-Shunt and Glycolysis for Maintenance of an Intact Intra/Extracellular Glutamate Gradient', Neurotoxicity Research, 18(1), pp. 94-99.
Schummers, J., Yu, H. and Sur, M. (2008) 'Tuned Responses of Astrocytes and Their Influence on Hemodynamic Signals in the Visual Cortex', Science, 320(5883), pp. 1638-1643.
210
Schwab, C., Bondada, V., Sparks, D.L., Cahan, L.D. and Geddes, J.W. (1994) 'Postmortem changes in the levels and localization of microtubule-associated proteins (tau, MAP2 and MAP1B) in the rat and human hippocampus', Hippocampus, 4(2), pp. 210-225.
Scott, I. and Lowe, J. (2007) 'The ubiquitin-binding protein p62 identifies argyrophilic grain pathology with greater sensitivity than conventional silver stains', Acta Neuropathologica, 113(4), pp. 417-420.
Scoville, W.B. and Milner, B. (2000) 'Loss of Recent Memory After Bilateral Hippocampal Lesions', The Journal of Neuropsychiatry & Clinical Neurosciences, 12, pp. 103-113.
Selemon, L.D. and Goldman-Rakic, P.S. (1999) 'The reduced neuropil hypothesis: a circuit based model of schizophrenia', Biological Psychiatry, 45(1), pp. 17-25.
Selkoe, D.J. (2002) 'Alzheimer's Disease Is a Synaptic Failure', Science, 298(5594), pp. 789-791. Shinohara, Y., Hosoya, A., Yahagi, K., Ferecskó, A.S., Yaguchi, K., Sík, A., Itakura, M., Takahashi,
M. and Hirase, H. (2012) 'Hippocampal CA3 and CA2 have distinct bilateral innervation patterns to CA1 in rodents', European Journal of Neuroscience, 35(5), pp. 702-710.
Siew, L.K., Love, S., Dawbarn, D., Wilcock, G.K. and Allen, S.J. (2004) 'Measurement of pre- and post-synaptic proteins in cerebral cortex: effects of post-mortem delay', Journal of Neuroscience Methods, 139(2), pp. 153-159.
Simons, M. and Trajkovic, K. (2006) 'Neuron-glia communication in the control of oligodendrocyte function and myelin biogenesis', Journal of Cell Science, 119, pp. 4381-4389. Smallwood, A., Oulhaj, A., Joachim, C., Christie, S., Sloan, C., Smith, A.D. and Esiri, M. (2012)
'Cerebral subcortical small vessel disease and its relation to cognition in elderly subjects: a pathological study in the Oxford Project to Investigate Memory and Ageing (OPTIMA) cohort', Neuropathology and Applied Neurobiology, 38(4), pp. 337-343.
Smith, D.E., Roberts, J., Gage, F.H. and Tuszynski, M.H. (1999) 'Age-associated neuronal atrophy occurs in the primate brain and is reversible by growth factor gene therapy', Proc. Natl. Acad. Sci. USA, 96, pp. 10893-10898.
Snowdon, D.A., Greiner, L.H., Mortimer, J.A., Riley, K.P., Greiner, P.A. and Markesbery, W.R. (1997) 'Brain Infarction and the Clinical Expression of Alzheimer Disease: The Nun Study', JAMA, 277(10), pp. 813-817.
Sofroniew, M. and Vinters, H. (2010) 'Astrocytes: biology and pathology', Acta Neuropathologica, 119(1), pp. 7-35.
Sofroniew, M.V. (2009) 'Molecular dissection of reactive astrogliosis and glial scar formation', Trends in Neurosciences, 32(12), pp. 638-647.
Sojkova, J., Beason-Held, L., Zhou, Y., An, Y., Kraut, M.A., Ye, W., Ferrucci, L., Mathis, C.A., Klunk, W.E., Wong, D.F. and Resnick, S.M. (2008) 'Longitudinal Cerebral Blood Flow and Amyloid Deposition: An Emerging Pattern?', Journal of Nuclear Medicine, 49(9), pp. 1465-1471.
Soontornniyomkij, V., Risbrough, V.B., Young, J.W., Soontornniyomkij, B., Jeste, D.V. and Achim, C.L. (2012) 'Increased hippocampal accumulation of autophagosomes predicts short-term recognition memory impairment in aged mice', Age (Dordr), 34(2), pp. 305-316.
Špaček, J. (1989) 'Dynamics of the Golgi method: a time-lapse study of the early stages of impregnation in single sections', Journal of Neurocytology, 18(1), pp. 27-38.
Spires, T.L., Meyer-Luehmann, M., Stern, E.A., McLean, P.J., Skoch, J., Nguyen, P.T., Bacskai, B.J. and Hyman, B.T. (2005) 'Dendritic Spine Abnormalities in Amyloid Precursor Protein Transgenic Mice Demonstrated by Gene Transfer and Intravital Multiphoton Microscopy', The Journal of Neuroscience, 25(31), pp. 7278-7287.
Spronsen, M. and Hoogenraad, C.C. (2010) 'Synapse Pathology in Psychiatric and Neurologic Disease', Current Neurology and Neuroscience Reports, 10(3), pp. 207-214.
Spruston, N. (2008) 'Pyramidal Neurons: dendritic structure and synaptic integration', Nature Reviews Neuroscience, 9, pp. 206-221.
211
Staffend, N.A. and Meisel, R.L. (2001) 'DiOlistic Labeling in Fixed Brain Slices: Phenotype, Morphology, and Dendritic Spines', in Current Protocols in Neuroscience. John Wiley & Sons, Inc.
Stebbins, G.T. and Murphy, C.M. (2009) 'Diffusion tensor imaging in Alzheimer's disease and mild cognitive impairment', Behavioural Neurology, 21(1), pp. 39-49.
Sterio, D.C. (1984) 'The unbiased estimation of number and sizes of arbitrary particles using the disector', Journal of Microscopy, 134(2), pp. 127-136.
Stone, B.S., Zhang, J., Mack, D.W., Mori, S., Martin, L.J. and Northington, F.J. (2008) 'Delayed neural network degeneration after neonatal hypoxia-ischemia', Annals of Neurology, 64(5), pp. 535-546.
Stroke Statistics 2009 (2009). Foundation, B.H. [Online]. Available at: http://www.bhf.org.uk/publications/view-publication.aspx?ps=1001548.
Sultana, R., Banks, W.A. and Butterfield, D.A. (2010) 'Decreased levels of PSD95 and two associated proteins and increased levels of BCl2 and caspase 3 in hippocampus from subjects with amnestic mild cognitive impairment: Insights into their potential roles for loss of synapses and memory, accumulation of Aβ, and neurodegeneration in a prodromal stage of Alzheimer's disease', Journal of Neuroscience Research, 88(3), pp. 469-477.
Swaab, D.F., Hofman, M.A., Lucassen, P.J., Salehi, A. and Uylings, H.B.M. (1994) 'Neuronal atrophy, not cell death, is the main hallmark of Alzheimer's disease', Neurobiology of Aging, 15(3), pp. 369-371.
Swanson, L.W. (1982) 'Normal Hippocampal Circuitry', Neuroscience Research Progress Bulletin, 20, pp. 624-637.
Tamminga, C.A. (2005) 'The Hippocampus ', American Journal of Psychiatry, 162, p. 1 [Online]. Available at: http://ajp.psychiatryonline.org/cgi/reprint/162/1/25.pdf.
Tanaka, H., Araki, M. and Masuzawa, T. (1992) 'Reaction of astrocytes in the gerbil hippocampus following transient ischemia: Immunohistochemical observations with antibodies against glial fibrillary acidic protein, glutamine synthetase, and S-100 protein', Experimental Neurology, 116(3), pp. 264-274.
Terry, R.D., DeTeresa, R. and Hansen, L.A. (1987) 'Neocortical cell counts in normal human adult aging', Annals of Neurology, 21(6), pp. 530-9.
Terry, R.D., Masliah, E., Salmon, D.P., Butters, N., DeTeresa, R., Hill, R., Hansen, L.A. and Katzman, R. (1991) 'Physical basis of cognitive alterations in Alzheimer's disease: synapse loss is the major correlate of cognitive impairment', Annals of neurology, 30(4), pp. 572-580.
Thal, D.R., Capetillo-Zarate, E., Del Tredici, K. and Braak, H. (2006) 'The Development of Amyloid beta Protein Deposits in the Aged Brain', Sci. Aging Knowl. Environ., 2006(6), pp. re1-.
Thal, D.R., Holzer, M., Rüb, U., Waldmann, G., Günzel, S., Zedlick, D. and Schober, R. (2000) 'Alzheimer-Related τ-Pathology in the Perforant Path Target Zone and in the Hippocampal Stratum Oriens and Radiatum Correlates with Onset and Degree of Dementia', Experimental Neurology, 163(1), pp. 98-110.
Thal, D.R., Rüb, U. and H., B. (2002) 'Phases of A beta-deposition in the human brain and its relevance for the development of AD.', Neurology, 58(12), pp. 1791-800.
Thomas, V.P. (1998) 'What's wrong with Bonferroni adjustments', BMJ, 316(7139), pp. 1236-1238.
Toledo, J.B., Arnold, S.E., Raible, K., Brettschneider, J., Xie, S.X., Grossman, M., Monsell, S.E., Kukull, W.A. and Trojanowski, J.Q. (2013) 'Contribution of cerebrovascular disease in autopsy confirmed neurodegenerative disease cases in the National Alzheimer’s Coordinating Centre', Brain, 136(9), pp. 2697-2706.
Tomlinson, B.E., Blessed, G. and Roth, M. (1970) 'Observations on the brains of demented old people', Journal of the Neurological Sciences, 11(3), pp. 205-242.
Tremblay, M.E., Lowery, R.L. and Majewska, A.K. (2010) 'Microglial Interactions with Synapses Are Modulated by Visual Experience', PLOS Biology, 8.
212
Tsai, J., Grutzendler, J., Duff, K. and Gan, W. (2004) 'Fibrillar amyloid deposition leads to local synaptic abnormalities and breakage of neuronal branches', Nature Neuroscience, 7(1181-1183).
Tullberg, M., Fletcher, E., DeCarli, C., Mungas, M., Reed, B.R., Harvey, D.J., Weiner, M., Chui, H.C. and Jagust, W.J. (2004) 'White matter lesions impair frontal lobe function regardless of their location', Neurology, 63(2), pp. 246-253.
Tulving, E. and Markowitsch, H.J. (1998) 'Episodic and declarative memory: role of the hippocampus.', Hippocampus, 8(3), pp. 198-204.
Uh, J., Lewis-Amezcua, K., Martin-Cook, K., Cheng, Y., Weiner, M., Diaz-Arrastia, R., Devous, M., Shen, D. and Lu, H. (2010) 'Cerebral blood volume in Alzheimer's disease and correlation with tissue structural integrity', Neurobiology of Aging, 31(12), pp. 2038-2046.
Ukraintseva, S., Sloan, F., Arbeev, K. and Yashin, A. (2006) 'Increasing Rates of Dementia at Time of Declining Mortality From Stroke', Stroke, 37(5), pp. 1155-1159.
van Norden, A.G.W., de Laat, K.F., Fick, I., van Uden, I.W.M., van Oudheusden, L.J.B., Gons, R.A.R., Norris, D.G., Zwiers, M.P., Kessels, R.P.C. and de Leeuw, F.-E. (2012) 'Diffusion tensor imaging of the hippocampus and verbal memory performance: The RUN DMC Study', Human Brain Mapping, 33(3), pp. 542-551.
van Strien, N.M., Cappaert, N.L.M. and Witter, M.P. (2009) 'The anatomy of memory: an interactive overview of the parahippocampal-hippocampal network', Nat Rev Neurosci, 10(4), pp. 272-282.
VanGuilder, H.D., Farley, J.A., Yan, H., Van Kirk, C.A., Mitschelen, M., Sonntag, W.E. and Freeman, W.M. (2011) 'Hippocampal dysregulation of synaptic plasticity-associated proteins with age-related cognitive decline', Neurobiology of Disease, 43(1), pp. 201-212.
Vega, E., De Jésus Gómez-Villalobos, M. and Flores, G. (2004) 'Alteration in dendritic morphology of pyramidal neurons from the prefrontal cortex of rats with renovascular hypertension', Brain Research, 1021(1), pp. 112-118.
Vicente, É., Degerone, D., Bohn, L., Scornavaca, F., Pimentel, A., Leite, M.C., Swarowsky, A., Rodrigues, L., Nardin, P., Vieira de Almeida, L.M., Gottfried, C., Souza, D.O., Netto, C.A. and Gonçalves, C.A. (2009) 'Astroglial and cognitive effects of chronic cerebral hypoperfusion in the rat', Brain Research, 1251(0), pp. 204-212.
Vinet, J., van Weering, H., Heinrich, A., Kalin, R., Wegner, A., Brouwer, N., Heppner, F., van Rooijen, N., Boddeke, H. and Biber, K. (2012) 'Neuroprotective function for ramified microglia in hippocampal excitotoxicity', Journal of Neuroinflammation, 9(1), p. 27.
Walsh, D.M. and Selkoe, D.J. (2007) 'Aβ Oligomers – a decade of discovery', Journal of Neurochemistry, 101(5), pp. 1172-1184.
Wang, L., Swank, J.S., Glick, I.E., Gado, M.H., Miller, M.I., Morris, J.C. and Csernansky, J.G. (2003) 'Changes in hippocampal volume and shape across time distinguish dementia of the Alzheimer type from healthy aging', NeuroImage, 20(2), pp. 667-682.
Wang, Q.J., Ding, Y., Kohtz, S., Mizushima, N., Cristea, I.M., Rout, M.P., Chait, B.T., Zhong, Y., Heintz, N. and Yue, Z. (2006) 'Induction of Autophagy in Axonal Dystrophy and Degeneration', The Journal of Neuroscience, 26(31), pp. 8057-8068.
Wang, X., Xing, A., Xu, C., Cai, Q., Liu, H. and Li, L. (2010) 'Cerebrovascular hypoperfusion induces spatial memory impairment, synaptic changes, and amyloid-β oligomerization in rats', Journal of Alzheimer's disease : JAD, 21(3), pp. 813-822.
Wardlaw, J.M. (2008) 'What Is a Lacune?', Stroke, 39(11), pp. 2921-2922. Wardlaw, J.M., Sandercock, P.A.G., Dennis, M.S. and Starr, J. (2003) 'Is Breakdown of the
Blood-Brain Barrier Responsible for Lacunar Stroke, Leukoaraiosis, and Dementia?', Stroke, 34(3), pp. 806-812.
Wardlaw, J.M., Smith, C. and Dichgans, M. (2013) 'Mechanisms of sporadic cerebral small vessel disease: insights from neuroimaging', The Lancet Neurology, 12(5), pp. 483-497.
Weller, R., Djuanda, E., Yow, H.-Y. and Carare, R. (2009) 'Lymphatic drainage of the brain and the pathophysiology of neurological disease', Acta Neuropathologica, 117(1), pp. 1-14.
213
West, M.J. (1999) 'Stereological methods for estimating the total number of neurons and synapses: issues of precision and bias', Trends in Neurosciences, 22(2), pp. 51-61.
West, M.J., Coleman, P.D., Flood, D.G. and Troncoso, J.C. (1994) 'Differences in the pattern of hippocampal neuronal loss in normal ageing and Alzheimer's disease', The Lancet, 344(8925), pp. 769-772.
West, M.J. and Slomanka, L. (2001) '2-D versus 3-D cell counting – a debate ', Trends in Neurosciences, 24(7), p. 374.
Wetterling, T., Kanitz, R.-D. and Borgis, K.-J. (1996) 'Comparison of Different Diagnostic Criteria for Vascular Dementia (ADDTC, DSM-IV, ICD-10, NINDS-AIREN)', Stroke, 27(1), pp. 30-36.
Wharton, S.B., Brayne, C., Savva, G.M., Matthews, F.E., Forster, G., Simpson, J., Lace, G. and Ince, P.G. (2011) 'Epidemiological Neuropathology: The MRC Cognitive Function and Aging Study Experience', Journal of Alzheimer's Disease, 25(2), pp. 359-372.
Xu, F., Gu, J.-H. and Qin, Z.-H. (2012) 'Neuronal autophagy in cerebral ischemia', Neuroscience Bulletin, 28(5), pp. 658-666.
Yamamoto, Y., Ihara, M., Tham, C., Low, R.W.C., Slade, J.Y., Moss, T., Oakley, A.E., Polvikoski, T. and Kalaria, R.N. (2009) 'Neuropathological Correlates of Temporal Pole White Matter Hyperintensities in CADASIL', Stroke, 40(6), pp. 2004-2011.
Yan, B.C., Park, J.H., Ahn, J.H., Lee, J.-C., Won, M.-H. and Kang, I.-J. (2013) 'Postsynaptic density protein (PSD)-95 expression is markedly decreased in the hippocampal CA1 region after experimental ischemia–reperfusion injury', Journal of the Neurological Sciences, 330(1–2), pp. 111-116.
Yanagihara, T., Brengman, J.M. and Mushynski, W.E. (1990) 'Differential vulnerability of microtubule components in cerebral ischemia', Acta Neuropathologica, 80(5), pp. 499-505.
Yeh, C.-Y., Vadhwana, B., Verkhratsky, A. and Rodríguez, J.J. (2011) 'Early astrocytic atrophy in the entorhinal cortex of a triple transgenic animal model of Alzheimer's disease', ASN Neuro, 3(5), p. e00071.
Yoshimi, K., Takeda, M., Nishimura, T., Kudo, T., Nakamura, Y., Tada, K. and Iwata, N. (1991) 'An immunohistochemical study of MAP2 and clathrin in gerbil hippocampus after cerebral ischemia', Brain Research, 560(1–2), pp. 149-158.
Yu, W.H., Cuervo, A.M., Kumar, A., Peterhoff, C.M., Schmidt, S.D., Lee, J.-H., Mohan, P.S., Mercken, M., Farmery, M.R., Tjernberg, L.O., Jiang, Y., Duff, K., Uchiyama, Y., Näslund, J., Mathews, P.M., Cataldo, A.M. and Nixon, R.A. (2005) 'Macroautophagy—a novel β-amyloid peptide-generating pathway activated in Alzheimer's disease', The Journal of Cell Biology, 171(1), pp. 87-98.
Zarow, C., Sitzer, T. and Chui, H. (2008) 'Understanding hippocampal sclerosis in the elderly: Epidemiology, characterization, and diagnostic issues', Current Neurology and Neuroscience Reports, 8(5), pp. 363-370.
Zarow, C., Vinters, H.V., Ellis, W.G., Weiner, M.W., Mungas, D., White, L. and Chui, H.C. (2005) 'Correlates of hippocampal neuron number in Alzheimer's disease and ischemic vascular dementia', Annals of Neurology, 57(6), pp. 896-903.
Zekry, D., Duyckaerts, C., Moulias, R., Belmin, J., Geoffre, C., Herrmann, F.R. and Hauw, J. (2002) 'Degenerative and vascular lesions of the brain have synergistic effects in dementia of the elderly', Acta Neuropathologica, 103, pp. 418-487.
Zhang, S., Boyd, J., Delaney, K. and Murphy, T.H. (2005) 'Rapid Reversible Changes in Dendritic Spine Structure In Vivo Gated by the Degree of Ischemia', The Journal of Neuroscience, 25(22), pp. 5333-5338.
Zhang, Z.G., Bower, L., Zhang, R.L., Chen, S., Windham, J.P. and Chopp, M. (1999) 'Three-dimensional measurement of cerebral microvascular plasma perfusion, glial fibrillary acidic protein and microtubule associated protein-2 immunoreactivity after embolic stroke in rats: a double fluorescent labeled laser-scanning confocal microscopic study', Brain Research, 844(1–2), pp. 55-66.

214
Zhu, C.-Q., Wang, X., Xu, F., Bahr, B.A., Shibata, M., Uchiyama, Y., Hagberg, H. and Blomgren, K. (2005) 'The influence of age on apoptotic and other mechanisms of cell death after cerebral hypoxia–ischemia', Cell Death and Differentiation, 12, pp. 162-176.
Zlokovic, B.V. (2011) 'Neurovascular pathways to neurodegeneration in Alzheimer's disease and other disorders', Nature Reviews Neuroscience, 12, pp. 723-738.


![VPS35 regulates developing mouse hippocampal neuronal ... · postnatal day 10 (P10)] (Fig. 1A). The expression appeared to be peaked at the neonatal stage (P10–P15) of the hippocampus](https://img.pdfslide.net/doc/110x75/5d67223488c993a9318b4652/vps35-regulates-developing-mouse-hippocampal-neuronal-postnatal-day-10-p10.jpg)